Abstract
Introduction:
Childhood development represents a sequence of changes in behavior and underlying processes, influenced by biological and environmental factors. Screening and monitoring of neurodevelopment show effective procedures for early identification of different disorders of childhood development.
Objective:
To analyze the neurodevelopment, using the Denver Developmental Screening Test II, of children enrolled in preschools of Administrative Districts in Belém and to map the districts and the percentage of development evaluated as normal and suspected delay.
Methods:
This was a cross-sectional and exploratory descriptive study. A questionnaire was administered to parents to collect the personal, contextual and family data and an instrument to measure the level of family poverty.
Results:
Of the 319 children assessed, 77.7% showed a suspected delay in neuropsychomotor developmental and 59.2% in language. The family poverty level variable showed a statistically significant association with the overall level of development (p = .011) and of language (p = .003).
Conclusion:
It is hoped that this study will contribute to generate an impact in improving the ecological conditions of children and their families, reducing the risks to which they are exposed.
Keywords:
Child; Childhood Development; Poverty
Resumo
Introdução
O desenvolvimento infantil é uma sequência de mudanças no comportamento e processos subjacentes, influenciado por fatores biológicos e ambientais. A triagem desenvolvimento têm se mostrado um procedimento eficiente para identificar precocemente desvios desenvolvimentais.
Objetivo:
Analisar o perfil do neurodesenvolvimento, segundo o Teste de Triagem do Desenvolvimento Denver II, de crianças de pré-escolas dos Distritos Administrativos de Belém e mapear os distritos e os percentuais de desenvolvimento avaliado como "normal" e "suspeita de atraso".
Métodos:
Estudo transversal e de caráter descritivo exploratório. Foi aplicado com os pais das crianças um questionário para coletar os dados pessoais, contextuais e familiares, e instrumento para medição do nível de pobreza familiar.
Resultados:
Das 319 crianças avaliadas, a prevalência de suspeita de atraso no desenvolvimento chegou a 77,7% e da área da linguagem foi de 59,2%. A variável denominada Nível de Pobreza Familiar apresentou associação estatisticamente significativa com o nível de desenvolvimento global (p = 0,011) e da linguagem (p = 0,003).
Conclusão:
Espera-se que esta pesquisa possa contribuir para gerar repercussões sobre a melhoria das condições de saúde das crianças e suas famílias, reduzindo os fatores de riscos aos quais elas estão expostas.
Palavras-chave:
Criança; Desenvolvimento Infantil; Pobreza
Introduction
In recent decades studies have aimed to investigate the impact of multiple risk factors on childhood development, with poverty being among the most discussed and investigated 1Evans, GW; Li, D; Whipple, SS. Cumulative risk and child development. Psychol Bull. 2013;139:1342-96.,2Fotso, JC; Madise, N; Baschieri, A; Cleland, J; Zulu, E; Mutua ,MK; et al. Child growth in urban deprived settings: Does household poverty status matter? At which stage of child development? Health Place. 2012;18(2):375-84.,3Roelen, K; Gassmann, F; Neubourg, C. Child poverty in Vietnam - Providing insights using a country-specific and multidimensional model. Soc Indic Res. 2010;98(1):129-45.. The findings suggest that the delay in neuropsychomotor development (NPMD) occurs with greater frequency and severity when children live in extreme poverty and for a longer period of life 4Wehby, GL; McCarthy, AM. Economic gradients in early child neurodevelopment: A multi-country study. Soc Sci Med. 2013;78:86-95..
The first experiences of children exposed to the deleterious effects of poverty can affect the overall health, not only in childhood but also in adulthood 5Walker, SP; Wachs, TD; Gardner, JM; Lozoff, B; Wasserman, GA; Pollit, TE; et al. Child Development: risk factors for adverse outcomes in developing countries. Lancet. 2007;369:145-57.. Thus, growing up in impoverished environments can trigger serious implications in the different dimensions of development 3Roelen, K; Gassmann, F; Neubourg, C. Child poverty in Vietnam - Providing insights using a country-specific and multidimensional model. Soc Indic Res. 2010;98(1):129-45.,6Alkire, S; Foster, J. Counting and multidimensional poverty measurement. J Public Econ. 2011;95:476-87.,7Huston, AC; Bentley, AC. Human development in societal context. Annu Rev Clin Psychol. 2010;61:411-37., such as in cognition, motor skills, social interaction and language.
There is evidence that poor children are more exposed to biological and genetic risk factors, such as nutritional disorders (2, 8), infant mortality, prematurity and low birth weight 9Halpern, R; Barros, AJD; Matijasevich, A; Santos, IS; Victora, CG; Barros, FC. Developmental status at age 12 months according to birth weight and family income: a comparison of two Brazilian birth cohorts. Cad Saude Publica. 2008;24:444-50., neurological, psycho-emotional and behavioral changes 10Dearing, E. Psychological Costs of Growing Up Poor. Ann N Y Acad Sci. 2008;1136:324-32., family factors, such as an unsafe and non-stimulating environment, dysfunctional family, low socioeconomic status (9,11, 12), poor access to health and education, and community factors that influence both the environment of the child and that of his/her family 5Walker, SP; Wachs, TD; Gardner, JM; Lozoff, B; Wasserman, GA; Pollit, TE; et al. Child Development: risk factors for adverse outcomes in developing countries. Lancet. 2007;369:145-57.,7Huston, AC; Bentley, AC. Human development in societal context. Annu Rev Clin Psychol. 2010;61:411-37.. A possible explanation for this is that the poorer the child is, the fewer opportunities there are to satisfy the basic childhood necessities.
Thus, the study of poverty and its implications for human development is a complex task. There are contradictions in the very concept of this term, as well as in the different methods for its measurement 2Fotso, JC; Madise, N; Baschieri, A; Cleland, J; Zulu, E; Mutua ,MK; et al. Child growth in urban deprived settings: Does household poverty status matter? At which stage of child development? Health Place. 2012;18(2):375-84.,3Roelen, K; Gassmann, F; Neubourg, C. Child poverty in Vietnam - Providing insights using a country-specific and multidimensional model. Soc Indic Res. 2010;98(1):129-45.,13Yazbek, MC. Pobreza no Brasil contemporâneo e formas de seu enfrentamento. Serv Soc Soc. 2012;110:288-322. Portuguese.. For a long time poverty was considered to be a condition defined by income below a pre-established level 2Fotso, JC; Madise, N; Baschieri, A; Cleland, J; Zulu, E; Mutua ,MK; et al. Child growth in urban deprived settings: Does household poverty status matter? At which stage of child development? Health Place. 2012;18(2):375-84.. This variable continues to be a widely used indicator. However, in recent years, poverty has been seen as a multidimensional phenomenon, with a more dynamic and structural concept 6Alkire, S; Foster, J. Counting and multidimensional poverty measurement. J Public Econ. 2011;95:476-87.. Thus, poverty involves not only economic aspects, but also other dimensions, such as political, social, cultural, quality of life and well-being 13Yazbek, MC. Pobreza no Brasil contemporâneo e formas de seu enfrentamento. Serv Soc Soc. 2012;110:288-322. Portuguese..
As a result, poverty must be analyzed from the reality of each country, considering its historical, cultural and contextual characteristics 4Wehby, GL; McCarthy, AM. Economic gradients in early child neurodevelopment: A multi-country study. Soc Sci Med. 2013;78:86-95.,13Yazbek, MC. Pobreza no Brasil contemporâneo e formas de seu enfrentamento. Serv Soc Soc. 2012;110:288-322. Portuguese.. In Brazil, the disparate socioeconomic inequality present in the society causes the levels of poverty and the number of children developing in this critical condition to vary according to regions. The North and Northeast of Brazil, for example, stand out as having the highest incidence of poverty and a higher rate of children aged under six years living in this situation 14IBGE - Instituto Brasileiro de Geografia e Estatística. Censo demográfico 2010. Rio de Janeiro: IBGE; 2011. Portuguese.,15IPEA - Instituto de Pesquisa Econômica Aplicada. Duas décadas de desigualdade e pobreza no Brasil medidas pela Pnad/IBGE. Comunicados do IPEA. 2013{cited2014 Aug 20}. Available from: Available from: http://tinyurl.com/jmajojz
. Portuguese.
http://tinyurl.com/jmajojz...
. Specifically, the state capitals Belém, Fortaleza, Recife and Salvador have the highest rates of poor people and poor children.
According to the IPEA report 15IPEA - Instituto de Pesquisa Econômica Aplicada. Duas décadas de desigualdade e pobreza no Brasil medidas pela Pnad/IBGE. Comunicados do IPEA. 2013{cited2014 Aug 20}. Available from: Available from: http://tinyurl.com/jmajojz
. Portuguese.
http://tinyurl.com/jmajojz...
, Brazil achieved the extreme poverty reduction targets, mainly with the aid of income distribution programs. However, the Amazon region follows this trend slowly and is below the national average 16Celentano, D; Santos, D; Veríssimo, A. A Amazônia e os objetivos do milênio. Belém (Brazil): Imazon; 2010. Portuguese.. The Metropolitan Area of Belém (MAB) can be characterized as extensively precarious, with acute shortages of urban infrastructure and services, organized around delimited and spatially compact centers 17Ponto, JPX; Lima, JJF; Cardoso, ACD; Rodrigues, RM. Análise do IBEU Local - Região Metropolitana de Belém-PA. Observatório das Metrópoles 2013 {cited2014 Aug 20}. Available from: Available from: http://tinyurl.com/jb342ws
. Portuguese.
http://tinyurl.com/jb342ws...
. These aspects are associated with the high rates of poverty and socioeconomic conditions of the inhabitants 17Ponto, JPX; Lima, JJF; Cardoso, ACD; Rodrigues, RM. Análise do IBEU Local - Região Metropolitana de Belém-PA. Observatório das Metrópoles 2013 {cited2014 Aug 20}. Available from: Available from: http://tinyurl.com/jb342ws
. Portuguese.
http://tinyurl.com/jb342ws...
.
Another aspect highlighted in the current literature on poverty measurement is that many researches consider poor people to be grouped in a broad socioeconomic category, not taking into account the different levels of poverty and the potential concentration of risk factors associated with each of them 6Alkire, S; Foster, J. Counting and multidimensional poverty measurement. J Public Econ. 2011;95:476-87.,8Issler, RMS; Giugliani, ERJ. Identificação de grupos mais vulneráveis à desnutrição infantil pela medição do nível de pobreza. J Pediatr. 1997;73:101-5. Portuguese.,18Paiva, GS; Lima, ACVMS; Lima, MC; Eickmann, SH. The effect of poverty on developmental screening scores among infants. Sao Paulo Med J. 2010;128(5):276-83.. In addition, it is assumed that urban poverty in particular affects the ecology of the development of the child, including its extrafamilial dimension (kindergartens, schools, neighborhood), and therefore its measurement has been a concern for researchers from different areas 7Huston, AC; Bentley, AC. Human development in societal context. Annu Rev Clin Psychol. 2010;61:411-37.,19Guerreiro, TBF. Desenvolvimento neuropsicomotor de crianças de Belém: associação com características pessoais e variáveis do seu ambiente ecológico. {master's thesis}. Belém (Brazil): Universidade Federal do Pará; 2013. Portuguese.,20Tudge, JRH. Children s development under conditions of poverty: A cultural ecological analysis. In: Bastos, A; Rabinovich, EP (Orgs.). Living in poverty: Developmental poetics of cultural realities. Charlotte (NC): Information Age Pub; 2009. p. 309-20..
In ecological terms, urban poverty assumes the contours of the context in which the phenomenon is manifested 21Soares, AMC. Cidade Revelada: pobreza urbana em Salvador-BA. Geografias. 2009;5:83-96. Portuguese., assuming significant variations from one neighborhood or area to another. Therefore, to measure it and verify its various levels of manifestation can help comprehend the degree of effect that this phenomenon has on childhood development in a particular city or district. The importance should be highlighted of evaluating NPMD and verifying how much it is associated with descriptive variables of the poverty level of a given population, in a specific context 8Issler, RMS; Giugliani, ERJ. Identificação de grupos mais vulneráveis à desnutrição infantil pela medição do nível de pobreza. J Pediatr. 1997;73:101-5. Portuguese.,9Halpern, R; Barros, AJD; Matijasevich, A; Santos, IS; Victora, CG; Barros, FC. Developmental status at age 12 months according to birth weight and family income: a comparison of two Brazilian birth cohorts. Cad Saude Publica. 2008;24:444-50.,10Dearing, E. Psychological Costs of Growing Up Poor. Ann N Y Acad Sci. 2008;1136:324-32.,11Brito, CML; Vieira, GO; Costa, COM; Oliveira, NF. Desenvolvimento neuropsicomotor: o teste de Denver na triagem dos atrasos cognitivos e neuromotores de pré-escolares. Cad Saude Publica. 2011;27:1403-14. Portuguese.,12Chiu, SH; DiMarco, MA. A Pilot Study Comparing Two Developmental Screening Tools for Use With Homeless Children. J Pediatr Health Care. 2010;24:73-80.,13Yazbek, MC. Pobreza no Brasil contemporâneo e formas de seu enfrentamento. Serv Soc Soc. 2012;110:288-322. Portuguese.,14IBGE - Instituto Brasileiro de Geografia e Estatística. Censo demográfico 2010. Rio de Janeiro: IBGE; 2011. Portuguese.,15IPEA - Instituto de Pesquisa Econômica Aplicada. Duas décadas de desigualdade e pobreza no Brasil medidas pela Pnad/IBGE. Comunicados do IPEA. 2013{cited2014 Aug 20}. Available from: Available from: http://tinyurl.com/jmajojz
. Portuguese.
http://tinyurl.com/jmajojz...
,16Celentano, D; Santos, D; Veríssimo, A. A Amazônia e os objetivos do milênio. Belém (Brazil): Imazon; 2010. Portuguese.,17Ponto, JPX; Lima, JJF; Cardoso, ACD; Rodrigues, RM. Análise do IBEU Local - Região Metropolitana de Belém-PA. Observatório das Metrópoles 2013 {cited2014 Aug 20}. Available from: Available from: http://tinyurl.com/jb342ws
. Portuguese.
http://tinyurl.com/jb342ws...
,18Paiva, GS; Lima, ACVMS; Lima, MC; Eickmann, SH. The effect of poverty on developmental screening scores among infants. Sao Paulo Med J. 2010;128(5):276-83..
From this perspective, Sigolo and Aiello 22Sigolo, ARL; Aiello, ALR. Análise de instrumentos para triagem do desenvolvimento infantil. Paideia(Ribeirão Preto). 2011;21:51-60. Portuguese. emphasize the importance of using instruments that can evaluate NPMD and identify suspected delays in populations, especially when considering the significant number of children in early childhood exposed to risk factors for development 23United Nations Children's Fund. The State of the World's Children 2014 In Numbers: Every Child Counts. Nova York: UNICEF; 2014.. In addition to encompassing the broader aspects of neurodevelopment, Bricker, Squires and Clifford 24Bricker, D; Squires, J; Clifford, J. Developmental screening measures: Stretching the use of the ASQ for other assessment purposes. Infants Young Child. 2010;23:14-22. reported that evaluative tools must have an appropriate relationship between brevity (rapid application) and precision (satisfactory psychometric properties) as a characteristic. Many of these instruments have emerged in the last twenty years, with the Denver Developmental Screening Test II - Denver II standing out among them.
It should be noted that the Denver II is a screening test and is not presented as a definitive predictor instrument for adaptive or intellectual abilities, therefore, evaluators should take care not to use it to create labels or diagnoses. To be valid, the test should be applied in a standardized manner and with the exact materials 25Souza, SC; Leone, C; Takano, OK; Moratelli, HB. Desenvolvimento de pré-escolares na educação infantil em Cuiabá, Mato Grosso, Brasil. Cad Saude Publica. 2008;24:1917-26. Portuguese.. It is considered that the Denver II is designed to reflect the development from a vast expanse of heterogeneous skills. Thus, the application allows the identification, from the performance of children in the tasks, of whether they act according to their age or not.
Accordingly, the need to study the effects of poverty on neurodevelopment from an ecological dimension can be perceived, especially with epidemiological studies or large samples and using methods of evaluation through tests or scales, such as the Denver Developmental Screening Test II. The aim of this study was to analyze the neurodevelopmental profile, according to the Denver II, of children enrolled in preschools of Administrative Districts in Belém and to map the districts and the percentage of development evaluated as normal and suspected delay.
Methods
The study included 319 children of both genders, with 55.8% (178) being male and 44.2% (141) female. The children attended the Early Childhood Education Units (ECEUs) located in the administrative districts of Belém, in the period from August to December 2012, and their ages ranged from 36 to 48 months. Children that presented disturbances that could affect the expression of speech, sensory, auditory and/or visual disorders, central nervous system impairment sequelae or any other type of pathology were excluded.
For the sample size calculation, the sampling by conglomerate process was used. The margin of error of the sample size calculation was 5% and the confidence level 95%. The ECEUs involved in the study were distributed according to the total number in each district, and according to the number of children in the age group studied. Thus, the study included 19 ECEUs that were selected from a universe of 35, distributed throughout the city.
To evaluate the neuropsychomotor development the Denver II 26Frankenburg, WK; Dodds, J; Archer, P; Shapiro, H; Bresnick, B. The Denver II: a major revision and restandardization of the Denver Developmental Screening Test. Pediatrics. 1992;89(1):91-7. was used, which covers the ages of zero to six. The test protocol consists of 125 tasks, divided into four areas: personal-social, fine motor-adaptive, gross motor and language skills. The test administration was carried out based on the observation of the examiner regarding the child, although some items could be scored from the statements of the parents or caregivers.
Regarding the interpretation of the test, the individual items were analyzed first and the entire test analyzed last. The individual items are interpreted as "passed", "failed", "no opportunity" and "refusal". The final interpretation of the test presents the indicators: a) Normal: when there is no "delay" or, at most, one "care/caution" in one area; b) Questionable: when there are two or more "caution" and/or one "delay" in at least one area, which indicates that the child has suspected developmental alteration; c) Abnormal: when the child evaluated has two or more "delays", which represents that the child shows strong signs of possible developmental alteration; d) Not testable: if "refusal" is marked in one or more items that should already be part of the repertoire of the child. The child whose score is interpreted as questionable, abnormal or not testable in the first test should be reassessed before resorting to other diagnostic evaluations 26Frankenburg, WK; Dodds, J; Archer, P; Shapiro, H; Bresnick, B. The Denver II: a major revision and restandardization of the Denver Developmental Screening Test. Pediatrics. 1992;89(1):91-7..
The validity of the Denver II is established by the reliability with which the ages corresponding to 25%, 50%, 75% and 90% crossed for each item and subgroup were determined 26Frankenburg, WK; Dodds, J; Archer, P; Shapiro, H; Bresnick, B. The Denver II: a major revision and restandardization of the Denver Developmental Screening Test. Pediatrics. 1992;89(1):91-7.. Thus, each item is considered normal when the child passes or fails within the 25 to 75% correct responses range for the reference population; caution when the child fails in the adequate performance of the item within the range 75 to 90% of the reference population; and delay when the child fails in the adequate performance of the item when the line touches or exceeds the range in which there is 90% correct responses in the reference population. According to the test, there can be three outcomes: abnormal, questionable or normal. However, in this study the group with suspected developmental delays (including children with questionable and abnormal) was considered, to facilitate the achievement of inferential statistical analysis and comparison with studies present in the national and international literature.
The household poverty level was measured by means of an instrument designed for poor urban populations 27Alvarez, ML; Muzzo, S; Ivanovic, D. Escala para medición del nível socioeconómico, en el área de la salud. Rev Med Chil. 1985;113(3):243-9. Spanish., translated and adapted in Brazil by Issler and Giugliani 8Issler, RMS; Giugliani, ERJ. Identificação de grupos mais vulneráveis à desnutrição infantil pela medição do nível de pobreza. J Pediatr. 1997;73:101-5. Portuguese.. This instrument allows the analysis of a range of elements that are descriptors of the socioeconomic conditions of poor urban populations. It aims to generate a measure capable of measuring the variability of poverty, which is not limited to the consideration of the family income. It consists of 13 items that involve in their composition variables that are recognized in the literature as factors that influence childhood development: 1. Number of people that eat and sleep in the house; 2. Abandonment of father/mother; 3. Education of the parents (the highest is considered when there is a difference); 4. Work of the parents; 5. Relationship with the home; 6. Type of house; 7. Number of people sleeping in the house versus sleeping places; 8. Water supply; 9. Disposal of excreta; 10. Garbage collection; 11. Electricity supply; 12. Separate kitchen; 13. Household appliances.
The score for each item is given on a scale of zero to four, with the minimum points possible being seven and maximum 52. The sum obtained in each of these items gives the level of urban poverty of the family. For statistical purposes, the division into quartiles of the study population is recommended, according to the score obtained in the classification of their level of poverty. Each quartile equals 25% of the data distribution.
Initially, authorization was requested for the study from the Municipal Education Department. After the release of this document, the study was forwarded and approved by the Human Research Ethics Committee of the Tropical Medicine Center (NMT/UFPA), under authorization No. 167.271/2012. The procedures used fulfilled the criteria of Human Research Ethics, according to Resolution No. 196/96 of the National Health Council, in force at the time, however, in line with Resolution No. 466/2012. In addition authorization was requested from those responsible through an Informed Consent (IC) form. Next a pilot project was performed with five applications of each instrument. This allowed the reproduction of the conditions of the study and training of the research team, which was composed of three Master's students of the Graduate Program in Behavioral Theory and Research (PPGTPC), and seven undergraduate students. When this step was completed, the period of the actual data collection began.
The data obtained from the application of the instruments were entered into a database prepared using SPSS 19. From the nature of the variables inferential and descriptive statistical analyses were carried out. The dependent variable was the score of development obtained through the Denver II, considered here as a dichotomous outcome variable (normal or suspected delay). The independent variables were derived from the other instruments. To verify the association between the outcome, whether normal or suspected delay in language and the independent variables, the chi-square test was used, considering a significance level of 5% (p-value < .05).
To present the data obtained through the Denver II by AD, a map was designed that could represent the neuropsychomotor profile of children evaluated by means of an image. This methodological decision follows a current trend among researchers from different areas of knowledge, particularly in public health. In this way, its evolution and gradations can be represented through geoprocessing of complex social processes data. This means generating geographic information systems capable of contributing to the production of maps, using specific tools. These are produced from the data collection, analysis, interpretation and representation of the information, being supported by the assumptions of cartography, and processed with resources now available through the computer 28Archela, RS; Théry, H. Orientação metodológica para construção e leitura de mapas temáticos. Confins. 2008;3:1-23. Portuguese..
Results
The prevalence of participants with suspected NPMD delay was approximately 77.7%, with 37.3% abnormal and 40.4% questionable. With regard to the domains of development, the application of the Denver II revealed that the majority of the children were in the normal category in three of the four domains of development evaluated. The area of language was the only one with a significant number of suspected delays (59.2%).
Regarding the socio-economic and environmental data, the study population belonged to households with monthly incomes of one to three minimum wages (65.2%), with fathers being primarily responsible for the income (78.9%). In addition, over half of them received some social benefits (57.4%), mainly financial assistance, such as the Bolsa Família Program. Most families lived in their own (49.5%) brick built homes (59.6%) with three or more rooms (65.8%), with two to five residents (74.9%), the presence of running water (86.5%), regular garbage collection (97.5%), own internal bathroom (79.9%) and possessed basic household goods, such as refrigerator, television and stove.
Regarding the characteristics of the parents, the majority of the mothers were within the 20 to 29 years age group (62.7%), with 12 or more years of study (40.4%), and performed some kind of regular work (37.3%). Among the fathers, men aged 30 years or more (47.6%) predominated, with 9 to 11 years of education (29.8%), performing informal work (51.4%). A marked presence of parents with low education was found, characterized by non-completion of elementary education, with some being illiterate.
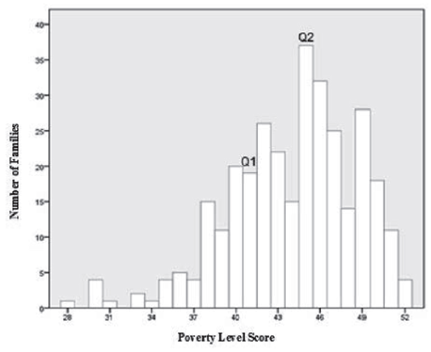
Regarding the data related to the level of poverty among the participating families, 87 were classified within extreme poverty (27%), 132 families in the lower low (41%), and 100 families in the upper low (31%) levels. The calculated mean was 44 points (SD = 4.54) and the mode was 45 points. Figure 1 shows the distribution of the poverty level score of the study population. In it the 25th percentile (first quartile - Q1) and the 50th percentile (second quartile - Q245) are marked. The minimum score was 28 points and maximum 52 points.

By Administrative District
In the analysis of family poverty level by administrative district of the city, the results show that the percentages of the poorest families participating in this study were higher in the DABEL and DABEN districts (42.8% and 37.3%). Table 1 shows the data representation.
Regarding the Denver II score, it was verified that there was high prevalence of children with suspected delays in NPMD in all the Administrative Districts of Belém. The results show that although there is no statistically significant difference between the variables, the children from the poorer families tended to have a higher risk of potential delay in NPMD. The districts with the highest percentages were DABEL and DABEN (100% and 83.3%). The other districts also presented high percentages, as shown in Table 2.
The results obtained with the Denver II can also be seen from Figure 2. The image provides a map with the territorial representation of the neighborhoods that make up the city of Belém, distributed in eight administrative districts. The different colors indicate the percentages of children whose NPMD was classified as suspected delay, with the color intensity being directly proportional to the percentage of children with this outcome.

Map of the Percentages of suspected NPMD delay, According to the Denver II in the Administrative Districts of Belém - PA.
The stratification of the population by level of poverty showed that children from the poorest families may be at higher risk of having their psychomotor development threatened, i.e., the poverty level exerted a greater effect on the overall result of the Denver II (X2 = 6.389; df = 1; p = .011) and on the area of language (X2 = 8.588; df = 1; p = .003), as shown in Table 3.
Discussion
The findings of this study suggest that children in the 36 to 48 months age group from the lowest poverty level present greater suspected delay in their neuropsychomotor development. These data lead to a strong explanatory hypothesis that the situation of poverty presented by a portion of the families may have contributed to the children obtaining the result classified as suspected delay, especially in the language area.
The results of this study are consistent with previous research using the Denver II 9Halpern, R; Barros, AJD; Matijasevich, A; Santos, IS; Victora, CG; Barros, FC. Developmental status at age 12 months according to birth weight and family income: a comparison of two Brazilian birth cohorts. Cad Saude Publica. 2008;24:444-50.,11Brito, CML; Vieira, GO; Costa, COM; Oliveira, NF. Desenvolvimento neuropsicomotor: o teste de Denver na triagem dos atrasos cognitivos e neuromotores de pré-escolares. Cad Saude Publica. 2011;27:1403-14. Portuguese.,12Chiu, SH; DiMarco, MA. A Pilot Study Comparing Two Developmental Screening Tools for Use With Homeless Children. J Pediatr Health Care. 2010;24:73-80.,29Ozkan, M; Senel, S; Arslan, EA; Karacan, CD. The socioeconomic and biological risk factors for developmental delay in early childhood. Eur J Pediatr. 2012;171(12):1815-21.,30Pilz, EML; Schermann, LB. Determinantes biológicos e ambientais no desenvolvimento neuropsicomotor em uma amostra de crianças de Canoas/RS. Cienc Saude Colet. 2007;12:181-90. Portuguese.,31Veleda, AA; Soares, MCF; Cézar-Vaz, MR. Fatores associados ao atraso no desenvolvimento em crianças, Rio Grande, Rio Grande do Sul, Brasil. Rev Gaucha Enferm. 2011;32:79-85. Portuguese.. These studies show an association between predictors of poverty or socioeconomic status of the family and the acquisition of neurodevelopmental milestones, especially language. In addition, they highlight the influence of social and environmental aspects related to the fundamental stimuli for linguistic patterns to improve, as well as the interaction of the caregivers with the child.
The poverty level of the family can cause or worsen serious health problems, including those related to NPMD delays, due to less stimulation and increased exposure to risk factors 4Wehby, GL; McCarthy, AM. Economic gradients in early child neurodevelopment: A multi-country study. Soc Sci Med. 2013;78:86-95.. In contrast, there are publications that demonstrate that the development of children belonging to a social class with fewer socioeconomic resources is favored by protective factors, such as the strong and positive influence of child rearing practices that encourage stable and affectionate relationships of the child with his/her caregiver, such as breastfeeding and physical contact between mother and baby.
Regarding the Administrative Districts, it was established that all were shown to be related to each other, in ecological terms, that is, there were no statistically significant differences between the poverty level of the family and the AD. This could be explained by the fact that poverty is present in different regions of the city of Belém 19Guerreiro, TBF. Desenvolvimento neuropsicomotor de crianças de Belém: associação com características pessoais e variáveis do seu ambiente ecológico. {master's thesis}. Belém (Brazil): Universidade Federal do Pará; 2013. Portuguese., being a characteristic common to the majority of the families in the various ADs. In other words, the city does not have defined areas that can be classified exclusively as affluent or impoverished, with it being possible to observe that families from different social classes live close together. Thus, the ecological context in which children are inserted is characterized by lack of resources and by chronic and troubling social indicators, which does not always include the basic necessities for healthy development in early childhood.
These findings confirm national reports that indicate that the town of Belém has an high poverty rate in relation to the other metropolitan regions of Brazil. Half of the population living of this metropolis live in poor communities 14IBGE - Instituto Brasileiro de Geografia e Estatística. Censo demográfico 2010. Rio de Janeiro: IBGE; 2011. Portuguese.. Nationally, nearly 60% of the population living in slums is concentrated in the metropolitan areas of São Paulo, Rio de Janeiro, Belém, Salvador and Recife 32Costa, MA; Tsukumo, ITL. 40 anos de Regiões Metropolitanas no Brasil. Brasília: IPEA; 2013. Portuguese.. However, the percentage of residents in these conditions in the MAB is higher than that of the other capitals 14IBGE - Instituto Brasileiro de Geografia e Estatística. Censo demográfico 2010. Rio de Janeiro: IBGE; 2011. Portuguese.,32Costa, MA; Tsukumo, ITL. 40 anos de Regiões Metropolitanas no Brasil. Brasília: IPEA; 2013. Portuguese..
With regard to the scores obtained through the Denver II by AD, it was found that the district that presented the highest percentage of suspected delay was the DABEL district and the lower percentage was the DABEN district, contrary to that indicated in the literature 8Issler, RMS; Giugliani, ERJ. Identificação de grupos mais vulneráveis à desnutrição infantil pela medição do nível de pobreza. J Pediatr. 1997;73:101-5. Portuguese.,9Halpern, R; Barros, AJD; Matijasevich, A; Santos, IS; Victora, CG; Barros, FC. Developmental status at age 12 months according to birth weight and family income: a comparison of two Brazilian birth cohorts. Cad Saude Publica. 2008;24:444-50.,31Veleda, AA; Soares, MCF; Cézar-Vaz, MR. Fatores associados ao atraso no desenvolvimento em crianças, Rio Grande, Rio Grande do Sul, Brasil. Rev Gaucha Enferm. 2011;32:79-85. Portuguese.,33Maria-Mengel, MRS; Linhares, MBM. Fatores de risco para problemas de desenvolvimento infantil. Rev Lat Am Enfermagem. 2007;15:837-42. Portuguese.. The DABEL district, located in the central region of Belém, encompasses neighborhoods with better infrastructure, with the highest construction standards and greater availability of services, commerce and public facilities and presents a higher index of general well-being 17Ponto, JPX; Lima, JJF; Cardoso, ACD; Rodrigues, RM. Análise do IBEU Local - Região Metropolitana de Belém-PA. Observatório das Metrópoles 2013 {cited2014 Aug 20}. Available from: Available from: http://tinyurl.com/jb342ws
. Portuguese.
http://tinyurl.com/jb342ws...
. However, it is assumed that this concentration of benefits was not sufficient with regards to the performance of the NPMD and language of the children, because it was the AD that had the highest prevalence of cases of suspected delay. There are some explanatory hypotheses to comprehend this result, such as the small sample size of participants in this area (n = 7), due to there being a single ECEU in the district, with only one class of students in the age group studied. Another explanation is the fact that people with better socioeconomic conditions, as is the case of those that reside in the DABEL district, usually use day-care or preschools services of the private network. Furthermore, some of the children evaluated did not live in that district.
These findings contradict the hypothesis that, being linked to the municipal area that has the greater concentration of benefits, the children evaluated would present better performance in the Denver II than the participants from the other ADs. As shown, this was not the result recorded. In the DABEL district, as well as in other districts, the socioeconomic conditions of the families studied were precarious. Although it covers a region with economic and urban centrality, this district, as well as others, presents problematic regions with irregular occupations, with low-lying areas, where families live in socially unsatisfactory housing conditions, with the ECEU being located on the bank of a drainage channel.
Conversely, the DABEN district, which is located at the other extreme of the city, presented the lowest proportion of suspected delays in NPMD. This should be highlighted as a positive aspect, however, the percentage of children with this score, in this and the other districts was high. Among the alternative explanations for this finding the general condition of the families residing in the DABEN district is highlighted. Despite the characteristics of this district revealing a predominance of inappropriate environmental conditions for the ecology of development 34Bronfenbrenner, U. Bioecologia do desenvolvimento humano: tornando os seres humanos mais humanos. Porto Alegre (Brazil): Artmed; 2011. Portuguese., two of ECEUs surveyed were located around delimited centers with availability of infrastructure and services and close to the affluent residential areas. In addition, the socioeconomic variables of the investigated families were better, compared to the parents of the other ADs.
Another interpretation of this outcome refers to the contribution and cooperation perceived between the teachers and the coordination in two of the DABEN district units. These professionals, even faced with precarious physical conditions, proved to be committed to ensuring quality education and care for the students 35Ramos, DD; Salomão, NMR. Interação educadora-criança em creches públicas: estilos linguísticos. Psicol Estud. 2012;17:15-25. Portuguese.. One of ECEUs was nearly closed down, however, because of the mobilization of these employees, was relocated to a temporary site in order to keep it functioning.
In the other ADs, the frequency of suspected delays in NPMD ranged from 72.9% to 83.3%, showing that unfavorable ecological conditions for development are found in all the areas of Belém. However, there was no statistically significant difference among the administrative districts regarding the number of children identified with suspected developmental delay. It is considered that this result occurred due to little variation among the districts with regard to the outcomes obtained through the Denver II. In summary, this results of this study corroborate previous study findings that show evidence that biological and environmental factors related to poverty interactively and cumulatively influence childhood development 1Evans, GW; Li, D; Whipple, SS. Cumulative risk and child development. Psychol Bull. 2013;139:1342-96.,2Fotso, JC; Madise, N; Baschieri, A; Cleland, J; Zulu, E; Mutua ,MK; et al. Child growth in urban deprived settings: Does household poverty status matter? At which stage of child development? Health Place. 2012;18(2):375-84.,5Walker, SP; Wachs, TD; Gardner, JM; Lozoff, B; Wasserman, GA; Pollit, TE; et al. Child Development: risk factors for adverse outcomes in developing countries. Lancet. 2007;369:145-57.,10Dearing, E. Psychological Costs of Growing Up Poor. Ann N Y Acad Sci. 2008;1136:324-32..
Although the developmental contexts are often analyzed individually, the fact that environments and individuals not only interact, but also influence each other, is considered the basic premise of ecological theory. It should be comprehended that poverty is not a unidirectional model, in which only one variable, such as the socioeconomic status of the family, can affect childhood development, especially language. Thus, it should be analyzed multi-dimensionally, considering that families are affected not only by schools, communities and neighborhoods, but the parents and children also influence the environments in which they participate 7Huston, AC; Bentley, AC. Human development in societal context. Annu Rev Clin Psychol. 2010;61:411-37.,20Tudge, JRH. Children s development under conditions of poverty: A cultural ecological analysis. In: Bastos, A; Rabinovich, EP (Orgs.). Living in poverty: Developmental poetics of cultural realities. Charlotte (NC): Information Age Pub; 2009. p. 309-20.,34Bronfenbrenner, U. Bioecologia do desenvolvimento humano: tornando os seres humanos mais humanos. Porto Alegre (Brazil): Artmed; 2011. Portuguese.. Regarding the study environment, some units presented satisfactory condition for healthy development. However, there was a predominance of precarious places, regarding both the infrastructure and the pedagogic resources. The low number of ECEUs and places is also worrying, considering the large amount of children not in preschools and the large number of them awaiting new places.
Through the evaluation of the results it could be seen that the children presented a high prevalence of suspected delay in NPMD and language. However, it should be noted that the Denver II is a test for screening and not for the diagnosis of developmental abnormalities, requiring those participants whose result were suspect to be reassessed. As an epidemiological research instrument, the Denver II proved to be suitable for the early detection of any deviation in the development and insightful for longitudinal monitoring of the child, having its practicality of application as an advantage. The instrument used to classify the poverty level of urban populations was also found to be adequate for identifying the children and families with higher risk, through population strata.
Childhood neuropsychomotor development is a dynamic process, as are the risk factors that influence it, especially urban poverty. Thus, the results classified as suspected delay in NPMD and its association with the poverty level present complexity. These variables are interrelated and can have a cumulative and intergenerational effect. The findings of this study reinforce the multifactorial nature of childhood development and indicate the importance of continuous monitoring, especially in the underprivileged populations of Belém.
Conclusion
From the results analyzed and reflections raised, it is hoped that this study will contribute to generate repercussions for improving the ecological conditions of children and their families, reducing the risks to which they are exposed. Considering the high number of suspected delays in development, according to the Denver II, and that this test is not validated for the Brazilian population, further studies should be conducted in an attempt to provide a better evaluation of this instrument. In addition, longitudinal studies should be conducted that seek the continuous and effective monitoring of child development, increasing the chances of securing the future of these children as healthy and productive citizens.
References
- Evans, GW; Li, D; Whipple, SS. Cumulative risk and child development. Psychol Bull. 2013;139:1342-96.
- Fotso, JC; Madise, N; Baschieri, A; Cleland, J; Zulu, E; Mutua ,MK; et al. Child growth in urban deprived settings: Does household poverty status matter? At which stage of child development? Health Place. 2012;18(2):375-84.
- Roelen, K; Gassmann, F; Neubourg, C. Child poverty in Vietnam - Providing insights using a country-specific and multidimensional model. Soc Indic Res. 2010;98(1):129-45.
- Wehby, GL; McCarthy, AM. Economic gradients in early child neurodevelopment: A multi-country study. Soc Sci Med. 2013;78:86-95.
- Walker, SP; Wachs, TD; Gardner, JM; Lozoff, B; Wasserman, GA; Pollit, TE; et al. Child Development: risk factors for adverse outcomes in developing countries. Lancet. 2007;369:145-57.
- Alkire, S; Foster, J. Counting and multidimensional poverty measurement. J Public Econ. 2011;95:476-87.
- Huston, AC; Bentley, AC. Human development in societal context. Annu Rev Clin Psychol. 2010;61:411-37.
- Issler, RMS; Giugliani, ERJ. Identificação de grupos mais vulneráveis à desnutrição infantil pela medição do nível de pobreza. J Pediatr. 1997;73:101-5. Portuguese.
- Halpern, R; Barros, AJD; Matijasevich, A; Santos, IS; Victora, CG; Barros, FC. Developmental status at age 12 months according to birth weight and family income: a comparison of two Brazilian birth cohorts. Cad Saude Publica. 2008;24:444-50.
- Dearing, E. Psychological Costs of Growing Up Poor. Ann N Y Acad Sci. 2008;1136:324-32.
- Brito, CML; Vieira, GO; Costa, COM; Oliveira, NF. Desenvolvimento neuropsicomotor: o teste de Denver na triagem dos atrasos cognitivos e neuromotores de pré-escolares. Cad Saude Publica. 2011;27:1403-14. Portuguese.
- Chiu, SH; DiMarco, MA. A Pilot Study Comparing Two Developmental Screening Tools for Use With Homeless Children. J Pediatr Health Care. 2010;24:73-80.
- Yazbek, MC. Pobreza no Brasil contemporâneo e formas de seu enfrentamento. Serv Soc Soc. 2012;110:288-322. Portuguese.
- IBGE - Instituto Brasileiro de Geografia e Estatística. Censo demográfico 2010. Rio de Janeiro: IBGE; 2011. Portuguese.
- IPEA - Instituto de Pesquisa Econômica Aplicada. Duas décadas de desigualdade e pobreza no Brasil medidas pela Pnad/IBGE. Comunicados do IPEA. 2013{cited2014 Aug 20}. Available from: Available from: http://tinyurl.com/jmajojz Portuguese.
» http://tinyurl.com/jmajojz - Celentano, D; Santos, D; Veríssimo, A. A Amazônia e os objetivos do milênio. Belém (Brazil): Imazon; 2010. Portuguese.
- Ponto, JPX; Lima, JJF; Cardoso, ACD; Rodrigues, RM. Análise do IBEU Local - Região Metropolitana de Belém-PA. Observatório das Metrópoles 2013 {cited2014 Aug 20}. Available from: Available from: http://tinyurl.com/jb342ws Portuguese.
» http://tinyurl.com/jb342ws - Paiva, GS; Lima, ACVMS; Lima, MC; Eickmann, SH. The effect of poverty on developmental screening scores among infants. Sao Paulo Med J. 2010;128(5):276-83.
- Guerreiro, TBF. Desenvolvimento neuropsicomotor de crianças de Belém: associação com características pessoais e variáveis do seu ambiente ecológico. {master's thesis}. Belém (Brazil): Universidade Federal do Pará; 2013. Portuguese.
- Tudge, JRH. Children s development under conditions of poverty: A cultural ecological analysis. In: Bastos, A; Rabinovich, EP (Orgs.). Living in poverty: Developmental poetics of cultural realities. Charlotte (NC): Information Age Pub; 2009. p. 309-20.
- Soares, AMC. Cidade Revelada: pobreza urbana em Salvador-BA. Geografias. 2009;5:83-96. Portuguese.
- Sigolo, ARL; Aiello, ALR. Análise de instrumentos para triagem do desenvolvimento infantil. Paideia(Ribeirão Preto). 2011;21:51-60. Portuguese.
- United Nations Children's Fund. The State of the World's Children 2014 In Numbers: Every Child Counts. Nova York: UNICEF; 2014.
- Bricker, D; Squires, J; Clifford, J. Developmental screening measures: Stretching the use of the ASQ for other assessment purposes. Infants Young Child. 2010;23:14-22.
- Souza, SC; Leone, C; Takano, OK; Moratelli, HB. Desenvolvimento de pré-escolares na educação infantil em Cuiabá, Mato Grosso, Brasil. Cad Saude Publica. 2008;24:1917-26. Portuguese.
- Frankenburg, WK; Dodds, J; Archer, P; Shapiro, H; Bresnick, B. The Denver II: a major revision and restandardization of the Denver Developmental Screening Test. Pediatrics. 1992;89(1):91-7.
- Alvarez, ML; Muzzo, S; Ivanovic, D. Escala para medición del nível socioeconómico, en el área de la salud. Rev Med Chil. 1985;113(3):243-9. Spanish.
- Archela, RS; Théry, H. Orientação metodológica para construção e leitura de mapas temáticos. Confins. 2008;3:1-23. Portuguese.
- Ozkan, M; Senel, S; Arslan, EA; Karacan, CD. The socioeconomic and biological risk factors for developmental delay in early childhood. Eur J Pediatr. 2012;171(12):1815-21.
- Pilz, EML; Schermann, LB. Determinantes biológicos e ambientais no desenvolvimento neuropsicomotor em uma amostra de crianças de Canoas/RS. Cienc Saude Colet. 2007;12:181-90. Portuguese.
- Veleda, AA; Soares, MCF; Cézar-Vaz, MR. Fatores associados ao atraso no desenvolvimento em crianças, Rio Grande, Rio Grande do Sul, Brasil. Rev Gaucha Enferm. 2011;32:79-85. Portuguese.
- Costa, MA; Tsukumo, ITL. 40 anos de Regiões Metropolitanas no Brasil. Brasília: IPEA; 2013. Portuguese.
- Maria-Mengel, MRS; Linhares, MBM. Fatores de risco para problemas de desenvolvimento infantil. Rev Lat Am Enfermagem. 2007;15:837-42. Portuguese.
- Bronfenbrenner, U. Bioecologia do desenvolvimento humano: tornando os seres humanos mais humanos. Porto Alegre (Brazil): Artmed; 2011. Portuguese.
- Ramos, DD; Salomão, NMR. Interação educadora-criança em creches públicas: estilos linguísticos. Psicol Estud. 2012;17:15-25. Portuguese.
Publication Dates
-
Publication in this collection
Jul-Sep 2016
History
-
Received
16 Oct 2014 -
Accepted
19 Oct 2015