 The impact of rising greenhouse gases and deforestation on temperature extremes in the Amazon basin
ABSTRACT
Understanding the impacts of climate change and land-use change is crucial for anticipating environmental risks in the Amazon, a region that plays a key role in global climate regulation. This study aimed to investigate the individual and combined impacts of increased greenhouse gas (GHG) concentrations and deforestation on temperature extremes in the Amazon region. Numerical experiments were conducted using the regional climate model Eta, driven by initial and boundary conditions from the global model HadGEM2-ES. The GHG increase scenario followed projections from the Intergovernmental Panel on Climate Change (IPCC) under the Representative Concentration Pathway (RCP8.5). The impact of deforestation was evaluated through an experiment in which the entire Amazon rainforest was removed. The combined scenario represents the integration of RCP8.5 and total deforestation. All experiments revealed anomalous increases in the annual maximum temperature (TXx), annual minimum temperature (TNx), the percentage of days when the maximum temperature (TX) exceeded the 90th percentile (TX90p), and days when the minimum temperature (TN) exceeded the 90th percentile (TN90p). Notably, deforestation caused more significant changes in temperature-related climate indices than the RCP8.5 scenario, with extreme increases of approximately 6 °C to 7 °C observed in up to 60% of the year. In contrast, the combined scenario showed the most intense anomalous impacts, with temperature increases reaching up to 9 °C occurring in as much as 90% of the year. In summary, both GHG increases and deforestation intensify the magnitude and frequency of temperature extremes in the Amazon.
Keywords:
Climate extremes; temperature indices; Eta model; global model HadGEM2-ES
RESUMO
Compreender os impactos das mudanças climáticas e das mudanças no uso da terra é essencial para antecipar os riscos ambientais na Amazônia, uma região que desempenha um papel fundamental na regulação do clima global. Este estudo teve como objetivo investigar os impactos individuais e combinados do aumento das concentrações de gases de efeito estufa (GEE) e do desmatamento sobre os extremos de temperatura na região amazônica. Foram realizados experimentos numéricos utilizando o modelo climático regional Eta, forçado por condições iniciais e de contorno do modelo global HadGEM2-ES. O cenário de aumento de GEE seguiu as projeções do Painel Intergovernamental sobre Mudanças Climáticas (IPCC), sob o Cenário Representativo de Concentração (RCP8.5). O impacto do desmatamento foi avaliado por meio de um experimento no qual toda a floresta amazônica foi removida. O cenário combinado representa a integração do RCP8.5 com o desmatamento total. Todos os experimentos revelaram aumentos anômalos na temperatura máxima anual (TXx), temperatura mínima anual (TNx), na porcentagem de dias em que a temperatura máxima (TX) excedeu o percentil 90 (TX90p) e em que a temperatura mínima (TN) excedeu o percentil 90 (TN90p). Notavelmente, o desmatamento causou mudanças mais significativas nos índices climáticos relacionados à temperatura do que o cenário RCP8.5, com aumentos extremos de aproximadamente 6 °C a 7 °C observados em até 60% do ano. Em contraste, o cenário combinado apresentou os impactos anômalos mais intensos, com elevações de temperatura chegando a 9 °C em até 90% do ano. Em resumo, tanto o aumento de GEE quanto o desmatamento intensificam a magnitude e a frequência dos extremos de temperatura na Amazônia.
Palavras-chave:
extremos climáticos; índices de temperatura; modelo Eta; modelo global HadGEM2-ES
INTRODUCTION
The Amazon Basin covers approximately 7 million km², with the Amazon rainforest occupying around 5.3 million km², accounting for about 40% of the planet’s tropical forests (Laurance et al. 2001; Weng et al. 2018). This vast region plays a critical role in both global and regional climate systems, influencing moisture recycling, atmospheric circulation, and the water, energy, and carbon cycles (Nobre et al. 2013; Zemp et al. 2014; Nobre et al. 2016). However, this ecological balance has been threatened by several interconnected factors, such as increased climate variability, human-induced climate change, and especially deforestation and forest degradation (Artaxo 2020).
Recent studies warn of a potential ecological tipping point in the Amazon, driven by the interaction between rising temperatures, reduced precipitation, and vegetation loss. The simultaneous progression of deforestation and climate change is pushing the forest toward a functional and irreversible collapse, with the risk of abrupt transition closely associated with intensifying temperature extremes and the region’s increasing aridification (Lapola et al., 2023).
Observational data show an increase of approximately 0.6 °C in the mean air temperature across the Amazon between 1973 and 2013 (Almeida et al. 2017), while Lovejoy and Nobre (2018) emphasize a growing vulnerability of the forest due to these trends. Observational data indicate a warming of approximately 0.5 °C in the southeastern Amazon since 1980, particularly during the dry season, which has become progressively more prolonged and intense (Jiménez-Muñoz et al. 2016). Regarding future projections, the Intergovernmental Panel on Climate Change, based on CMIP5 climate models, projects a global average temperature increase between 2.6 °C and 4.8 °C by 2100 under the high-emissions scenario RCP8.5. Even higher estimates based on climate simulations have been found, suggesting temperature increases between 6 °C and 7 °C in the eastern and southern portions of the forest by the end of the century (Marengo et al. 2018).
Deforestation is another key factor affecting the Amazonian climate, acting synergistically with the rise in greenhouse gas (GHG) concentrations. The removal of vegetation cover significantly reduces evapotranspiration, enhancing surface warming (Aragão et al. 2018; Sampaio et al. 2018). Forest loss decreases the resilience of the Amazon climate system, increasing its susceptibility to extreme droughts and loss of hydrological stability (Boers 2021). In addition, forest degradation, even without clear-cutting, alters temperature, humidity, and rainfall dynamics, thereby exacerbating regional climate impacts (Silvério et al. 2015). Modeling studies show that tropical deforestation can raise surface temperatures by 1 °C to 3 °C due to reduced evapotranspiration and altered mesoscale circulations within the atmospheric boundary layer (Spracklen et al. 2018). CMIP3 model-based studies suggest a potential increase in annual mean temperature of up to 3.8 °C, along with a 10% to 30% reduction in annual rainfall across the Amazon, with significant seasonal implications (Magrin et al. 2014).
Although several studies have documented the observed warming in the Amazon in recent decades (Jiménez-Muñoz et al. 2013; Flores et al. 2024; Marengo et al. 2024) and projected future increases in global and regional average temperatures (Sillmann et al. 2013), as well as the impacts of deforestation and forest degradation on local climate and precipitation indices (Lawrence and Vandecar, 2015; Spracklen and Garcia-Carreras 2015; Smith et al. 2023), few have specifically focused on analyzing temperature extremes-both maximum and minimum-and their individual and combined responses to rising greenhouse gas (GHG) concentrations and deforestation (Sillmann et al. 2013; Lejeune et al. 2014;Oliveira et al. 2021). Moreover, there is a lack of integrated studies that jointly assess these two major drivers of change using high-resolution regional climate models capable of capturing more precise spatial and temporal patterns. Filling this gap is essential to improve the understanding of climate risks specific to the Amazon, support effective mitigation and adaptation strategies, and contribute to the development of more accurate public policies.
Previous studies (Brito et al. 2022) have examined the impacts of GHGs and deforestation on precipitation indices, but significant knowledge gaps remain regarding their effects on temperature extremes. The present study therefore investigates, through an integrated analysis of observational data and modeling, the individual and combined effects of increased GHG concentrations and Amazon deforestation on temperature extreme indices, aiming to contribute to the understanding of climate impacts in the region and their implications for ecosystem resilience, hydrological cycles, and mitigation and adaptation strategies.
MATERIALS AND METHODS
Model description
The global climate model HadGEM2-ES was developed within the Met Office Unified Model (MetUM) framework and represents an evolution of HadGEM1 (Martin et al. 2011), incorporating advances in the representation of climate processes. It features different configurations with varying levels of complexity, while maintaining a common physical structure. One of the main improvements in this version is its enhanced ability to simulate the climatic conditions of the Amazon during both the dry and rainy seasons (Li et al. 2006; Yin et al. 2013). HadGEM2-ES includes the dynamic vegetation scheme TRIFFID, which enables the interactive simulation of vegetation cover and its interactions with the atmosphere-an essential component for realistically representing temperatures in the Amazon region. Its horizontal resolution is 1.875° latitude by 1.25° longitude, with 38 vertical levels in the atmosphere. A more detailed description of the model can be found in Collins et al. (2011).
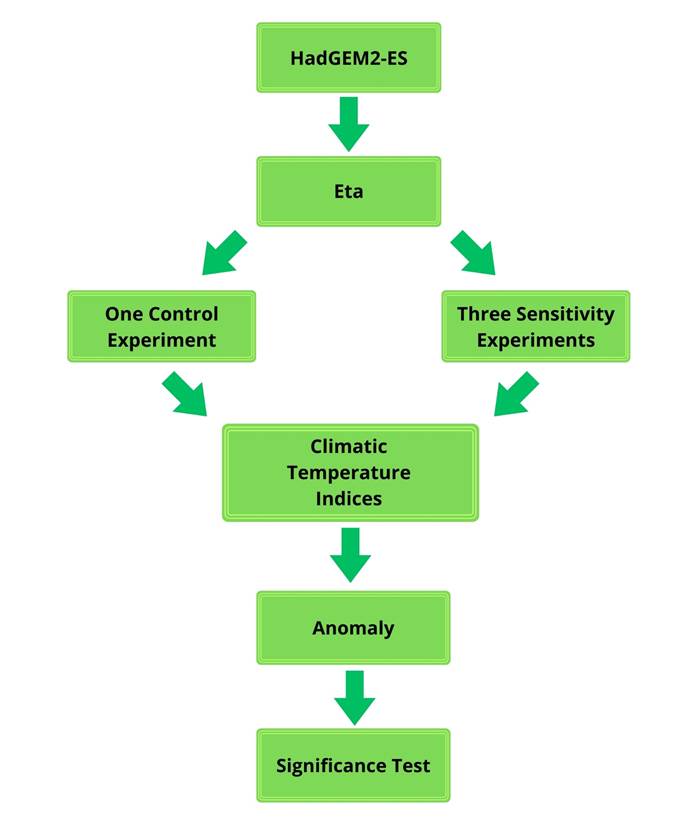
In this study, maximum and minimum temperature data were obtained through dynamic downscaling experiments using the Eta Regional Climate Model (Eta RCM) (Chou et al. 2014). The Eta model was nested within the HadGEM2-ES model, which provided the boundary conditions for the regional simulations. The specific configurations of the Eta RCM are presented in Table 1. The Eta model has a spatial resolution of approximately 20 km, which allows for more accurate representation of temperature extremes and mesoscale systems in the Amazon, complementing the information provided by the global model and adding value to regional analyses. The modeling framework used in this study is schematically illustrated in Figure 1, highlighting the interaction between the global and regional models within the downscaling approach.
Application of the Eta Regional Climate Model in the simulations conducted in this study, including the control and sensitivity experiments (RCP8.5, DEFOR, and RCP8.5+DEFOR).
Description of experiments
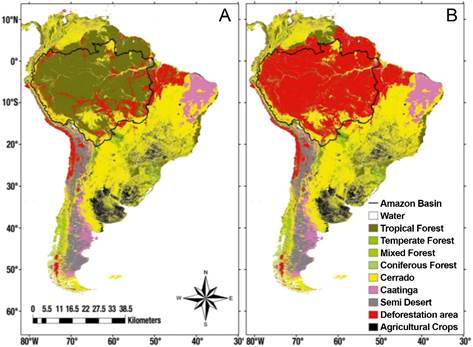
In this study, four numerical experiments were performed; one experiment related to present climate conditions and three experiments related to future scenarios (Table 2, and Figure 1). For the current climate, the experiment consisted of a 30-year continuous integration (1961 to 1990), called the control experiment (CTRL). In this experiment, the concentration of carbon dioxide was maintained constant at 330 ppm. The vegetation map used for the year of 2015 (Figure 2a) was prepared from the ProVeg Project (Sestini et al. 2002) and with data from the Gross Deforestation Estimation Project in the Amazon - PRODES-DIGITAL (INPE, 2017). For the future climate, integrations were carried out for the period 2070 to 2099, in which three experiments were done: i) one to represent the increase of GHGs (RCP8.5), ii) one to represent a total deforestation in the Amazon basin (DEFOR) and iii) one with the increase in GHGs together with the total deforestation (RCP8.5+DEFOR). This late-century period was selected because the aim of the study was to investigate how the most pessimistic AR5 scenario (RCP8.5) could impact temperature extremes. Since GHG emissions are projected to reach their highest levels by the end of the 21st century, 2070-2099 provides a suitable time window for assessing these impacts. To evaluate the isolated impact of deforestation (DEFOR), the difference between the RCP8.5+DEFOR and RCP8.5 simulations was calculated. For these experiments, the RCP8.5 GHG emission scenario was used, which indicated a carbon dioxide concentration of 1230 ppm at the end of the century. The first year of simulation in all experiments was discarded due the spin up effect. The vegetation map for the year 2100 (Figure 2b) was produced from the map by Sestini et al. (2002), in which the entire Amazon forest is replaced by degraded pasture.
Application of the Eta Regional Climate Model in the numerical experiments conducted in this study, describing the simulation period, GHG emission scenario, and deforestation scenario for the sensitivity experiments (RCP8.5, DEFOR, and RCP8.5+DEFOR).

Description of experiments. Schematic diagram illustrating the setup of the control and sensitivity simulation experiments, including the scenarios of increased GHGs (RCP8.5), total deforestation in the Amazon basin (DEFOR), and the combination of both (RCP8.5+DEFOR).
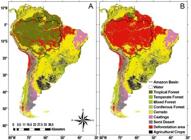
Vegetation cover scenarios used in the Eta RCM simulations. (A) Current climate and deforestation scenario. Vegetation map prepared using the ProVeg Project with deforested areas (base year 2015); (B) Vegetation map under the total deforestation of the Amazon scenario. Resolution: 1x1 km. Colors: green (forest), yellow (Cerrado), blue (water), and red (degraded pasture). Adapted from Gomes et al. (2020).
Climate extreme indicators
It is widely recognized that changes in the frequency and intensity of extreme weather events have significant impacts on tropical ecosystems and human societies (Alexander et al. 2006; Vasconcelos et al. 2022; Boulton et al. 2022; Da Silva et al. 2023). For this reason, the Expert Team on Climate Change Detection and Indices (ETCCDI) developed a set of indices that enable the quantification and monitoring of such events. In this study, four temperature-related climate extreme indices were selected due to their particular relevance to the Amazon rainforest, where rising temperatures can compromise sensitive ecological functions such as the carbon cycle, plant transpiration, primary productivity, and vegetation regeneration processes (Ahlström et al. 2017; Piao et al. 2019).
The TXx index represents the highest maximum temperature recorded during the year and serves as an indicator of the intensity of the hottest days. The TX90p index expresses the annual frequency of very hot days, defined as those in which the maximum temperature exceeds the 90th percentile, reflecting changes in the persistence of extreme heat. The TNx index captures the highest minimum temperature of the year, which is associated with increased nighttime heat, a critical factor for plant physiology and human health (Zhang et al. 2011). Lastly, the TN90p index measures the frequency of very hot nights, also based on the 90th percentile, and is especially relevant in tropical regions where hot nights reduce the ability of organisms and the environment to cool down (McGree et al. 2019). This approach makes it possible to evaluate not only absolute extremes but also changes in their frequency, providing a more comprehensive understanding of climate impacts on the Amazon rainforest.
Climate change analysis
To estimate the changes in the indices of climate extremes resulting from the increase in GHGs and deforestation towards the end of the 21st century (2070-2099), the differences between the sensitivity experiments (RCP8.5, DEFOR, and RCP8.5+DEFOR), and the baseline experiment (BASE) were calculated (1961-1990). In addition, Student’s t-test was used to determine statistical significance at the 95% level. This test is commonly used in climate sensitivity studies (Spiegel 1977) to quantify the statistical significance of climate index anomalies.
RESULTS
RCP8.5 Scenario
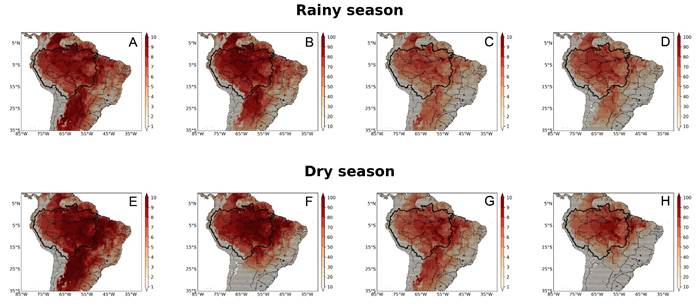
Under the RCP8.5 scenario, maximum daily maximum temperature (TXx) values increased significantly across the Amazon basin during the rainy season. The most pronounced warming occurred in the southern region near Bolivia, with increases of approximately 8 °C, and along the border between Amazonas and Pará states in the northeast, where temperatures rose by up to 9 °C (Figure 3a). Additionally, the percentage of days with maximum temperatures exceeding the 90th percentile (TX90p) displays an ~80% increase in the northeastern areas (Amazonas and Pará states) and ~70% in the southwest (Bolivia, Peru, and Acre) (Figure 3b). Under the RCP8.5 scenario, the maximum values of minimum daily temperature (TNx) rise by approximately 8 °C to 9 °C in the southern (Bolivia) and northeastern (Amazonas and Pará border) parts of the basin (Figure 3c). Conversely, the percentage of days with minimum temperatures surpassing the 90th percentile increases over Bolivia (~70%) and in the northeastern region (Pará and Amazonas border) (~80%) (Figure 3d).
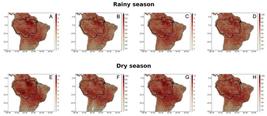
Anomalous values of the temperature extremes indices, for the RCP8.5 scenario, in the rainy season in the Amazon basin: (A) Maximum daily maximum temperature - TXx (°C); (B) Percentage of days with TX above the 90th percentile - TX90p (%); (C) Maximum daily minimum temperature - TNx (°C), and (D) Percentage of days with TN above the 90th percentile - TN90p (%). Amazon basin dry season: (E) Maximum daily maximum temperature - TXx (°C); (F) Percentage of days with TX above the 90th percentile - TX90p (%); (G) Maximum daily minimum temperature - TNx (°C) and (H) Percentage of days with TN above the 90th percentile - TN90p (%). Darker black points represent values that are statistically significant at the 95% confidence level. The darker black line indicates the boundaries of the Amazon basin.
In the dry season, elevated GHG emissions lead to higher annual maximum temperatures across the Amazon basin (Figure 3e), particularly noticeable in the northeastern sector (Amazonas and Pará border) and the southern part (Bolivia), with maximum TXx values of approximately 8 °C and 9 °C, respectively. The RCP8.5 scenario’s increased GHGs (Figure 3f) contribute to an enhanced frequency of very hot days throughout the Amazon basin. The most substantial increase (~80%) occurs in three distinct regions: northern (Amazonas and Roraima border), eastern (central Pará region), and southern (Bolivia) parts of the basin. There is also a significant rise in TNx across the basin, with particularly noteworthy increases (~9°C) in the northeastern (Amazonas state) and southwestern (Bolivia) sectors. Conversely, increased GHGs raise the percentage of very hot days in the northern (Amazonas and Roraima border), eastern (central Pará region), and southern (Bolivia) regions (Figure 3h). In these areas, TN90p values could be 90% more frequent compared to present conditions.
Amazon Deforestation Scenario
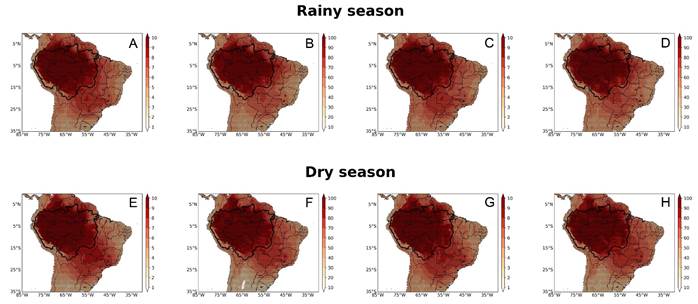
In the total deforestation (DEFOR) scenario, with greenhouse gas concentrations fixed at 330 ppm, maximum daily temperature (TXx) increased significantly throughout the Amazon basin. The most affected areas include Roraima, northern Pará, parts of Rondônia, and Mato Grosso, with temperature increases ranging from 8 °C to 9 °C (Figure 4a). The intensity and spatial extent of these changes exceed those observed in the RCP8.5 scenario (Figure 3a), with affected areas approximately 20% larger. There is also a marked increase in the percentage of days with maximum temperatures above the 90th percentile (TX90p) (Figure 4b), reaching up to 90% in northern regions (Amazonas and Roraima), which is about 10% higher than in the RCP8.5 scenario for the same areas (Figure 3b). This increase covers nearly the entire basin, indicating a substantial rise in the frequency of extremely hot days. Distinct spatial patterns also emerge, with warming gradients intensifying toward the north and south, forming critical hotspots in the eastern (central Pará) and western (Rondônia and Acre) edges of the basin.
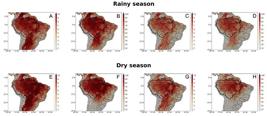
Anomalous values of the indices of temperature extremes for the Amazon total deforestation scenario in the rainy season in the Amazon basin: (A) Maximum daily maximum temperature - TXx (°C); (B) Percentage of days with TX above the 90th percentile - TX90p (%); (C) Maximum daily minimum temperature - TNx (°C) and (D) Percentage of days with TN above the 90th percentile - TN90p (%). Amazon basin dry season: (E) Maximum daily maximum temperature - TXx (°C); (F) Percentage of days with TX above the 90th percentile - TX90p (%); (G) Maximum daily minimum temperature - TNx (°C) and (H) Percentage of days with TN above the 90th percentile - TN90p (%). Darker black points represent values that are statistically significant at the 95% confidence level. The darker black line indicates the boundaries of the Amazon basin.
Regarding minimum temperature extremes (TNx), deforestation causes strong warming over much of the region (Figure 4c), with increases of up to 9 °C, mainly in the central basin (Amazonas state), northern Mato Grosso, northern Pará, and Roraima. The frequency of warm nights (TN90p) also increases significantly (Figure 4d), reaching around 80% in Roraima, central Amazonas, and southern areas such as Rondônia and northern Mato Grosso. These regions exhibit greater nighttime impacts than those observed under RCP8.5 (Figure 3d), where TN90p values peak around 70%.
During the dry season, TXx patterns in the DEFOR scenario (Figure 4e) resemble those in RCP8.5 (Figure 4e), but are more intense and widespread. Maximum TXx increases reach approximately 10 °C in the eastern (Amazonas, Roraima, and Pará) and southern (Rondônia, Mato Grosso, and parts of Bolivia) regions, which is up to 1 °C higher than in the RCP8.5 scenario. Additionally, deforestation causes a pronounced rise in TX90p across nearly the entire Amazon basin (Figure 4f), with increases of up to 100% in central-eastern (Amazonas and Pará), northern (Roraima), and southern (Rondônia and northern Mato Grosso) regions.
TNx also shows a marked increase across most of the basin under DEFOR (Figure 4g), with the most intense warming, approximately 9 °C, observed in central-eastern areas, including parts of Amazonas, Pará, and Mato Grosso. This pattern differs from that in RCP8.5 (Figure 3g), suggesting that minimum temperature increases could be even more extreme under deforestation alone. Finally, the frequency of very warm nights (TN90p) also increases significantly across the basin (Figure 4h), with the highest values, around 90%, in the eastern sector (border between Amazonas and Pará) and northern Mato Grosso.
Combined Scenarios
Combined effects of increased greenhouse gas (GHG) concentrations and deforestation led to a widespread increase in maximum daily temperature (TXx) across the Amazon basin during the rainy season. The warming was extensive throughout the region, highlighting the compounding influence of both factors on temperature extremes (Figure 5a). Anomalies reach values between 9°C and 10°C, revealing concerning spatial patterns and an intensification of heat extremes. The frequency of days with maximum temperatures above the 90th percentile (TX90p), relative to the control experiment, reaches 100% in almost the entire basin (Figure 5b). These increases in TXx and TX90p under the combined scenario (RCP8.5+DEFOR) exceed those observed in the individual RCP8.5 and DEFOR scenarios, evidencing synergistic effects between global warming and forest cover loss.
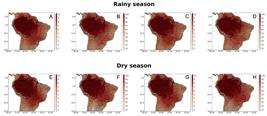
Anomalous values of the indices of temperature extremes, for the combined scenario, in the rainy season in the Amazon basin: (A) Maximum daily maximum temperature - TXx (°C); (B) Percentage of days with TX above the 90th percentile - TX90p (%); (C) Maximum daily minimum temperature - TNx (°C) and (D) Percentage of days with TN above the 90th percentile - TN90p (%). Amazon basin dry season: (E) Maximum daily maximum temperature - TXx (°C); (F) Percentage of days with TX above the 90th percentile - TX90p (%); (G) Maximum daily minimum temperature - TNx (°C) and (H) Percentage of days with TN above the 90th percentile - TN90p (%). Darker black points represent values that are statistically significant at the 95% confidence level. The darker black line indicates the boundaries of the Amazon basin.
Regarding daily minimum temperature (TNx), a significant anomalous increase is also observed, with values reaching up to 9°C in much of the basin (Figure 5c). The frequency of warm nights (TN90p) increases by about 90% across almost the entire region (Figure 5d), indicating a greater persistence of extremely hot nights even during the rainy season.
In the dry season, the combined impacts on temperature extremes become even more intense. TXx values reach the highest levels among all evaluated scenarios (Figure 5e), with notable increases in the eastern and southern regions of the basin. The frequency of very hot days (TX90p) increases by about 100% in nearly the entire basin (Figure 5f), indicating a substantial rise in the occurrence of extreme heat compared to current conditions.
Regional Impacts
The average anomalous values of temperature extreme indices indicate a consistent intensification of heat extremes across all scenarios, with the most pronounced anomalies occurring during the dry season under the combined effects of GHG increase and deforestation (Table 3). The northeastern sector of the basin was highlighted for presenting the most significant changes in all analyzed scenarios. During the rainy season, both the frequency and intensity of temperature extremes intensify across all three scenarios, with the greatest impact observed in the RCP8.5+DEFOR scenario. Interestingly, in this sector, the isolated deforestation scenario (DEFOR) has a greater impact than the isolated global warming scenario (RCP8.5), highlighting the crucial role of forest cover in regional thermal regulation.
Mean changes of temperature-based indices of climate extremes for the RCP8.5, DEFOR, and RCP8.5+DEFOR scenarios, for rainy and dry (values inside parentheses) seasons, in the Amazon basin. The values were calculated for the entire Amazon basin and also for the northeastern part of the basin (border between the states of Amazonas and Pará). The indices of climate extremes are highest annual maximum temperature (TXx), annual percentage of days when TX > 90th percentile (%) (TX90p), highest annual minimum temperature (TNx), and annual percentage of days when TN > 90th percentile (%) (TN90p).
In the dry season, impacts are even more pronounced across all indices (TXx, TX90p, TNx, and TN90p), reflecting the trend observed in the rainy season, but with greater magnitude. The most pessimistic scenario (RCP8.5+DEFOR) causes the highest average increases, especially in the northeastern sector of the basin. Daily minimum temperature (TNx) is also significantly affected, with increases covering almost the entire basin (Figure 5g). The same occurs with TN90p (Figure 5h), reinforcing the trend of a greater frequency of hot days and nights throughout the year under the combined scenario.
DISCUSSION
This study aimed to assess the individual and combined effects of increased greenhouse gas (GHG) concentrations and Amazon deforestation on temperature extreme indices (TXx, TNx, TX90p, and TN90p), using high-resolution regional climate simulations. Our findings demonstrate that both drivers significantly intensify heat extremes across the Amazon basin, with the most severe anomalies occurring during the dry season. The combined scenario (RCP8.5+DEFOR) produced the highest increases in maximum and minimum daily temperatures and in the frequency of hot days and nights, with anomalies reaching up to 10 °C and frequency increases nearing 100%, particularly in the northeastern sector of the basin. Interestingly, in some areas, the isolated deforestation scenario exerted a stronger impact than the isolated GHG increase, emphasizing the critical role of forest cover in regional climate regulation (Lucas et al. 2025; Reboita et al. 2022; Sabino et al. 2020). These results reveal the synergistic and alarming consequences of ongoing deforestation and climate change on Amazonian temperature extremes, underscoring the urgent need for mitigation and adaptation measures to safeguard the resilience of the region.
The intensification of temperature extremes observed in this study can be attributed to both the direct radiative forcing from elevated GHG concentrations and the regional biophysical changes induced by deforestation. Increased GHGs reduce outgoing longwave radiation, enhancing the greenhouse effect and leading to higher air temperatures globally and regionally (Harries et al. 2001; Raghuraman et al. 2023). This indicates a considerable rise in extreme temperatures under the RCP8.5 scenario, with a similar trend projected for the late 21st century (Sillmann et al. 2013). Meanwhile, deforestation decreases evapotranspiration, reduces latent heat flux, and increases sensible heat flux, amplifying surface warming (Nobre et al. 1991; Sampaio et al. 2018; Sabino et al. 2020). This highlights the strong warming effect of deforestation, even without additional greenhouse gas forcing. These processes are further exacerbated during the dry season, when lower soil moisture and reduced cloud cover intensify heating (Sillmann et al. 2013; Lyra et al. 2018; Lucas et al. 2025). This thermal intensification underscores the crucial role of forest cover in regulating regional temperatures, particularly during the dry season. Our findings align with previous studies suggesting that deforestation and climate change act synergistically, reducing the resilience of the Amazon to extreme events (Boers 2021; Brito et al. 2022).
The rise in extreme maximum and minimum temperatures in this study is partly driven by the so-called “physiological forest effect,” which is represented in the models used here. This effect, stemming from elevated atmospheric CO₂ that induces stomatal closure and increases plant water-use efficiency, contributes to reduced transpiration and higher temperatures in the simulations (Betts et al. 2007; Cao et al., 2010; Reboita et al. 2022). This reduces evapotranspiration and triggers a climate feedback cycle that includes decreased precipitation (Marengo et al. 2018), increased sensible heat flux, and warming of the forest canopy. These findings are consistent with Sillmann et al. (2013), who used multimodel simulations and reanalysis datasets to show that increased GHGs elevate temperatures in the Amazon basin. Lower soil moisture further contributes to this process by altering the energy partition and resulting in temperature increases, especially evidenced by higher Bowen ratios in the Amazon region (Good et al. 2015; Lucas et al. 2025). The decrease in evapotranspiration also reduces cloud cover and atmospheric moisture, limiting longwave radiation retention and raising minimum temperatures (TNx). These results indicate that higher GHG concentrations would lead to elevated nighttime temperatures, creating extremely warm periods by the late 21st century. This nighttime warming is associated with the energy-trapping effect of increased GHGs, as captured by the rise in TN90p, highlighting the forest’s role in regulating both regional and global climate (Alves 2016; Sabino et al. 2020). The replacement of forest by degraded pastures worsens this scenario, increasing surface temperatures and further reducing evapotranspiration. Despite the potential temperature reduction due to lower surface roughness, the dominant effect of reduced evapotranspiration prevails (Findell et al. 2006; Correia et al. 2007; Reboita et al. 2022).
The combined scenario of deforestation and GHG increase exerts a more pronounced impact on the frequency and intensity of extreme temperature events than the individual scenarios. For instance, the intensity and frequency of extreme temperatures under the combined scenario were approximately up to 30% higher than under the RCP8.5 scenario and 10% higher than under the DEFOR scenario, highlighting the synergistic nature of these factors. These results suggest that an extended dry season caused by deforestation may locally amplify warming and further contribute to rainfall decline, as also reported by Swann et al. (2016).
The conversion of forest to pasture drastically reduces vegetation’s water storage and transpiration capacity (Correia et al. 2007; Sabino et al. 2020), alters temperature and pressure gradients, and favors increased sensible heat flux (Gash and Nobre 1997). Regardless of the scenario, there is a trend toward hotter and more frequent nights (TNx and TN90p), as well as hotter and more frequent days (TXx and TX90p) in the Amazon by the end of the 21st century, indicating a higher occurrence of such days, even in the rainy season. Similar patterns were noted by López-Franca et al. (2016) and Reboita et al. (2022) when analyzing temperature extremes across South America. This sharp rise in nighttime temperatures may intensify thermal stress on both human populations and ecosystems, especially in vulnerable communities that depend directly on local natural resources. These findings reinforce the vital role of Amazon forest cover in regulating regional climate. Its removal could lead to thermal impacts as severe as, or even greater than, those projected under high-emission scenarios, with profound ecological and social consequences. Such a combination may result in significant reductions in forest cover, biodiversity, and ecosystem services, as well as impacts on human livelihoods, causing severe localized environmental and socioeconomic repercussions (Marengo et al. 2017). Previous studies, such as Costa at al. (2010), have already pointed out that deforestation can induce substantial increases in both maximum and minimum temperatures, reinforcing the relevance of interactions between global climate change and land-use transformations.
Furthermore, changes in atmospheric circulation patterns associated with sea surface warming in the Pacific and Atlantic Oceans, intensified by increasing GHGs, contribute to reduced precipitation and increased temperature in the Amazon (Nobre and Shukla 1996; Ropelewski and Halpert 1986; Sabino et al. 2020). The reduction in surface roughness, in addition to affecting turbulent heat and moisture fluxes, reinforces warming over deforested areas (Lean and Rowntree 1993). With continued forest cover loss, the Amazonian climate system may become increasingly vulnerable to positive feedback processes that favor a transition to a new, warmer, and drier climate state.
CONCLUSIONS
This study demonstrates that the combined effects of increased greenhouse gases and deforestation significantly intensify temperature extremes in the Amazon basin, and deforestation alone can produce warming comparable to or greater than global warming scenarios. These results advance the understanding of how land-use change and climate change interact to amplify regional warming and undermine ecosystem resilience, highlighting the critical role of forest cover in moderating extreme heat events. Our results highlight the need for integrated mitigation and adaptation strategies that consider not only GHG emission control but also forest cover preservation. Protecting the Amazon is, therefore, a critical action for regional climate stability. Future research should explore the thresholds of ecosystem and societal vulnerability, improve projections of extreme events under combined forcings, and support land-use policies and climate adaptation planning to safeguard the Amazon and its communities.
ACKNOWLEDGMENTS
The authors would like to thank the National Institute for Amazonian Research (INPA), the State University of Amazonas (UEA), the National Institute for Space Research (INPE), the Center for Weather Forecasting and Climate Studies (CPTEC), and the Laboratory for Climate System Modeling (LABCLIM) for their logistical support, laboratory infrastructure, physical space, and access to computational resources. The first author (ALB) also thanks the Graduate Program in Climate and Environment (PPG-CLIAMB) for the academic training provided during the Ph.D. through its courses and guidance. Additionally, we express our gratitude to the Coordination for the Improvement of Higher Education Personnel (CAPES) for the financial support through the fellowships granted (Nos. 88887.318904/2019-00 and 88882.447496/2019-01), as well as to the National Council for Scientific and Technological Development (CNPq) (process number 406551/2022-7) for supporting this research and providing a postdoctoral fellowship to ALB.
REFERENCES
- Ahlström, A.; Canadell, J. G.; Schurgers, G.; Wu, M.; Berry, J. A.; Guan, K.; et al 2017. Hydrologic resilience and Amazon productivity. Nature Communications 8: 1-9.
- Alexander, L. V.; Zhang, X.; Peterson, T. C.; Caesar, J.; Gleason, B.; Tank, A. M. G.; et al 2006. Global observed changes in daily climate extremes of temperature and precipitation. Journal of Geophysical Research 111: 1-22.
- Almeida, C.; Oliveira-Júnior, J.; Delgado, R.; Costa, M. H.; Pires, G.; Marengo, J.; et al 2017. Spatiotemporal rainfall and temperature trends throughout the Brazilian Legal Amazon, 1973-2013. International Journal of Climatology 37: 2013-2026.
- Aragão, L. E. O. C.; Anderson, L. O.; Fonseca, M. G.; Silva, C. V. J.; Lima, A.; Shimabukuro, Y. E.; et al 2018. 21st Century drought-related fires counteract the decline of Amazon deforestation carbon emissions. Nature Communications 9: 1-12.
- Artaxo, P. 2020. As três emergências que nossa sociedade enfrenta: saúde, biodiversidade e mudanças climáticas. Estudos Avançados 34: 53-66.
- Alves, L. M. 2016. Análise estatística da sazonalidade e tendência das estações chuvosas e seca na Amazônia: clima presente e projeções futuras. Doctoral thesis. Instituto Nacional de Pesquisas Espaciais, Brazil,163p.
- Betts, A.K.; Miller, M.J. 1993. The Betts-Miller scheme. In: Emanuel, K.A.; Raymond, D.J. (Eds.). The representation of cumulus convection in numerical models Meteorological Monographs. American Meteorological Society, Boston, MA, 9: 107-121.
- Betts, R. A.; Boucher, O.; Collins, M.; Cox, P. M.; Falloon, P. D.; Gedney, N.; et al 2007. Projected increase in continental runoff due to plant responses to increasing carbon dioxide. Nature 448: 1037-1041.
- Boers, N. 2021. Publisher correction: Observation-based early-warning signals for a collapse of the Atlantic Meridional Overturning Circulation. Nature Climate Change 11: 680-688.
- Boulton, C. A.; Lenton, T. M.; Boers, N.; Smith, P.; Wang-Erlandsson, L.; Rocha, J.; et al 2022. Pronounced loss of Amazon rainforest resilience since the early 2000s. Nature Climate Change 12: 271-278.
- Brito, A. L.; Veiga, J. A. P.; Correia, F. W. S.; Michiles, A. A.; Capistrano, V. B.; Chou, S. C.; et al. 2022. Impactsof greenhouse gases and deforestation in Amazon Basin climate extreme indices. Climate Research 88: 39-56.
- Cao, L.; Bala, G.; Caldeira, K.; Jones, C.; Friedlingstein, P.; Brovkin, V.; et al 2010. Importance of carbon dioxide physiological forcing to future climate change. PNAS 107: 9513-9518.
- Chou, S. C.; Lyra, A.; Mourão, C.; Dereczynski, C.; Pilotto, I.; Gomes, J. L.; et al 2014. Assessment of climate change over South America under RCP 4.5 and 8.5 downscaling scenarios. American Journal of Climate Change 3: 512-525.
- Collins, W. J.; Bellouin, N.; Doutriax-Boucher, M.; Gedney, N.; Halloran, P.; Hinton, T.; et al 2011. Development and evaluation of an Earth-system model - HadGEM2. Geoscientific Model Development 4: 1051-1075.
- Correia, F. W. S.; Manzi, A. O.; Cândido, L. A.; Santos, R. M. N.; Pauliquevis, T. 2007. Balanço de umidade na Amazônia e sua sensibilidade às mudanças na cobertura vegetal. Ciência e Cultura, 59: 39-43.
- Costa, M. H.; Pires, G.; Silva Dias, M. A. F.; Nobre, C. A.; Cardoso, M.; Rocha, H.; et al 2010. Effects of Amazon and Central Brazil deforestation scenarios on the duration of the dry season in the arc of deforestation. International Journal of Climatology 30: 1970-1979.
- Da Silva, R. S.; Brown, F.; Sampaio, A. C. N.; Marengo, J. A.; Costa, M. H.; Cardoso, M.; et al 2023. Amazon climate extremes: Increasing droughts and floods in Brazil’s state of Acre. Perspectives in Ecology and Conservation 21: 311-317.
- Ek, M. B.; Mitchell, K. E.; Lin, Y.; Rogers, E.; Grunmann, P.; Koren, V.; et al 2003. Implementation of NOAH land surface advances in the National Centers for Environmental Prediction operational mesoscale Eta Model. Journal of Geophysical Research: Atmospheres 108: 1-16.
- Fels, S. B.; Schwarzkopf, M. D. 1975. The simplified exchange approximation: a new method for radiative transfer calculations. Journal of the Atmospheric Sciences 32: 1475-1488.
- Findell, K. L.; Knutson, T. R.; Milly, P. C. D.; Delworth, T. L.; Stouffer, R. J.; Dixon, K. W.; et al 2006. Weak simulated extratropical responses to complete tropical deforestation. Journal of Climate 19: 2835-2850.
- Flores, B.M.; Montoya, E.; Sakschewski, B.; Nascimento, N.; Staal, A.; Betts, R.A.; et al 2024. Critical transitions in the Amazon forest system. Nature 626: 555-564.
- Gadd, A. J. 1978. A split-explicit integration scheme for numerical weather prediction. Quarterly Journal of the Royal Meteorological Society 104: 569-582.
- Gash, J. H. C.; Nobre, C. A.; Roberts, J. M.; Victoria, R. L.; Jarvis, P. G.; Shuttleworth, W. J.; et al 1997. Climatic effects of Amazonian deforestation: some results from ABRACOS. Bulletin of the American Meteorological Society 78: 823-830.
- Gomes, W. B.; Correia, F. W. S.; Capistrano, V. B.; Veiga, J. A. P.; Vergasta, L. A.; Chou, S. C.; Lyra, A. A.; Nobre, P.; Rocha, V. M. 2020. Water budget changes in the Amazon basin under RCP 8.5 and deforestation scenarios. Clim. Res. 80: 105-120.
- Good, P.; Jason, A. L.; Timothy, A.; Booth, B.; Collins, M.; Lowe, J.; et al 2015. Nonlinear regional warming with increasing CO₂ concentrations. Nature Climate Change 5: 138-142.
- Harries, J. E.; Brindley, H. E.; Sagoo, P. J.; Bantges, R. J. 2001. Increases in greenhouse forcing inferred from the outgoing longwave radiation spectra of the Earth in 1970 and 1997. Nature 410: 355-357.
-
INPE. 2017. Projeto Prodes: Monitoramento da floresta Amazônica Brasileira por satélite. Instituto Nacional de Pesquisas Espaciais. ( (http://www.obt.inpe.br/prodes/index.html ). Accessed on 29 Sep 2023.
» http://www.obt.inpe.br/prodes/index.html - Jiménez-Muñoz, J. C.; Sobrino, J. A.; Mattar, C.; Malhi, Y. 2013. Spatial and temporal patterns of the recent warming of the Amazon forest. Journal of Geophysical Research: Atmospheres 118: 5204-5215.
- Jiménez-Muñoz, J. C.; Mattar, C.; Barichivich, J.; Karky, B. S.; Aragão, L. E. O. C.; Vicente-Serrano, S. M.; et al 2016. Record-breaking warming and extreme drought in the Amazon rainforest during the course of El Niño 2015-2016. Scientific Reports 6: 1-7.
- Lacis, A. A.; Hansen, J. E. A. 1974. Parameterization of the absorption of solar radiation in earth’s atmosphere. Journal of the Atmospheric Sciences 31: 118-133.
- Laurance, W. F.; Cochrane, M. A.; Bergen, S.; Fearnside, P. M.; Delamonica, P.; Barber, C.; et al 2001. The future of the Brazilian Amazon. Science 291: 438-439.
- Lawrence, D.; Vandecar, K. 2015. Effects of tropical deforestation on climate and agriculture. Nature Climate Change 5: 27-36.
- Lapola, D.; Pinho, P.; Barlow, J.; Berenguer, E.; Carmenta, R.; Lees, A.; et al 2023. The drivers and impacts of Amazon forest degradation. Science 379: eabp8622.
- Lean, J.; Rowntree, P. R. 1993. A GCM simulation of the impact of Amazonian deforestation on climate using an improved canopy representation. Quarterly Journal of the Royal Meteorological Society 119: 509-536.
- Lejeune, Q.; Davin, E. L.; Guillod, B. P.; Seneviratne, S. I. 2014. Influence of Amazonian deforestation on the future evolution of regional surface fluxes, circulation, surface temperature and precipitation. Climate Dynamics 44: 2769-2786.
- Li, W. H.; Fu, R.; Juárez, R. I. N.; Fernandes, K.; Chen, M.; Coelho, C. A. S.; et al 2006. Influence of cold air intrusions on the wet season onset over Amazonia. Journal of Climate 19: 257-275.
- Lovejoy, T. E.; Nobre, C. 2018. Amazon tipping point. Science Advances 4: eaat2340.
- Lyra, A.; Tavarez, P.; Chou, S. C.; Dereczynski, C.; Pilotto, I.; Gomes, J. L.; et al 2018. Climate change projections over three metropolitan regions in Southeast Brazil using the non-hydrostatic Eta regional climate model at 5-km resolution. Theoretical and Applied Climatology 132: 663-682.
- Lucas, E. W. M.; Sousa, F. A. S.; Silva, F. D. S.; Rocha Júnior, R. L.; Pinto, D. D. C.; Silva, V. P. R. 2025. Trends in climate extreme indices assessed in the Xingu river basin - Brazilian Amazon. Weather and Climate Extremes 31: 1-10.
- López-Franca, N.; Zaninelli, P. G.; Carril, A. F.; Menéndez, C. G.; Remedio, A. R. C.; Solman, S.; et al 2016. Changes in temperature extremes for 21st century scenarios over South America derived from a multi-model ensemble of regional climate models. Climate Research 68: 151-167.
- Magrin, G. O.; Field, C. B.; Barros, V. R.; Dokken, D. J.; Mastrandrea, M. D.; Mach, K. J.; et al 2014. Central and South America. In: Field, C. B.; Dokken, D. J.; Mastrandrea, M. D.; Mach, K. J.; Bilir, T. E.; Chatterjee, M.; et al (Eds.). Climate Change 2014: Impacts, Adaptation, and Vulnerability Cambridge University Press, p. 1499-1566.
- Marengo, J.; Torres, R.; Alves, L. 2017. Drought in Northeast Brazil - past, present, and future. Theoretical and Applied Climatology 129: 1189-1200.
- Marengo, J.; Souza, C.; Thonicke, K.; Burton, C.; Halladay, K.; Betts, R.; et al 2018. Changes in climate and land use over the Amazon region: current and future variability and trends. Frontiers in Earth Science 6: 1-21.
- Marengo, J. A.; Espinoza, J.-C.; Fu, R.; Jiménez-Muñoz, J. C.; Alvez, L.-M.; da Rocha, H.-R.; Schöngart, J. 2024. Long-term variability, extremes and changes in temperature and hydrometeorology in the Amazon region: A review. Acta Amazonica 54: e54es22098.
- Martin, G. M.; Bellouin, N.; Collins, W. J.; Culverwell, I. D.; Halloran, P. R.; Hardiman, S. C. et al 2011. The HadGEM2 family of met Office unified model climate configurations. Geoscientific Model Development 4: 723-757.
- Mellor, G. L. and Yamada, T. 1982. Development of a turbulence closure model for geophysical fluid problems. Reviews of Geophysics 20: 851-875.
- Mesinger, F. 1984. A blocking technique for representation of mountains in atmospheric models. Rivista di Meteorologia Aeronautica 44: 195-202.
- McGree, S.; Herold, N.; Alexander, L.; Schreider, S.; Kuleshov, Y.; Ene, E.; et al 2019. Recent changes in mean and extreme temperature and precipitation in the Western Pacific Islands. Journal of Climate 32: 4919-4941.
- Nobre, C. A.; Sellers, P. J.; Shukla, J.; Marengo, J. A.; Costa, M. H.; Avissar, R.; et al 1991. Amazonian deforestation and regional climate change. Journal of Climate 4: 957-988.
- Nobre, C. A.; Shukla, J. 1996. Variations of sea surface temperature, wind stress, and rainfall over the tropical Atlantic and South America. Journal of Climate 9: 2464-2479.
- Nobre, P.; Siqueira, L. S. P.; de Almeida, R. A. F.; Malagutti, M.; Giarolla, E.; Capistrano, V. B.; et al 2013. Climate simulation and change in the Brazilian Climate Model. Journal of Climate 26: 6716-6732.
- Nobre, C. A.; Marengo, J. A.; Seluchi, M. E.; Cuartas, L. A.; Alves, L. M.; Oliveira, G. S.; et al 2016. Some characteristics and impacts of the drought and water crisis in Southeastern Brazil during 2014 and 2015. Journal of Water Resource and Protection 8: 252-262.
- Oliveira, B. F. A.; Bottino, M. J.; Nobre, C. A. 2021. Deforestation and climate change are projected to increase heat stress risk in the Brazilian Amazon. Communications Earth & Environment 2: 207.
- Piao, S.; Zhang, X.; Chen, A.; Liu, Q.; Lian, X.; Wang, X.; et al 2019. The impacts of climate extremes on the terrestrial carbon cycle: A review. Science China Earth Sciences 62: 1-14.
- Raghuraman, S. P.; Paynter, D.; Ramaswamy, V.; Menzel, R.; Huang, X. 2023. Greenhouse gas forcing and climate feedback signatures identified in hyperspectral infrared satellite observations. Geophysical Research Letters 50: e2023GL103947.
- Reboita, M. S.; Kuki, C. A. C.; Marrafon, V. H.; de Souza, C. A.; Ferreira, G. W. S.; Teodoro, T.; Lima, J. W. M. 2022. South America climate change revealed through climate indices projected by GCMs and Eta-RCM ensembles. Climate Dynamics 58: 459-485.
- Ropelewski, C. F.; Halpert, M. S. 1986. North American precipitation and temperature patterns associated with the El Niño Southern-Oscillation (ENSO). Monthly Weather Review 114: 2352-2362.
- Sabino, M.; Silva, J.B.; Costa, R.O.; Duarte, L.G.; Souza, A.P. 2020. Biophysical parameters and extreme air temperature indices in the Cerrado-Amazonia transition. Sociedade & Natureza 32: 490-500.
- Sampaio, G.; Borma, L. S.; Cardoso, M.; Cury, R.; Mariotti, L.; Nobre, C. A.; et al 2018. Assessing the possible impacts of a 4ºC or higher warming in Amazonia. In: Nobre, C. A.; Marengo, J. A.; Soares, W. R. (Eds.). Climate Change Risks in Brazil Springer Cham, Switzerland. p. 225-249.
- Sestini, M. F.; dos Santos Alvalá, R. C.; Mello, E. M. K.; Valeriano, D. M.; Santos, L. P.; Cardoso, M.; et al 2002. Elaboração de mapas de vegetação para utilização em modelos meteorológicos e hidrológicos. INPE-8972-RPQ/730, INPE, São José dos Campos.
- Sillmann, J.; Kharin, V.; Zwiers, F.; Zhang, X.; Bronaugh, D.; Peterson, T.; et al 2013. Climate extremes indices in the CMIP5 multimodel ensemble: part 2. Future climate projections. Journal of Geophysical Research: Atmospheres 118: 2473-2493.
- Silvério, D. V.; Brando, P. M.; Macedo, M. N.; Beck, P. S. A.; Bustamante, M.; Coe, M. T.; et al 2015. Agricultural expansion dominates climate changes in southeastern Amazonia: the overlooked non-GHG forcing. Environmental Research Letters 10: 104015.
- Smith, C.; Baker, J. C. A.; Spracklen, D. V. 2023. Tropical deforestation causes large reductions in observed precipitation. Nature 615: 270-275.
- Swann, A. L.; Hoffman, F. M.; Koven, C. D.; Randerson, J. T.; Bonan, G. B.; Riley, W. J.; et al 2016. Plant responses to increasing CO₂ reduce estimates of climate impacts on drought severity. PNAS 113: 10019-10024.
- Spiegel, M.R. 1977. Probabilidade e Estatística MAKRON Books do Brasil Editora Ltda, São Paulo. 518p.
- Spracklen, D. V.; Garcia-Carreras, L. 2015. The impact of Amazonian deforestation on Amazon basin rainfall. Geophysical Research Letters, 42: 9546-9552.
- Spracklen, D. V.; Baker, J. C. A.; Garcia-Carreras, L.; Marsham, J. H.; Bonan, G.; Findell, K.; et al 2018. The effects of tropical vegetation on rainfall. Annual Review of Environment and Resources 43: 14.1-14.2.
- Vasconcelos, M. A.; Veiga, J. A. P.; Silva, J. L. G.; Guimarães, D. F.; Brito, A. L.; Santos, Y. L. F.; et al 2022. Climate change and its impact on the agricultural calendar of riverine farmers in Médio Juruá, Amazonas State, Brazil. Atmosphere 13: 1-15.
- Yin, L.; Fu, R.; Shevliakova, E. and Dickinson, R. E. 2013. How well can CMIP5 simulate pre-cipitation and its controlling processes over tropical South America. Climate Dynamics 41: 3127-3143.
- Weng, W.; Luedeke, M.K.B.; Zemp, D.C.; Lakes, T.; Kropp, J.P. 2018. Aerial and surface rivers: downwind impacts on water availability from land use changes in Amazonia. Hydrology and Earth System Sciences 22: 911-927.
- Zhang, X.; Zhang, X.; Zwiers, F.W.; Hegerl, G.C.; Li, G.; Wang, X.L.; et al 2011. Indices for monitoring changes in extremes based on daily temperature and precipitation data. Wiley Interdisciplinary Reviews: Climate Change 2: 851-870.
- Zhao, Q.; Black, T. L. and Baldwin, M.E. 1997. Implementation of the cloud prediction scheme in the eta model at NCEP. Weather and Forecasting 12: 697-712.
- Zemp, D. C.; Schleussner, C. F.; Barbosa, H. M.; van der Ent, R. J.; Donges, J. F.; Heinke, J. et al 2014. On the importance of cascading moisture recycling in South America. Atmospheric Chemistry and Physics 14: 13337-13359.
CITE AS:
Data availability
The data that support the findings of this study are available, upon reasonable request, from the corresponding author, Adriane L. Brito.