 Feeding Ecology and Microplastic Contamination of Planktophagous Fishes in a tropical Southwestern Atlantic Estuarine Ecosystem
Abstract
This study describes the spatial and temporal distribution of density and biomass, feeding ecology and contamination by microplastics (MPs) in <italic>A. clupeoides</italic> and <italic>C. edentulus</italic> in the Goiana Estuary. <italic>A. clupeoides</italic> were found in all portions of the estuary, mainly in the late rainy and late dry seasons. <italic>C. edentulus</italic> was found in the upper and lower portions of the estuary mainly in the late dry season. <italic>A. clupeoides</italic>’ adult specimens fed mainly on copepods in the lower estuary during the beginning of the rainy season when they were contaminated by black MPs. <italic>A. flexuosa</italic> larvae were consumed by subadults in the lower portion during the final rainy season and by juveniles in the lower portion during the end of the dry season when they were contaminated by the same type and color of MPs. The species <italic>C. edentulus</italic> both adults and subadults feed on <italic>Coscinodiscus sp</italic>. and <italic>Actinopthycus sp</italic>. in the lower portion during the final rainy season. At this time, adults were contaminated by blue MPs. MPs’ samples were analyzed by FTIR, were composed of polyethylene<italic>.</italic>
Key words
Engraulidae; Fish Contamination; Plankton feeder; Polyethylene Fibers
INTRODUCTION
The estuarine ecosystem, a cornerstone in coastal areas’ ecological, social, and economic structuring, is of paramount importance (Odum 1984). Its diverse habitats, suitable for reproduction, feeding, growth, and protection, foster a high biodiversity that underpins ecological and contamination interactions in the trophic web of an aquatic ecosystem (Ferreira et al. 2019a). Moreover, its role as a transitional zone between continental and marine ecosystems provides a gradient for physical-chemical parameters, such as salinity, which are influenced by seasonal variability. This seasonal fluctuation forms an ecocline characterized by a succession of species along the estuary (Barletta et al. 2005, Barletta et al. 2008). Any modification in this ecosystem can have profound implications, altering the river flow and, consequently, the saline ecocline and its fauna in an estuarine ecosystem (Barletta et al. 2016).
However, the seasonal fluctuation of physical-chemical parameters does not seem to be a problem for estuarine productivity since many fish species reproduce in these environments when they find ideal conditions for each species that use the estuarine ecosystem to complete its life cycle (Whitfield et al. 2023). Although some of these species may also have reproductive populations in marine environments or even in adjacent freshwater environments, this does not change the fact that these species depend on estuarine ecosystems to complete their life cycle. Considering this information about the environmental characteristics of an estuarine ecosystem, estuarine and/or marine plankton feeders’ species could be affected by changes in the composition, concentration, and quality of plankton in these ecosystems.
Two exemplary plankton feeder species in the Goiana River estuary are Anchovia clupeoides and Cetengraulis edentulus (Swainson 1839), commonly known as manjubas (anchovies). These species are remarkable for utilizing the tropical estuarine ecosystems of the Western Atlantic to complete their life cycle (Froese & Pauly 2024). The planktophagous species (Sequine et al. 2018), they serve as food item for adults’ diet of Cynoscion acoupa (Ferreira et al. 2016), Centropomus spp. (Ferreira et al. 2019a) and Rhizoprionodon porosus (Melo et al. 2024). Their role as a link between primary consumers and higher trophic levels is undeniable.
In studies carried out in an estuary located in the eastern Amazon by Barletta-Bergan et al. (2002a), Barletta-Bergan et al. (2002b) and Barletta et al. (2003), Barletta et al. (2005), the authors concluded that A. clupeoides and C. edentulus are some of the most important species, both in density and biomass, in this ecosystem estuarine. The density of each species varies according to the seasonal fluctuation of salinity, influencing its distribution in the different habitats of this ecosystem. The same trend was observed for the larvae of these species in the Goiana River estuary (Northeast - Brazil) (Lima et al. 2015). However, studies on the ecology of contamination by microplastics (MPs) for these species have not yet been carried out in this estuary.
The studies carried in this estuary out, aimed to describe the spatiotemporal distribution, feeding ecology and contamination by MPs in fish belonging to higher trophic levels, highlighting the species of marine catfish (Dantas et al. 2013), mojaras (Ramos et al. 2016), grants (Silva et al. 2018), drums (Dantas et al. 2015, Ferreira et al. 2016, Ferreira et al. 2018) and snook (Ferreira et al. 2019a, Ferreira et al. 2019b). All these studies concluded that there is a change in diet between each ontogenetic stage throughout their life cycle. Furthermore, each ontogenetic stage utilizes different portions of the estuarine ecosystem to satisfy its physiological and biological demands. For example, depending on the season, different fish species can use the upper portion of the estuary as a nursery (Dantas et al. 2015, Ramos et al. 2016, Silva et al. 2018). During the time that estuarine and/or marine species spend in an estuarine ecosystem, the different ontogenetic stages of these fish species are vulnerable to contamination by MPs while feeding (Browne et al. 2008, Rochman et al. 2013). These emerging concerns result from reports that estuarine habitats will likely be contaminated with MPs (Lebreton et al. 2017, Lusher et al. 2017). Since A. clupeoides and C. edentulus are plankton filter feeders, it is believed that the contamination by MPs in these species comes through the seston.
In the Goiana River estuary, the seasonal variation, trophic ecology, and contamination by MPs of planktophagous species (primary and secondary consumers) have not yet been thoroughly investigated. Therefore, A. clupeoides and C. edentulus, important species in energy flow and contamination by MPs at higher trophic levels, require urgent attention. Based on this information, this study has a hypothesis to test whether the seasonal fluctuation of physicochemical parameters influences the distribution and feeding ecology and contamination by microplastics in the different ontogenetic phases of A. clupeoides and C. edentulus in the Goiana River estuary.
MATERIAL AND METHODS
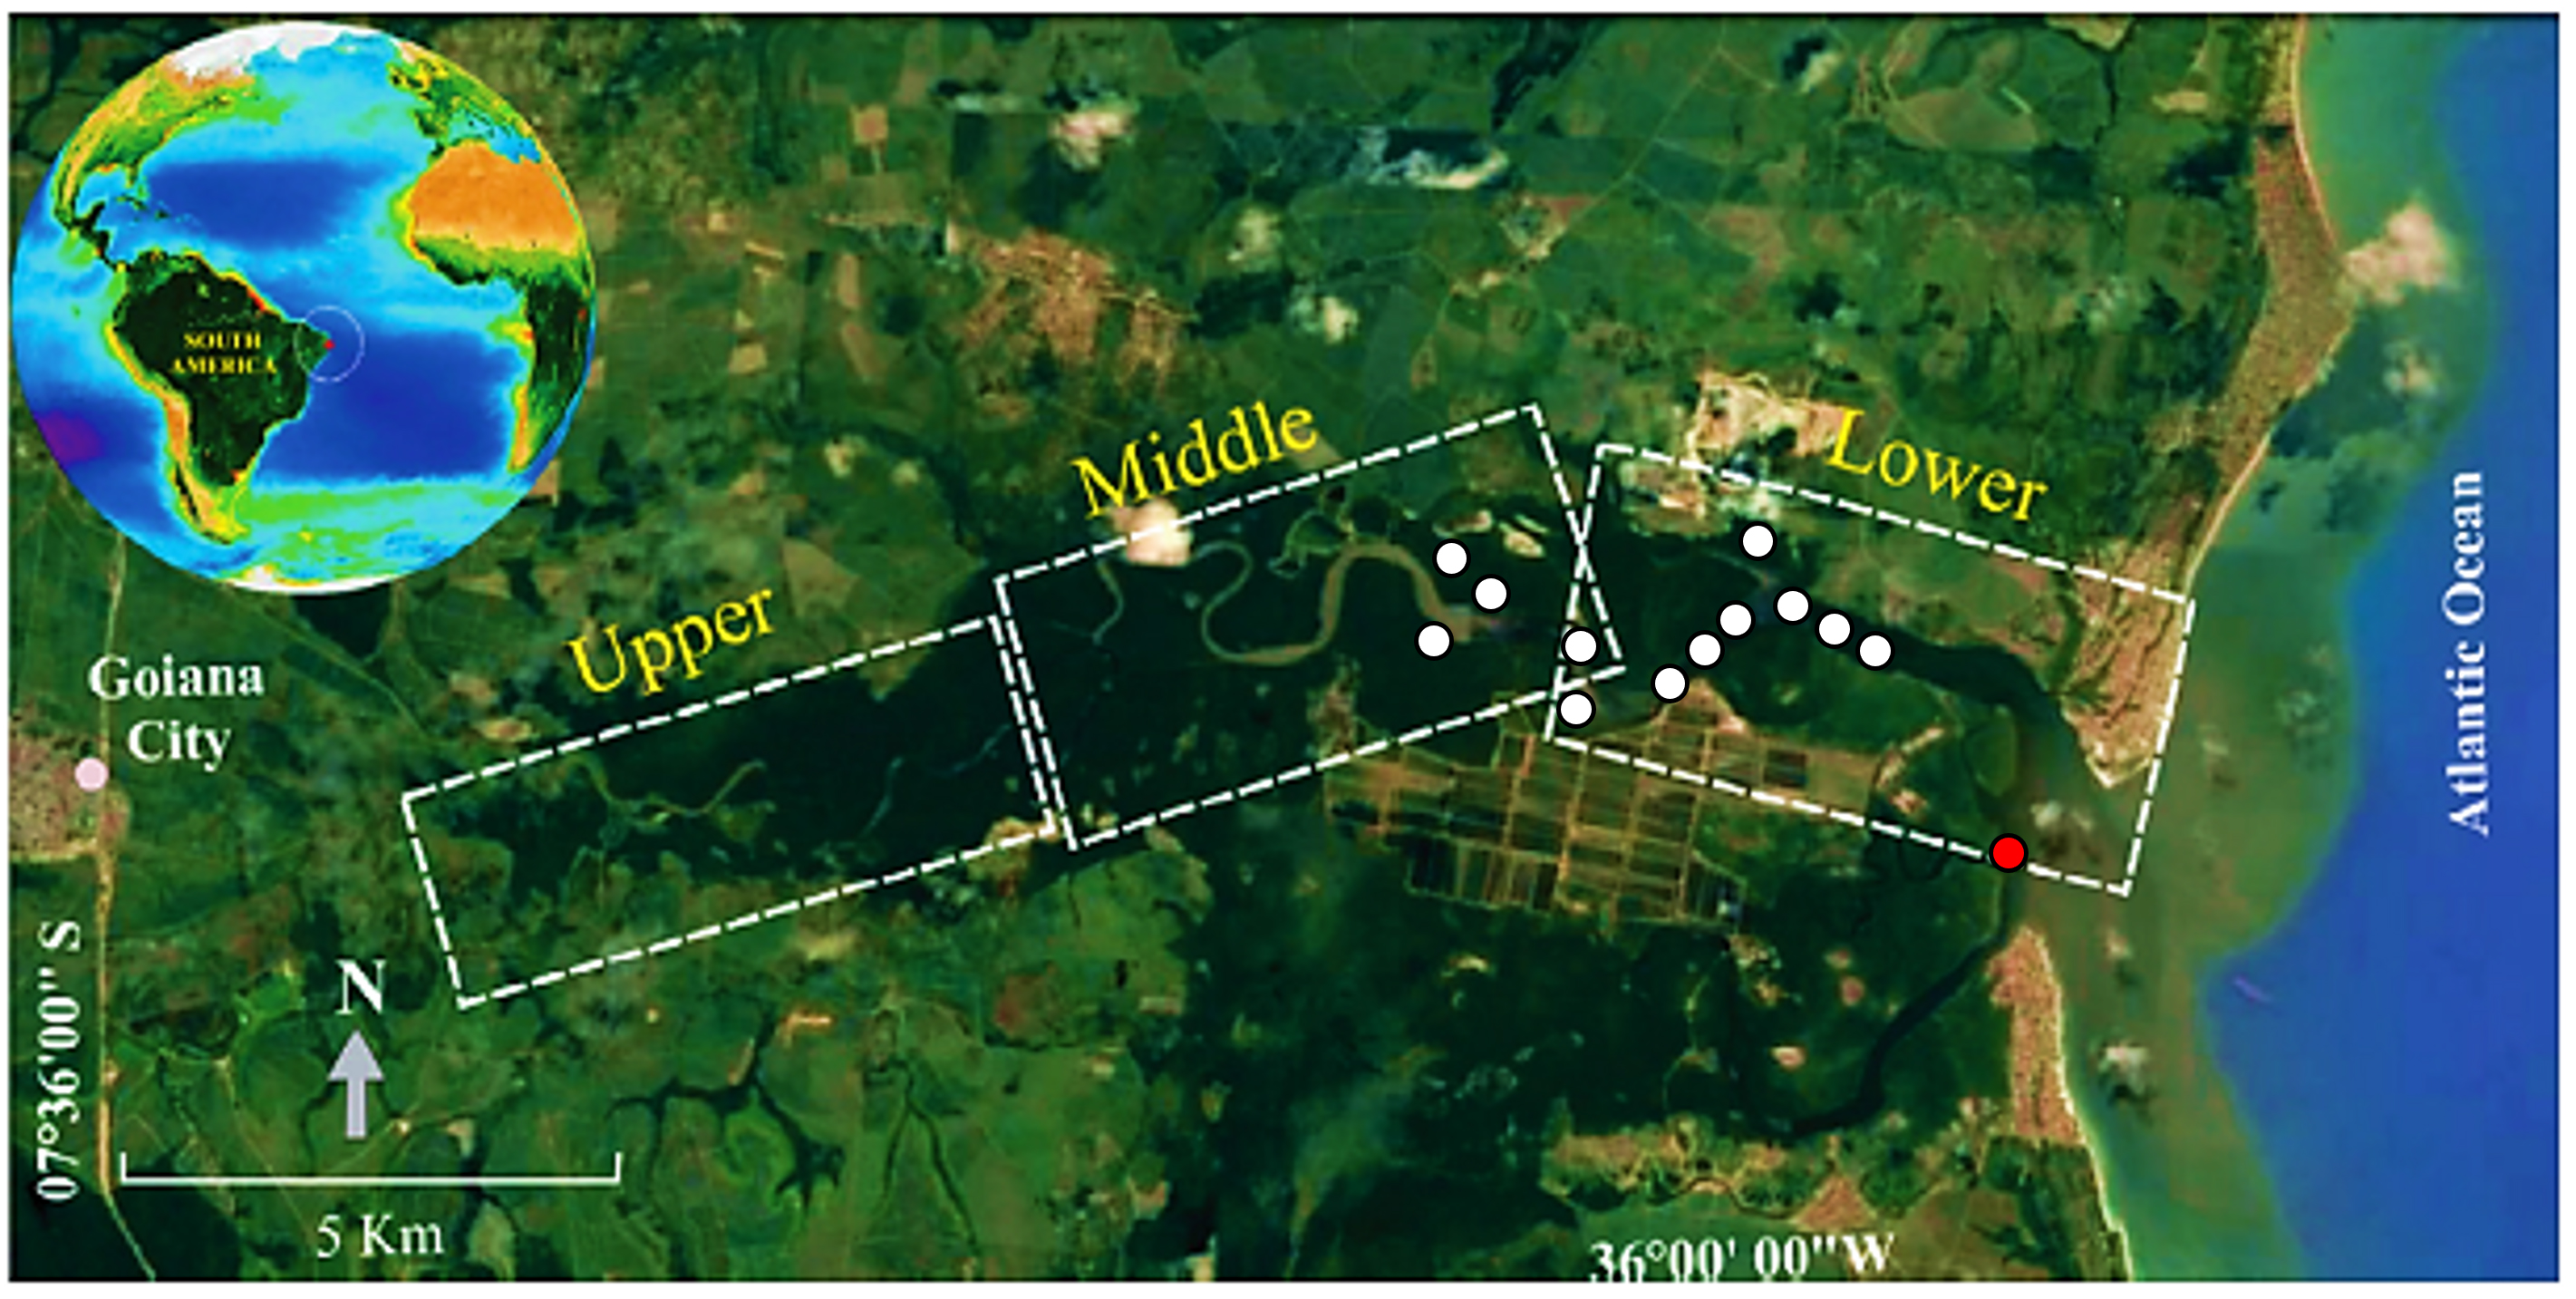
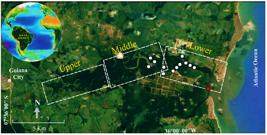
The Goiana River estuary, an ecosystem located in northeastern Brazil (Figure 1), spans a total area of 4700 ha. It is home to a diverse range of coastal habitats, each playing a key role in the region’s biodiversity. These habitats include the main river channel, the tidal flat, the surrounding mangrove forest, the sandy beaches at the estuary’s mouth, and the coastal region influenced by the river plume (Barletta & Costa 2009). The main channel is divided based on its morphology and salinity into an upper portion (Area 1: salinity < 5), intermediate (Area 2: salinity 5 – 20), and lower portion (Area 3: salinity > 20).
Due to its socioeconomic and biodiversity importance, in 2007, an environmental conservation unit was created in the Goiana River estuary (Resex Acaú-Goiana, PE/PB), whose main objective is to develop the sustainable use of natural resources by traditional populations. The region’s climate is classified as tropical, with an average air temperature of 28 ± 2 °C. According to the rainfall pattern, the seasonality of this environment presents four seasons: the beginning of the rain (March, April and May), the end of the rain (June, July and August), the beginning of the drought (September, October and November) and end of the drought (December, January and February).
Sampling Procedure
The sampling of fish fauna and abiotic variables in this study was carried out during the execution of several research projects, each contributing to the robustness of our findings (FACEPE Project APQ-0586-1.08/06, APQ- 0911-1.08/12; Universal Project CNPq No.: 37384/2004- 7, 474736/2004 and 482921/2007-2, CT- Hidro 29/2007/CNPq No.: 552896/2007-1, 405818/2012-2/COAGR/PESCA) carried out with the support of an environmental authorization for activities with scientific purposes (SISBIO nº 11050- 1). The description of the net and the procedure to calculate de fish densities, biomasses, the feeding ecology indexes, and fish ontogeny classification were well described in Barletta et al. (2020), Ramos et al. (2011), and available in the Supplementary Material – Figure S1.
Environmental Variables
Before each sampling, the physical and chemical parameters of the surface and bottom water were obtained, such as temperature (°C), salinity (Salinometer WTW LF 197), dissolved oxygen (mg/L) (Oximeter WTW Oxi 340) and Secchi disk depth (cm). Meteorological data related to rainfall were collected in situ by a meteorological station in the study area (Figure 1). Additionally, the National Institute of Meteorology compiled a historical series of rainfall data (INMET 2014).
Classification of Ecological Guilds and Identification of Ontogenetic Phases of Fish Species
The classification of ecological guilds for A. clupeoides and C. edentulus was performed using the criteria proposed by Elliott et al. (2007). Estuarine species are those that complete their life cycle in the estuary (e.g. A. clupeoides). Cetengraulis edentulus was classified as an estuarine-dependent marine species, which are those species that use estuarine habitats at the end of the dry season for reproduction and spawning. In the other seasons of the year, this species lives in the coastal region.
Food Ecology and Microplastics (MPs) Contamination
After each sample was collected, the specimens were labelled, frozen and kept at -24°C. In the laboratory, the individuals were thawed at room temperature, sorted and identified, and then total length (TLi) and total weight (Wgi) were measured.
Ten fish per ontogenetic phase were used per sample (per month, per season and per area) in the estuary (Fig. S2). The fish were eviscerated and the digestive tract (stomach and intestine) removed for analysis. The samples used for the identification and counting of phytoplankton and zooplankton were taken from the stomach contents of fish of the species C. edentulus and A. clupeoides.
After removal, the digestive tract was placed in a Petri dish to remove all stomach contents. At the end of this procedure, the stomach contents were stored in a glass container (25 ml) with 4% formalin. Three slides were then prepared, each containing a subsample (2 ml) of the sample. The samples were identified and quantified using a Lumen optical microscope. Phytoplankton and zooplankton were identified to the lowest possible taxonomic level with the help of specialized bibliography. Phytoplankton and zooplankton were photographed and measured using a Zeiss microscope.
For each sample, the MPs fibres were separated by colour and stored in Eppendorf for analysis to determine the polymer structure of this MPs.
The methodology used to avoid airborne contamination between samples is described in detail in Barletta et al. (2020).
Analysis of the Structure of the Microplastic Polymer (MPs)
The MPs samples were analysed by Optical Microscopy (OM), Fourier Transform Infrared (FTIR), Scanning Electron Microscopy (SEM) and Energy Dispersive X-ray Spectroscopy (EDS). The OM was used to evaluate the characteristics of the MP, such as colour and shape. On the other hand, the SEM was used to evaluate the structure of the base plastic polymer in the sample and the FTIR to identify the type of polymer that originated the MPs. To evaluate the presence of metals or microorganisms in the MP sample, a refined approach to the MP composition was made using the EDS technique, which is analytical and used for the elemental analysis of a sample. The technique is based on the investigation of a sample through interactions between particles and matter, analysing the X-rays emitted by the matter in response to the incidence of charged particles. The characterization is due to the principle that each element has its own atomic structure, which is unique. Therefore, the emitted X-rays are characteristic of that element.
Data Analysis
Diet Analysis of Planktophagous Fish Species
After identification and quantification of plankton specimens, the total amount of prey and MPs ingested was calculated using the equation:
Where, Dt is the total density of ingested prey (ind.ml-1), D is the total quantification of plankton individuals in a 1 ml subsample, and Vt is the total sample volume.
The quantification of ingested items was reported as the frequency of occurrence (FO%) and percentage of number of ingested prey (N%), which are available in item 3 of the supplementary material.
Statistical Analysis
Data related to seasonal and spatial fluctuations in density, biomass and contamination by MPs of both fish species studied were modelled using the Generalized Linear Model (GLM) (Nelder & McCullagh 1983). The GLM allows for the accommodation of continuous and discrete distributions (Kutner et al. 2005). In this study, the response variables density, biomass and contamination by MPs, called Y, have an important characteristic of presenting positive data. For this reason, for the density and biomass of A. clupeoides, the Zero Adjusted Gamma distribution (ZAGA) was the most appropriate distribution for adjusting the data (Rigby et al. 1999). In the case of C. edentulus, the same variables were better adjusted in the Gamma distribution (GA). The functional probability of the ZAGA and Gamma distributions is detailed in the Supplementary Material.
In the case of contamination of the specimens by MPs, this variable has two characteristics that were taken into consideration. The first was that this variable has count values and the second that it contains zero. For this reason, to model the contamination by MPs in A. clupeoides the data were adjusted in the Zero-Inflated Negative Binomial distribution type II (ZINBI). The ZINBI distribution with the probability density function is detailed in the supplementary material. For C. edentulus, the Zero-Inflated Poison distribution (ZIP) model was considered the most appropriate for this situation (Supplementary Material).
Canonical Correspondence Analysis
Canonical Correspondence Analysis (CCA) was used to investigate the ecological interactions between environmental variables (Salinity, Temperature, Dissolved Oxygen and Secchi), food items (Copepods, Gastropod Larvae, Decapods Zoe Larvae, A. flexuosa Larvae, Coscinodiscus sp. and Actinopthycus sp.), MP contamination (blue, black, red and green fibers), season (IS; early dry season, FS; late dry season, IC; early rainy season and FC; late rainy season) and ontogenetic phases of A. clupeoides and C. edentulus (juvenile, subadult and adult) in the estuary (Palmer 1993; Ter Braak & Smilauer 2002). The most common items consumed by the species and MPs were included in the analysis as the number of items ingested. To perform the analysis, a least squares multiple regression was calculated with the site scores (derived from weighted means of microplastics and food content) as dependent variables and the environmental data (salinity, temperature, dissolved oxygen and Secchi) as dependent variables. The dependent variables were analysed using a forward gradient to extract patterns of variability in relation to the independent variables (Ter Braak 1986, Palmer 1993).
RESULTS
Environmental Variables
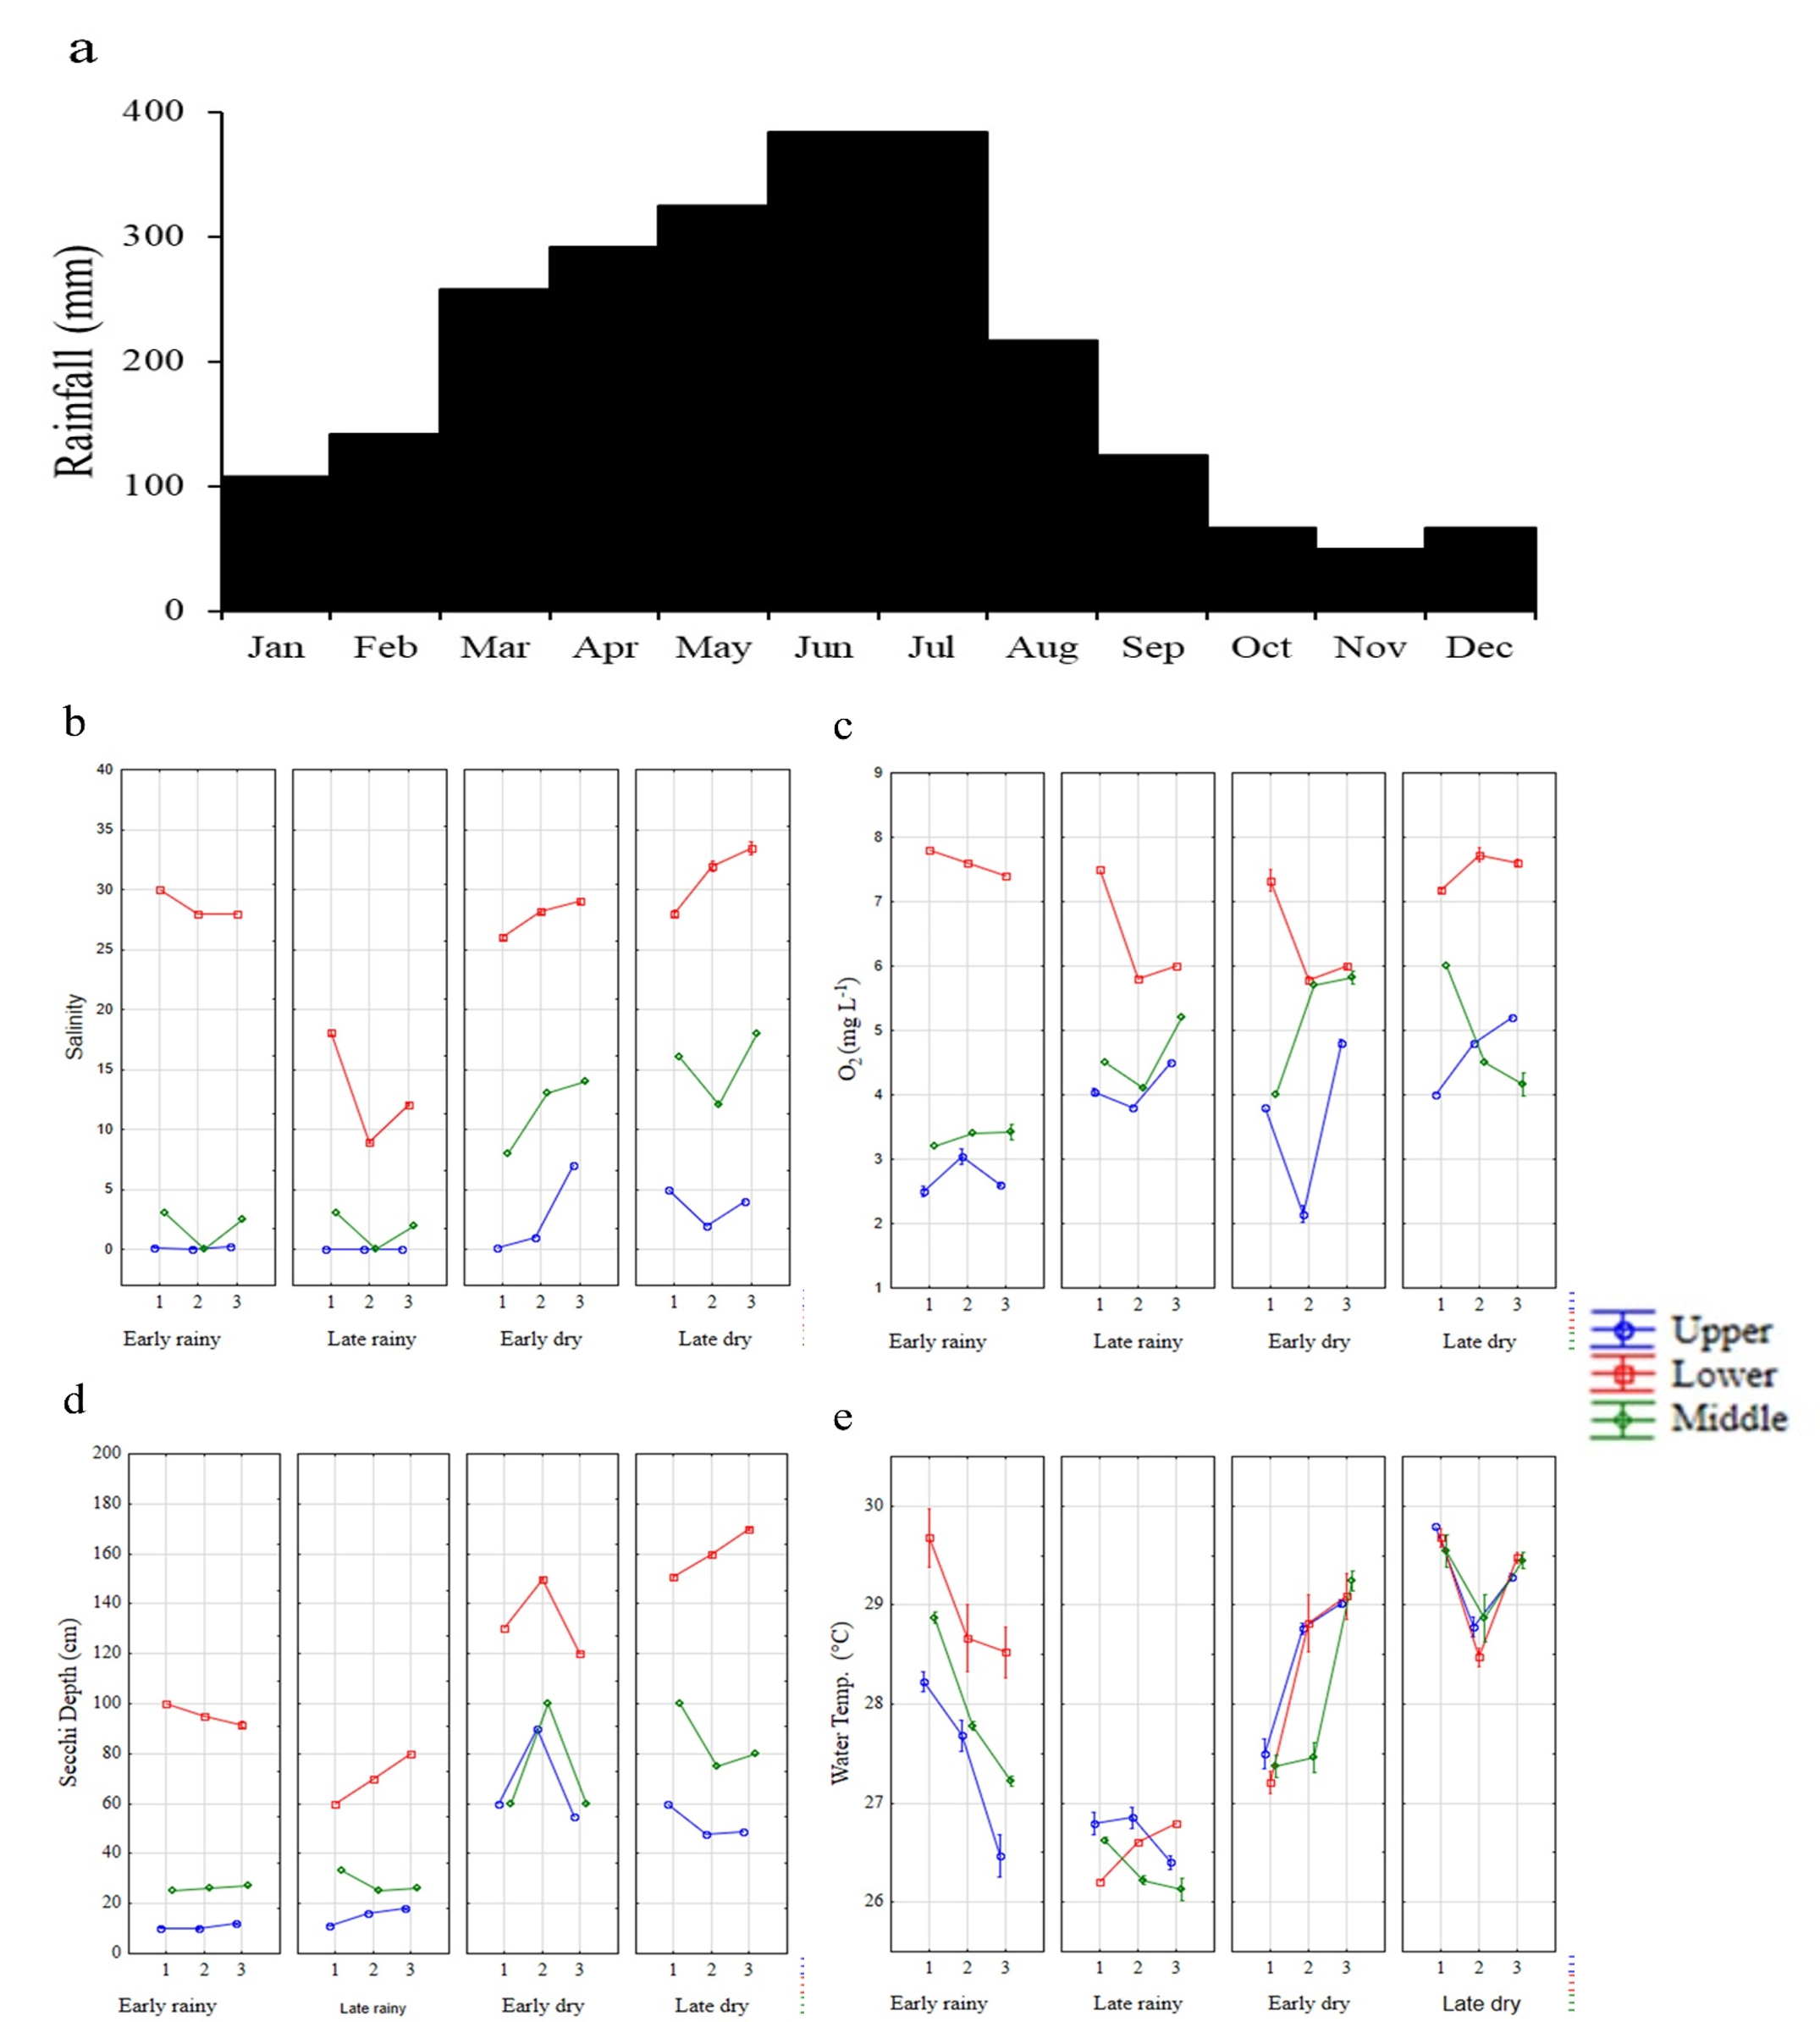
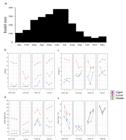
The end of the rainy season saw the highest precipitation values, exceeding 300 mm, while the beginning of the dry season recorded the lowest, dipping below 60 mm (Figure 2a). Regarding the water salinity, the upper area of the estuary was characterized by presenting low values (~0), especially in the rainy season (Figure 2b). On the other hand, the lower area, when compared to the other regions of the estuary, presented the highest values regardless of the season. This area also presented the highest dissolved oxygen values (7 - 8 mg. L-1) (Figure 2c). The intermediate area presented high values in all seasons (5 - 6 mg. L-1) except at the beginning of the rainy season (3 - 4 mg. L-1). The upper area presented the highest values (4 - 6 mg. L-1) during the end of the dry season. The Secchi depth showed high values in the lower area of the estuary during the end of the dry season (160 - 180 cm) and the lowest values in the upper area in the rainy season (0 - 20 cm) (Figure 2d). The highest water temperature (> 30 °C) was recorded in the lower area of the estuary during the beginning of the rainy season and the dry season (Figure 2e). The highest values were recorded during the dry season in the other areas.
Estuary of the Goiana River, located in the northeast region of Brazil between the states of Pernambuco and Paraíba. The points marked by white circles represent the entrance to the sampled tidal channels. The red circle indicates the location where the weather station was installed. The different areas of the main channel (upper, intermediate and lower) are represented by a rectangle.
Definition of Ontogenetic Phases
The weight and length of 3,030 specimens of A. clupeoides, and 1,106 specimens of C. edentulus were obtained. These data determined the relationship between weight and length for both species (Figures S3 and S4). This relationship allowed the observation of three distinct areas in the generated graph: in the first, the individuals had a negative allometric growth behaviour (only grow in size: juvenile); in the second area, the growth of the species was isometric (grow in size and increase in weight: subadults), and in the third area, the growth was positive allometric (only gain weight: adults).
Logistic regression was used to obtain the frequency of the first maturation of individuals (L50) (the length at which 50% of the individuals are mature) (Figures S5 and S6).
This regression revealed an L50 of 8 cm in total length for A. clupeoides and 8.2 cm for C. edentulus. With the results of this classification, it was defined for A. clupeoides that the length range for each ontogenetic phase was juvenile equal to 3.1 cm, subadult equal to 5.5 cm and adults with 8 cm in total length (Figures S3 and S5). For C. edentulus, the length range for each ontogenetic phase was juvenile equal to 3.1 cm, subadult equal to 5.7 cm and adult equal to 8.2 cm (Figures S4 and S6).
Spatiotemporal Distribution Models of Planktophagous Fish Species
The ZAGA regression models for Density (Equation 2) and for Biomass (Equation 3) of A. clupeoides (Figure 3a, b Table I), and Gamma regression for density (Equation 4; Figure 3a), and for biomass of C. edentulus (Equation 5; Figure 3b, Table II); showed significant differences (p<0.001) for the variables season, ontogenetic phase, area and environmental variables. It means that the density and biomass of each ontogenetic phase of these species vary according to the seasons of the year and in the different areas of the estuary. The plots of the deviation residuals versus fitted values and versus index plots demonstrated that they behave in a random manner with a constant dispersion (Supplementary-material Figures S7, S8, S9 and S10). I addition, the residuals’ models have a good approximation to the normal distribution. The normal probability plots show that there is no strong evidence of violations of the model assumptions.
Summary of the Gamma distribution for the density and biomass data of C. edentulus with the upper, intermediate and lower areas, seasons beginning of drought (IS), end of drought (FS), beginning of rain (IC) and end of rain ( FC), ontogenetic phases (juvenile, subadult and adult), environmental variables (O2, Secchi, temperature and salinity) in the Goiana River estuary (PE/PB) (Significance Codes: NS not significant, 0 ’***’ 0.001 ’**’ 0.01 ’*’ 0.05 ’.’ 0.01 ’ ’ 1).
Summary of the ZAGA distribution for A. clupeoides density and biomass data with the upper, intermediate and lower areas, seasons beginning of drought (IS), end of drought (FS), beginning of rain (IC) and end rainfall (FC), ontogenetic phases (juvenile, subadult and adult), environmental variables (O2, Secchi, temperature and salinity) in the Goiana River estuary (PE/PB) (Codes of Significance: NS not significant, 0 ’***’ 0.001 ’**’ 0.01 ’*’ 0.05 ’.’ 0.01 ’ ’ 1).
Mean and standard error of the physicochemical parameters of the Goiana River estuary, precipitation (a), salinity (b), dissolved oxygen (mg/L) (c), Secchi depth (cm) (d) and temperature (°C) (e); in the upper area (blue line), intermediate (green line), lower (red line) in the seasons: Early rainy (1 - March, 2 – April, 3 – May), Late rainy (1 - June, 2 – July, 3 – August), Early dry (1 – September, 2 – October, 3 – November) and Late rainy (1 – December, 2 – January, 3 – February) between 2005 and 2009.
The ZAGA regression model proposed for A. clupeoides is given by:
Density:
Biomass:
The proposed GA regression model for C. edentulus is given by:
Density:
Biomass:
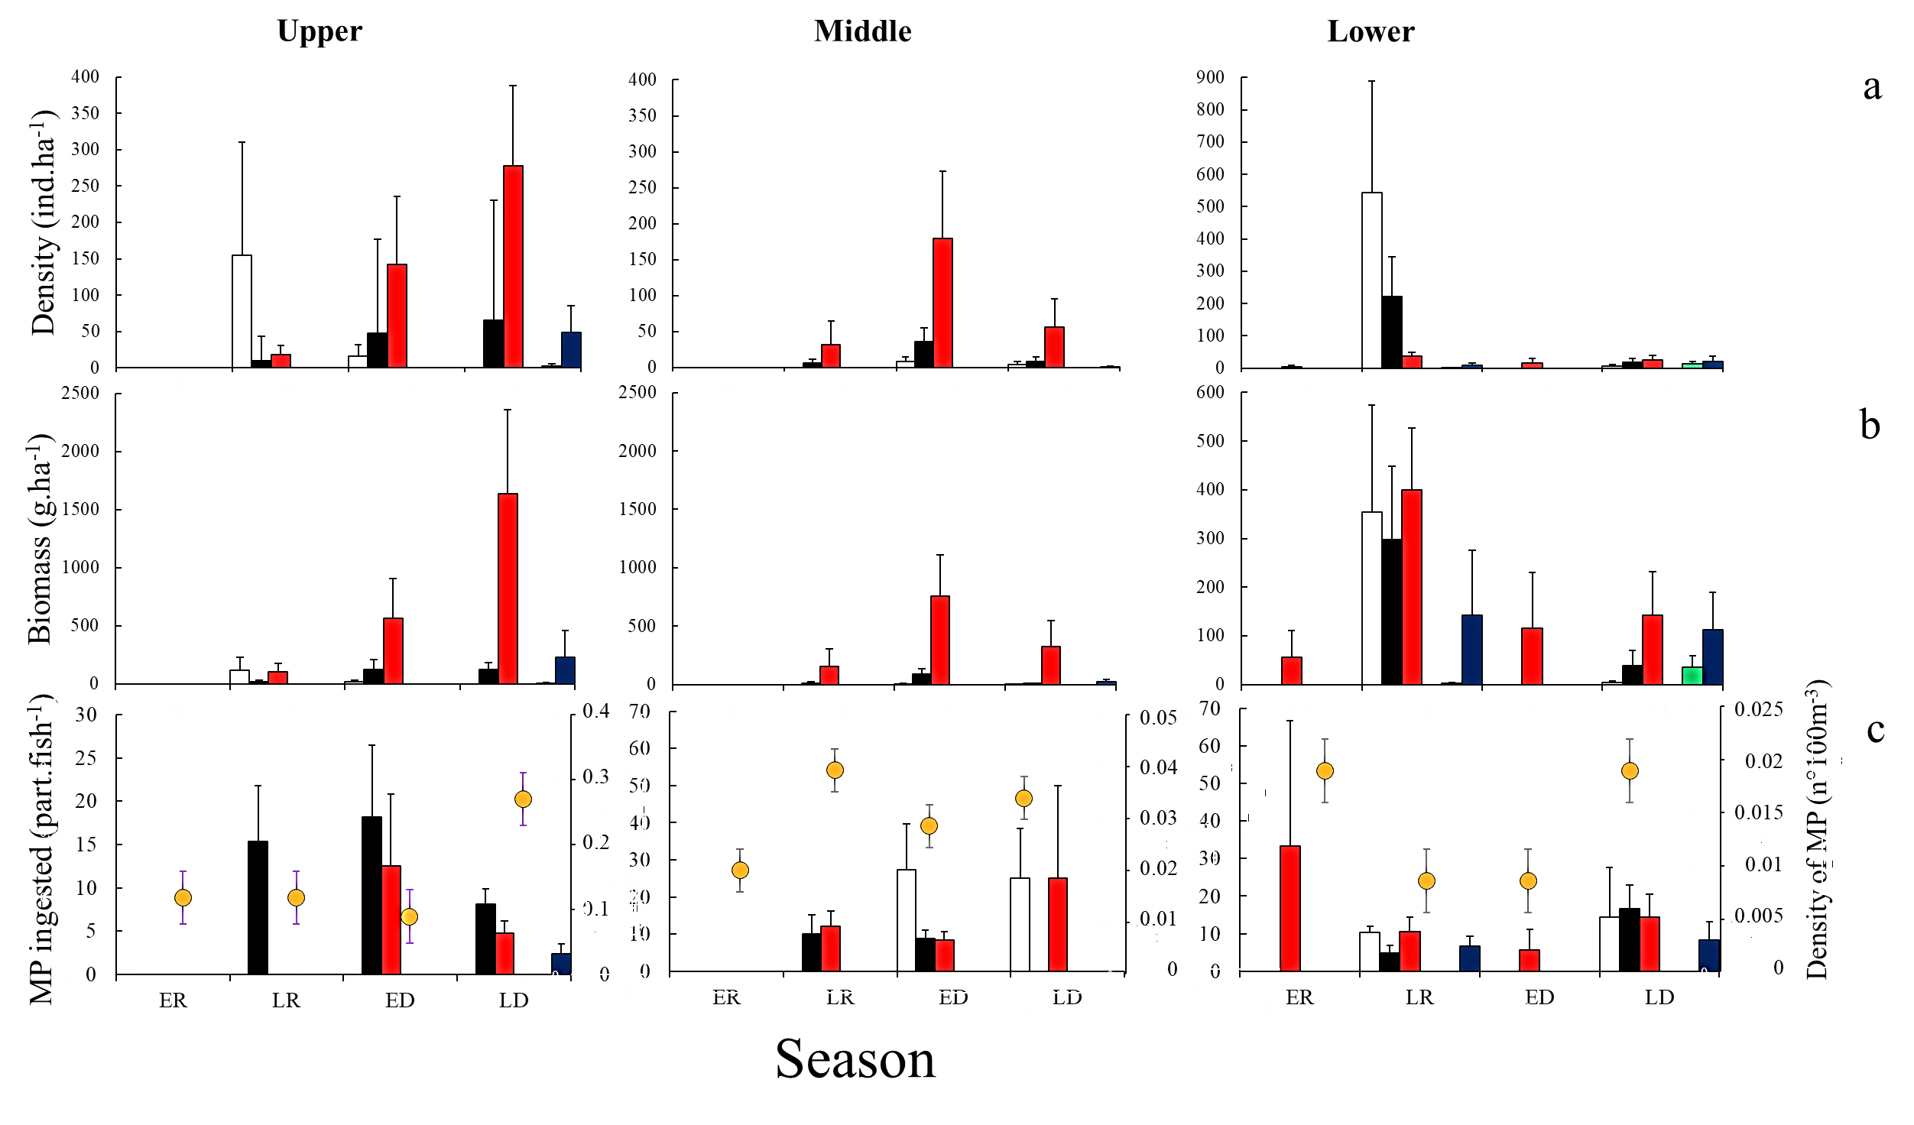
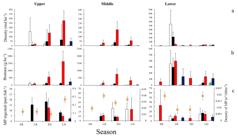
The mean total density and biomass of A. clupeoides was 53.6 ± 33.5 ind.ha-1 and 152 ± 84 g.ha-1 respectively (Figures 3a and b). While for C. edentulus the mean total density and biomass were 3 ± 2 ind. ha-1 and 17 ± 14 g. ha-1.
A. clupeoides presented the highest density (~278 ± 111 ind. ha-1) and biomass (1635 ± 727 g. ha-1) of adult individuals in the upper estuary during the final dry season (Figure 3a, b). In contrast, the lower portion of the estuary during the final rainy season presented the highest concentrations of subadults (density: 220 ± 125 ind. ha-1 and biomass: 298 ± 150 g. ha-1) and juveniles (density (545 ± 345 ind. ha-1 and biomass: 354 ± 219 g. ha-1). The same distribution pattern was observed for adult C. edentulus, which also presented a higher concentration of adult individuals during the end of the dry season in the upper portion of the estuary (density: 48 ± 37 ind. ha-1 and biomass: 305 ± 229 g. ha-1). At the same time, the subadults of this species were concentrated in the lower portion (density: 12.5 ± 8.6 ind. ha-1 and biomass: 35.4 ± 24.3 g. ha-1) during the late dry season.
Dietary Changes in Each Ontogenetic Phase, Spatiotemporal Feeding Patterns and Microplastic Contamination
Feeding Ecology and Microplastic Contamination in A. clupeoides
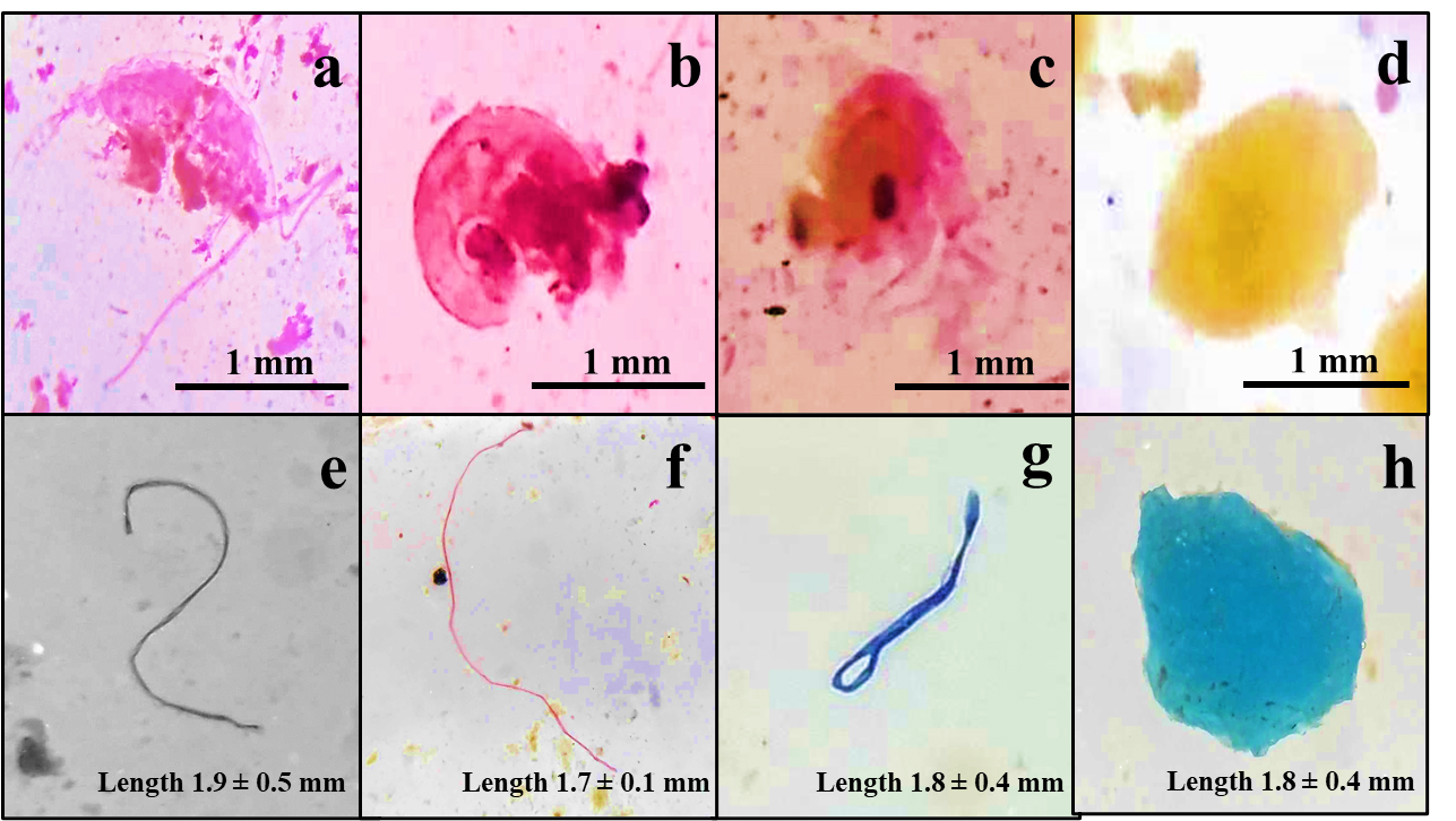
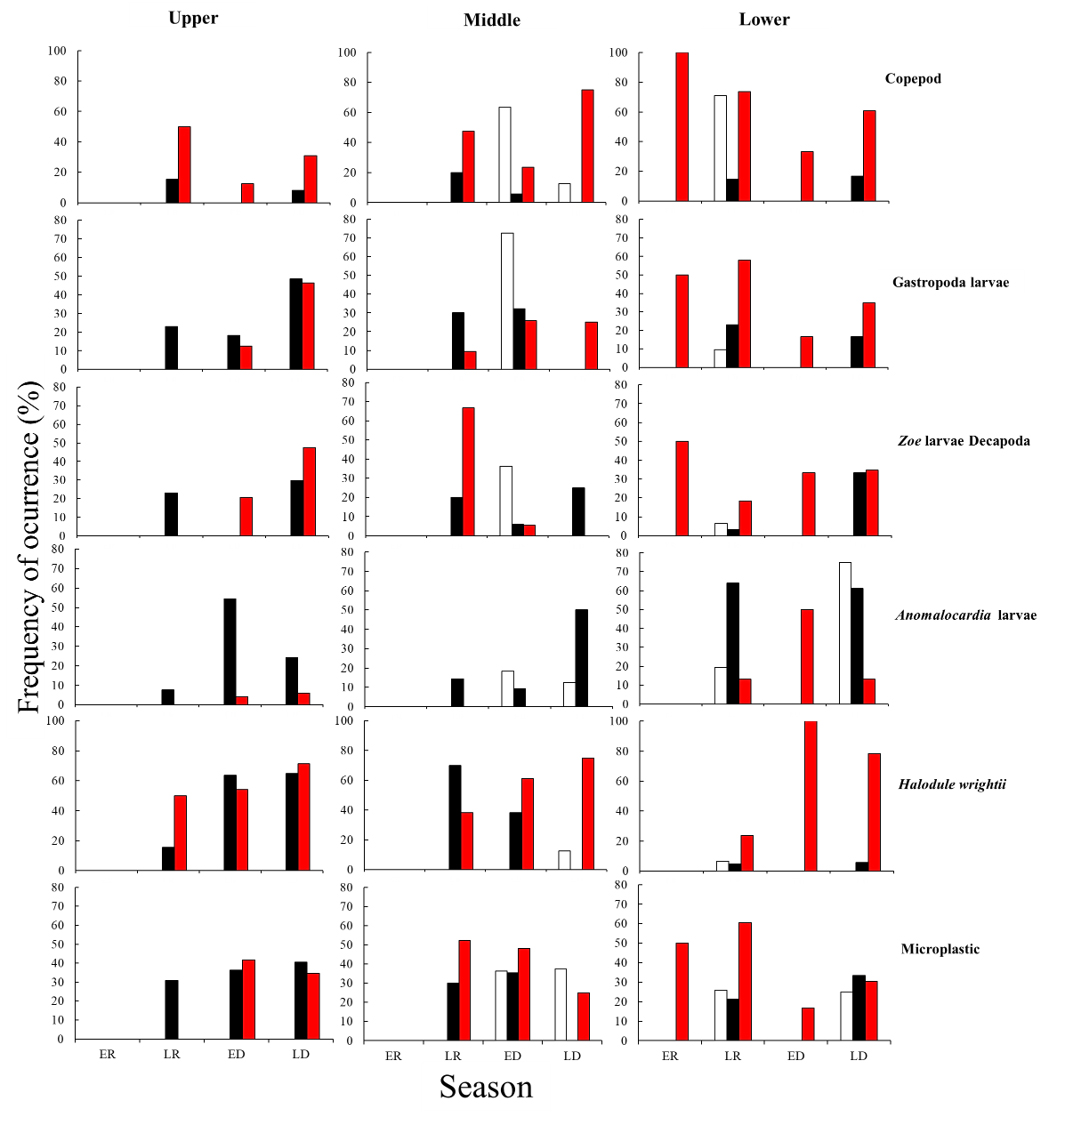
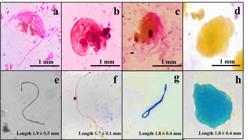
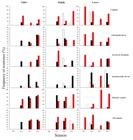
Of a total of 498 individuals analysed (59 juveniles, 188 subadults and 251 adults), 19 food items and three different colours of MPs were found (Figure 4). Copepods were the most frequently consumed item in the diet of adults (FO = 100%; 47.52 ± 33.61 prey. fish-1) in the lower portion of the estuary during the early rainy season (Figures 5 and S11). However, A. flexuosa larvae were more frequent in subadults (FO = 63.9%; 33.6 ± 1.6 prey. fish-1) in the lower portion during the final rainy season and in juveniles (FO = 75%; 12.5 ± 8.66 prey. fish-1) in the lower portion during the final dry season. In addition, Gastropod larvae were also more frequent in juveniles (FO = 72.73%; 9.09 ± 3.66 prey. fish-1) in the intermediate portion during the early dry season. The highest frequency of MPs in adults (FO = 60.53%; 10.53 ± 3.8 fish part-1) was observed in the lower portion of the estuary during the final rainy season, while in subadults (FO = 40.54%; 8.11 ± 1.81 fish part-1) the highest frequency was observed in the upper portion during the final dry season. For juveniles, the highest frequency of MPs contamination (FO = 37.5%; 25.11 ± 13.36 fish part-1) was observed in the intermediate portion during the final dry season.
Mean and Standard Error (S.E.) of density (a), biomass (b) and ingestion of microplastics (c) in the different ontogenetic phases of A. clupeoides (juvenile ; subadult ; and adult ) and C. edentulus (subadult and adult ) in the seasons of beginning of the drought (ED), end of the drought (LD), beginning of the rain (ER) and end of the rain (LR) for the different areas (upper, intermediate and lower) of the Goiana River estuary. The microplastics ingested by A. clupeoides and C. edentulus (c: first Y-Axis) and the distribution of microplastics in the water column (c: second Y-Axis) are presented according to the available data from Lima et al. (2014).
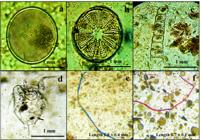
A. clupeoides food itens: (a) copepod, (b) gastropod larva, (c) Zoe larva, (d) A. flexuosa larva, and microplastics contamination: (e) Black fiber, (f) Red fiber, (g) Blue fiber, (h) Blue film.
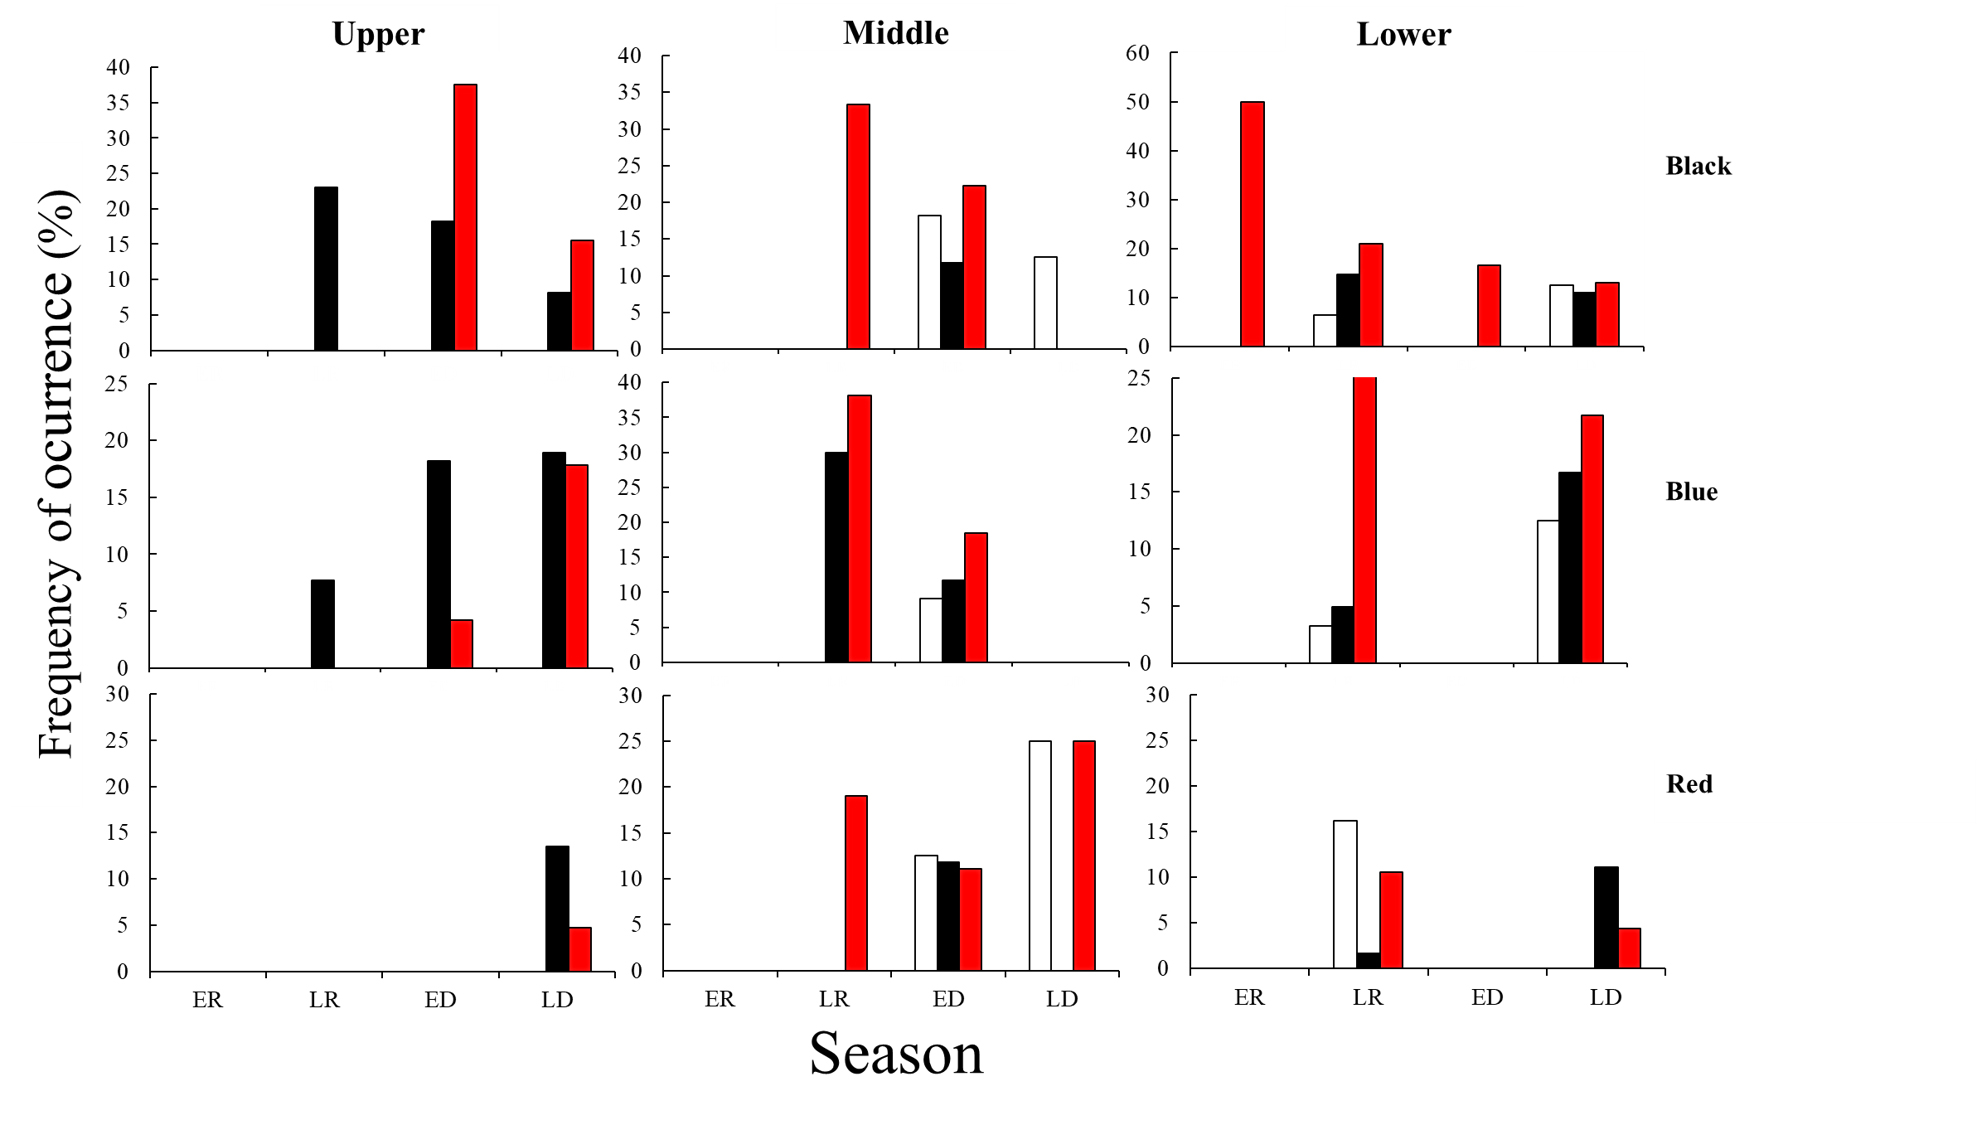
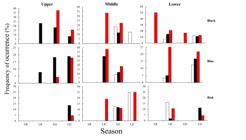
Black MPs showed high frequency in all ontogenetic phases (Figures 6 and S12). Adults were contaminated by MPs (FO = 50%; 33.33 ± 23.57 fish part-1), mainly in the lower portion of the estuary during the rainy season. In contrast, subadults (FO = 23.08%; 7.69 ± 3.19 fish part-1) presented higher contamination by microplastics in the upper portion during the final rainy season. Juveniles (FO = 18.2%; 9.09 ± 6.1 fish part-1) presented higher contamination by MPs in the intermediate portion during the early dry season. Regarding blue MPs, adults presented the highest frequency (FO = 38.1%; 2.49 ± 1.3 fish part-1), mainly in the intermediate portion during the final rainy season. Red MPs mainly contaminated juveniles (FO = 25%; 1.25 ± 0.82 part. fish-1) and adults (FO = 25%; 1.25 ± 1.25 part. fish-1) in the intermediate portion during the final dry season.
Occurrence frequencies in percentage (FO%) of prey ingested in the different ontogenetic phases (juvenile: white bars; subadult: black bars; adult: red bars) of A. clupeoides in the early dry season (ED), late dry season (LD), early rainy season (ER) and late rainy season (LR) for the different areas (upper, intermediate and lower) of the Goiana River estuary.
Feeding ecology and microplastic contamination of Cetengraulis edentulus.
A total of 161 individuals (21 subadults and 140 adults) were analysed, and 19 food items and two colours of MPs were found (Figure 7).
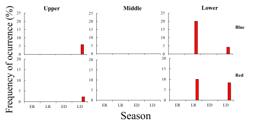
Occurrence frequencies in percentage (FO%) of the most relevant colors of microplastics (black, blue and red) ingested in the different ontogenetic phases (juvenile: white bars; subadult: black bars; adult: red bars) of A. clupeoides in the seasons beginning of the dry season (ED), end of the dry season (LD), beginning of the rainy season (ER) and end of the rainy season (LR) for the different areas (upper, intermediate and lower) of the Goiana River estuary.
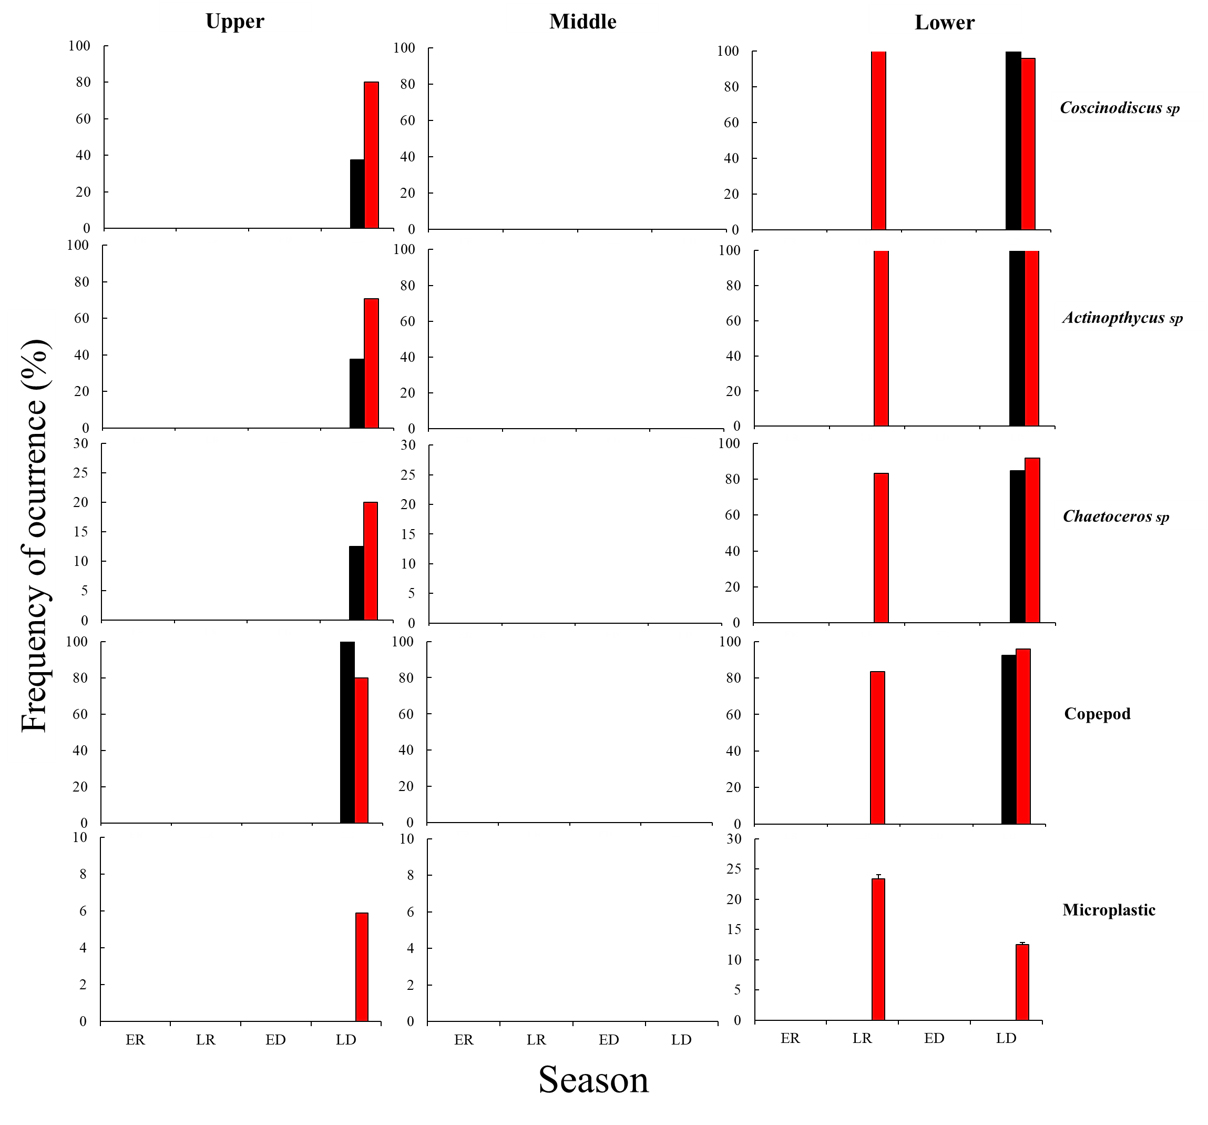
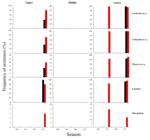
The genera Coscinodiscus sp. (FO = 100%; 3.33 ± 0.26 prey. fish-1) and Actinopthycus sp. (FO = 100%; 4.17 ± 3.47 prey. fish-1) were the main diet of adults in the lower portion of the estuary during the final rainy season (Figures 8 and S13). For subadults, Coscinodiscus sp. (FO = 100%; 12.5 ± 0.35 prey. fish-1) and Actinopthycus sp. (FO = 100%; 12.5 ± 0.36 prey. fish-1) were the main diet in the upper portion of the estuary during the final dry season.
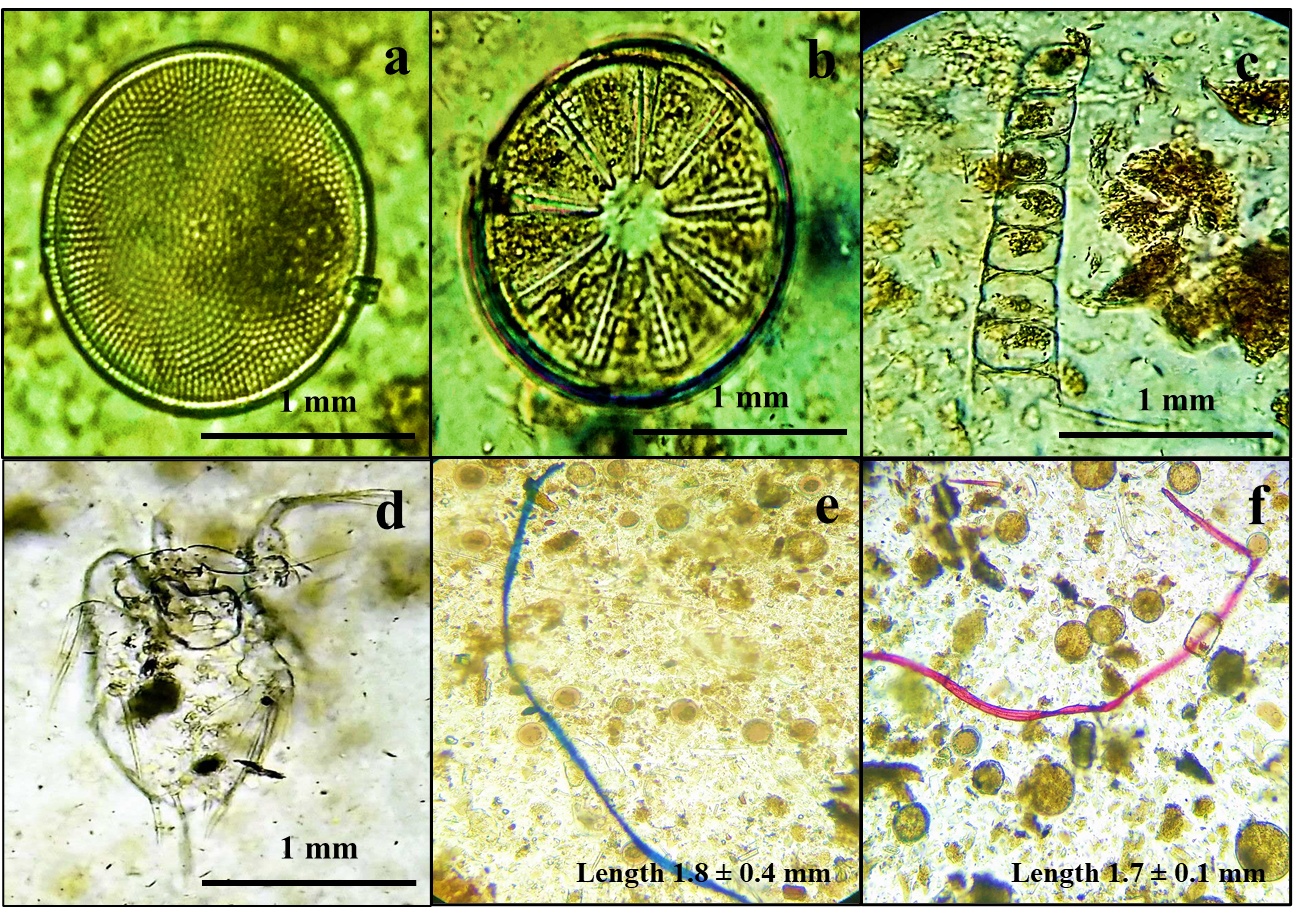
Food itens of C. edentulus: (a) Coscinodiscus sp., (b) Actinopthycus sp., (c) Chaetoceros sp., (d) Copepod, and contamination by microplastics (e) Blue Fiber and (f) Red Fiber.
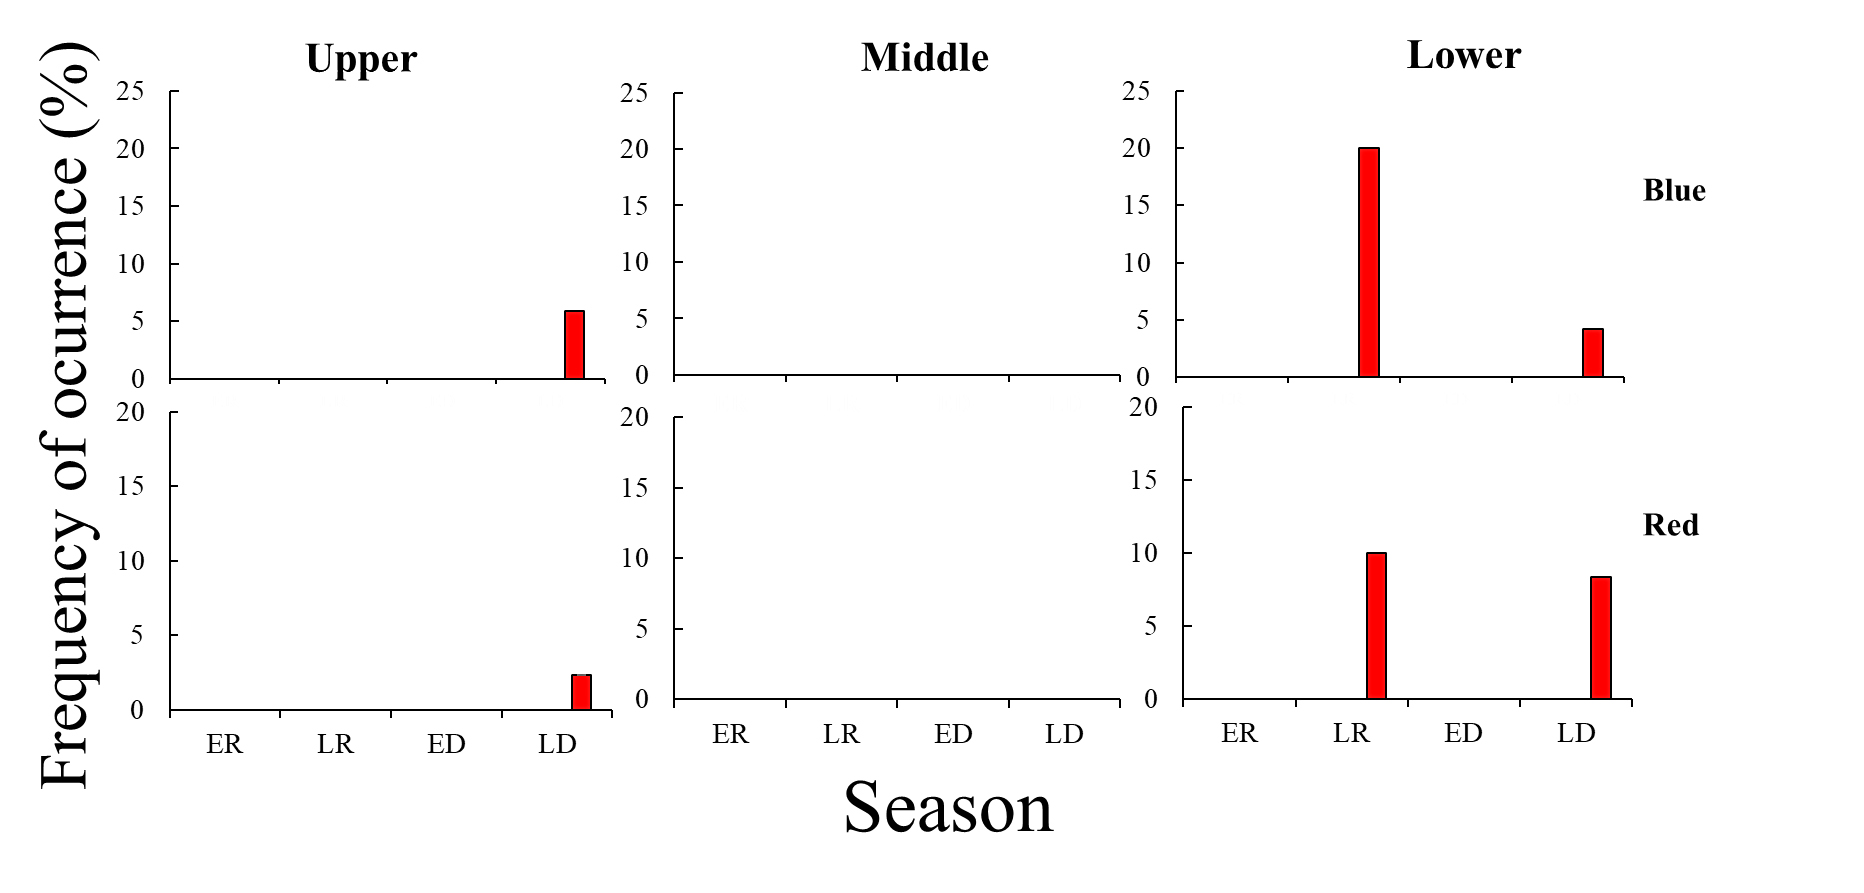
The highest frequency of adult MPs (FO = 23.33%; 6.67 ± 2.64 part. fish-1) was observed in the lower portion during the final rainy season (Figures 9 and S14). Both blue MPs (FO = 20%; 3.33 ± 1.32 part. fish-1) and red MPs (FO = 10%; 3.33 ± 1.86 part. fish-1) showed higher frequencies in the lower portion during the final rainy season. Subadult individuals did not show contamination.
Occurrence frequencies in percentage (FO%) of prey ingested in the different ontogenetic phases (juvenile: white; subadult: black; adult: red) of C. edentulus in the early dry season (ED), late dry season (LD), early rainy season (ER) and late rainy season (LR) for the different areas (upper, intermediate and lower) of the Goiana River estuary.
Regression Model for Contamination by MPs in Planktophagous Fish Species
For the species A. clupeoides, the regression model that was adjusted to the ZINBI distribution, which presented a global deviation of 1963.6 and an AIC of 1981.6. The variables that were significant and, therefore, entered the model were: season (beginning of the rainy season, end of the rainy season and beginning of the dry season), environmental variables (O2 dissolved in the water and the depth of the Secchi disk) and prey (zooplankton) (Equation 6, Table III). The analysis of the residuals is detailed in Supplementary Material (Figure S15).
Summary of the ZINBI regression model for MP contamination data in A. clupeoides with the factors seasons (start of rain, end of rain and start of drought), environmental variables (O2 dissolved in water and Secchi disk depth) and prey (Zooplankton) (Significance Codes: NS not significant, 0 ‘***’ 0.001 ‘**’ 0.01 ‘*’ 0.05 ‘.’ 0.01 ’ ’ 1).
The ZINBI regression model for MP is given by:
For C. edentulus, the zero inflated Poison (ZIP) model was considered the most appropriate for this situation.
Letting Y = 0 with probability and Y ~ Poison (μ) with probability (1 − σ), then Y has a zero inflated Poisson distribution, denoted by ZIP (μ, σ), given by:
Where, E(Y ) = (1 − σ)μ e Var(Y ) = μ(1 − σ)[1 + μσ].
The ZIP regression model for MPs is given by:
Where, ∑ i=3 4 β1i = 0, ∑ i=3 4 β2i = 0 e ∑ i=2 3 β3i = 0.
For this species the ZIP regression model presented an overall deviation value of 1286.1 and AIC of 286.1. The variables that were significant and therefore entered the model were: season (end of the dry season), areas (upper and lower), ontogenetic phase (adult), salinity and prey (Phytoplankton) (Equation 7, Table IV). The analysis of the residues is detailed in Supplementary Material (Figure S16).
Summary of the ZIP regression model for MP contamination data in C. edentulus for the factors: area (top, middle and bottom), seasons (start of rain, end of rain, start of dry and end of dry) and for the environmental variables (Salinity) and prey (Phytoplankton) (Significance Codes: NS not significant, 0 ‘***’ 0.001 ‘**’ 0.01 ‘*’ 0.05 ’.’ 0.01 ’ ’ 1).
Basic Structure of Microplastics (Polymer)
The MPs samples were analysed using optical microscopy and Fourier transform spectroscopy (FTIR) in solution, with subtraction of the water signal. The infrared range used was 4000 to 400 cm-1.
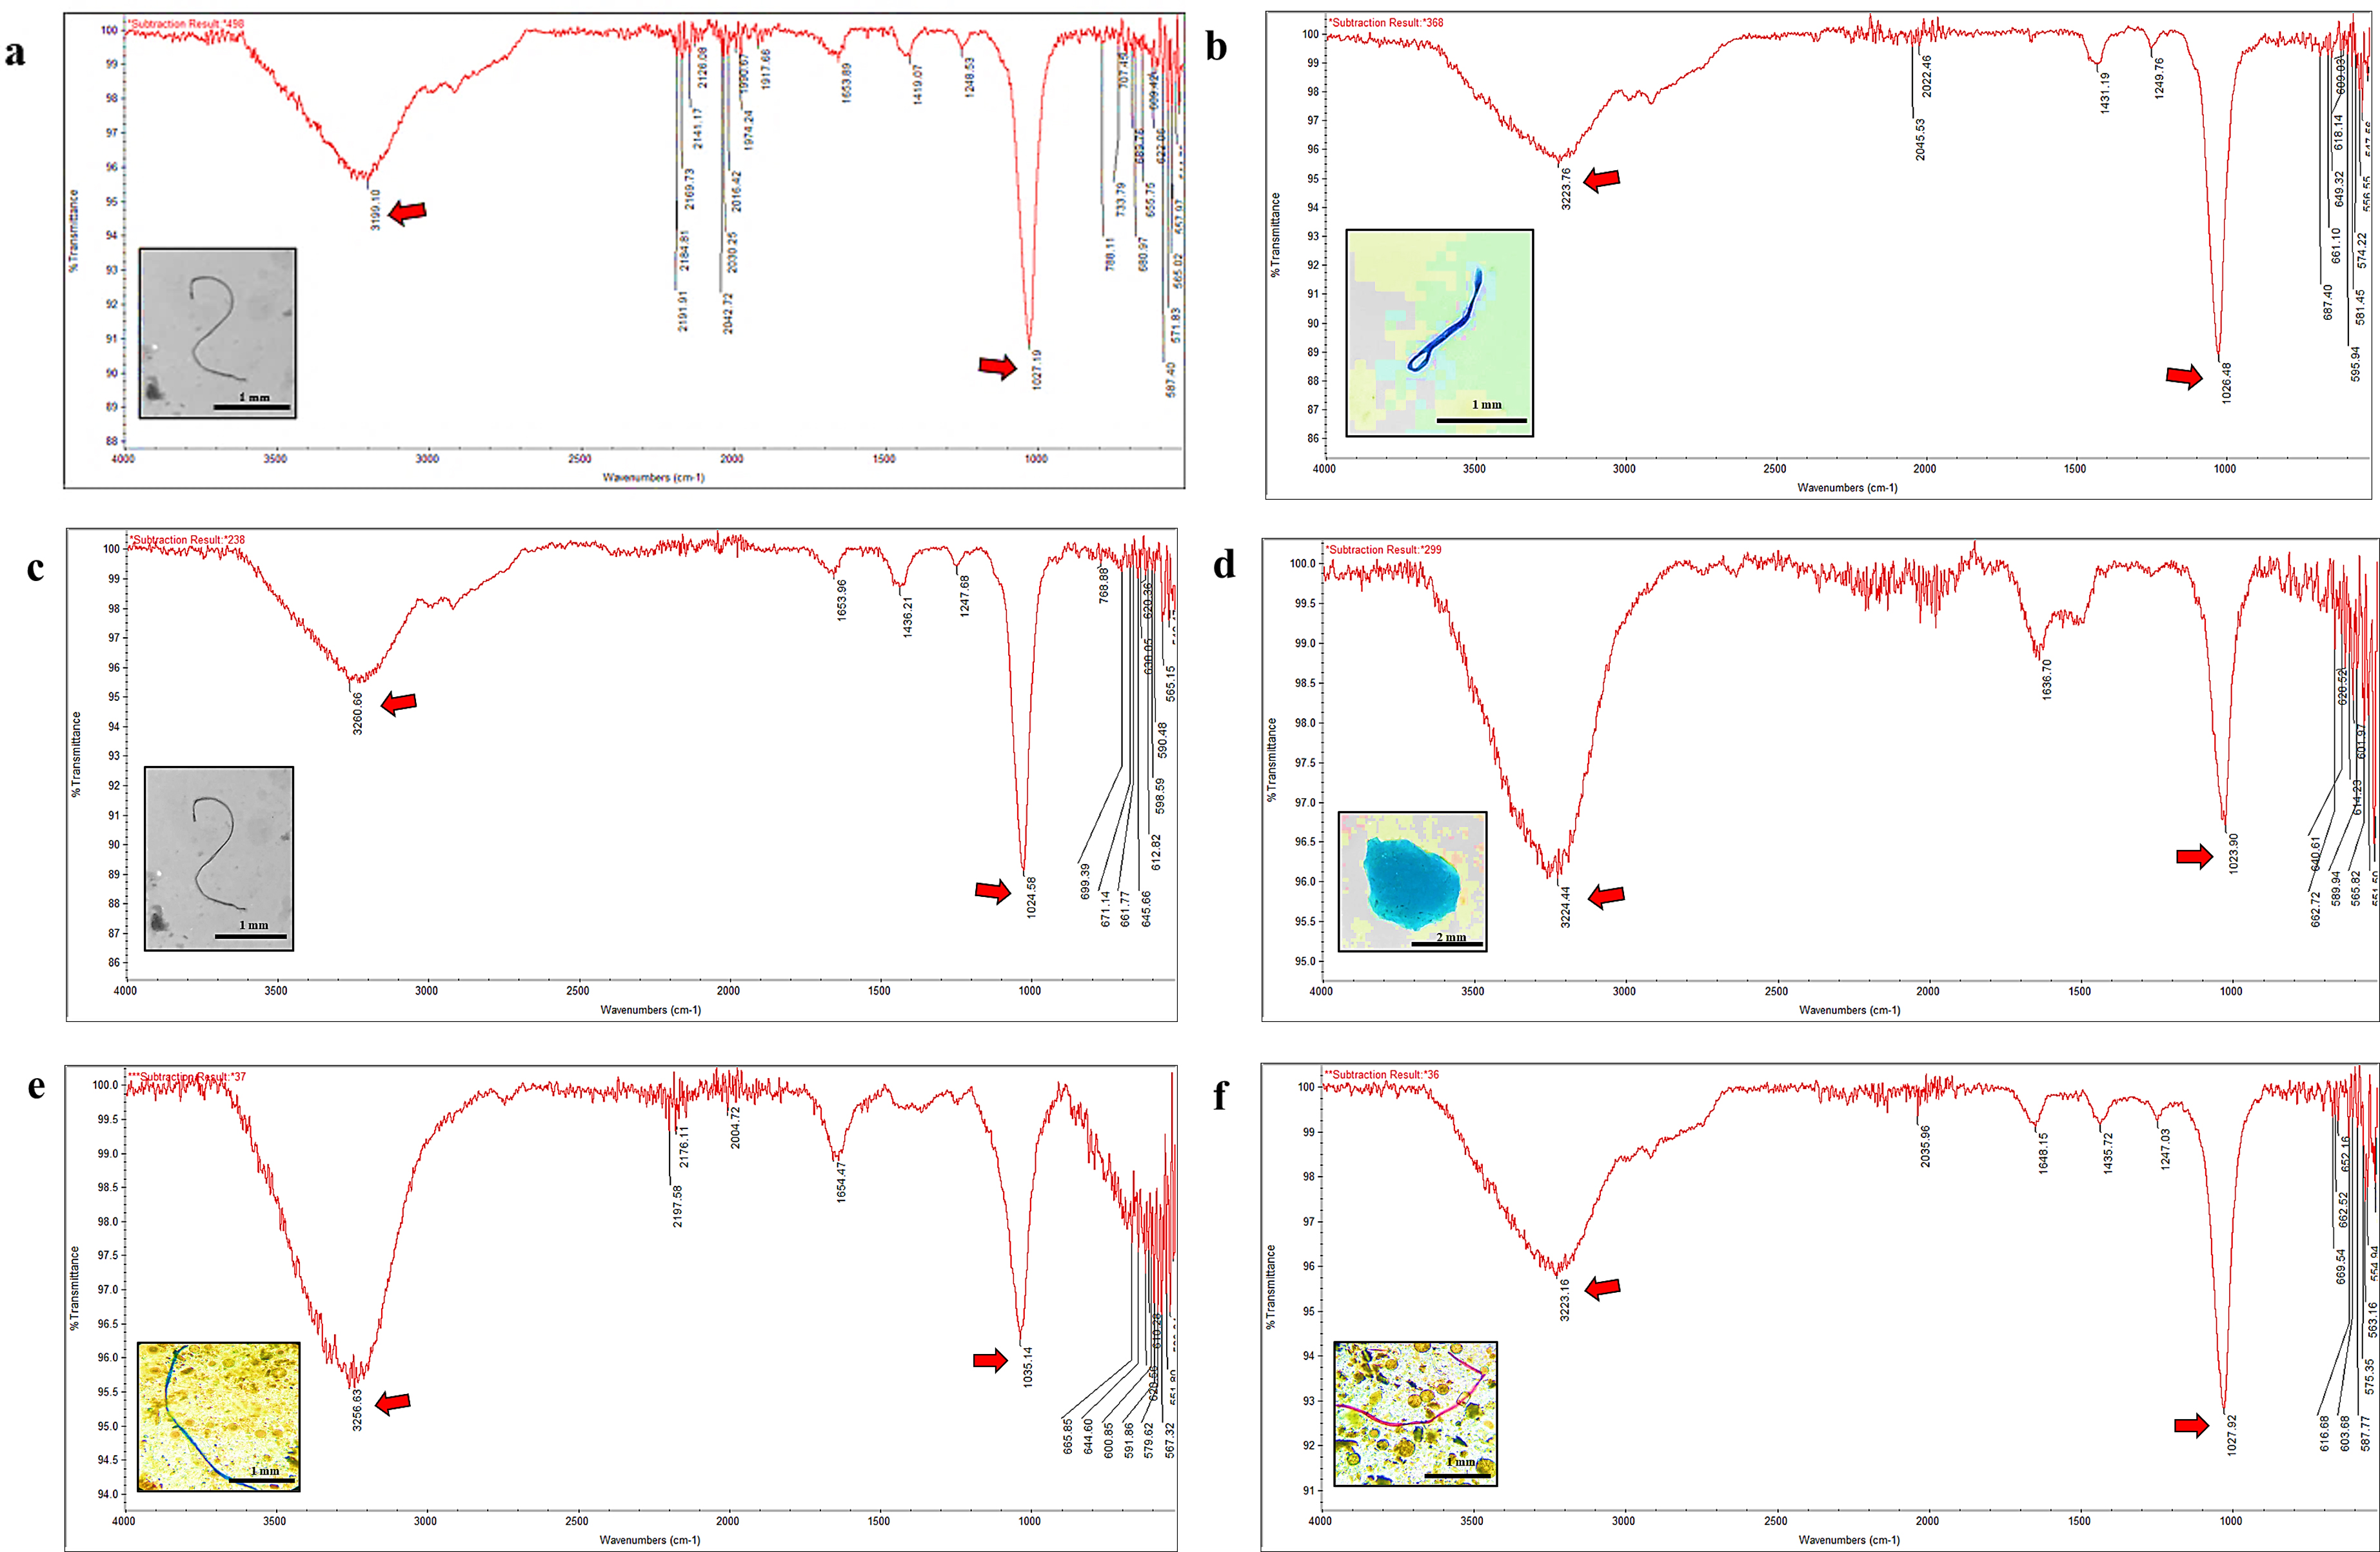
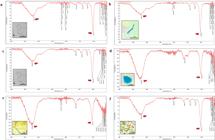
All samples showed a high degree of degradation, and according to the chemical analyses, all fibres are plastic materials derived from polyethene (Figure 10).
Frequency of occurence in percentage (FO%) of the most relevant colors of microplastics (blue and red) ingested in the different ontogenetic phases (juvenile: white bars; subadult: black bars; adult: red bars) of C. edentulus in the early dry season (ED), late dry season (LD), early rainy season (ER) and late rainy season (LR) for the different areas (upper, intermediate and lower) of the Goiana River estuary.
The most intense signals detected in all samples are centred around 3200 cm-1 and 1200 cm-1, which are signals related to the MPs fibres’ OH (hydration) and C-OH (oxidation) groups. The peak intensities show that this degradation process of the polyethene fibres is well advanced. In addition to these signs of hydration and oxidation of the MP fibres, less frequent signals related to the methylene groups of polyethene were also observed in the range of 2,980 cm-1, and the peaks related to the types of carbonyls formed during the degradation process (e.g. cetanes and esters) in the absorption bands between 1650 and 1450 cm-1.
Influence of Environmental Variables on MP Contamination Patterns and Prey Ingestion
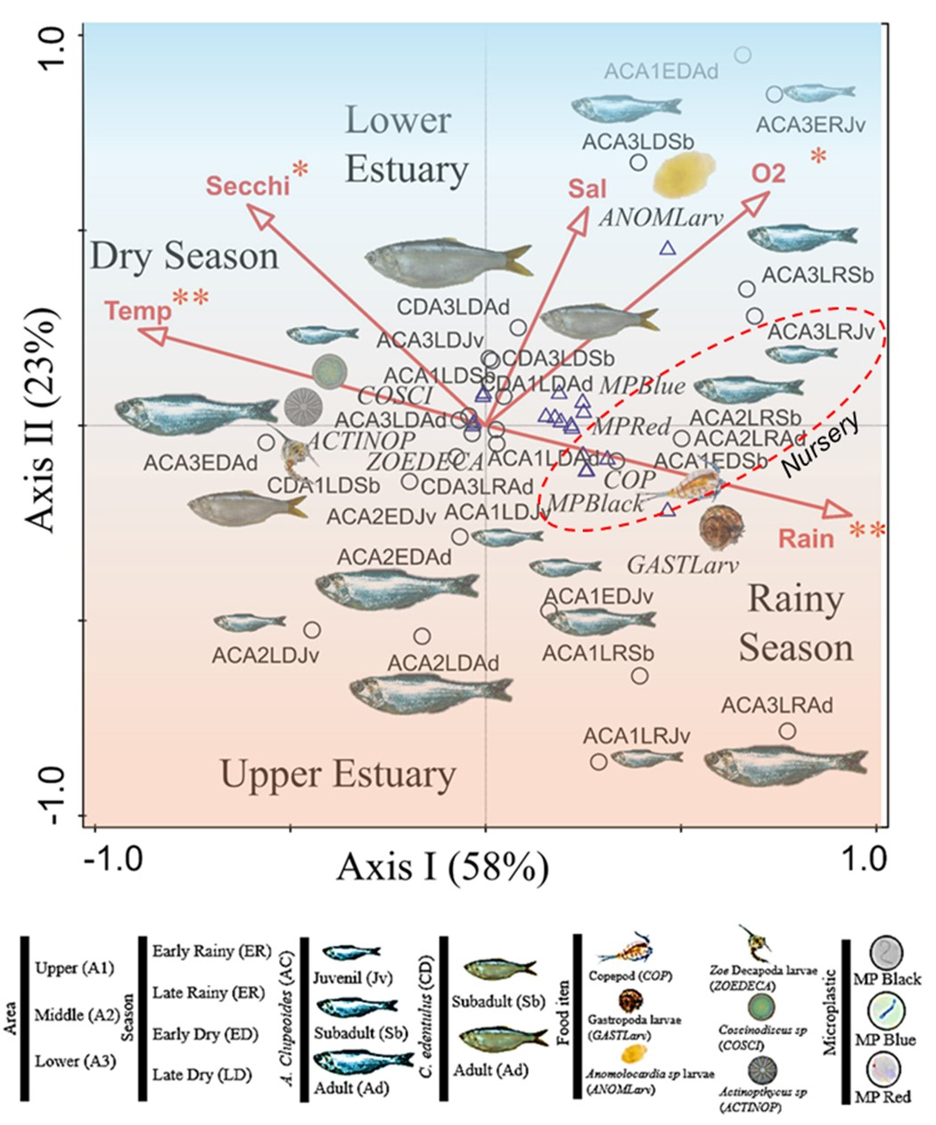
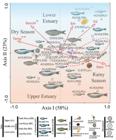
In the Canonical Correspondence Analysis (CCA), Axis I represents the year’s seasons. This axis explained 58% of the data distribution according to seasonality, where the positive portion corresponds to the rainy season, and the negative portion corresponds to the dry season (Figure 11 and Table V). Axis II (23%) represents the salinity gradient of the estuarine ecosystem, where the positive portion corresponds to the lower portion of the estuary. In contrast, the negative portion represents the upper portion of the estuary. Precipitation and water temperature were the vectors of the variables responsible for the formation of Axis I. While water transparency (Secchi), salinity and dissolved oxygen were the vectors of the variables responsible for the formation of the positive portion of Axis II. A. flexuosa larvae were consumed mainly by A. clupeoides subadults during the end of the rainy season in the lower estuary. At the same time, the main prey of adults of A. clupeoides were copepods at the end of the rainy season and the beginning of the dry season. During this period, adults were contaminated by black and blue MPs. While subadults of A. clupeoides fed on larvae of Gastropods in the intermediate and upper areas. During this period, subadults were contaminated by black MPs. Juveniles of A. clupeoides were contaminated by black MPs when they fed on copepods during the end of the rainy season in the lower area of the estuary. Adults and subadults of C. edentulus consumed Coscinodiscus sp. and Actinopthycus sp. in the estuary’s lower area during the dry season’s end. During this period, adults were contaminated by blue and red MPs.
Summary of Canonical Correspondence Analysis (CCA) using environmental variables (rainfall, temperature, Secchi, O2 and salinity), most important prey and contamination by MP (blue, black and red fibers) ingested by A. clupeoides and C. edentulus in the seasons IS; beginning of the dry season, FS; end of the dry season, IC; beginning of the rainy season and FC; end of the rainy season in the Goiana River estuary (PE/PB) (Significance Codes: NS not significant, 0 ’***’ 0.001 ’**’ 0.01 ’*’ 0.05 ’.’ 0.01 ’ ’ 1).
FTIR spectrum of the polyethylene microplastics sample found in the digestive tract of A. clupeoides, in juveniles: Black fibers (a); subadults: Blue fibers (b); adults: Black fibers (c); and Blue film (d) and for adults of C. edentulus Blue fibers (e) and Red fibers (f). The red arrows in the graphs indicate that the base polymer is degraded.
DISCUSSION
Tropical estuaries are some of the most productive aquatic ecosystems. Mangrove forests and river discharges provide nutrients to the environment and feed the diverse planktonic community, which is the basis of estuarine and coastal food webs (Beck et al. 2001).
The Goiana River estuary exhibits seasonal fluctuations in precipitation and salinity gradient. These variables were found to be responsible for the distribution of all ontogenetic stages (larvae, juveniles, subadults and adults) of fish and invertebrates in the main channel of a tropical estuarine ecosystem (Dantas et al. 2010, Dantas et al. 2012, Lima et al. 2015).
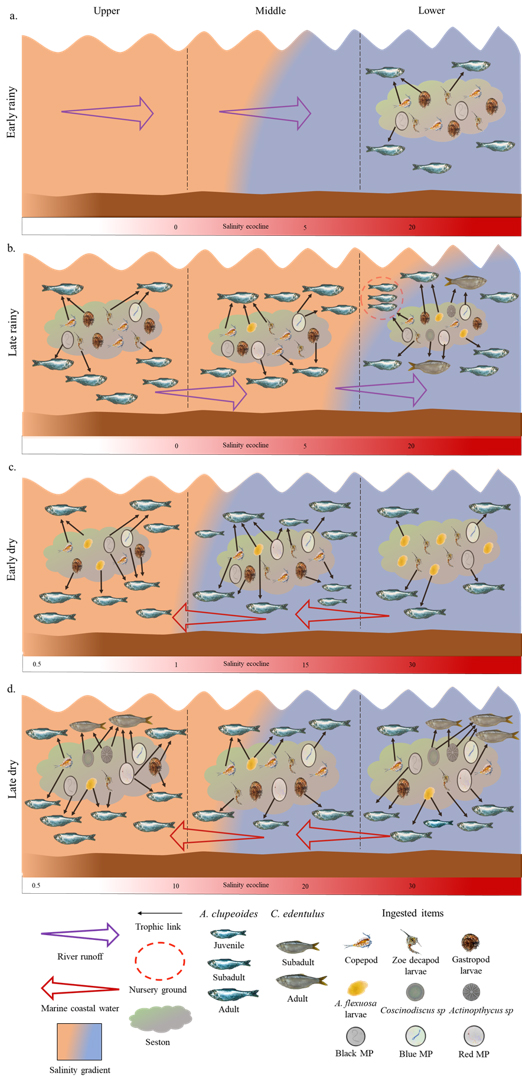
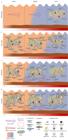
These estuarine environments are characterized by a high density of estuarine and marine planktonic species (Barletta & Barletta-Bergan 2009). In the case of an estuary located in the Eastern Amazon, the planktophagous species associated with these tropical estuarine environments are mainly A. clupeoides and C. edentulus (Barletta et al. 2003, Barletta et al. 2005). In the larval stage, both species present maximum abundance in the upper portion of the estuary during the dry season, and in the larval stage, marine fish (C. edentulus) migrate to the upper estuary, occupying the main channels and withstanding annual variations in salinity (Barletta-Bergan et al. 2002a, b, Lima et al. 2015, 2018). Evidence that larvae use the main channels to develop was observed in the Goiana River estuary, where the most significant number of individuals was in the post-flexion phase (Lima et al. 2016). Considering the information generated in this study, adults of A. clupeoides fed mainly on copepods in the lower portion of the estuary during the early rainy season, and at that time, they were mainly contaminated by black MPs (Figure 12). The subadults fed on larvae of A. flexuosa in the lower portion during the late rainy season, and the juveniles also showed a preference for larvae of A. flexuosa in the lower portion during the late dry season. In addition, they also showed a greater preference for Gastropod larvae in the intermediate portion during the early dry season when black MPs mainly contaminated them. Based on this information, we could conclude in this study that A. clupeoides feeds mainly on Zooplankton, so it could be considered a pelagic secondary consumer.
Canonical Correspondence Analysis (CCA) for correlations between PM contamination, food items and environmental variables. Arrows represent the environmental parameters rain (Rain), temperature (Temp), salinity (Sal), dissolved oxygen (O2) and Secchi (Secchi). The triangles ( ) represent the contamination by blue MP (MP Blue), black MP (MP Black) and red MP (MP Red) and the food items (copepod (COP), Gastropod larvae (GASTLarv), Anomolocardia sp. larvae (ANOMLarv), Decapoda zoe larvae (ZOEDECA), Coscinodiscus sp. (COSCI), and Actinopthycus sp. (ACTINOP). The circles ( ) represent the interactions between the factors area (A1; upper, A2; intermediate and A3; lower), season (ED; beginning of dry season, LD; end of dry season, ER; beginning of rainy season and LR; end of rainy season) and ontogenetic phases of A. clupeoides and C. edentulus (juvenile, subadult and adult) in the Goiana River estuary.
Regarding C. edentulus, the genera Coscinodiscus sp. and Actinopthycus sp. were part of the main diet of adults in the lower portion of the estuary during the final rainy season when blue and red MPs contaminated them. At the same time, subadults fed mainly on the same species of diatoms in the lower portion of the estuary during the final dry season and did not show contamination by MPs. All ontogenetic phases of this species fed mainly on phytoplankton and, for that reason, were classified as pelagic primary consumers. The sources of these MPs probably come from different anthropogenic activities (e.g. fishery, industries, urbanization) throughout the river basin (Wickramarachchi et al. 2025). Fishing activities carried out in the estuary and its adjacent areas cause contamination of this coastal estuarine ecosystem. Mainly during the rainy season when, due to bad weather, fishermen restore their nets and throw plastic debris onto the beach (Silva et al. 2018). This poorly packaged waste fragments into MPs and is carried into the main estuary channel. Consequently, especially during the rainy season, in the lower portion of the Goiana River estuary, the concentration of MPs in the water column increases (Lima et al. 2014, Lima et al. 2015). When MPs are available in the water column, the probability of planktophagous fish species being contaminated by MPs is more significant than at other times of the year, as observed in this study.
Studies carried out on the diet composition of other fish species belonging to the Engraulidae family indicated that the species Engraulis encrasilocus, both in the Gulf of Lion - France (Costalago et al. 2012), in the Mauritania Sea - North Africa (Gushchin et al. 2015), in the Aegean Sea - Turkey (Akalin et al. 2018), in Marcelle Bay - France (Chen et al. 2022), in the Adriatic Sea - Italy (Fanelli et al. 2023), indicated that the main food items for this species were also copepods, crustacean larvae, organic matter and diatoms. On the other hand, in studies carried out in the Chikugo River estuary, Japan, larvae and juveniles of Coilia nasus fed mainly on Copepods, while the larvae preferred Mysidacea (Suzuki et al. 2014). This situation was different in juveniles of A. clupeoides because the main composition of the diet was A. flexuosa larvae (Bivalvia), Zoe larvae (Crustacea) and copepods. On the other hand, adults of C. edentulus presented a diet composition mainly of diatoms, as was also observed in the study conducted in the Caeté River estuary (Krumme et al. 2008). Considering the studies realized in the Goiana River estuary and adjacent coastal area, which described the spatiotemporal distribution and feeding ecology of fish belonging to higher trophic levels of the food web, we concluded that A. clupeoides and C. edentulus were essential items for the diet of Cynoscion acoupa (Ferreira et al. 2016, 2018), Centropomus spp. (Ferreira et al. 2019a, b), Rhysoprionodon porosus occurs near the estuarine mouth during the rainy season (Melo et al. 2024). As suggested by Barletta et al. (2023), this research provides a solid foundation for further studies, and the audience’s contribution is crucial to advancing our understanding of these ecosystems to keep them functional and active for the fisheries and socio-economic activities
CONCLUSIONS
This study’s findings on the life cycle and feeding ecology of A. clupeoides and C. edentulus in the Goiana Estuary are significant for both species. The research revealed that these species use the estuary to complete their life cycle, with the ontogenetic phases of each species showing a distribution in the different seasons and areas in the estuary. Adults of A. clupeoides spawn in the upper area of the estuary, mainly at the end of the dry season. At the same time, juveniles are more densely populated in the lower estuary at the end of the rainy season, indicating these areas as nurseries for this species. Similarly, for adults of C. edentulus, the highest density was observed in the upper portion of the estuary during the end of the dry season, where they use this portion of the estuary to spawn.
This estuary plays an important role in the life cycle of A. clupeoides and C. edentulus. The study found that the intermediate portion of the estuary presented minimum values, suggesting that these species only use this transitional environment to reach the upper area for spawning. The time of the year when most individuals were found was at the end of the dry season, indicating that they take advantage of the sea’s entry during the dry season to enter the estuarine portion of the Goiana River. The absence of juveniles in C. edentulous indicates that this estuarine-dependent marine species enters the estuary during the dry season to complete its life cycle.
The interactions in distribution, seasons and different ontogenetic phases are crucial to understanding the feeding and contamination by MPs of A. clupeoides and C. edentulus. A. clupeoides showed a greater preference for zooplankton species and C. edentulus for phytoplankton. Due to their planktophagous habits, both species suggest that MPs contamination occurs mainly when the specimens are filtering the seston. According to studies conducted in this region, the species in this study are prey for other predators of superior trophic levels. Both predator and prey showed contamination by MPs. Therefore, contamination by MPs in the trophic web begins with the planktophagous species. This study is another piece of evidence that reinforces the trophic transfer of MPs in the estuary of Rio Goiana. The conservation status of these species is severely threatened by anthropogenic activities in this estuary, highlighting the urgent need for conservation efforts. In addition, another Engraulidae species which occurs in the Goiana Estuary could also be studied using the same methodology to generate information on feeding ecology and contamination by MPs.
SUPPLEMENTARY MATERIAL
Acknowledgements
Authors acknowledge financial support from Conselho Nacional de Desenvolvimento Científico e Tecnológico through grants (CNPq-Proc.405818/2012-2/COAGR/PESCA, 404931/2016-2, 312401/2021-3; and 305772/2022-8), Fundação de Amparo à Ciência e Tecnologia do Estado de Pernambuco through Grant (FACEPE-Proc.AQP0911-1.08/12) and scholarship (FACEPE/BFP- IBPG-1108-1.08/22; IBPG-1279-3.01/22.). MB, MIBT and FJC are CNPq fellows.
References
- AKALIN, S, MURAT ST, ILHAND & UNLUOGGLU A. 2018. The Diet Composition of European Anchovy, Engraulis encrasicolus (Linnaeus, 1758) in İzmir Bay, Aegean Sea. Turk J Fish Aquat Sci 19(5): 431-445.
- BARLETTA-BERGAN A, BARLETTA M & SAINT-PAUL U. 2002a. Community structure and temporal variability of ichthyoplankton in North Brazilian mangrove creeks. J Fish Biol 61: 33-51.
- BARLETTA-BERGAN A, BARLETTA M & SAINT-PAUL U. 2002b. Structure and seasonal dynamics of larval fish in the Caeté River Estuary in North Brazil. Est Coast Shelf Sci 54(2): 193-206.
- BARLETTA M, AMARAL, CS, CORREA MFM, GUEBERT F, DANTAS DV, LORENZI L & SAINT-PAUL U. 2008. Factors affecting seasonal variations in demersal fish assemblages at an ecocline in a tropical–subtropical estuary. J Fish Biol 73(6): 1314-1336.
- BARLETTA M & BARLETTA-BERGAN A. 2009. Endogenous Activity Rhythms of Larval Fish Assemblages in a Mangrove fringed Estuary in North Brazil. The Open Fish Sci J 2: 15-24.
- BARLETTA M, BARLETTA-BERGAN A, SAINT-PAUL U & HUBOLD G. 2003. Seasonal changes in density, biomass, and diversity of estuarine fishes in tidal mangrove creeks of the lower Caeté Estuary (northern Brazilian coast, east Amazon). Mar Ecol Prog Ser 256: 217-228.
- BARLETTA M, BARLETTA-BERGAN A, SAINT-PAUL U & HUBOLD G. 2005. The role of salinity in structuring the fish assemblages in a tropical estuary. J Fish Biol 66(1): 45-72.
- BARLETTA M & COSTA MF. 2009. Living and non-living resources exploitation in a tropical semi-arid estuary. J Coast Res: 371-375.
- BARLETTA M, COSTA MF & DANTAS DV. 2020. Ecology of microplastics contamination within food webs of estuarine and coastal ecosystems. MethodsX 7: 10086.
- BARLETTA M, CYSNEIROS FJA & LIMA ARA. 2016. Effects of dredging operations on the demersal fish fauna of a South American tropical–subtropical transition estuary. J Fish Biol: doi:10.1111/jfb.12999.
- BARLETTA M, MELO RCB & WHITFIELD AK. 2023. Past and present conservation of south American estuaries. Est Coast Shelf Sci 295: 108542.
- BECK MW ET AL. 2021. The identification, conservation, and management of estuarine and marine nurseries for fish and invertebrates. BioScience 51: 633.
- BOLZAN MS, ANDRADES R, SPACH H, & HOSTIM-SILVA M. 2018. The influence of selected environmental parameters and habitat mosaics on fish assemblages in a South American estuary. J Mar Biol Ass UK 99(1): 1-9. doi:10.1017/S0025315418000012.
- BROWNE MA, DISSANAYAKE A, GALLOWAY TS, LOWE DM & THOMPSON RC. 2008. Ingested microscopic plastic translocates to the circulatory system of the mussel, Mytilus edulis (L.). Environ Sci Technol 42: 5026-5031.
- CHEN C, CARLOTTI F, HARMELLIN-VIVIEN M, LEBRETON B, GUILLOU G, VASALLO L, LEBIJAN M & BANARU D. 2022. Diet and trophic interactions of Mediterranean planktivorous fishes. Mar Biol 169: 119.
- COSTA MF, SILVA-CAVALCANTI JS, BARBOSA CC, PORTUGAL JL & BARLETTA M. 2011. Plastics buried in the inter-tidal plain of a tropical estuarine ecosystem. J Coast Res 64: 339-343.
- COSTALAGO D, NAVARRO J, ÁLVAREZ-CALLEJA I & PALOMERA I. 2012. Ontogenetic and seasonal changes in the feeding habits and trophic levels of two small pelagic fish species. Mar Ecol Prog Ser 460: 169-181.
- DANTAS DV, BARLETTA M, COSTA MF, BARBOSA-CINTRA SCT, POSSATTO FE, RAMOS JAA, LIMA ARA & SAINT-PAUL U. 2010. Movement patterns of catfishes (Ariidae) in a tropical semi-arid estuary. J Fish Biol 76: 2540-2557.
- DANTAS DV, BARLETTA M & COSTA MF. 2012. The seasonal and spatial patterns of ingestion of polyfilament nylon fragments by estuarine drums (Sciaenidae). Environ Sci Pollut Res 19: 600-606.
- DANTAS DV, BARLETTA M, RAMOS JAA, LIMA ARA & COSTA MF. 2013. Seasonal Diet Shifts and Overlap Between Two Sympatric Catfishes in an Estuarine Nursery. Estuaries and Coasts 36: 237-256. DOI 10.1007/s12237-012-9563-2.
- DANTAS DV, BARLETTA M & COSTA MF. 2015. Feeding ecology and seasonal diet overlap between Stellifer brasiliensis and Stellifer stellifer in a tropical estuarine ecocline. J Fish Biol 86(2): 707-733.
- ELLIOTT M, WHITFIELD AK, POTTER IC, BLABER SJM, CYRUS DP, NORDLIE FG & HARRISON TD. 2007. The guild approach to categorizing estuarine fish assemblages: a global review. Fish and Fisheries 8: 241-268.
- FANELLI E DA ROS Z, MENICUCCI S, MALAVOLTI S, BIOAGIOTTI I, CANDUCI G, DE FELICE A & LEONORI I. 2023. The pelagic food web of the Western Adriatic Sea: a focus on the role of small pelagics. Sci Repor 13:14554.
- FERREIRA GVB, BARLETTA M & LIMA ARA. 2019b. Use of estuarine resources by top predator fishes. How do ecological patterns affect rates of contamination by microplastics? Sci Tot Environ 655: 292-304.
- FERREIRA GVB, BARLETTA M, LIMA ARA, DANTAS DV, JUSTINO AKS & COSTA MF. 2016. Plastic debris contamination in the life cycle of Acoupa weakfish (Cynoscion acoupa) in a tropical estuary. ICES J Mar Sci doi:10.1093/icesjms/fsw108.
- FERREIRA GVB, BARLETTA M, LIMA ARA, MORLEY SA & COSTA MF. 2019a. Dynamics of Marine Debris Ingestion by Profitable Fishes Along the Estuarine Ecocline. Sci Reports 9(1): 1-12.
- FERREIRA GVB, BARLETTA M, LIMA ARA, MORLEY SA, JUSTINO AKS & COSTA MF. 2018. High intake rates of microplastics in a Western Atlantic predatory fish, and insights of a direct fishery effect. Environ Pollut 236: 706-717.
- FROESE R & PAULI D. 2024. Fish Base. World wide web electronic publication. www.fishbase, org, version (10/2024).
- GUSHCHIN AV & CORTEN A. 2015. Feeding of Pelagic Fish in Waters of Mauritania: 1. European Anchovy Engraulis encrasicolus, European Sardine Sardina pilchardus, Round Sardinella Sardinella aurita, and Flat Sardinella S. maderensis1. J Ichthyology 55(1): 77-85.
- INMET. 2014. Instituto Nacional de Meteorologia. www.inmet.gov.br.
- KRUMME U, KEUTHEN H, BARLETTA M, SAINT-PAUL U & VILLWOCK W. 2008. Resuspended intertidal microphytobenthos as major diet component of planktivorous Atlantic anchoveta Cetengraulis edentulus (Engraulidae) from equatorial mangrove creeks. Ecotropica 14: 121-128.
- KUTNER MH, NACHTSHEIM CJ, NETER J & LI W. 2005. Applied Linear Statistical Models. 5th Edition, McGraw-Hill, Irwin, New York.
-
LEBRETON LCM, VAN DER ZWET J, DAMSTEEG JW, SLAT B, ANDRADY AL & REISSER J. 2017. River plastic emissions to the world’s oceans. Nat Commun 8: 15611. https://doi.org/10.1038/ncomms15611.
» https://doi.org/10.1038/ncomms15611 - LIMA ARA, BARLETTA M & COSTA MF. 2014. Distribution patterns of microplastics within the plankton of a tropical estuary. Environ Resear 132: 146-155.
- LIMA ARA, BARLETTA M & COSTA MF. 2015. Seasonal distributions and interactions between plankton and microplastics in a tropical estuary. Est Coast Shelf Sci 165: 213-225.
- LIMA ARA, BARLETTA M, COSTA MF, RAMOS AA, DANTAS DV, MELO PAMC, JUSTINO AKS & FERREIRA GVB. 2016. Changes in the composition of ichthyoplankton assemblage and plastic debris in mangrove creeks relative to moon phases. J Fish Biol 89: 619-640.
- LUSHER AL, HOLLMAN P & MANDOZA-HILL J. 2017. Microplastics in Fisheries and Aquaculture. 1st ed., Food and Agriculture Organization of the United Nations, Rome.
- MELO RRCB, BARLETTA M, CYSNEIROS FFJA, TAVARES MIB, SANTANA KS, CARTY S & MORLEY SA. 2024 Top Predator Feeding Ecology and Microplastic (MP) Contamination on the far Eastern South American Coast: Evidence of MP Trophic Biotransfer. Est Coast Shelf Sci 301: 108736.
-
NELDER JA & MCCULLAGH P. 1983. Generalized Linear Models. Routledge. https://doi.org/10.1201/9780203753736
» https://doi.org/10.1201/9780203753736 - ODUM WE. 1984. Dual-gradient concept of detritus transport and processing in estuaries. Bull Mar Sci 35(3): 510-521.
-
PALMER MW. 1993. Putting things in even better order: the advantages of canonical correspondence analysis. Ecology 74: 2215-2230. https://doi.org/10.2307/1939575.
» https://doi.org/10.2307/1939575 - RAMOS JAA, BARLETTA M, DANTAS DV, LIMA ARA & COSTA MF. 2011. Influence of moon phase on fish assemblages in estuarine mangrove tidal creeks. J Fish Biol 78(1): 344-354.
- RAMOS JAA, BARLETTA M, DANTAS DV & COSTA MF. 2016. Seasonal and spatial ontogenetic movements of Gerreidae in a Brazilian tropical estuarine ecocline and its application for nursery habitat conservation. J Fish Biol 89(1): 696-712.
- RIGBY RAD, STASINOPOULOS MD, HELLER ZG & DEBASTIANI F. 1999. Distributions for Modelling Location, Scale, and Shape Using GAMLSS in R. Chapman and Hall/CRC.
-
ROCHMAN CM, BROWNE MA, HALPERN BS, HENTSCHEL BT, HOH E, KARAPANAGIOTI HK, RIOS-MENDOZA LM, TAKADA H, TEH S & THOMPSON RC. 2013. Policy: classify plastic waste as hazardous. Nature 494: 169-171. https://doi.org/10.1038/494169a.
» https://doi.org/10.1038/494169a - SILVA JDB, BARLETTA M, LIMA ARA & FERREIRA GV. 2018. Use of resources and microplastic contamination throughout the life cycle of grunts (Haemulidae) in a tropical estuary. Environ Poll 242: 1010-1021.
- SUZUKI K, KANEMATSU Y, NAKAYAMA K & TANAKA M. 2014. Micro distribution and feeding dynamics of Coilia nasus (Engraulidae) larvae and juveniles in relation to the estuarine turbidity maximum of the macrotidal Chikugo River estuary, Ariake Sea, Japan. Fish Oceanogr 23(2): 157-171.
-
TER BRAAK CJF. 1986. Canonical correspondence analysis: a new eigenvector technique for multivariate direct. Gradient Anal Source Ecol 67: 1167-1179. doi.org/10.2307/1938672.
» https://doi.org/10.2307/1938672 - TER BRAAK CJF & SMILAUER P. 2002. CANOCO references manual and Canoco Draw for windows user’s guide: software for canonical community ordination (version 4.5). [WWW document]. URL. www.canoco.com.
- WHITFIELD AK, ABLE KW, BARLETTA M, BLABER SJM & HARRISON T D. 2023. Life-history guilds of fishes associated with estuaries: opportunism versus dependency. Est Coast Shelf Sci 292: 108456.
- WICKRAMARACHCHI C, NIVEN RK & KRAMER M. 2025. Numerical plastic transport modelling in fluvial systems: Review and formulation of boundary conditions. Water Res 273: 122947.