 Metformin hydrochloride extended-release tablets: perception of the occurrence of gastrointestinal adverse events and biopharmaceutical evaluation
Abstract
Diarrhea is a common adverse event at the beginning of metformin hydrochloride use. Extended-release (XR) tablets are an alternative for patients intolerant to the immediate-release formulation. This study evaluated the perception of gastrointestinal adverse events (GAE), quality, and dissolution behavior between reference (R) and generic (G) XR formulations. A prospective cohort study recorded diarrhea, abdominal discomfort, and impact on daily activities using a perception form. R and G were analyzed for quality and dissolution behavior. Among 29 patients, 16 used R (55.2%) and 13 G (44.8%). Both groups presented GAE (diarrhea: R= 8, G= 8; abdominal discomfort: R= 9, G= 7). BMI was significantly associated with the occurrence of GAE regardless of the medications studied. All samples met pharmacopoeial quality standards. The Higuchi model best described the dissolution kinetics of R, and Peppas-Sahlin for G. The dissolution profiles were similar (F2= 67), although the dissolution efficiency differed by more than 10%. Our findings reinforce the interchangeability between reference and generic medicines, providing an effective option for patients with type II diabetes mellitus. This strengthens the principles of the National Generic Medicines Policy in Brazil, contributing to the sustainability of the healthcare system and the democratization of access to essential medicines.
Key words
Diarrhea; Dissolution profile; Flatulence; Nausea; Type II diabetes mellitus
INTRODUCTION
According to the International Diabetes Federation (IDF) (IDF 2025), the number of people with diabetes mellitus (DM) in 2024 was 588.7 million worldwide and 16.6 million in Brazil. Metformin hydrochloride (MET) is an orally administered antihyperglycemic agent and is considered the first-choice drug for the treatment of type II diabetes mellitus (DM2) (Elgawish et al. 2019).
The primary described mechanism of action of MET involves the inhibition of hepatic gluconeogenesis. However, increasing evidence indicates that its action occurs primarily in the gastrointestinal system, with the intestine being the initial and principal site of action (Cheng et al. 2024). Additionally, Duca et al. (2015) reported that the reduction of hepatic gluconeogenesis by MET requires activation of the duodenal glucagon-like peptide-1 (GLP-1) receptor, involving protein kinase A (PKA) signaling and a neuron-mediated pathway connecting the intestine and liver through the brain. This highlights the role of the duodenal GLP-1 receptor in the effect of MET via the intestine-liver-brain axis (Duca et al. 2015).
The main adverse events (AE) related to MET use are gastrointestinal disorders, with diarrhea and nausea being the most common (Bonnet & Scheen 2017). Diarrhea associated with MET use typically appears at the beginning of treatment but may recur with chronic use (Burton et al. 2015). Such events are more frequent in patients using immediate-release (IR) formulations compared to those using extended-release (XR) forms. The XR formulation has been the most prescribed therapeutic option for patients intolerant to the IR formulation, in addition to exhibiting less fluctuation in plasma levels and offering easier dosage regimens (Derosa et al. 2017, Nabrdalik et al. 2022).
The transport proteins that facilitate the intestinal absorption of MET are primarily organic cation transporters (OCTs), plasma membrane monoamine transporter (PMAT), and serotonin transporter (SERT), contributing approximately 25%, 20%, and 20%, respectively, to its transport (Cheng et al. 2024, Han et al. 2015).
Several factors can influence the transport and absorption of MET. OCTs act as inflow pumps, and a reduction in their expression or activity in the intestine, as well as their saturation, can result in the accumulation of MET in the lumen, contributing to drug intolerance (McCreight et al. 2016). Similarly, Dawed et al. (2019) suggest that genetic variations affecting the expression of PMAT, located apically on the enterocyte membrane, may also lead to luminal accumulation of MET, increasing the risk of gastrointestinal adverse events (GAE) (Dawed et al. 2019). Additionally, MET shares structural similarities with the neurotransmitter serotonin, leading to competition for the same transporter (SERT). As a result, serotonin accumulates in the intestine, potentially causing nausea, vomiting, and diarrhea (Cheng et al. 2024, Cubeddu et al. 2000, McCreight et al. 2016).
In a systematic review and meta-analysis, Nabrdalik et al. (2022) evaluated the risk of GAE in patients with DM2 treated with MET. Although they did not identify a significant risk of GAE associated with either the dose or duration of MET treatment, they observed that the XR formulation is associated with a lower risk of bloating and diarrhea compared to the IR formulation (Nabrdalik et al. 2022). This is likely related to the drug release rate from the pharmaceutical form, as faster release rates lead to increased intestinal concentrations, resulting in transporter saturation. Conversely, a reduction in GAE is expected with slower release rates of MET. However, no studies have yet compared GAE across different dosage forms.
Several studies have reported that MET can induce changes in the intestinal microbiota (Jones & Molloy 2021, McCreight et al. 2016, Mueller et al. 2021). MET positively stimulates the growth of bacteria that produce short-chain fatty acids (SCFA), leading to elevated SCFA levels in the colon. This enhances glucose regulation by increasing GLP-1 secretion and activating intestinal gluconeogenesis, thereby improving host metabolism (Mueller et al. 2021). While MET has a beneficial impact by reducing the presence of Bacteroides fragilis and increasing Lactobacillus spp. and Akkermansia spp. (Ke et al. 2021), microorganisms involved in folic acid production, which may be negatively affected by the drug’s action. This disruption can create an imbalance in the intestinal microbiota, adversely affecting other folic acid-dependent species. Consequently, potentially virulent strains may develop in the lumen, causing cramps, abdominal pain, and diarrhea, amplifying GAE (Olgun 2017).
To date, studies have compared the frequence of GAE, as well as other parameters related to this drug and DM2, involving immediate-release and MET-XR formulations (Blonde et al. 2004, Cander et al. 2014, Donnelly et al. 2009, Du et al. 2024). However, no previous investigation in Brazil has focused on comparing the perception of GAE between reference and generic XR formulations, which are available through the Brazilian Popular Pharmacy Program. This comparison is essential to corroborate the principles of the National Policy on Generic Medicines in Brazil, as well as to provide trustworthy evidence supporting their interchangeability.
In this context, this study aimed to investigate potential differences in the perception of GAE among users of different presentations of 500 mg MET-XR. Additionally, it sought to evaluate the quality and release rate of the drug from its pharmaceutical form, considering its widespread accessibility through the Brazilian Popular Pharmacy Program.
MATERIALS AND METHODS
Assessment of the occurrence of gastrointestinal adverse events
Study design
This prospective cohort study evaluated the occurrence of GAE in patients with DM2 who initiated treatment with MET-XR tablets.
The study protocol (CAAE 35995620.0.0000.5545) was approved by the National Research Ethics Commission (CONEP) of Brazil under opinion number 4,499,538.
Context (setting)
The study was conducted in two private drugstore chains located in two cities in the interior of the State of Minas Gerais, registered with the Popular Pharmacy Program of the Ministry of Health. Patients were also recruited from the Brazilian Public Health System (SUS).
Participants were recruited by the study team during medicine dispensing services. All eligible patients, whether they accepted or declined participation, were instructed on the occurrence of GAE, disease management, and the proper use and disposal of medicines. These instructions were provided using booklets validated by Aquino et al. (2017), which were delivered and explained to patients (https://ufsj.edu.br/lafarc/arquivos.php). Only those who agreed to participate in the study answered questions about their eating habits and lifestyle and were guided in completing the AE perception form.
Participants
Patients aged 18 years or older who initiated treatment with MET-XR tablets for the first time, sought the service during the study period, and agreed to participate after reading and signing the Free and Informed Consent Form, were eligible to participate. For accompanied patients, the guidelines were provided to their caregiver or legal representative. Pregnant women were excluded from the study. Participants were paired by category (reference or generic) and age, with a variation of ± 5 years. Those who did not return or submit the completed AE awareness form within 90 days were classified as dropouts.
Forms employed
The recruitment form included questions related to the study’s inclusion and exclusion criteria. Additionally, data such as gender and the category of medicine purchased were collected. The questionnaire used (Supplementary Material - Appendix S1) to assess eating habits and lifestyle addressed the daily and weekly frequency of fruit, vegetable, and alcoholic beverage consumption. Participants also reported their daily bowel movement frequency and the presence of diarrhea in the previous month.
The GAE perception form was developed based on the questionnaire validated by Lui et al. (2017). This included stickers to classify the intensity of diarrhea as mild, moderate, or severe, depending on the number of stickers used, making it easier to complete. Participants were also asked to rate, on a scale from 0 to 10, how GAE impacted their daily activities, level of disposition, mood, family, and social life.
During the interview, patients were informed about how to complete the AE perception form, its characteristics, and the appropriate actions to take if GAE occurred. Patients were instructed to return the form during their next medicine purchase, within a period of 30 to 90 days. Alternatively, they could send a photo of the completed form via the WhatsApp® application. Those who failed to return the form within 30 days were contacted by telephone.
Bias
To minimize memory bias, patients were provided with the AE awareness form to complete at home. To address selection bias, all site teams involved in the study received specific training to assist with patient recruitment.
Study population
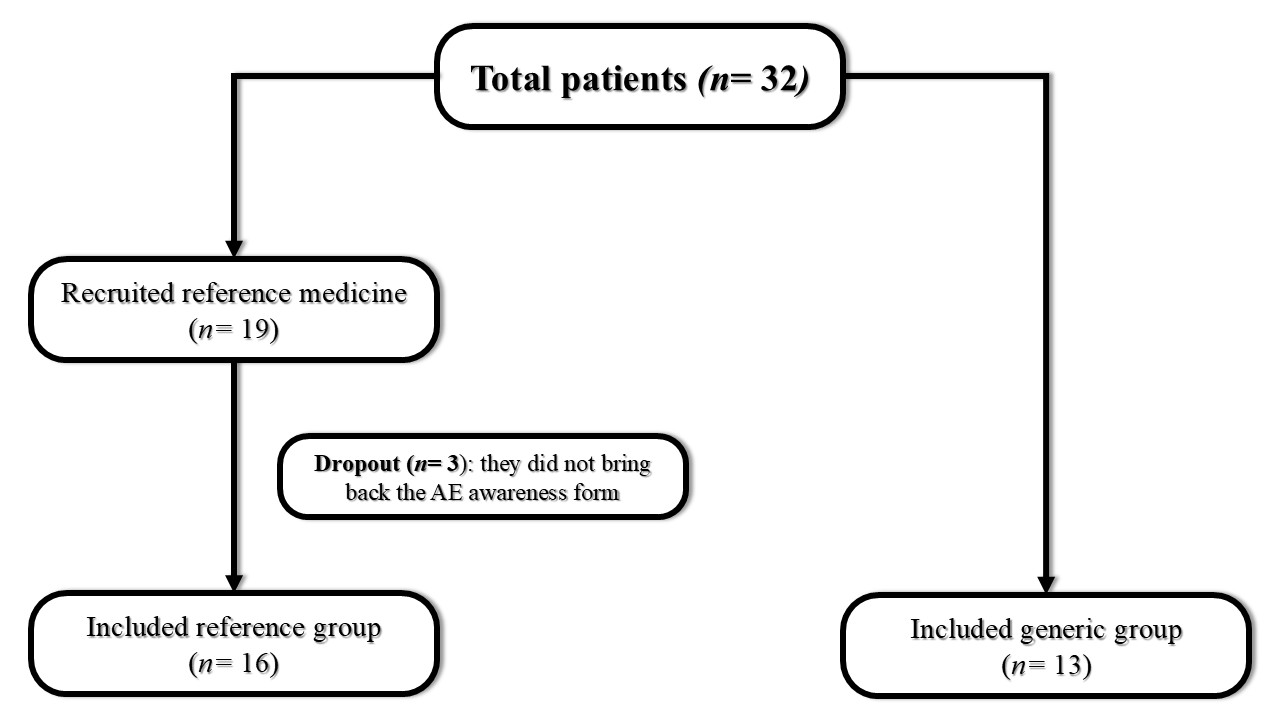
All patients with DM2 (n= 32) who sought the service from March 2021 to June 2022 to initiate MET-XR treatment for the first time were considered eligible. However, after three withdrawals (n= 3), twenty-nine individuals (n= 29) remained in the study. The small sample size can be attributed to the COVID-19 pandemic, which required the suspension of data collection at various points during the study, thereby limiting our findings.
Quantitative variables
The variables weight, height, and age were self-reported using a recruitment form. The frequency of daily and weekly consumption of fruits, vegetables, and alcoholic beverages was obtained through the eating habits and lifestyle assessment questionnaire. Statistical analysis was then used to determine whether these variables contributed to the occurrence of GAE.
Additionally, the AE perception form, validated by Lui et al. (2017) and adapted for this study, provided data on the daily and monthly frequency of diarrhea episodes, as well as the presence of abdominal discomfort over 30 days.
The presence of diarrhea and abdominal discomfort was classified as GAE. Body mass index (BMI) was calculated using the ratio of weight (kg) to height (m) squared (Bertoluci et al. 2023).
Quality assessment of metformin hydrochloride extended-release tablets, and dissolution behavior biopharmaceutical study
Pharmaceutical specialties
The tablets were purchased in October 2021 in the pharmaceutical form of MET-XR, comprising a reference medicine (R) and a generic medicine (G). The samples were selected based on their availability at the locations where the cohort study was conducted. Table I presents the composition of the excipients.
Excipients present in decreasing order of concentration, as described in the leaflets of the pharmaceutical specialties used in the study.
Reagents
Quality tests, and dissolution behaviors were carried out using anhydrous dibasic sodium phosphate, anhydrous monobasic potassium phosphate purchased from the company Synth® (Diadema, Brazil), and sodium hydroxide obtained from the company Isofar® (Duque de Caxias, Brazil). The chemical reference substance (RS) of MET was purchased from the American Pharmacopoeia (Rockville, USA). The purified water was obtained from Spencer deionizer model 165p – 43V (Santo André, Brazil). The preparation of 0.05 mol/L phosphate buffer (pH 6.86) was carried out according to the American Pharmacopoeia (USP 2021).
Equipaments
Bel® analytical balance, model M214 A (Monza, Italy); IKA® magnetic stirrer model RT10 (Wilmington, USA); Tecnopon® digital pH meter, model MPA 210 (Piracicaba, Brazil); Logan Instruments® Dissolutor, model UDT-812GS (Somerset, USA); Shimadzu® Spectrophotometer, model UV-Mini 1240 (Kioto, Japan).
Quality assessment
Pharmacopoeial tests were performed as described for Metformin Hydrochloride Extended-Release Tablets: unit dose uniformity (weight variation) and dissolution (ultraviolet [UV] detection). However, the MET assay was conducted using the absorption spectrophotometry technique in the UV region (232 nm) instead of high-performance liquid chromatography (HPLC). It is noteworthy that the employed technique is described for Metformin Hydrochloride Tablets, is applied to IR dosage form (USP 2021), and is also more cost-effective. To address the limitations of the spectroscopic method, such as sensitivity to impurities and degradation products, partial validation was performed (Brazil 2017).
Partial validation
The quantification of MET in tablets was not carried out using the HPLC method. Therefore, partial validation was conducted using absorption spectrophotometry in the ultraviolet region, in accordance with the analytical methods validation guide of the National Health Surveillance Agency (Anvisa) (Brazil 2017). The evaluated parameters included linearity, precision, accuracy, and selectivity.
To determine linearity, three analytical MET curves were prepared in triplicate on three different days. The linearity of the curve at concentrations of 1.0, 4.0, 7.0, 10.0, and 13.0 µg/mL was evaluated using the ordinary least squares method (OLSM) (Brazil 2017).
Precision and accuracy were assessed at three concentration levels: low (2.0 µg/mL), medium (6.0 µg/mL), and high (12.0 µg/mL). For each level, three solutions were independently prepared on three different days. The relative standard deviation and recovery percentage were used to evaluate precision and accuracy, respectively.
Selectivity was assessed by preparing an aqueous solution fortified with croscarmellose sodium, microcrystalline cellulose, and Hypromellose (Dilebo & Gabriel 2019). Partial validation included water as the solvent for assay, while for the dissolution behavior, a 0.05 mol/L (pH= 6.86) phosphate buffer solution was used as the solvent.
Assay
To determine the drug content, twenty units (n= 20) were weighed and pulverized. An amount of powder equivalent to 100 mg of MET was transferred to a 100 mL volumetric flask, and approximately 50 mL of deionized water was added. The mixture was stirred for 15 minutes. The volume was then adjusted with the same solvent, and the solution was homogenized, yielding a concentration of 1.0 mg/mL. The sample was filtered (qualitative filter, diameter: 12.5 cm) and diluted with the same solvent to a concentration of 10 μg/mL. Measurements were taken using a UV-Visible spectrophotometer at 233 nm, with water used to adjust the zero. The test was performed in triplicate (USP 2021). The MET content was determined using an analytical MET RS curve.
Uniformity of unit doses
To determine the uniformity of drug distribution in pharmaceutical units, the weight variation method was applied. The number of samples tested varied according to the pharmacopoeial specification and the respective stages of approval. The acceptance value (AV) was calculated according to Equation 1 (USP 2021):
Where, M is the reference value,  represents the average of individual contents, n is the number of units tested, k is the acceptability constant, being 2.4 for n= 10, and 2.0 for n= 30 and, s represents the standard deviation of the sample (USP 2021).
Dissolution test
One thousand milliliters of phosphate buffer (pH 6.8) and a paddle set at 100 rpm for 10 hours were used as dissolution conditions (n= 6). A 5 mL aliquot was withdrawn from the dissolution medium at 1, 3, and 10-hour intervals, with the volume in the medium replaced after each withdrawal. Each sample was filtered (qualitative filter), and 2 mL of the filtrate was transferred to a 100 mL volumetric flask. The volume was adjusted with phosphate buffer (pH 6.8), applying the same dilution procedure for all samples, to obtain a theoretical concentration close to 10 μg/mL for spectrophotometric reading. This approach ensured consistency of sample preparation across time points, independent of the percentage of drug dissolved at each interval. Measurements were taken at 232 nm, with phosphate buffer used to adjust the zero.
The following tolerance limits were considered for each time point: 20% to 40% of the MET amount dissolved in 1 hour, 45% to 65% in 3 hours, and above 90% in 10 hours (USP 2021). For MET quantification in the dissolution medium, the previously validated spectrophotometric method was used. The amount of MET was determined using an analytical MET RS curve.
Dissolution behavior
The test (n= 12) was conducted in accordance with RDC No. 31, dated August 11, 2010, under the same conditions as the dissolution test (Brazil 2010). Aliquots were withdrawn at 0.5, 1, 2, 3, 4, 6, 8, and 10 hours, with the volume in the medium replaced after each withdrawal. Each sample was diluted in the same manner as described in the dissolution test and measured at 232 nm, with phosphate buffer used to adjust the zero. The concentrations at each time point were determined using an analytical MET RS curve, as described in the partial validation.
Comparison of dissolution behaviors, and determination of dissolution kinetics
The drug dissolution behavior was plotted by graphing the average percentage dissolved (n= 12) as a function of time. The yield percentage values obtained were compared using the similarity factor (F2) based on the independent model method, as established in Resolution RDC No. 31, dated August 11, 2010, according to Equation 2. Dissolution behaviors with F2 values > 50 were considered similar (Brazil 2010, Moore & Flanner 1996).
Where, n is the number of collection times considered for F2 calculation purposes, Rt is the percentage dissolved at time t, obtained with the Reference Medicine or Comparator, and Tt is the percentage dissolved at time t of the Test Medicine or altered formulation (Brazil 2010, Moore & Flanner 1996).
The dissolution efficiency (DE) was determined as proposed by Khan (1975). It is a metric used to evaluate drug dissolution in in vitro assays and can be defined as the area under the dissolution curve up to a certain time, expressed as a percentage of the area of the rectangle described by 100% dissolution. DE is applied to compare different formulations or production methods, assessing performance in terms of drug release. There is no defined value to classify DE, as it depends on the type of formulation, therapeutic goal, and expected dissolution behavior. However, for comparative studies, a difference of up to 10% between two products may be considered acceptable. The DE calculation, expressed as a percentage, is performed according to Equation 3 (Anderson et al. 1998, Khan 1975).
Where,  refers to the area under the dissolution behavior curve, y100 represents the maximum possible dissolution value, typically 100%, which corresponds to the complete release of the active pharmaceutical ingredient, and t is the total time interval evaluated in the dissolution test (Anderson et al. 1998, Khan 1975).
Additionally, the following dependent models were used to evaluate and compare dissolution kinetics: Zero-order, First-order, Higuchi, Korsmeyer-Peppas, Hixson-Crowell, Hopfenberg, Baker-Lonsdale, Peppas-Sahlin, Quadratic, Weibull, Logistic, and Gompertz. The best model was selected based on the adjusted coefficient of determination (R²adjusted) and the model selection criteria (MSC). Furthermore, the average dissolution time (ADT) for each sample was determined. All calculations were performed using the Microsoft Office Excel® add-in DDsolver® (Zhang et al. 2010).
Statistical analysis
Data from the GAE perception study were collected using the Questionnaire Development System (QDS®) V2.6.1 program. Continuous variables were first tested for normal distribution using the Kolmogorov-Smirnov test. If data followed a normal distribution (p > 0.05), parametric tests were applied, otherwise, non-parametric tests were used. For comparisons between two independent groups (R vs G), the independent t-test or Mann-Whitney U test was applied, depending on the distribution. For paired samples, the Wilcoxon Signed Rank test was used. Categorical variables were analyzed using Pearson’s chi-square test.
The Kolmogorov-Smirnov test was applied for the descriptive analysis of the data (age, weight, height, BMI, diarrhea, and abdominal discomfort), considering a normal distribution when p > 0.05. The independent t-test was used to compare parametric data (weight, height, and BMI). Non-parametric data (age) were analyzed using the Wilcoxon Signed Rank Sum Test, and for independent samples, the Mann-Whitney U Test (diarrhea as total days and episodes per month; abdominal discomfort as total days). Pearson’s Chi-square test was used for categorical variables (sex; diarrhea at baseline, presence of diarrhea, and levels categorized as mild, moderate, and severe; abdominal discomfort by presence and levels categorized as mild, moderate, severe, and very severe; and the influence of bowel habits on daily activities, disposition level, bad mood, family life, and social life). All analyses were performed using IBM® SPSS® statistical software, with significance level of 5% (p < 0.05).
When evaluating the frequency of abdominal discomfort, the data were categorized into four quartile ranges or quartiles, with the frequency of abdominal discomfort being low: 0 times; average: 1 to 2 times; high: 3 to 9 times; very high: 10 to 30 times. To assess the impact on patients’ quality of life, the data were categorized into 3 quartile ranges or quartiles, with little being: 0 to 3; reasonable: 4 to 7; a lot: 8 to 10.
For the analytical curves, linearity was assessed following RDC No. 166, dated July 24, 2017 (Brazil 2017), which is aligned with the International Council for Harmonization (ICH) guideline Q2(R1) on validation of analytical procedures (FDA 2021). This ensured compliance with internationally recognized criteria for method validation. The normality of the dissolution data was confirmed before applying the Student’s t-test.
To quantify the MET, analytical curves were constructed, which were subjected to the statistical treatment of linearity using treatment of outliers by the Jacknife test, normality by the Ryan-Joyner test, independence of residues by the Durbin-Watson test, and homoscedasticity by the Brown-Forsythe test.
Regarding the results of pharmacopeial tests and dissolution behaviors, statistical analysis was performed using GraphPad Prism® software version 8.0 (GraphPad Software Inc., CA, USA). The results were expressed as arithmetic average values and standard deviation ( ± SD). Student’s t-test was applied to compare paired values, using a significance level of 95% (p < 0.05).
RESULTS
Sixteen patients (55.2%) who used the reference medicine (R) and thirteen (44.8%) who used the generic medicine (G) were included in the study. Three (n= 3) patients were treated as losses because they did not return the AE perception form, as shown in Figure 1.
Flowchart of patients using metformin hydrochloride 500 mg extended-release recruited for the study (Junior et al. 2023).
The data obtained from the evaluation of the eating habits of the participants in this study showed that the majority frequently consume fruits (n= 22; 75.9%), raw vegetables and salads (n= 20; 69.0%), and cooked vegetables (n= 24; 82.8%). Furthermore, 86.2% of patients (n= 25) reported never or rarely drinking alcohol. Regarding the frequency of bowel movements, eighteen participants (n= 18; 62.1%) reported going to the bathroom once a day, seven (n= 7; 24.1%) twice a day, and four (n= 4; 13.8%) three or more times a day.
Sociodemographic data, as well as the perception of GAE associated with the use of MET-XR in the two groups of recruited patients, and the analysis of the presence and absence of GAE according to the study variables, are described in Tables II and III, respectively.
The GAE were noticeable, but it was not possible to relate them to the use of medicine R (n= 9) or G (n= 9). Furthermore, the use of medicine G significantly impacted the daily activities, family, and social lives of the study participants. In Table III, when evaluating possible variables that may have contributed to the emergence of GAE, only BMI showed a statistically significant relationship.
Sociodemographic data, and perception of gastrointestinal adverse events of patients selected for the study and treated with metformin hydrochloride 500 mg extended-release reference (R), and generic (G), in Minas Gerais, Brazil 2021 - 2022 (n= 29).
In the present study, the statistical analyses performed did not include adjustments for multiple comparisons. It is important to note that p-values were presented descriptively, requiring careful interpretation of the results. However, it is known that the absence of such adjustments may increase the risk of identifying statistically significant associations by chance.
To evaluate the quality of MET-XR tablets, partial validation was performed. The linearity test resulted in an average linear correlation coefficient (r) of 0.9999 for dosing and 0.9999 for dissolution, respectively. Since the values obtained were higher than the minimum acceptance criterion (r ≥ 0.990), the test was considered satisfactory (Brazil 2017). The homoscedasticity of the data was confirmed using the OLSM.
In evaluating precision and accuracy, the inter-day coefficient of variation was 2.15% to 3.74% for the assay test and 1.61% to 5.36% for dissolution. Furthermore, with regard to selectivity, no interference from excipients was observed at the same wavelength used to quantify MET (232 nm) (Dilebo & Gabriel 2019). Therefore, it was demonstrated through the parameters of linearity, precision, accuracy, and selectivity that the pharmacopoeial methods used for the quantification of MET in the dissolution medium and in the XR tablets were suitable.
Table IV shows the results regarding the quality control of the tablets for the unit dose uniformity tests using the weight variation method, dissolution test, and assay.
Uniformity values of unit doses by the method of weight variation, dissolution, and assay of metformin hydrochloride 500 mg extended-release tablets used in the study.
Both samples exhibited satisfactory results for the weight variation, dissolution, and assay tests. In the dissolution test, the samples from group G met the specifications according to the criteria established for the L2 stage (Table IV).
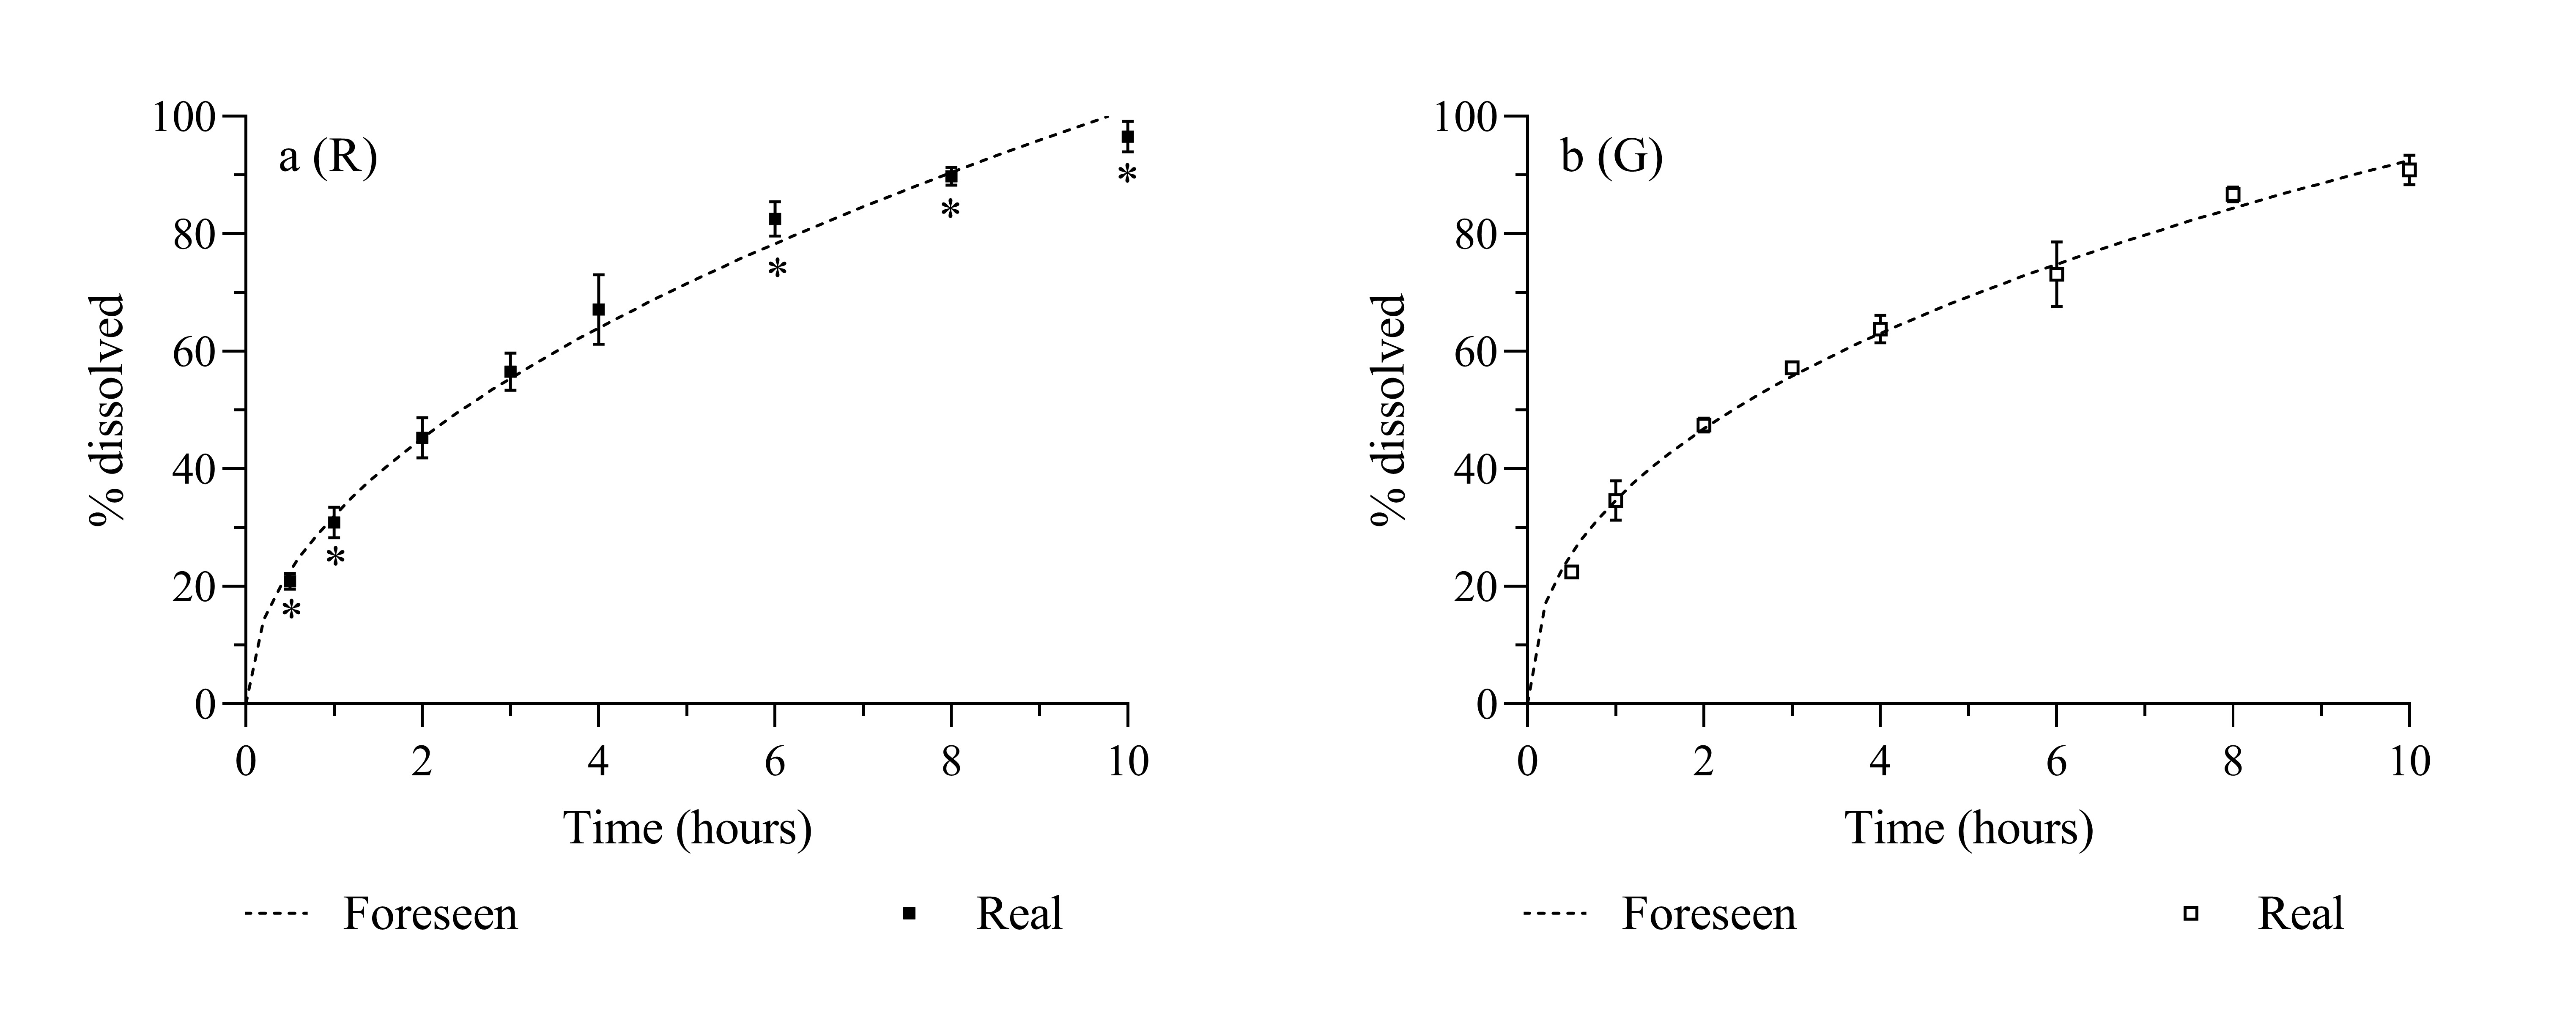
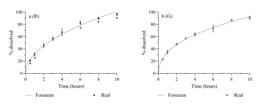
From the dissolution behavior, dependent mathematical models were calculated to evaluate the dissolution kinetics of the two formulations of MET-XR, as shown in Table V, Figure 2, and Figure 3.
Results of kinetic models, and dissolution mechanisms for the 500 mg extended-release metformin hydrochloride medicine, obtained through mathematical models. Results expressed as average (n= 12).
Flowchart of patients using metformin hydrochloride 500 mg extended-release recruited for the study (Junior et al. 2023).
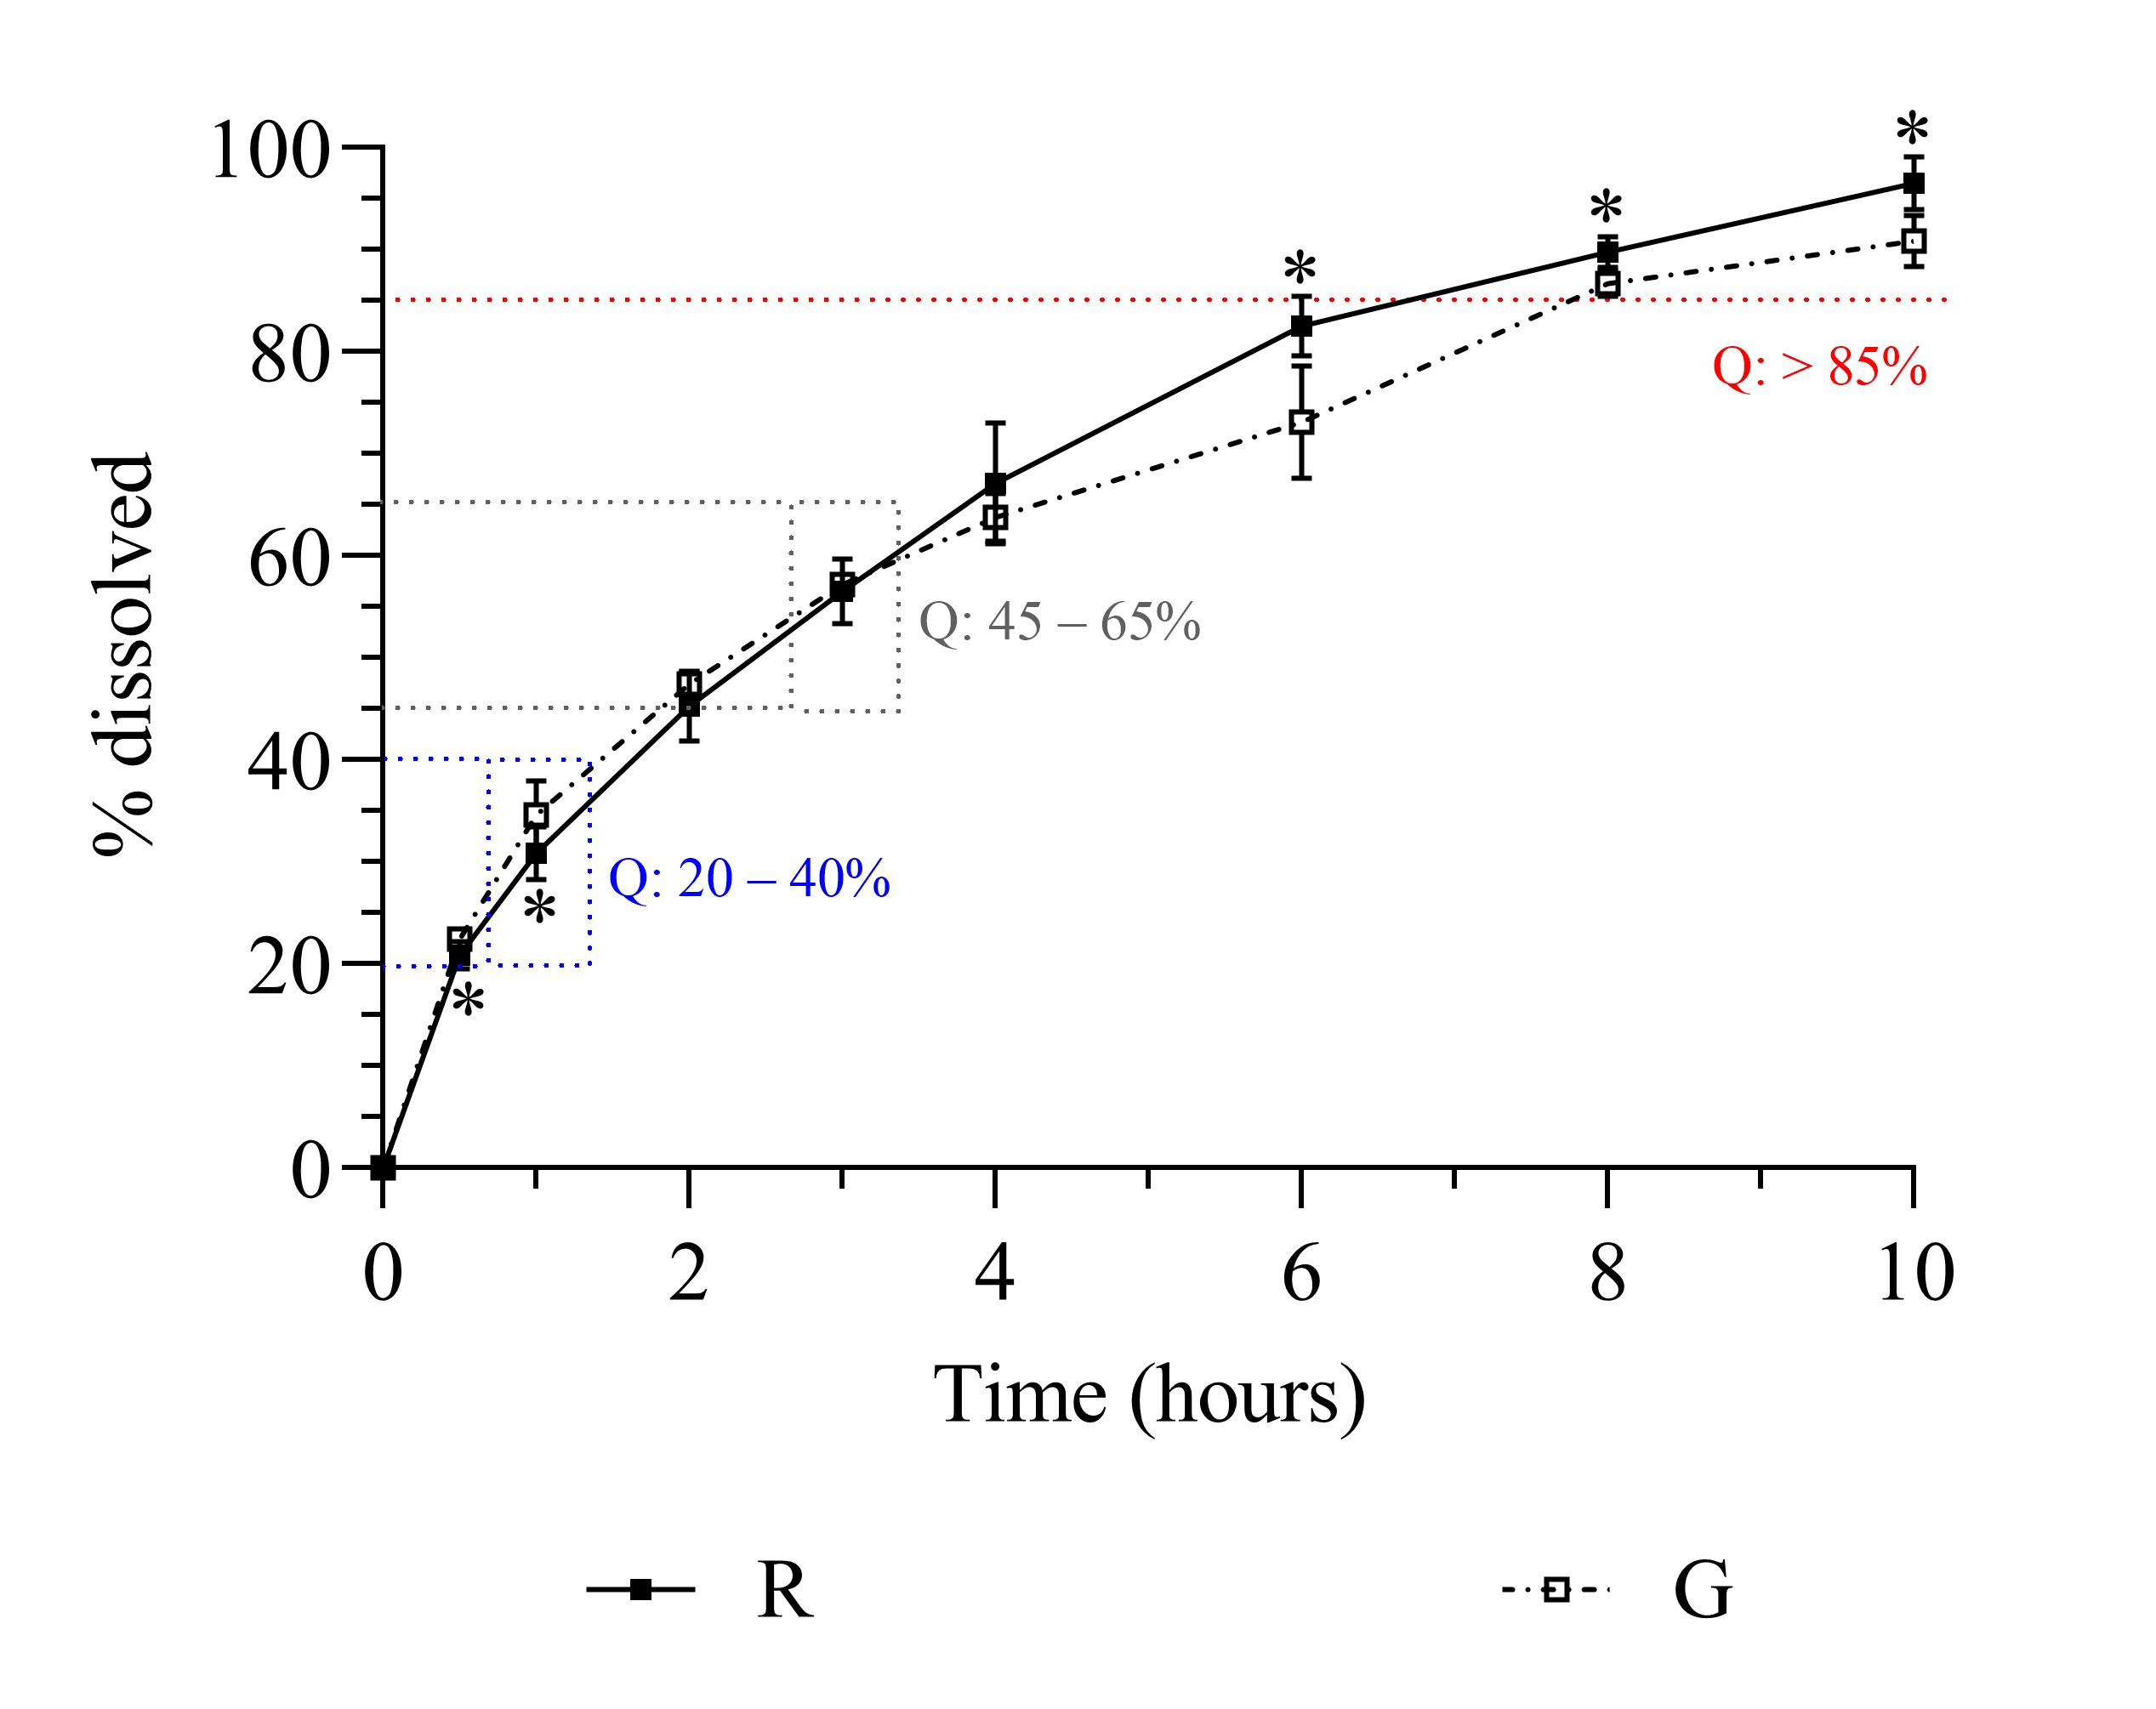
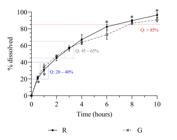
Dissolution behavior of metformin hydrochloride 500 mg extended-release tablets, where R: reference medicine, G: generic medicine, and Q: Tolerance established by the United States Pharmacopeia (USP 2021). *Significant difference between R and G (p < 0.05).
Figure 2 allows a direct comparison of the dissolution behaviors between MET-XR formulations R and G. It can be observed that both formulations reached the yield percentages established in the predetermined times (1, 3, and 10 hours), as recommended by The United States Pharmacopeia (Table IV) (USP 2021). However, G exhibited significantly faster drug release in the initial hours (30 and 60 minutes).
The best mathematical models that described the dissolution kinetics for groups R and G were Higuchi and Peppas-Sahlin, respectively (Table V). Data shown in Figure 3. Although tablets R and G presented different dissolution kinetics, the F2 value (similarity factor) was 67, indicating that the dissolution behaviors are similar (Brazil 2010).
Finally, Table VI presents the values of DE (%) and ADT (h). R and G medicines showed similar ADT, although the DE differed by more than 10%. This finding, along with the dissolution kinetics found, can likely be attributed to the composition of the tablets in question.
Dissolution efficiency, and average dissolution time of metformin hydrochloride 500 mg extended-release tablets (n= 12). Data expressed as average (± SD).
DISCUSSION
To our knowledge, this is the first study to evaluate GAE perception between two formulations of MET-XR medicines. Our findings demonstrate that there was no difference in the perception of GAE regardless of the category studied (reference and generic medicines). Although BMI was significantly associated with the occurrence of GAE in the overall analysis (Table III), there was no significant difference in BMI values between patients using the R and G formulations (Table II). Therefore, this variable might represent a confounding factor that influences the perception of GAE, rather than a determinant of the differences between the reference and generic medicine.
Comparison between the presence or absence of gastrointestinal adverse events (GAE) according to the study variables (n= 29).
Patients diagnosed with DM2 are, for the most part, overweight (Bertoluci et al. 2023). This is consistent with the findings of the present study, in which both groups had a BMI above 25.0 (Table II). Eslick & Talley (2016) demonstrated that gastrointestinal disorders are directly related to an increase in BMI. Obese individuals, followed by overweight patients, exhibited a higher frequency of gastrointestinal symptoms, particularly abdominal pain, esophageal symptoms, and diarrhea (Eslick & Talley 2016).
In a study conducted in the United States, an increase in BMI was observed to lead to vomiting, abdominal pain, edema, and diarrhea (Delgado-Aros et al. 2004). Similarly, Aro et al. (2005) conducted an endoscopic study in a European population, reporting that obesity is directly associated with incomplete bowel movements, vomiting, and diarrhea (Aro et al. 2005). Therefore, careful attention should be given to the negative impact of GAE and the use of medicine G on daily activities, social, and family life, as these results may be related to BMI, which was significantly associated with the emergence of GAE.
Moreover, the higher frequency of GAE observed in patients with higher BMI may be attributed to physiological mechanisms such as increased intra-abdominal pressure and accelerated intestinal transit (Aro et al. 2005). Delgado-Aros et al. (2004) suggested that alterations in gastric emptying, intestinal transit time, or secretory responses might influence the prevalence of gastrointestinal symptoms in obese individuals. This evidence indicates that metabolic factors and dietary habits can impact the obesity GAE relationship (Delgado-Aros et al. 2004).
In this context, our findings regarding BMI significantly interfering with the participants’ routine activities in this study could likely be considered a confounding factor influencing both the perception and occurrence of GAE.
In parallel, the results of this study demonstrated that there was no difference in the perception of GAE based on the category of MET-XR used. This finding may be associated with the release profile of the evaluated medicines, as both, despite having different dissolution kinetics, presented similar results. On the other hand, the number of patients included in this study can be considered a limitation in evaluating GAE perception for drugs R and G, which justifies the need to expand the study to a larger sample size.
In evaluating the dissolution kinetics, the Higuchi model was assigned to medicine R. This model is typically used to describe dissolution resulting from the diffusion of drugs through the pores of hydrophilic matrices (Mohamed Rizwan & Damodharan 2020). This can be attributed to the composition of this medicine, which includes hydrophilic polymeric excipients such as croscarmellose sodium and Hypromellose (Rowe et al. 2017).
The Peppas-Sahlin model suggests that drug release in sample G is accomplished by two mechanisms: diffusion and relaxation (Wu et al. 2019). This model describes drug release systems involving a combination of Fickian diffusion and polymer matrix relaxation from case II. Both phenomena can occur simultaneously, with a slight prevalence of one over the other depending on the dissolution time (Mohamed Rizwan & Damodharan 2020). In Fickian diffusion, the drug’s diffusion rate in the most superficial layers of the delivery system occurs through pores and precedes the relaxation of the polymer matrix chains. In case II, faster diffusion takes place due to greater relaxation of the polymer chains as a result of hydration, allowing a larger amount of the drug to be exposed to the dissolution medium (Burkinshaw & Liu 2022).
Sample G contains the same excipients described for R, but additionally presents microcrystalline cellulose, which may account for the difference observed in the dissolution kinetics. It is known that this ingredient is commonly used as a disintegrant and diluent, and is capable of forming a hydrophilic polymeric barrier in an aqueous medium (Zhao et al. 2022), explaining the observed behavior.
During the development of generic medicines in solid form for oral use, it is necessary to demonstrate that the generic candidate product presents the same dissolution behavior as the reference medicine. In this regard, two methods can be used to compare dissolution behaviors: the F2 factor (recommended by Anvisa) (Brazil 2010) and DE. It is known that F2 is a qualitative indicator, while DE determines the ratio between the area under the curve (AUC) obtained from the dissolution behavior and the total area of the rectangle, considered as 100% dissolution. In this way, the results obtained for DE allow the data to be theoretically correlated with in vivo data, as oral bioavailability can be estimated by integrating the absorption AUC as a function of time. Both methods are used to suggest in vitro bioequivalence (Anderson et al. 1998, Storpirtis et al. 2004).
In the present study, the F2 value for the two formulations was 67, indicating dissolution behavior similar. This qualitative result is corroborated by the ADT values, where both formulations showed 50% dissolution in approximately 3 hours (Table VI). In contrast, the difference in DE between the samples was greater than 10% (Table VI), which can be explained by the different dissolution kinetics found for R and G (Table V and Figure 3).
The interpretation of dissolution behavior was based not only on F2 but also on DE, MDT, and mathematical modeling of release kinetics. These three complementary approaches confirm the conclusion that formulations R and G exhibit similar dissolution behaviors despite their distinct release mechanisms.
In a study conducted in Saudi Arabia, six different brands of MET were evaluated, and five (83%) were considered interchangeable with the innovative medicine based on the DE values observed (Afifi & Ahmadeen 2012). Additionally, Al Bratty et al. (2020), evaluated ten different brands of MET, all of which had a DE of less than 10%, and were considered interchangeable (Al Bratty et al. 2020).
The limitations of the present study include the small sample size, which restricted statistical power, the generalization of the data, and the use of more robust statistical models for GAE analysis. No adjustments for multiple comparisons were performed, which may have contributed to the lack of perceived differences between the categories studied (MET-XR reference and generic), as well as in the impact on daily activities, family, and social life of the participants. Moreover, no pharmacokinetic data was collected, which would have been essential to directly correlate dissolution behavior with clinical outcomes. Additionally, patients using MET-XR may experience other adverse events, such as nausea, vomiting, anorexia, epigastric pain, weakness, and metallic taste in the mouth, which were not part of the variables collected (Rodrigues Neto et al. 2015).
The use of other medicines, dietary patterns, specific foods (lactose, legumes, and beans) that affect intestinal motility or pre-existing gastrointestinal conditions should also be controlled in future studies. Therefore, the absence of these variables, as well as the patients’ overweight status, may represent confounding factors that need to be evaluated. Another issue concerns the quantification of MET by HPLC to increase the sensitivity of analyses in new research. It is strongly recommended that future multicenter studies be conducted with a larger sample size, control of confounding factors and biases, and statistical corrections for multiple comparisons. Finally, it is essential to include adjustments for multiple comparisons in the statistical analyses to avoid Type I errors (false negative).
In this study, it was demonstrated that there was no difference in the perception of GAE between the two categories of MET-XR. The dissolution behaviors were similar (F2 > 50), indicating that they are equivalent, although they have distinct dissolution kinetics and DE greater than 10%. Future studies are encouraged to explore pharmacogenomic and microbiome profiles, which may influence interindividual variability in GAE among MET users. Additionally, obtaining pharmacokinetic data would be valuable to correlate dissolution behavior results with in vivo bioavailability. Further research should also include patients using MET-IR and address the limitations identified in this study.
CONCLUSIONS
In this study, no difference was observed in GAE frequency between generic and reference MET-XR users. Moreover, MET-XR tablets demonstrated acceptable pharmacopeial quality and similar dissolution behavior, although they have presented distinct dissolution kinetics and DE greater than 10%. Our findings supported the interchangeability between R and G medicines, offering safe and effective alternatives for patients with DM2. This strengthens the aims of the National Policy on Generic Medicines in Brazil, contributing to the sustainability of the health system and the democratization of access to essential medicines.
Acknowledgements
To the Federal University of São João del-Rei, Campus Centro-Oeste Dona Lindu (UFSJ/CCO). This study was financed in part by the Coordenação de Aperfeiçoamento de Pessoal de Nível Superior (CAPES) – Finance Code 001, and Fundação de Amparo à Pesquisa do Estado de Minas Gerais (FAPEMIG). The authors declare that there are no conflicts of interest.
References
- AFIFI SA & AHMADEEN S. 2012. A comparative study for evaluation of different brands of metformin hydrochloride 500 mg tablets marketed in Saudi Arabia. Life Sci J 9: 4260-4266.
-
AL BRATTY M, ALHAZMI HA, ALAM MS, ALAM MI, JAVED SA & ALAM N. 2020. Assessment of physicochemical properties and comparison of dissolution profiles of metformin hydrochloride tablets in Saudi Arabia. Dissolution Technol 27: 36-44. https://doi.org/10.14227/DT270120P36.
» https://doi.org/10.14227/DT270120P36 -
ANDERSON NH, BAUER M, BOUSSAC N, KHAN-MALEK R, MUNDEN P & SARDARO M. 1998. An evaluation of fit factors and dissolution efficiency for the comparison of in vitro dissolution profiles. J Pharm Biomed Anal 17: 811-822. https://doi.org/10.1016/s0731-7085(98)00011-9.
» https://doi.org/10.1016/s0731-7085(98)00011-9 - AQUINO JA, SANCHES C & OLIVEIRA CDL. 2017. Como elaborar uma estratégia para empoderar pacientes com diabetes mellitus? J Appl Pharm Sci 4(2): 8-11.
-
ARO P, RONKAINEN J, TALLEY NJ, STORSKRUBB T, BOLLING-STERNEVALD E & AGRÉUS L. 2005. Body mass index and chronic unexplained gastrointestinal symptoms: an adult endoscopic population-based study. Gut 54: 1377-1383. https://doi.org/10.1136/gut.2004.057497.
» https://doi.org/10.1136/gut.2004.057497 -
BERTOLUCI MC ET AL. 2023. Brazilian Society of Diabetes Guidelines. Conectando Pessoas. Available at: https://diretriz.diabetes.org.br
» https://diretriz.diabetes.org.br - BLONDE L, DAILEY GE, JABBOUR SA, REASNER CA & MILLS DJ. 2004. Gastrointestinal tolerability of extended-release metformin tablets compared to immediate-release metformin tablets: results of a retrospective cohort study. Curr Med Res Opin 20: 565-572.
-
BONNET F & SCHEEN A. 2017. Understanding and overcoming metformin gastrointestinal intolerance. Diabetes Obes Metab 19: 473-481. https://doi.org/10.1111/dom.12854.
» https://doi.org/10.1111/dom.12854 - BRAZIL. 2010. RDC No. 31, of August 11, 2010 - Provides for the conduct of pharmaceutical equivalence and comparative dissolution profile studies; National Health Surveillance Agency: Brasília - DF.
- BRAZIL. 2017. RDC No. 166, of July 24, 2017 - Provides for the validation of analytical methods and provides other measures; National Health Surveillance Agency: Brasília - DF.
-
BURKINSHAW SM & LIU K. 2022. The roles of polymer relaxation phenomena, aqueous dye solubility and the physical properties of water in the mechanism of adsorption of a disperse dye on poly(ethylene terephthalate) fibres: Part 1 polymer relaxation phenomena. Color Technol 138(5): 456-473. https://doi.org/10.1111/cote.12604.
» https://doi.org/10.1111/cote.12604 -
BURTON JH, JOHNSON M, JOHNSON J, HSIA DS, GREENWAY FL & HEIMAN ML. 2015. Addition of a gastrointestinal microbiome modulator to metformin improves metformin tolerance and fasting glucose levels. J Diabetes Sci Technol 9(4): 808-814. https://doi.org/10.1177/1932296815577425.
» https://doi.org/10.1177/1932296815577425 -
CANDER S, GUL OO, TOPYILDIZ F & ERSOY C. 2014. Normal and extended release form of metformin in type 2 diabetic and pre-diabetic patients. Endocr Abstr 35: P484. https://doi.org/10.1530/endoabs.35.P484.
» https://doi.org/10.1530/endoabs.35.P484 -
CHENG M, REN L, JIA X, WANG J & CONG B. 2024. Understanding the action mechanisms of metformin in the gastrointestinal tract. Front Pharmacol 15: 1347047. https://doi.org/10.3389/fphar.2024.1347047.
» https://doi.org/10.3389/fphar.2024.1347047 -
CUBEDDU LX, BÖNISCH H, GÖTHERT M, MOLDERINGS G, RACKÉ K, RAMADORI G, MILLER KJ & SCHWÖRER H. 2000. Effects of metformin on intestinal 5-hydroxytryptamine (5-HT) release and on 5-HT3 receptors. Naunyn Schmiedebergs Arch Pharmacol 361: 85-91. https://doi.org/10.1007/s002109900152.
» https://doi.org/10.1007/s002109900152 -
DAWED AY ET AL. 2019. Variation in the plasma membrane monoamine transporter (PMAT) (encoded by SLC29A4) and organic cation transporter 1 (OCT1) (encoded by SLC22A1) and gastrointestinal intolerance to metformin in type 2 diabetes: An IMI DIRECT study. Diabetes Care 42(6): 1027-1033. https://doi.org/10.2337/dc18-2182.
» https://doi.org/10.2337/dc18-2182 -
DELGADO-AROS S, LOCKE GR, CAMILLERI M, TALLEY NJ, FETT SBS, ZINSMEISTER AR & MELTON LJ. 2004. Obesity is associated with increased risk of gastrointestinal symptoms: A population-based study. Am J Gastroenterol 99(9): 1801-1806. https://doi.org/10.1111/j.1572-0241.2004.30887.x.
» https://doi.org/10.1111/j.1572-0241.2004.30887.x -
DEROSA G, D’ANGELO A, ROMANO D & MAFFIOLI P. 2017. Effects of metformin extended release compared to immediate release formula on glycemic control and glycemic variability in patients with type 2 diabetes. Drug Des Dev Ther 11: 1481-1488. https://doi.org/10.2147/DDDT.S131670.
» https://doi.org/10.2147/DDDT.S131670 -
DILEBO J & GABRIEL T. 2019. An overview of factors affecting superdisintegrants functionalities. Int J Pharm Sci Nanotechnol 12: 4355-4361. https://doi.org/10.37285/ijpsn.2019.12.1.1.
» https://doi.org/10.37285/ijpsn.2019.12.1.1 - DONNELLY LA, MORRIS AD & PEARSON ER. 2009. Adherence in patients transferred from immediate release metformin to a sustained release formulation: a population-based study. Diabetes Obes Metab 11: 338-342.
- DU Y ET AL. 2024. Metformin adverse event profile: a pharmacovigilance study based on the FDA adverse event reporting system (FAERS) from 2004 to 2022. Expert Rev Clin Pharmacol 17(2): 189-201.
- DUCA FA, CÔTÉ CD, RASMUSSEN BA, TAHMASEBI MZ, RUTTER GA, FILIPPI BM & LAM TKT. 2015. Metformin activates a duodenal AMPK–dependent pathway to lower hepatic glucose production in rats. Nat Med 21(5): 506-511.
-
ELGAWISH MS, NASSER S, SALAMA I, ABBAS AM & MOSTAFA SM. 2019. Liquid chromatography tandem mass spectrometry for the simultaneous determination of metformin and pioglitazone in rat plasma: Application to pharmacokinetic and drug-drug interaction studies. J Chromatogr B 1124: 47-57. https://doi.org/10.1016/j.jchromb.2019.05.036.
» https://doi.org/10.1016/j.jchromb.2019.05.036 -
ESLICK GD & TALLEY NJ. 2016. Prevalence and relationship between gastrointestinal symptoms among individuals of different body mass index: A population-based study. Obes Res Clin Pract 10(2): 143-150. https://doi.org/10.1016/j.orcp.2015.05.018.
» https://doi.org/10.1016/j.orcp.2015.05.018 -
FDA. 2021. Food and Drug Administration. Q2 (R1) validation of analytical procedures: text and methodology guidance for industry. Available at: https://www.fda.gov/regulatory-information/search-fda-guidance-documents/q2r1-validation-analytical-procedures-text-and-methodology-guidance-industry
» https://www.fda.gov/regulatory-information/search-fda-guidance-documents/q2r1-validation-analytical-procedures-text-and-methodology-guidance-industry -
HAN T, PROCTOR WR, COSTALES CL, CAI H, EVERETT RS & THAKKER DR. 2015. Four cation-selective transporters contribute to apical uptake and accumulation of metformin in Caco-2 cell monolayers. J Pharmacol Exp Ther 352: 519-528. https://doi.org/10.1124/jpet.114.220350.
» https://doi.org/10.1124/jpet.114.220350 -
IDF. 2025. International Diabetes Federation. IDF Diabetes Atlas, 11th ed., Brussels, Belgium. Available at: https://www.diabetesatlas.org
» https://www.diabetesatlas.org -
JONES GR & MOLLOY MP. 2021. Metformin, Microbiome and Protection Against Colorectal Cancer. Dig Dis Sci 66: 1409-1414. https://doi.org/10.1007/s10620-020-06390-4.
» https://doi.org/10.1007/s10620-020-06390-4 -
JUNIOR AEM, RESENDE KA, MIRANDA MIC, MERI AD, LOPES FM, DE CASTRO AP, BITTENCOURT WJM, SANCHES C, GOMES AJPS & DE CASTRO WV. 2023. Evaluation of the frequency of gastrointestinal adverse events associated with the use of prolonged-release metformin hydrochloride. Concilium 23(17): 340-350. https://doi.org/10.53660/CLM-1844-23M49.
» https://doi.org/10.53660/CLM-1844-23M49 -
KE H, LI F, DENG W, LI Z, WANG S, LV P & CHEN Y. 2021. Metformin exerts anti-inflammatory and mucus barrier protective effects by enriching Akkermansia muciniphila in mice with ulcerative colitis. Front Pharmacol 12: 726707. https://doi.org/10.3389/fphar.2021.726707.
» https://doi.org/10.3389/fphar.2021.726707 -
KHAN KA. 1975. The concept of dissolution efficiency. J Pharm Pharmacol 27: 48-49. https://doi.org/10.1111/j.2042-7158.1975.tb09378.x.
» https://doi.org/10.1111/j.2042-7158.1975.tb09378.x -
LUI M, GALLO-HERSHBERG D & DEANGELIS C. 2017. Development and validation of a patient-reported questionnaire assessing systemic therapy induced diarrhea in oncology patients. Health Qual Life Outcomes 15(249). https://doi.org/10.1186/s12955-017-0794-6
» https://doi.org/10.1186/s12955-017-0794-6 -
MCCREIGHT LJ, BAILEY CJ & PEARSON ER. 2016. Metformin and the gastrointestinal tract. Diabetologia 59: 426-435. https://doi.org/10.1007/s00125-015-3844-9.
» https://doi.org/10.1007/s00125-015-3844-9 -
MOHAMED RIZWAN I & DAMODHARAN N. 2020. Mathematical modelling of dissolution kinetics in dosage forms. Res J Pharm Technol 13(3): 1339-1345. https://doi.org/10.5958/0974-360X.2020.00247.4.
» https://doi.org/10.5958/0974-360X.2020.00247.4 - MOORE JW & FLANNER HH. 1996. Mathematical comparison of dissolution profiles. Pharm Technol 20: 64-74.
-
MUELLER NT, DIFFERDING MK, ZHANG M, MARUTHUR NM, JURASCHEK SP, MILLER ER, APPEL LJ & YEH HC. 2021. Metformin affects gut microbiome composition and function and circulating short-chain fatty acids: A randomized trial. Diabetes Care 44(7): 1462-1471. https://doi.org/10.2337/dc20-2257.
» https://doi.org/10.2337/dc20-2257 -
NABRDALIK K, SKONIECZNA-ŻYDECKA K, IRLIK K, HENDEL M, KWIENDACZ H, ŁONIEWSKI I, JANUSZKIEWICZ K, GUMPRECHT J & LIP GYH. 2022. Gastrointestinal adverse events of metformin treatment in patients with type 2 diabetes mellitus: A systematic review, meta-analysis and meta-regression of randomized controlled trials. Front Endocrinol 13: 975912. https://doi.org/10.3389/fendo.2022.975912.
» https://doi.org/10.3389/fendo.2022.975912 -
OLGUN A. 2017. “Metformin-resistant” folic acid producing probiotics or folic acid against metformin’s adverse effects like diarrhea. Med Hypotheses 106: 33-34. https://doi.org/10.1016/j.mehy.2017.07.009.
» https://doi.org/10.1016/j.mehy.2017.07.009 -
RODRIGUES NETO EM, MARQUES LARV, FERREIRA MAD, LOBO PLD, JUNIOR FJG, CAMARÃO GC & DE MORAES MEA. 2015. Metformina: Uma Revisão da Literatura. Saúde Pesqui 8(2): 355. https://doi.org/10.17765/1983-1870.2015v8n2p355-362.
» https://doi.org/10.17765/1983-1870.2015v8n2p355-362 - ROWE RC, SHESKEY PJ & OWEN SC. 2017. Handbook of Pharmaceutical Excipients, 5th ed., London: Pharmaceutical Press.
- STORPIRTIS S, MARCOLOGO R, GASPAROTTO FS & VILANOVA CM. 2004. Pharmaceutical equivalence in the context of interchangeability between generic and reference medicines: technical and scientific foundations. Balant 16: 9-10.
- USP 44. 2021. The United States Pharmacopeia, NF 39. The United States Pharmacopeial Convention: Rockville.
-
WU HT, CHEN HC & LEE HK. 2019. Controlled release of theophylline-chitosan composite particles prepared using supercritical assisted atomization. Braz J Chem Eng 36(2): 895-904. https://doi.org/10.1590/0104-6632.20190362s20180150.
» https://doi.org/10.1590/0104-6632.20190362s20180150 -
ZHANG Y, HUO M, ZHOU J, ZOU A, LI W, YAO C & XIE S. 2010. DDSolver: An add-in program for modeling and comparison of drug dissolution profiles. AAPS J 12: 263-271. https://doi.org/10.1208/s12248-010-9185-1.
» https://doi.org/10.1208/s12248-010-9185-1 -
ZHAO H, ZHAO L, LIN X & SHEN L. 2022. An update on microcrystalline cellulose in direct compression: Functionality, critical material attributes, and co-processed excipients. Carbohydr Polym 278: 118968. https://doi.org/10.1016/j.carbpol.2021.118968.
» https://doi.org/10.1016/j.carbpol.2021.118968
Edited by
-
Handling editor
João Duarte
The data supporting the findings of this study are available within the article and its Supplementary Material (Appendix S1).