 Assessing Atlantic Forest successional stages using remote sensing
Abstract
The assessment of successional stages plays a strategic role in forest management and is crucial for understanding forest dynamics and patterns. In the Atlantic Forest (AF), this remains a challenge due to the complexity of its ecosystems. Here, we identify AF successional stages using remote sensing and assess the influence of anthropogenic and environmental factors in the Serra da Tiririca State Park, an important protected area in Rio de Janeiro, Brazil. We integrated MapBiomas data with vegetation indices to select the generalized linear mixed model (GLMM) that best predicted successional stages. Generalized linear models (GLMs) identified key variables explaining local AF successional patterns. We found an adequate classification, with successional stages moderately correlated with the Normalized Difference Vegetation Index (NDVI, R2=0.3) using the GLMM. The study area exhibited a mean annual regeneration rate of 95 ha and a suppression rate of 22 ha. Notably, soil organic carbon emerged as an important threshold in the GLMs for all successional stages, while wind played a key role in the early stage, and precipitation was important for the late stage. Our approach provides a replicable strategy for other AF sites, offering insights for biodiversity conservation and management of protected areas.
Keywords:
anthropic pressure; environmental drivers; habitat dynamics; landscape ecology; secondary forest; Serra da Tiririca state park; vegetation mapping
Introduction
Forest succession, a natural process by which a forest recovers after a disturbance, is crucial for biodiversity conservation and global ecological dynamics (Chazdon, 2008; Walker & Wardle, 2014; Poorter et al., 2023). Assessing this highly variable phenomenon is vital for developing more effective forest management practices and for providing data to support environmental regeneration and ecosystem maintenance (Grebner et al., 2021). However, understanding the patterns and processes of forest succession remains a major challenge in science (Chang & Turner, 2019), especially in the face of ongoing deforestation and changes driven mainly by anthropogenic actions shaped by historical land use and landscape dynamics (Barlow et al., 2016; Edwards et al., 2019; Myers, 2023).
Human activities have already impacted more than two-thirds of the Earth's ice-free land (Luyssaert et al., 2014), causing devastating effects on tropical landscapes (Armenteras et al., 2017; Taubert et al., 2018; Fischer et al., 2021) and driving many species and ecosystems to extinction (Boivin et al., 2016). If current patterns of anthropogenic damage persist, tropical forests may experience substantial reductions in size and biodiversity within less than a century (Edwards et al., 2019). With the expansion of the human population and the increasing demand for agricultural land, the remaining forest areas are being intensely reduced to small remnants (Curtis et al., 2018; Hansen et al., 2013). In the Neotropics, approximately one-third of the deforested areas undergo secondary succession annually, despite ongoing anthropogenic pressures (Aide et al., 2013).
Secondary forests have become predominant in many tropical landscapes (Bieng et al., 2021) and may, under specific ecological and anthropogenic conditions, contribute to the formation of novel ecosystems (Hobbs et al., 2009). While forest regeneration can be rapid in some tropical regions, it is estimated that over half of tropical forests are now secondary, exhibiting various stages of development and recovery (Hansen et al., 2013; Arroyo-Rodríguez et al., 2017; Rozendaal et al., 2019). These stages differ in structural and plant community traits and are influenced by a range of variables, including anthropogenic, environmental, and biological factors (Violle et al., 2007; Swanson et al., 2011; Lu et al., 2014). In the Atlantic Forest (hereafter AF), this variety of successional stages is especially relevant due to its severe fragmentation and drastic reduction of original forest coverage (Rezende et al., 2018), which compromises the protection of these areas and hinders biodiversity conservation (Carlucci et al., 2021).
The AF is one of the most endangered biomes on Earth (Myers et al., 2000). Once covering over one million square kilometers, this biome now constitutes less than 24% of its original native vegetation (SOS Mata Atlântica, 2024). Although the AF contains more than 50% of Brazil's protected areas (MMA, 2024), deforestation persists as a critical issue (Marques & Grelle, 2021). To enhance the understanding of AF vegetation and support its conservation, the Conselho Nacional do Meio Ambiente (CONAMA) established, through resolution No. 6/94, a set of basic parameters for analyzing the stages of ecological succession in the AF (Brasil, 1994). This resolution classifies the forest into primary and secondary stages, with the latter further divided into early, intermediate, and late stages, all based on community age, physiognomy, diameter at breast height, and other criteria (Brasil, 1994). Although many studies indicate a misalignment between the ecological and regulatory parameters of this resolution (e.g., Baptista, 2008; Machado, 2011), it remains the only legally accepted reference in Brazil. However, despite the difficulty of defining these successional stages due to landscape heterogeneity and the complexity of ecological processes (Costa et al., 2017), solutions based on new technologies, such as remote sensing, offer promising means for monitoring forest ecological processes (Chraibi et al., 2021).
Remote sensing is an indispensable tool for observing changes in landscapes and vegetation, providing a comprehensive view of forest succession dynamics (Sothe et al., 2017; Mota et al., 2019; Pastório et al., 2020; Bressane et al., 2023). Satellite data, such as those from the Landsat series, are widely used due to their moderate spatial resolution and extensive historical records (Zhu & Liu, 2015). These data enable the detection and mapping of forested cover changes, revealing patterns and variations in forest structure (Luque et al., 2018; Berveglieri et al., 2021; Silveira et al., 2021). While more effective when combined with field data, remote sensing offers a more cost-effective alternative, as fieldwork can be both expensive and logistically challenging (Souza et al., 2021). This technology enables the assessment of diverse parameters across multiple layers, processes large volumes of data, and correlates spectral vegetation indices over extensive areas, thus enabling a clearer understanding of vegetative traits (Lu, 2006; Görgens et al., 2016; Xue & Su, 2017).
Vegetation indices, such as the Normalized Difference Vegetation Index (NDVI), Soil Adjusted Vegetation Index (SAVI), and Enhanced Vegetation Index (EVI), are mathematical models that use the ratio of reflectance between different spectral bands to highlight specific features of vegetation cover (Huete, 2012). These indices assist in measuring biophysical parameters and vegetation characteristics by enhancing their attributes through the integration of reflectance across various wavelengths (Xue & Su, 2017). While these indices are widely used for quantitative and qualitative assessments of vegetation cover, vigor, and growth dynamics (Silva et al., 2021; Singh & Huang, 2022; Verly et al., 2023), accurately estimating successional stages in AF remnants remains a challenge (Gelli et al., 2023). This is partly due to the indirect physical meaning of vegetation indices and the non-linear relationship between spectral responses and forest structural attributes during regeneration, especially within highly heterogeneous tropical ecosystems (Frolking et al., 2009; Papeş et al., 2010).
In this context, considering that remote sensing is a robust tool for assessing vegetation dynamics (Zhu & Liu, 2015), and recognizing that successional dynamics are influenced by multiple drivers acting at different spatial and temporal scales, with anthropogenic factors strongly shape early-stage regeneration by altering seed dispersal, pollination, and herbivory processes (Arroyo-Rodríguez et al., 2017), and environmental factors influence physiological responses and adaptation (Uriarte et al., 2016), we aimed to develop a Landsat-based remote sensing approach for classifying the successional stages of the Atlantic Forest and evaluating the effect of anthropogenic and environmental factors on the evolution of these stages over time. The hypotheses tested here were: i) that anthropogenic factors exert a greater influence on the dynamics of the early stages of forest succession, whereas environmental factors have less impact during this early stage; and ii) that environmental factors exert a greater influence in subsequent stages. This work may provide important insights for the management of natural areas and a better understanding of forest successional patterns. Furthermore, the methodology used here may serve as a useful framework that can be adapted and tested in other AF remnants, contributing to broader conservation strategies.
Materials and Methods
Test site
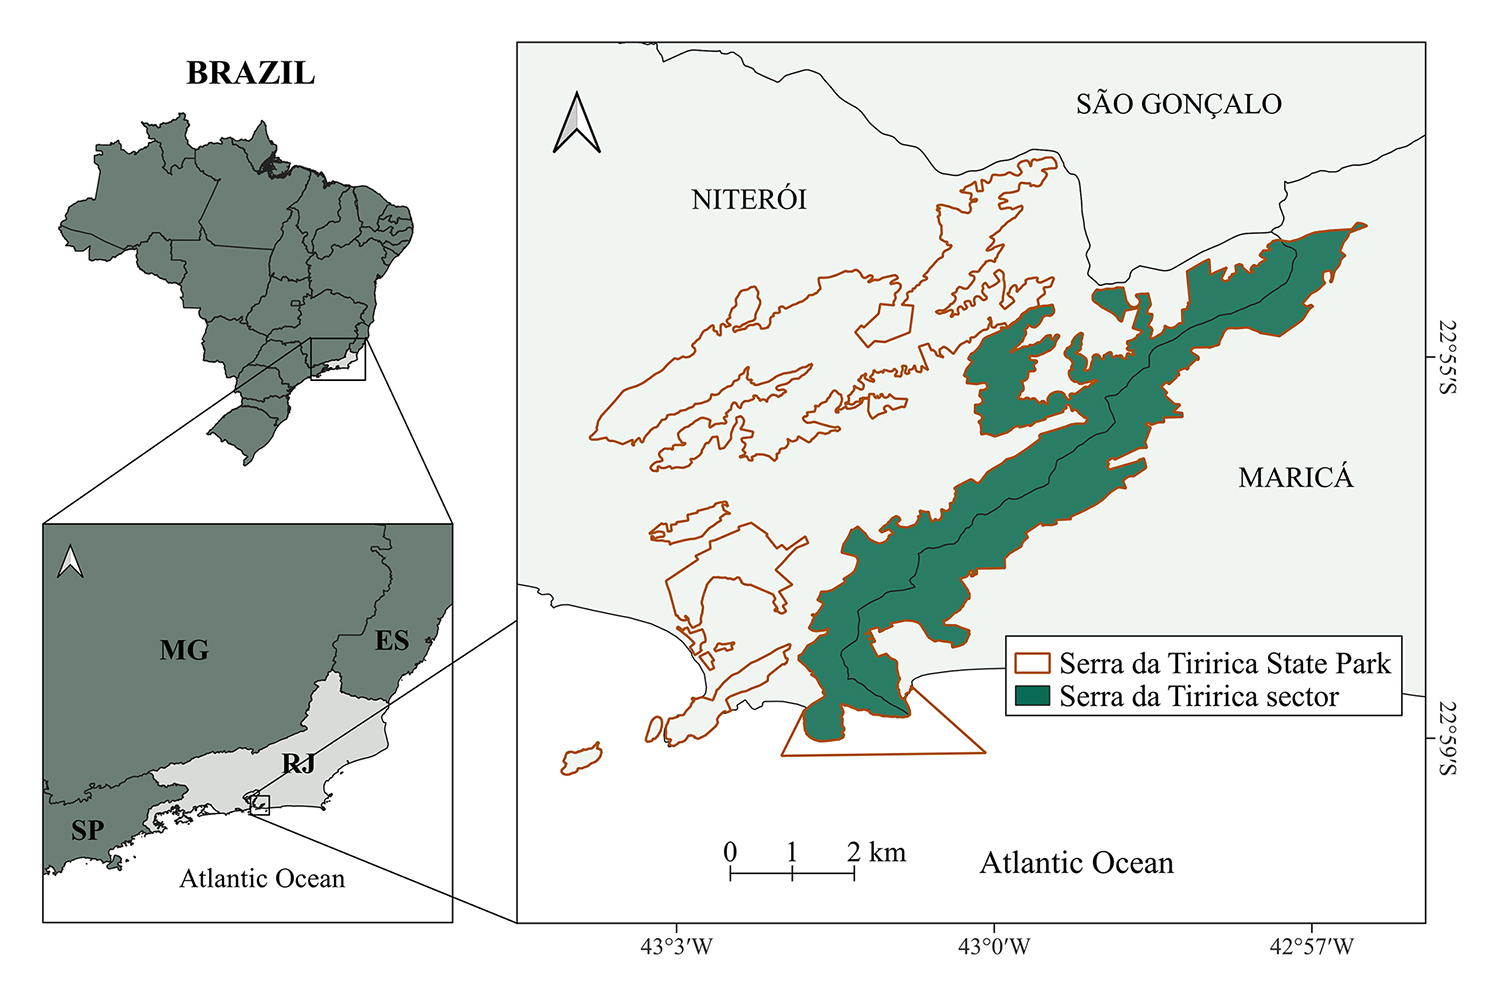
The main AF remnant of the Serra da Tiririca State Park (PESET) was used as the site for the methodology to identify successional stages. Located between the municipalities of Niterói and Maricá, in the state of Rio de Janeiro (22º48'-23º00' S; 42º57'-43º02' W) (Fig. 1), it was established by State Law No. 1,901 in 1991 to preserve the ecologically significant ecosystems of the AF (Rio de Janeiro, 1991). The Serra da Tiririca remnant (sector) or test site covers 1978 ha (1792 ha of continental land and 186 ha of marine environment) and features altitudes ranging from sea level up to 412 m (INEA, 2015). The test site represents a fragment of the Atlantic Forest within the coastal massif of Serra do Mar, with vegetation classified as dense submontane ombrophilous forest with rocky outcrops (IBGE, 2012). The area presents, in general, a scleromorphic vegetation aspect, influenced by the regional climate, proximity to the sea, and the presence of shallow soils, showing low similarity with seasonal formations and higher similarity with restinga and semideciduous forests (Barros, 2008). The site exhibits a mosaic of different successional stages (Zuñe-da-Silva et al., 2023), with secondary vegetation predominating due to its history of occupation, and contains several endemic and endangered species (Barros, 2008). The climate is subtropical, characterized by humid and hot conditions (Aw of Köppen), with heavy rains in the summer and a dry season in the winter (Alvares et al., 2013). The region experiences an average annual temperature of 23.7 °C, approximately 1172 mm of annual precipitation, and 80% relative humidity, with soils mainly consisting of Red-Yellow Argisols, Litholic Neosols, and Haplic Cambisols (INEA, 2015).
Data acquisition, processing, and analysis
In order to develop the model that made it possible to accurately identify and classify the AF successional stages in Serra da Tiririca, we applied a Poisson regression model, correlating categorical data on secondary vegetation (response variable) from the MapBiomas project with continuous data from vegetation indices (explanatory variables). The response variable values were derived from the interaction between deforestation and secondary vegetation data, and the age of secondary vegetation in the annual historical series from 1987 to 2021, using MapBiomas Collection 8 (https://brasil.mapbiomas.org/; accessed in August 2024). The MapBiomas products were generated from Landsat 5, 7, and 8 satellite sensors, with a resolution of 30 meters, produced by the National Aeronautics and Space Administration (NASA) and the United States Geological Survey (USGS), and accessed via Google Earth Engine (Souza et al., 2020). The MapBiomas methodology applies pixel-by-pixel classification using machine learning to generate annual vegetation maps, achieving an accuracy of 87.9% in mapping land cover in the Atlantic Forest (Souza et al., 2020).
The deforestation and secondary vegetation data from MapBiomas reflect the identification of events such as the loss of natural vegetation or the regeneration of forest vegetation after periods of land use, resulting in an annual series mapping seven classes (Tab. 1), while the age of secondary forest vegetation is defined as the number of years since the last disturbance, following deforestation or degradation (Vancutsem et al., 2021; MapBiomas, 2024a). To obtain the response variable values, we integrated the data on deforestation and secondary vegetation, and secondary vegetation age, grouping them into four categories (Tab. 1). These categories were established based on the stages of secondary vegetation outlined in CONAMA Resolution No. 6/94 (Brasil, 1994), with stages categorized by community age: 0 to 10 years (early), 11 to 25 years (intermediate), and over 25 years (late).
Variables used to predict the successional stages of the AF of Serra da Tiririca (Response variable vs. explanatory variables). Description of the classes mapped in the annual vegetation dynamics time series produced by MapBiomas, which were reclassified and grouped in this study as a response variable according to the community age parameter of secondary forests as defined by CONAMA Resolution No. 6/94. The explanatory variables include vegetation indices: NIR (Near Infrared) corresponds to Band 4 of Landsat 5-7 and Band 5 of Landsat 8-9; R (Red) corresponds to Band 3 of Landsat 5-7 and Band 4 of Landsat 8-9; B (Blue) corresponds to Band 1 of Landsat 5-7 and Band 2 of Landsat 8-9.
The explanatory variables (vegetation indices) were obtained from collection and level 2 of Landsat 5, 7, and 8 images provided by the USGS for the same time frame (1987-2021) (for details see Tab. S1). We used only bands 1, 2, 3, 4, and 5 to calculate the vegetation indices (Tab. 1). The selection of bands was based on a cloud cover threshold of less than 10%, with images acquired from June to September, when the study area experiences the lowest precipitation (Zuñe-da-Silva et al., 2022) and aligned with the season used by the MapBiomas to select their scenes. The spectral bands were processed using QGIS 3.40.9 (QGIS Development Team, 2025) and the Semi-Automatic Classification Plugin (SCP) 8.5.0 (Congedo, 2021). Landsat 7 images with scan line errors were corrected using the QGIS nodata fill function. Subsequently, we generated the following vegetation indices using band composition and the SCP raster calculator in QGIS: Normalized Difference Vegetation Index (NDVI), Soil Adjusted Vegetation Index (SAVI), and Enhanced Vegetation Index (EVI).
All secondary vegetation images obtained from MapBiomas and vegetation indices from the USGS were clipped using the vector mask of the continental area of Serra da Tiririca in QGIS. To extract pixel-level data for both variables (response and explanatory), we generated a point cloud from the layer extension using the ‘Point Sampling Tool’ 0.5.4 and compiled the values into a simple data matrix, where one column represented the categorical values of successional stages, and three columns contained the continuous values of the vegetation indices selected for this study (Supplementary Document 1).
Before model construction, we identified and removed outliers for each successional stage category to avoid model distortion (Boukerche et al., 2020). Generalized Linear Mixed Models (GLMMs) were then fitted using vegetation indices, both individually and in combination to identify the models with the best predictive performance. Given the presence of multiple observations per year, we applied GLMMs using the glmmTMB 1.1.11 package (Brooks et al., 2017), specifying year as a random effect and assuming a Poisson distribution with a ‘log’ link to predict successional stages based on vegetation indices. This approach was selected as the response variable represents count data, allowing the model to accommodate both the discrete nature and the observed variability of the data. GLMMs are particularly suitable in this context, as they account for data hierarchy and within-group correlations, thereby enhancing model validity and the reliability of statistical inference (Zuur et al., 2009). On average, more than 6,000 records per year (235,109 in total) were analyzed in the GLMM approach (Supplementary Document 1). The best predictive model was selected based on the lowest Akaike Information Criterion (AIC) value (Cavanaugh & Neath, 2019). Additionally, to assess the explanatory power of the model, we analyzed the marginal and conditional R-squared (R2) values, which were calculated using the ‘performance’ 0.15.0 package (Lüdecke et al., 2021). The marginal and conditional R2 values represent the variance explained by the fixed effects alone (marginal R2) and by both fixed and random effects combined (conditional R2), thus providing a comprehensive measure of model fit in mixed-effects models. Finally, we calculated the Variance Inflation Factor (VIF) for the evaluated GLMMs using the 'check_collinearity' function from the performance package. The VIF quantifies the extent to which the variance of a regression coefficient is inflated due to multicollinearity. A VIF higher than 5 indicates problematic collinearity that may compromise model reliability (Miles, 2014). All data matrix analyses were performed using R 4.5.1. (R Core Team, 2025).
Upon identifying the GLMM that most accurately estimated the successional forest stages of Serra da Tiririca, predictions were subsequently applied to the images utilizing the explanatory variable of the vegetation index that demonstrated optimal performance for the period spanning 1987 to 2021. Additionally, we acquired two additional sets of spectral bands from USGS to calculate the corresponding vegetation index for the years 2022 and 2023, employing consistent parameters and procedures as used in previous years (Tab. S1). The model predictions were performed using functions from the raster package 3.6-32 in R (Hijmans, 2024). The predictions were exported as raster files, and QGIS’s ‘r.report’ function was used to extract successional stage data in hectares, enabling the analysis of area changes over the past 37 years (1987-2023). To detect significant differences in stage changes over time, we applied the parametric Tukey test (Abdi & Williams, 2010) after standardizing the values as percentages. Subsequently, to assess pixel-based regeneration and vegetation suppression rates over the study period, we used the post-processing tools of the SCP in QGIS.
To assess the impact of stochastic and deterministic processes on the changes in AF successional stages in Serra da Tiririca over the 37 years, we categorized the new explanatory variables into two groups: anthropogenic and environmental (climate). The anthropogenic variables included human impact, birds, farming, Soil Organic Carbon (SOC), and fires. The environmental variables consisted of precipitation, temperature, and wind. Although SOC stocks are influenced by both anthropogenic and environmental drivers (Tian et al., 2016), we classified them under anthropogenic factors due to their stronger association with plant species richness (Delarmelina et al., 2022), which is primarily shaped by human activities in the AF. Thus, SOC serves as an indirect indicator of ecosystem responses to human influence rather than a direct anthropogenic driver. Similarly, birds were included among anthropogenic factors as biological indicators reflecting sensitivity to anthropogenic disturbances, such as land-use changes and habitat alteration (Oliveira-Silva et al., 2022). Fires were also categorized as anthropogenic, given that most fires in the AF are human-induced (INPE, 2024). The anthropogenic and environmental variables selected in this study were chosen based on their well-documented influence on the dynamics of secondary forests (Arroyo‐Rodríguez et al., 2017). Due to the limited availability of data for the study area, other faunal groups, such as mammals, were not included in the analysis.
Human impact data, or the human footprint (hereafter HFP), was acquired from the Wildlife Conservation Society database (https://wcshumanfootprint.org/; accessed in August 2024). HFP is a weighted sum of eight human activities, including population density, infrastructure, and nighttime lights, among others (Venter et al., 2016). HFP metrics are available as maps with a nominal resolution of 300 m for the years 2001 to 2020, where higher gradient values indicate greater human impact. After accessing the maps, we clipped them using the Serra da Tiririca vector layer and calculated the annual mean HFP.
Bird species presence data for the Serra da Tiririca were first obtained from WikiAves (http://www.wikiaves.com.br/; accessed in August 2024), providing the most updated species list for the study area (261 species). We then filtered bird observation lists from eBird (https://ebird.org/; accessed in August 2024) for the remnant forest, covering the years from 2008 to 2023. The number of bird species from eBird was contrasted with the WikiAves list to determine annual bird presence as a percentage for PESET.
Data on farming areas and Soil Organic Carbon (hereafter SOC) were obtained from the MapBiomas project. Farming data, which include pastures, agricultural lands, forestry, or areas used for agro-pastoral purposes where differentiation between pasture and agriculture was not possible (MapBiomas, 2024a), are available for the years 1987 to 2023 in hectares for level 2 land use and cover. SOC data, reflecting mean stock values (MapBiomas, 2024b), were provided for the period from 1987 to 2021. Fire data were sourced from the BDQueimadas-INPE database (https://terrabrasilis.dpi.inpe.br/queimadas/portal/; accessed in August 2024), which includes fire records for Serra da Tiririca from 2008 to 2023, using all available satellite observations. Records were screened to avoid duplication from different satellites, and redundant information was discarded. For the years not covered by BDQueimadas (1987-2007), fire scar records were supplemented using MapBiomas collection 3 data (MapBiomas, 2024c).
All environmental variables (annual cumulative precipitation, mean annual temperature, and mean annual wind speed) were obtained from the Instituto Nacional de Meteorologia (INMET) database (https://portal.inmet.gov.br/; accessed in August 2024) through data from the Maricá conventional station (code 83089) from 1987 to 2018 (when it was decommissioned) and supplemented with data from the Niterói automatic station (code A627) from 2019 to 2023. To address missing data, applied time series backcasting and forecasting techniques using the Forecast package in R (Hyndman et al., 2023). Specifically, we fitted appropriate regression and exponential smoothing state space models to the available annual data series for birds and HFP, enabling the estimation of missing values by extrapolating temporal trends. Model selection and optimization were performed automatically within the package to identify the best-fitting models, ensuring reliable reconstruction of data for the periods 1987-2007 (birds), 1987-2001 (HFP backcasting), and 2021-2023 (HFP forecasting). Since the HFP, farming, and fire anthropogenic variables are directly shaped by human activities, we applied Spearman's correlation test to examine the relationships among them (Spearman, 1961).
After compiling all anthropogenic and environmental variables and successional stage areas into a single data matrix for the years 1987 to 2023 (Tab. S2), we applied statistical tests to analyze temporal trends and autocorrelation in both response and explanatory variables at the test site. Temporal trends were assessed using the non-parametric Mann-Kendall test (Mann, 1945; Kendall, 1975; Libiseller & Grimvall, 2002), which reliably detects monotonic linear and non-linear trends in non-normally distributed datasets with outliers (Libiseller & Grimvall, 2002). The test was performed using the mk.test function from the trend 1.1.6 package (Pohlert, 2023). Since the Mann-Kendall test does not account for serial correlation, we applied the Durbin-Watson test (Durbin & Watson, 1971) to evaluate autocorrelation among successive observations in the subsequent Generalized Linear Models (GLMs). The assumption of independence was assessed through residual analysis using the 'dwtest' function from the lmtest 0.9-40 package (Zeileis & Hothorn, 2022).
These GLMs were applied to analyze the effects of anthropogenic and environmental variables on changes in AF successional stages in Serra da Tiririca. We used GLMs with a Gaussian distribution after verifying that the explanatory variables met the assumptions required for this model type (Cameron & Trivedi, 2013). The best models for each successional stage were selected based on the lowest AIC values. Additionally, we assessed the explanatory power of each model using D-squared (D2) values. The D2, referred to as the R2 analogue for GLMs, calculates the adjusted deviance accounted for by the models using the equation: 1 - (Residual Deviance/Null Deviance). D2 was estimated using functions from the ‘modEvA’ 3.39 package (Barbosa et al., 2013). We also calculated the VIF for the evaluated GLMs using the car 3.1-3 package (Fox & Weisberg, 2024).
Results
The classification of AF successional stages in Serra da Tiririca, using GLMMs, showed similar performance between the individual NDVI and SAVI models, with both indices performing substantially better than EVI (Tab. 2). NDVI was retained as the best individual predictor, presenting a lower AIC value compared to SAVI. Although the combined NDVI + SAVI model yielded the lowest AIC among all tested models, it was not selected due to the high collinearity detected between NDVI and SAVI, as indicated by the VIF analysis (Tab. 2). The explanatory power of the selected NDVI model showed a marginal R2 of 0.296 and a conditional R2 of 0.298, indicating that approximately 30% of the variation in successional stages was explained by the fixed effects alone, with similar explanatory power when including the random effect of year. These results demonstrate a moderate predictive capacity for successional stage classification using NDVI in this AF remnant (Tab. 2).
Generalized Linear Mixed Model (GLMM) with Poisson distribution derived from the relationship between secondary forest classification based on community age and vegetation indices in the Atlantic Forest at Serra da Tiririca, Rio de Janeiro, Brazil. The model includes year as a random effect to account for temporal dependence. Positive parameters in GLMMs indicate positive effects. AIC = Akaike Information Criterion; NDVI = Normalized Difference Vegetation Index; SAVI = Soil Adjusted Vegetation Index; EVI = Enhanced Vegetation Index; R2 = marginal R-squared; SE = Standard error; VIF = Variance Inflation Factor.
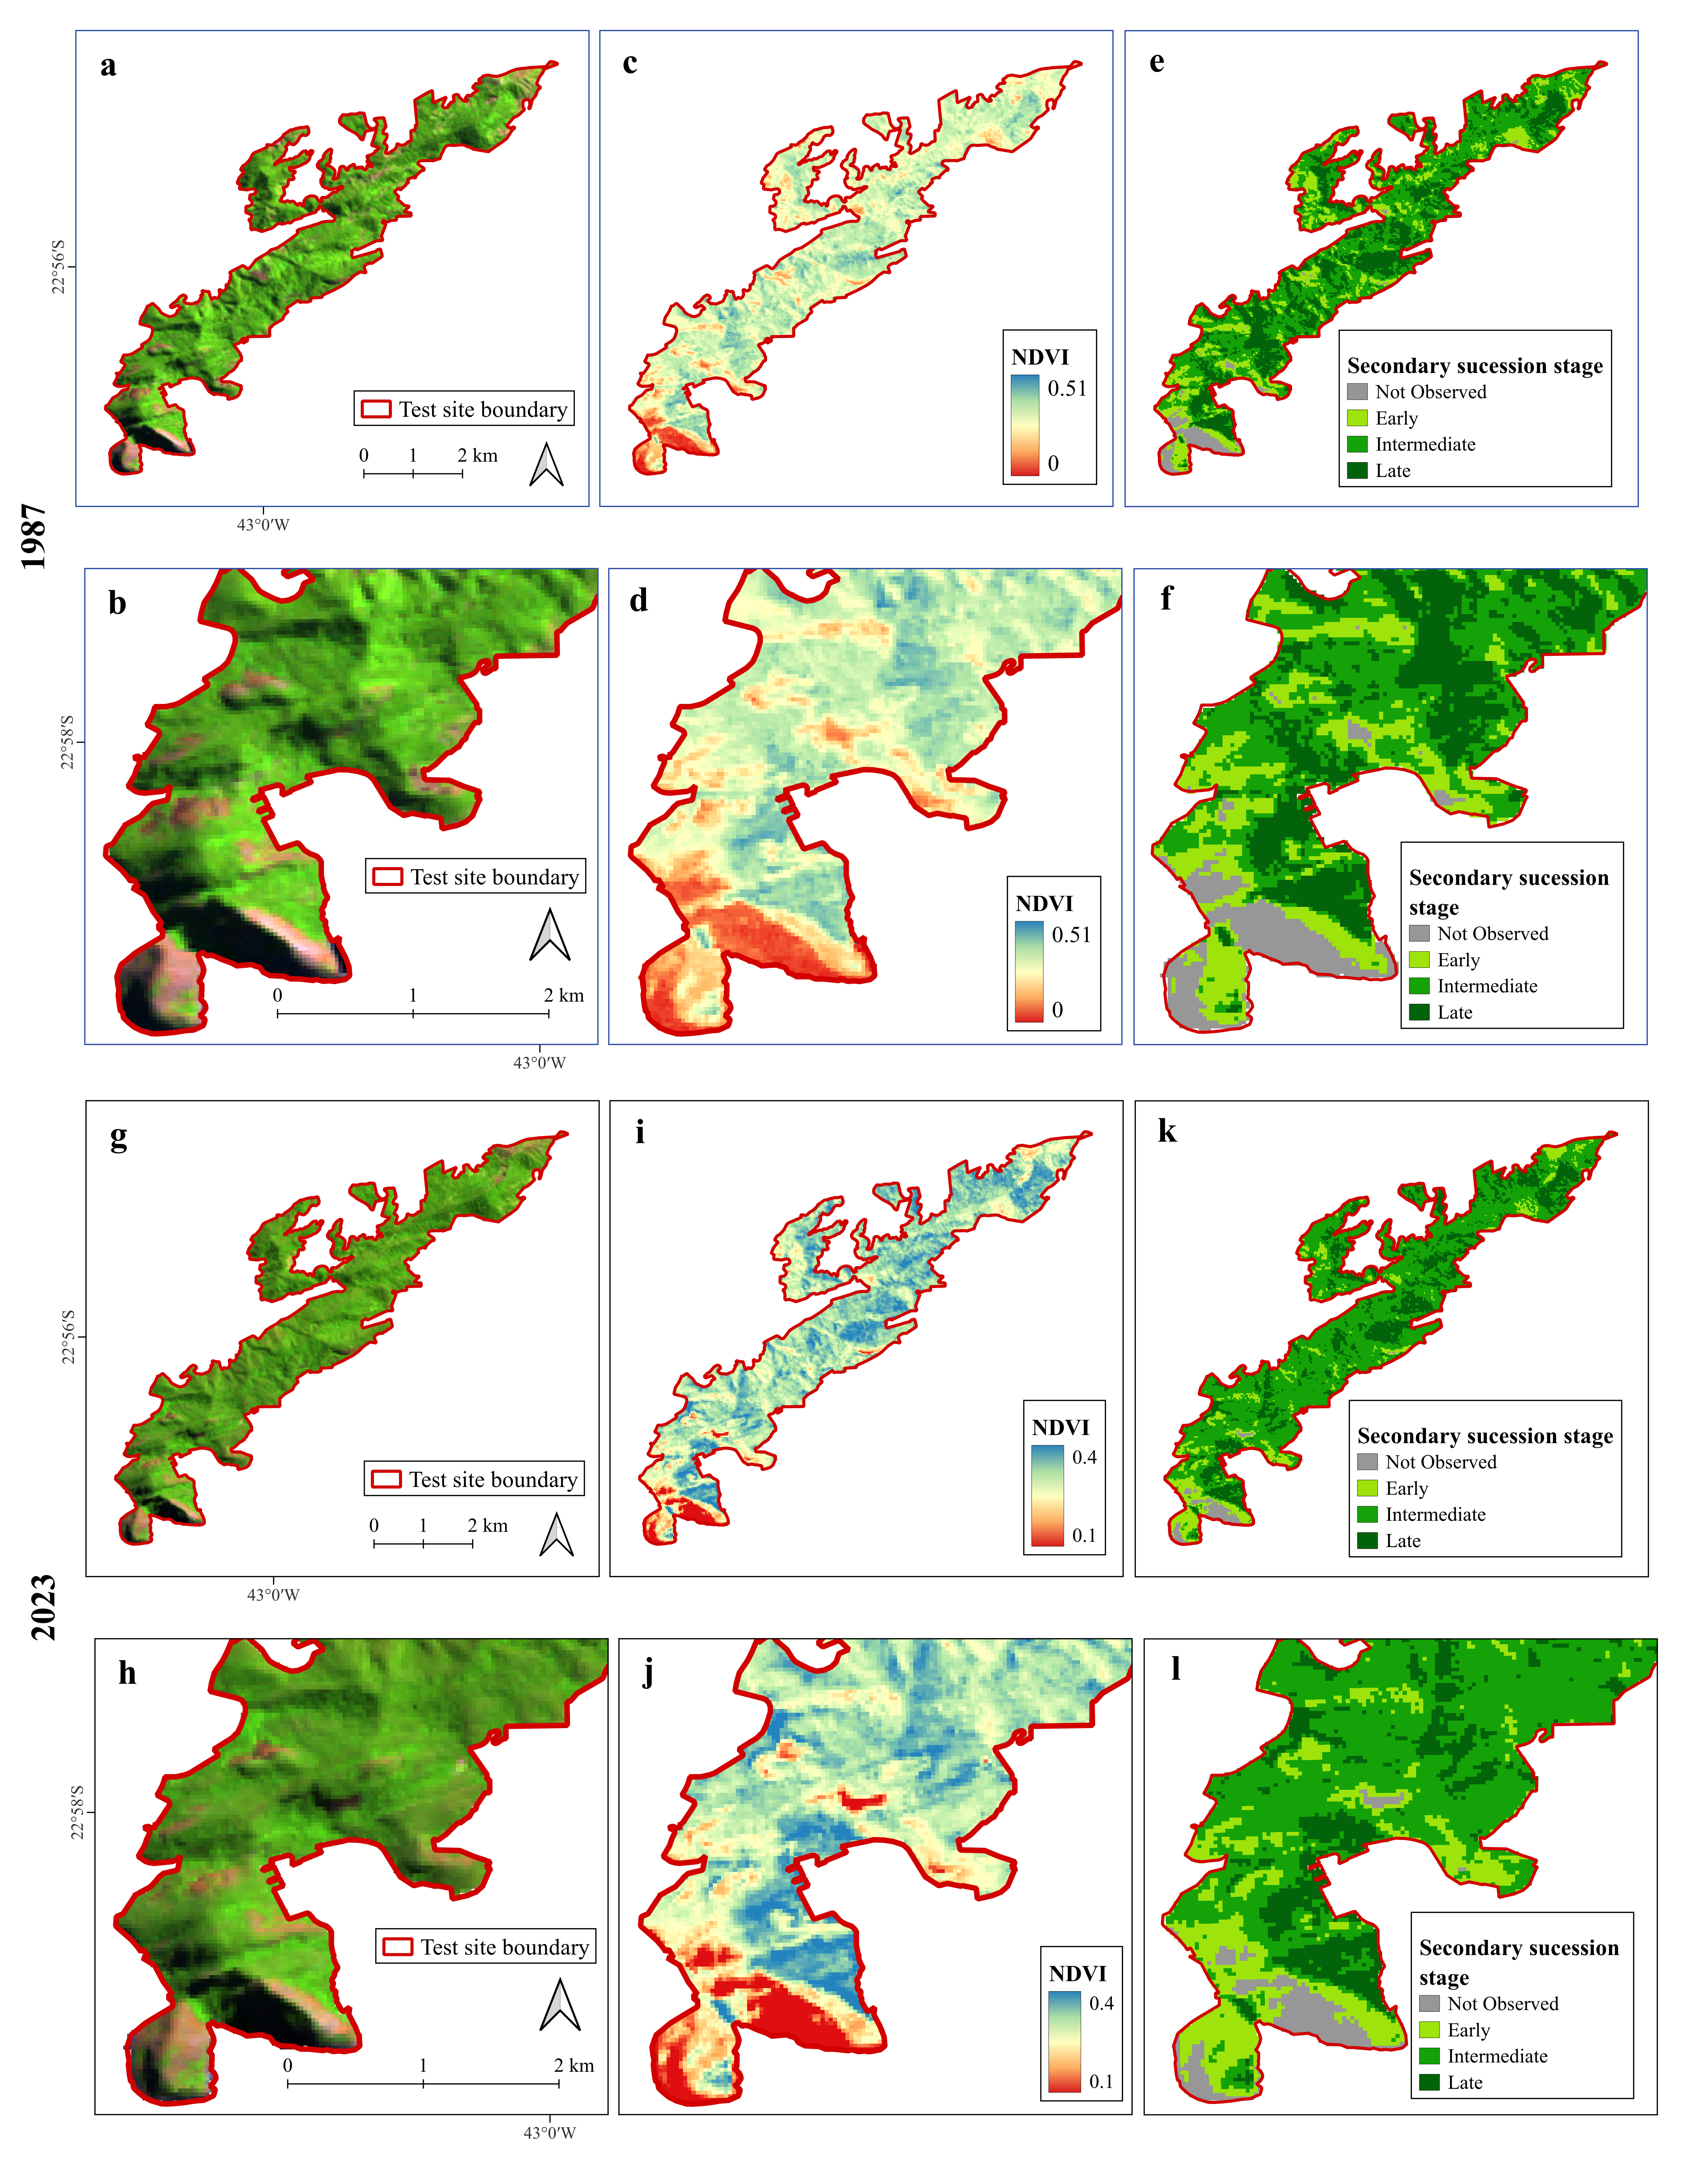
The classification for the final year of sampling (2023) using the GLMM applied to the NDVI from that year clearly delineates not observed areas, primarily corresponding to vegetation-free slopes and regions near rocky outcrops (Fig. 2). Similarly, it can be observed that early successional stages are mainly located in sparsely vegetated areas, often at the edges of the remnant. In contrast, the late successional stage is predominantly concentrated within the interior areas of Serra da Tiririca, while the intermediate stage covers many regions across the remnant (Fig. 2).
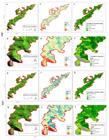
Remote sensing images of the Serra da Tiririca in 1987 (a-f, blue frame) and 2023 (g-l, black frame): (a-b and g-h) Test site over Landsat 5 false-color RGB 543 and Landsat 9 false-color RGB 654 composition image, respectively; (c-d and i-j) Normalized difference vegetation index (NDVI) image generated from cloud-free Landsat 5 and Landsat 9 composites, respectively; (e-f and k-l) Prediction of the secondary succession stage map generated from the generalized linear mixed model (GLMM) prediction on NDVI. The upper frames in 1987 and 2023 show the entire remnant, while the lower frames provide an enlarged view of a selected area.
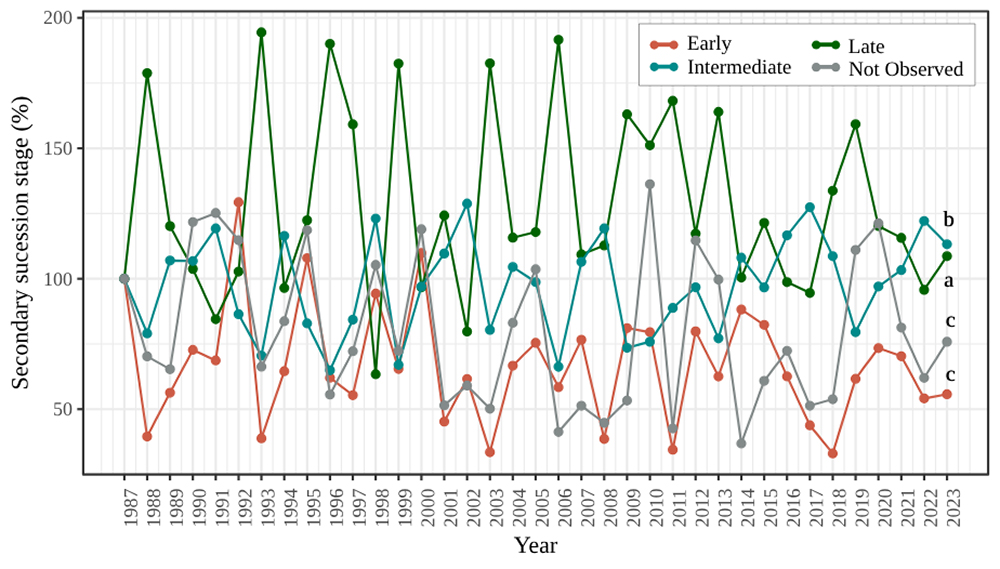
The NDVI-based GLMM estimated the successional stages within the continental area of Serra da Tiririca (1792 ha) for 1987 as follows: the early stage composed 18.73% (335.61 ha), the intermediate stage 49.52% (887.40 ha), the late stage 28.70% (514.28 ha), and the not observed areas 3.05% (54.71 ha). By 2023, NDVI data indicated that the early stage comprised 10.44% (187.01 ha), the intermediate stage 56.06% (1004.71 ha), the late stage 31,18% (558.79 ha), and the not observed areas 2.32% (41.49 ha). Analysis of the annual historical series from 1987 to 2023 revealed a reduction of 148.60 ha (44.27%) in early-stage areas and 13.22 ha (24.16%) in not observed areas. In contrast, intermediate-stage areas increased by 117.31 ha (13.22%), while late-stage areas expanded by 44.51 ha (8.65%) (Fig. 3). The comparison between the early, intermediate, late, and not observed successional stages indicated significant changes over time (p<0.05). The intermediate stage displayed a distinct pattern, characterized by an overall increase in proportional cover. The late stage also showed an increase, although following a significantly different trajectory. In contrast, the early and not observed stages exhibited more similar and pronounced patterns of decline (Fig. 3).
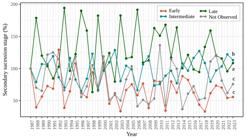
Temporal trends of secondary succession stage from 1987 to 2023 in the AF of Serra da Tiririca, Rio de Janeiro, Brazil. Different lowercase letters above or below the lines indicate significant differences according to the Tukey test (p<0.05).
The pixel-based analysis derived from GLMM predictions using NDVI encompassed an average of 19,990 pixels within the test site. The mean annual transition rate between successional stage classes (i.e., the shift from one class to any other) over the study period (1987-2023) was 5.51% (108.56 ha or 1206 pixels). The mean annual regeneration rate, based on the three successional transitions, was 4.81% (94.78 ha or 1,053 pixels). Specifically, these transitions were: from not observed areas to the early stage, 0.56% (11.04 ha or 123 pixels); from the early to intermediate stage, 4.62% (91.01 ha or 1011 pixels); and from the intermediate to late stage, 9.24% (182.29 ha or 2,025 pixels). The mean annual suppression rate, defined as the regression from late and intermediate stages to early or not observed areas, was 1.11% (21.90 ha or 243 pixels) (for details see Supplementary Document 2). Furthermore, the mean annual regeneration rate from early to intermediate in the 21st century (2000-2023) was 1.61% lower compared to the 20th-century period (1987-1999). Similarly, the mean annual regeneration rate from intermediate to late declined by 0.21% in the 21st century relative to the previous century. Finally, in the comparison of long-term trends, the mean annual suppression rate decreased by 0.29%, dropping from 26.04 ha per year in the 20th century to 20.74 ha per year in the 21st century (for details see Supplementary Document 2).
No significant correlations were observed between HFP and farming (ρ = -0.38, p>0.01), HFP and fire (ρ =0.37, p>0.01), or farming and fire (ρ =-0.12, p>0.01). Mann-Kendall tests indicated non-significant negative trends in early and late successional stages (p>0.05), and a significant increasing trend in the intermediate stage (p<0.001). Among anthropogenic variables, birds and fires exhibited non-significant increasing trends (p>0.05). In contrast, HFP showed a significant increasing trend (p<0.001), indicating that human footprint has grown over the study period, and SOC exhibited a significant increasing trend (p<0.001), reflecting accumulation of soil carbon. Farming displayed a significant decreasing trend (p<0.001), suggesting a reduction of agricultural activity in the area. For climatic variables, temperature and wind showed significant increasing trends (p<0.001), whereas precipitation had a non-significant increasing trend (p>0.05).
Results from the Durbin-Watson test revealed no significant autocorrelation in model residuals (p>0.05), with DW values close to 2 (Tab. 3). All successional vegetation models exhibited VIF values below 3.5, indicating low collinearity among predictors (Tab. 3). The best-fitting model for the early successional stage incorporated both anthropogenic and environmental variables, exhibiting the highest explanatory power (D2=0.24) and the lowest AIC value among all successional stages. A similar pattern was observed for the late successional stage, where anthropogenic and environmental variables also played a key role. In contrast, the most suitable model for the intermediate successional stage included only anthropogenic variables. The individual effects of predictor variables varied between positive and negative across successional models (Tab. 3).
Generalized Linear Model (GLM) with a Gaussian distribution, presenting the coefficients for each model and showing the relationship between successional stages and explanatory variables at the test site. Negative coefficients indicate adverse effects, while positive coefficients indicate beneficial effects. HFP = Human Footprint; SOC = Soil Organic Carbon; AIC = Akaike Information Criterion; D2 = D-squared; SE = Standard error; VIF = Variance Inflation Factor; DW = Durbin-Watson values.
Discussion
Anthropogenic pressure has extensively modified tropical forests (Wright, 2005), leading to the fragmentation and degradation of biomes such as the AF (Rezende et al., 2018). Therefore, understanding forest ecological succession in these remnants is fundamental to assessing the consequences of anthropogenic actions on ecosystem structure and function and to developing science-based strategies for effective management or restoration efforts (Grebner et al., 2021). Here, we developed a remote sensing framework using Landsat imagery to enhance the classification of forest successional stages while examining the influence of anthropogenic and climate drivers on these processes over time. The methods used revealed that natural regeneration and anthropogenic factors exert the strongest influence on the early stages of succession, supporting our first hypothesis. However, environmental factors, such as precipitation, temperature, and wind, were notably absent in the intermediate stage but became increasingly significant as succession progressed in the early and late stages, rejecting our second hypothesis. These findings emphasize the complexity of successional dynamics, highlighting the interplay between local disturbances, land-use history, and environmental conditions. This underscores the effectiveness of remote sensing in capturing forest dynamics and elucidating the distinct roles of anthropogenic and environmental factors throughout different stages of succession.
Vegetation indices derived from satellite imagery have been used to assess forest dynamics in AF (e.g., Silva et al., 2021; Berveglieri et al., 2021; Singh & Huang, 2022). Here, the NDVI, SAVI, and EVI were evaluated as predictors of successional stage classifications. NDVI outperformed the other indices, indicating superior performance in capturing successional variation within the Poisson-GLMM method. This moderate result aligns with previous findings in tropical ecosystems, where NDVI has proven to be highly sensitive to changes in vegetation cover in Brazil (e.g., Querino et al., 2016; Santana et al, 2020; Freitas et al., 2020). The performance of NDVI in this study is consistent with its widespread use in large-scale land cover assessments, such as those in MapBiomas, which also rely on NDVI for vegetation classification (MapBiomas, 2024a). However, potential circularity may occur because NDVI influences both predictor and response variables through these classifications, potentially biasing model outcomes. This limitation underscores the need for independent ground-truth data to better disentangle successional dynamics from spectral indices. Despite this, the NDVI-based model captured about 30% of the observed variation, which may account for inconsistencies in successional stage classification across years. These deviations suggest that while NDVI effectively tracks general successional trends, factors such as canopy structure, species composition, and seasonal variability can influence spectral responses (Xue & Su, 2017), leading to variations not strictly related to successional processes. The effectiveness of NDVI in distinguishing between early, intermediate, and late successional stages remains a valuable tool, highlighting its role in monitoring forest regeneration processes within AF (Sothe et al., 2017). However, NDVI may saturate in later successional stages, limiting its ability to distinguish older secondary from old-growth tropical forests, as observed in Landsat-based biomass studies (e.g., Jha et al., 2021).
Early successional stages are characterized by high plant productivity (Swanson et al., 2011), which facilitates a rapid transition to subsequent stages of succession following anthropogenic disturbance. Our study provides a spatial and temporal assessment of successional dynamics in the Serra da Tiririca remnant from 1987 to 2023, revealing trends in forest recovery. The NDVI-based GLMM method indicated an expressive reduction in early succession sites over this period. This decline suggests a shift from early to intermediate successional stages, reflecting ongoing regeneration processes. Natural regeneration, combined with conservation strategies implemented in the protected area (INEA, 2015), likely contributed to this trend, aligning with findings in other secondary forests of the AF (e.g., Souza et al., 2021). Conversely, intermediate succession stage sites showed a gradual increase, while late-stage sites expanded accordingly, as observed by Chazdon (2008), who noted the gradual attainment of mature forest conditions in tropical secondary forests, assuming that these forests remain protected and are not subject to reclearing, which frequently occurs within AF (e.g., Piffer et al., 2021; 2022). The stability and growth of intermediate and late successional stages highlight the potential for long-term forest recovery under favorable conditions. These observations reinforce that remote sensing techniques, particularly NDVI-based approaches, are effective tools for monitoring forest regeneration, allowing for a detailed detection of vegetation landscape changes, which proceeded steadily over time.
The application of GLM models further elucidated the role of key anthropogenic and environmental factors in driving successional dynamics. In early successional stages, soil organic carbon (SOC), human footprint (HFP), and wind were the most significant variables influencing local forest succession. These findings emphasize the strong impact of human-induced disturbances on forest regeneration during early succession (Swanson et al., 2011). SOC is a fundamental component of ecosystem dynamics, playing a key role in nutrient cycling and microbial activity (Schmidt et al., 2011). High human footprint values, which include infrastructure and land use changes, further constrain natural regeneration (Levis et al., 2012; Arroyo-Rodríguez et al., 2017; Singh & Huang, 2022; Araujo et al., 2023). Additionally, wind played a significant role in shaping early-stage forests, which are predominantly located along the edges of the remnant. This spatial positioning likely increases their exposure to wind, influencing seed dispersal and seedling establishment (Kim et al., 2022). Recognizing edge effects is essential to understanding how environmental and anthropogenic factors interact to drive successional dynamics in fragmented landscapes. The importance of these factors in early successional stages shows that anthropogenic and environmental influences are crucial in the early recovery phases, shaping forest regeneration processes.
Human activities modify landscape structure and influence regeneration trajectories, shaping the composition and dynamics of secondary forests (Souza et al., 2021). Recent studies in the AF also highlight that land cover changes in protected areas are predominantly driven by anthropogenic factors rather than environmental variables (Zuñe et al., 2025). Here, in the intermediate successional stages, anthropogenic factors played a predominant role, with SOC, HFP, and the presence of birds exerting significant influence. It is important to emphasize that these relationships reflect associations rather than direct causality, given the complex interactions among these factors and successional dynamics. SOC, as an indicator of past land use (Wäldchen et al., 2013), affects nutrient availability and biomass accumulation during the transition from early to intermediate stages (Xiang et al., 2022), reinforcing its role in shaping successional trajectories. SOC also contributes to late-stage succession in this study, underscoring its continued importance across succession stages. The presence of birds in this stage may influence seed dispersal processes, contributing to species recruitment and structural complexity in regenerating forests, especially in fragmented landscapes, where avian-mediated ecological processes may help maintain forest cover (Casas et al., 2016). The absence of environmental influence at this stage suggests that anthropogenic drivers continue to be the primary forces shaping forest regeneration.
In the AF, rainfall plays an important role in the successional dynamics and distribution patterns of species (Oliveira-Filho & Fontes, 2000), as observed in Serra da Tiririca, where forests in later successional stages exhibited a more pronounced sensitivity to precipitation, making it, along with SOC, one of the dominant variables explaining transitions between successional stages. Forests in later successional stages tend to be more resistant and resilient to disturbances, which suggests an increasing role for climate factors, such as rainfall and other environmental variables, in stabilizing and maintaining the conditions of these forests (Chazdon, 2008). On the other hand, the legacy effects of past land use or microclimatic variations could play a role in shaping late succession dynamics in AF (Liebsch et al., 2008). While fire's effects were not detected in any of the GLM models, it is an essential driver of forest processes in the Serra da Tiririca, exerting a more pronounced impact on the remnant's edges (Zuñe-da-Silva et al., 2022). In fact, the remnant forests under analysis are complex ecosystems that are also related to many historical processes, so the low resolution of the GLM model was expected for the more advanced successional stages. There are probably many factors that could not be incorporated into the model at this time.
Some of the valuable information provided by this study also includes insights gained from the limitations of the methods employed. The relatively low variance explained by the GLM models, particularly for the intermediate and late successional stages, shows the need to move forward with further studies and incorporate new analytical perspectives. Processes and patterns in complex ecosystems need to be analyzed with caution, and many of the limitations identified in this study may arise from the complexity of some ecological processes, which involve a multitude of interacting variables that are difficult to fully capture in a statistical model (Simon et al., 2023). Future studies could benefit from integrating additional variables, such as functional traits of species, soil and topography drivers, or disturbance histories, to improve model accuracy and better explain the variability observed in successional patterns.
By exploring the key factors driving successional dynamics in the AF, this study contributes to a broader understanding of the interactions between anthropogenic activities, climate variables, and ecosystem processes. The use of remote sensing approaches, including NDVI-based models, demonstrated strong potential as reliable proxies for tracking forest regeneration across fragmented AF landscapes. The relationship identified between NDVI and successional stages, observed through GLMM analyses, reinforces its suitability for ecological monitoring and local-scale assessments.
Findings indicate that early successional stages are most strongly influenced by anthropogenic pressures, such as SOC and HFP, as well as climate drivers such as wind. These results highlight the vulnerability of regenerating forests to land-use pressures and environmental variability. Accordingly, conservation strategies should prioritize the reduction of anthropogenic impacts and promote actions that enhance forest resilience. SOC emerged as a key variable in all stages, emphasizing the importance of edaphic conditions and soil restoration for long-term recovery. In addition, the association between intermediate successional stages and bird diversity suggests that avian-mediated seed dispersal plays a crucial role in vegetation succession, and may also reflect birds tracking resource availability, reinforcing the need to preserve faunal corridors and maintain landscape connectivity. In late successional stages, precipitation becomes a dominant factor, underscoring the importance of stable climatic conditions for the maintenance of mature forest structure. As rainfall regimes grow increasingly unpredictable due to climate change, conservation actions must focus on preserving moisture-rich habitats essential to dense ombrophilous forests and their biodiversity.
This study provides a foundation for evidence-based management and restoration policies in the AF. By identifying the main drivers of succession across temporal and spatial scales, it informs targeted interventions that support natural regeneration, promote landscape integrity, and improve the resilience of forest remnants under anthropogenic and climate stress. Strengthening environmental policies and legislation, such as enforcing stricter land-use regulations and supporting reforestation initiatives, can further bolster biome protection. Integrating remote sensing data into conservation planning enables policymakers to better predict successional forest patterns and design effective ecological interventions. This work also lays the groundwork for future studies aimed at refining predictive models and further identifying ecological drivers across successional stages.
Supplementary Material
The following online material is available for this article:
Table S1.
Table S2.
Supplementary Material 1.
Supplementary Material 2.
Acknowledgments
The authors thank the anonymous reviewers for their valuable contributions to the manuscript and the Instituto Estadual do Ambiente (INEA) for research authorization and access to the PESET.
References
- Abdi H, Williams LJ. 2010. Tukey’s honestly significant difference (HSD) test. In: Salkind NJ (ed.). Encyclopedia of Research Design. Sage, Thousand Oaks. v. 3, p. 1566-1570.
-
Aide TM, Clark ML, Grau HR, et al. 2013. Deforestation and Reforestation of Latin America and the Caribbean (2001-2010). Biotropica 45: 262-271. doi: 10.1111/j.1744-7429.2012.00908.x
» https://doi.org/10.1111/j.1744-7429.2012.00908.x -
Alvares CA, Stape JL, Sentelhas PC, Gonçalves JLM, Sparovek G. 2013. Köppen’s climate classification map for Brazil. Meteorologische Zeitschrift 22: 711-728. doi: 10.1127/0941-2948/2013/0507
» https://doi.org/10.1127/0941-2948/2013/0507 -
Araujo HF, Canassa NF, Machado CC, Tabarelli M. 2023. Human disturbance is the major driver of vegetation changes in the Caatinga dry forest region. Scientific Reports 13: 18440. doi: 10.1038/s41598-023-45571-9
» https://doi.org/10.1038/s41598-023-45571-9 -
Armenteras D, Espelta JM, Rodríguez N, Retana J. 2017. Deforestation dynamics and drivers in different forest types in Latin America: Three decades of studies (1980-2010). Global Environmental Change 46: 139-147. doi: 10.1016/j.gloenvcha.2017.09.002
» https://doi.org/10.1016/j.gloenvcha.2017.09.002 -
Arroyo-Rodríguez V, Melo FPL, Martínez-Ramos M, et al. 2017. Multiple successional pathways in human‐modified tropical landscapes: new insights from forest succession, forest fragmentation, and landscape ecology research. Biological Reviews 92: 326-340. doi: 10.1111/brv.12231
» https://doi.org/10.1111/brv.12231 - Baptista MN. 2008. Avaliação da eficácia da Resolução CONAMA 06/94 utilizada na classificação dos estádios sucessionais dos fragmentos de floresta secundária existentes na faixa de servidão da diretriz do Arco Metropolitano Rodoviário do Rio de Janeiro. BSci. Thesis. Universidade Federal Rural do Rio de Janeiro, Seropédica, Rio de Janeiro, Brazil.
-
Barbosa MA, Real R, Muñoz AR, Brown JA. 2013. New measures for assessing model equilibrium and prediction mismatch in species distribution models. Diversity and Distributions 19: 1333-1338. doi: 10.1111/ddi.12100
» https://doi.org/10.1111/ddi.12100 -
Barlow J, Begotti RA, Braga RF, et al. 2016. Anthropogenic disturbance in tropical forests can double biodiversity loss from deforestation. Nature 535: 144-147. doi: 10.1038/nature18326
» https://doi.org/10.1038/nature18326 - Barros AAM. 2008. Análise florística e estrutural do Parque Estadual da Serra da Tiririca, Niterói e Maricá, RJ, Brasil. PhD Thesis. Escola Nacional de Botânica Tropical, Instituto de Pesquisas Jardim Botânico do Rio de Janeiro, Rio de Janeiro, Brazil.
-
Berveglieri A, Imai NN, Christovam LE, Galo ML, Tommaselli AM, Honkavaara E. 2021. Analysis of trends and changes in the successional trajectories of tropical forest using the Landsat NDVI time series. Remote Sensing Applications: Society and Environment 24: 100622. doi: 10.1016/j.rsase.2021.100622
» https://doi.org/10.1016/j.rsase.2021.100622 -
Bieng MAN, Oliveira MS, Roda J-M, et al. 2021. Relevance of secondary tropical forest for landscape restoration. Forest Ecology and Management 493: 119265. doi: 10.1016/j.foreco.2021.119265
» https://doi.org/10.1016/j.foreco.2021.119265 -
Boivin NL, Zeder MA, Fuller DQ, et al. 2016. Ecological consequences of human niche construction: Examining long-term anthropogenic shaping of global species distributions. Proceedings of the National Academy of Sciences U S A 113: 6388-6396. doi: 10.1073/pnas.1525200113
» https://doi.org/10.1073/pnas.1525200113 -
Boukerche A, Zheng L, Alfandi O. 2020. Outlier detection: Methods, models, and classification. ACM Computing Surveys 53: 551-37. doi: 10.1145/338102
» https://doi.org/10.1145/338102 -
Brasil. Conselho Nacional do Meio Ambiente. Resolução CONAMA n. 006, de 04 de maio de 1994. https://www.ibama.gov.br/sophia/cnia/legislacao/MMA/RE0006-040594.pdf 05 Aug. 2024
» https://www.ibama.gov.br/sophia/cnia/legislacao/MMA/RE0006-040594.pdf -
Bressane A, Gomes IG, Da Rosa GCS, Brandelik CCM, Silva MB, Siminski A, Negri RG. 2023. Computer-aided classification of successional stage in subtropical Atlantic Forest: A proposal based on fuzzy artificial intelligence. Environmental Monitoring and Assessment 195: 184. doi: 10.1007/s10661-022-10799-x
» https://doi.org/10.1007/s10661-022-10799-x -
Brooks ME, Kristensen K, Van Benthem KJ, et al. 2017. glmmTMB: Generalized Linear Mixed Models using Template Model Builder. R Project. doi: 10.32614/CRAN.package.glmmTMB
» https://doi.org/10.32614/CRAN.package.glmmTMB -
Carlucci MB, Marcilio-Silva V, Torezan JM. 2021. The Southern Atlantic Forest: Use, Degradation, and Perspectives for Conservation. In: Marques MCM, Grelle CEV (eds.). The Atlantic Forest. Cham, Springer. p. 91-111. doi: 10.1007/978-3-030-55322-7_5
» https://doi.org/10.1007/978-3-030-55322-7_5 - Cameron AC, Trivedi PK. 2013. Regression analysis of count data. Cambridge, Cambridge University Press. vol. 53.
-
Casas G, Darski B, Ferreira PM, Kindel A, Müller SC. 2016. Habitat structure influences the diversity, richness and composition of bird assemblages in successional Atlantic rain forests. Tropical Conservation Science 9: 503-524. doi: 10.1177/19400829160090012
» https://doi.org/10.1177/19400829160090012 -
Cavanaugh JE, Neath AA. 2019. The Akaike information criterion: Background, derivation, properties, application, interpretation, and refinements. Wiley Interdisciplinary Reviews: Computational Statistics 11: e1460. doi: 10.1002/wics.1460
» https://doi.org/10.1002/wics.1460 -
Chang CC, Turner BL. 2019. Ecological succession in a changing world. Journal of Ecology 107: 503-509. doi: 10.1111/1365-2745.13132
» https://doi.org/10.1111/1365-2745.13132 - Chazdon RL. 2008. Chance and determinism in tropical forest succession. In: Carson WP, Schnitzer SA (eds.). Tropical forest community ecology. Oxford, Wiley-Blackwell. p. 384-408
-
Chraibi E, Arnold H, Luque S, Deacon A, Magurran AE, Féret JB. 2021. A remote sensing approach to understanding patterns of secondary succession in tropical forest. Remote Sensing 13: 2148. doi: 10.3390/rs13112148
» https://doi.org/10.3390/rs13112148 -
Congedo L. 2021. Semi-Automatic Classification Plugin: A Python tool for the download and processing of remote sensing images in QGIS. Journal of Open Source Software 6: 3172. doi: 10.21105/joss.03172
» https://doi.org/10.21105/joss.03172 -
Costa RL, Prevedello JA, de Souza BG, Cabral DC. 2017. Forest transitions in tropical landscapes: A test in the Atlantic Forest biodiversity hotspot. Applied Geography 82: 93-100. doi: 10.1016/j.apgeog.2017.03.006
» https://doi.org/10.1016/j.apgeog.2017.03.006 -
Curtis PG, Slay CM, Harris NL, Tyukavina A, Hansen MC. 2018. Classifying drivers of global forest loss. Science 361: 1108-1111. doi: 10.1126/science.aau3445
» https://doi.org/10.1126/science.aau3445 -
Delarmelina WM, Caldeira MVW, Gomes Junior D, Godinho TDO, Caliman JP, Gonçalves EDO, et al. 2022. Soil attributes and spatial variability of soil organic carbon stock under the Atlantic Forest, Brazil. Ciência Florestal 32: 1528-1551. doi: 10.5902/1980509867028
» https://doi.org/10.5902/1980509867028 -
Durbin J, Watson GS. 1971. Testing for serial correlation in least squares regression. III. Biometrika 58: 1-19. doi: 10.1093/biomet/58.1.1
» https://doi.org/10.1093/biomet/58.1.1 -
Edwards DP, Socolar JB, Mills SC, Burivalova Z, Koh LP, Wilcove DS. 2019. Conservation of tropical forests in the anthropocene. Current Biology 29: R1008-R1020. doi: 10.1016/j.cub.2019.08.026
» https://doi.org/10.1016/j.cub.2019.08.026 -
Fischer R, Taubert F, Müller MS, et al. 2021. Accelerated forest fragmentation leads to critical increase in tropical forest edge area. Science Advances 7: eabg7012. doi: 10.1126/sciadv.abg7012
» https://doi.org/10.1126/sciadv.abg7012 -
Fox J, Weisberg S. 2024. Car: Companion to Applied Regression. R package version 3.1-3. doi: 10.32614/CRAN.package.car
» https://doi.org/10.32614/CRAN.package.car -
Freitas WK, Gois G, Pereira Jr ER, et al. 2020. Influence of fire foci on forest cover in the Atlantic Forest in Rio de Janeiro, Brazil. Ecological Indicators 115: 106340. doi: 10.1016/j.ecolind.2020.106340
» https://doi.org/10.1016/j.ecolind.2020.106340 -
Frolking S, Palace MW, Clark DB, Chambers JQ, Shugart HH, Hurtt GC. 2009. Forest disturbance and recovery: A general review in the context of spaceborne remote sensing of impacts on aboveground biomass and canopystructure. Journal of Geophysical Research: Biogeosciences 114: G00E2. doi: 10.1029/2008JG000911
» https://doi.org/10.1029/2008JG000911 -
Gelli YK, Costa DDA, Nicolau AP, Da Silva JG. 2023. Vegetational succession assessment in a fragment of the Brazilian Atlantic Forest. Environmental Monitoring and Assessment 195: 179. doi: 10.1007/s10661-022-10709-1
» https://doi.org/10.1007/s10661-022-10709-1 - Grebner DL, Bettinger P, Siry JP, Boston K. 2021. Introduction to forestry and natural resources. London, Academic Press.
-
Görgens EB, Soares CP, Nunes MH, Rodriguez LC. 2016. Characterization of Brazilian forest types utilizing canopy height profiles derived from airborne laser scanning. Applied Vegetation Science 19: 518-527. doi: 10.1111/avsc.12224
» https://doi.org/10.1111/avsc.12224 -
Hansen MC, Potapov PV, Moore R, et al. 2013. High-resolution global maps of 21st-century forest cover change. Science 342: 850-853. doi: 10.1126/science.1244693
» https://doi.org/10.1126/science.1244693 -
Hijmans R. 2024. raster: Geographic Data Analysis and Modeling. R package version 3.6-26. doi: 10.32614/CRAN.package.raster
» https://doi.org/10.32614/CRAN.package.raster -
Hobbs RJ, Higgs E, Harris JA. 2009. Novel ecosystems: implications for conservation and restoration. Trends in Ecology & Evolution 24: 599-605. doi: 10.1016/j.tree.2009.05.012
» https://doi.org/10.1016/j.tree.2009.05.012 -
Huete AA. 1998. Soil-adjusted vegetation index (SAVI). Remote Sensing of Environment 25: 295-309. doi: 10.1016/0034-4257(88)90106-X
» https://doi.org/10.1016/0034-4257(88)90106-X -
Huete A, Didan K, Miura T, Rodriguez EP, Gao X, Ferreira LG. 2002. Overview of the radiometric and biophysical performance of the MODIS vegetation indices. Remote Sensing of Environment 83: 195-213. doi: 10.1016/S0034-4257(02)00096-2
» https://doi.org/10.1016/S0034-4257(02)00096-2 -
Huete AR. 2012. Vegetation indices, remote sensing and forest monitoring. Geography Compass 6: 513-532. doi: 10.1111/j.1749-8198.2012.00507.x
» https://doi.org/10.1111/j.1749-8198.2012.00507.x -
Hyndman R, Athanasopoulos G, Bergmeir C, et al. 2023. Forecast: Forecasting functions for time series and linear models. R package version 8.21.1. doi: 10.32614/CRAN.package.forecast
» https://doi.org/10.32614/CRAN.package.forecast - IBGE - Instituto Brasileiro de Geografia e Estatística. 2012. Manuais técnicos em geociências n. 1: manual técnico da vegetação brasileira. 2nd. edn. Rio de Janeiro, IBGE.
- INEA - Instituto Estadual do Ambiente. 2015. Plano de Manejo do Parque Estadual da Serra da Tiririca. Rio de Janeiro, Governo do Estado do Rio de Janeiro.
-
INPE - Instituto Nacional de Pesquisas Espaciais. 2024. Portal do Monitoramento de Queimadas e Incêndios Florestais. http://www.inpe.br/queimadas 05 Aug. 2024.
» http://www.inpe.br/queimadas -
Jha N, Tripathi NK, Barbier N, et al. 2021. The real potential of current passive satellite data to map aboveground biomass in tropical forests. Remote Sensing in Ecology and Conservation, 7: 504-520. doi: 10.1002/rse2.203
» https://doi.org/10.1002/rse2.203 - Kendall MG. 1975. Rank correlation measures. London, Charles Griffin.
-
Kim M, Lee S, Lee S, Yi K, Kim HS, Chung S, Chung J, Kim HS, Yoon TK. 2022. Seed dispersal models for natural regeneration: A review and prospects. Forests 13: 659. doi: 10.3390/f13050659
» https://doi.org/10.3390/f13050659 -
Levis C, Souza PFD, Schietti J, Emilio T, Pinto JLPDV, Clement CR, et al. 2012. Historical human footprint on modern tree species composition in the Purus-Madeira interfluve, central Amazonia. PLoS One 7: e48559. doi: 10.1371/journal.pone.0048559
» https://doi.org/10.1371/journal.pone.0048559 -
Libiseller C, Grimvall A. 2002. Performance of partial Mann-Kendall tests for trend detection in the presence of covariates. Environmetrics 13: 71-84. doi: 10.1002/env.507
» https://doi.org/10.1002/env.507 -
Liebsch D, Marques MC, Goldenberg R. 2008. How long does the Atlantic Rain Forest take to recover after a disturbance? Changes in species composition and ecological features during secondary succession. Biological Conservation 141: 1717-1725. doi: 10.1016/j.biocon.2008.04.013
» https://doi.org/10.1016/j.biocon.2008.04.013 -
Lu D. 2006. The potential and challenge of remote sensing‐based biomass estimation. International Journal of Remote Sensing 27: 1297-1328. doi: 10.1080/01431160500486732
» https://doi.org/10.1080/01431160500486732 -
Lüdecke D, Ben-Shachar MS, Patil I, Waggoner P, Makowski D. 2021. performance: An R Package for Assessment, Comparison and Testing of Statistical Models. Journal of Open-Source Software 6: 3139. doi: 10.21105/joss.03139
» https://doi.org/10.21105/joss.03139 -
Lu D, Li G, Moran E, Kuang W. 2014. A comparative analysis of approaches for successional vegetation classification in the Brazilian Amazon. GIScience & Remote Sensing 51: 695-709. doi: 10.1080/15481603.2014.983338
» https://doi.org/10.1080/15481603.2014.983338 - Luque S, Pettorelli N, Vihervaara P, Wegmann M. 2018. Improving biodiversity monitoring using satellite remote sensing to provide solutions towards the 2020 conservation targets. Methods in Ecology and Evolution 9: 1784-1786.
-
Luyssaert S, Jammet M, Stoy PC, et al. 2014. Land management and land-cover change have impacts of similar magnitude on surface temperature. Nature Climate Change 4: 389-393. doi: 10.1038/nclimate2196
» https://doi.org/10.1038/nclimate2196 - Machado DL. 2011. Atributos Indicadores da Dinâmica Sucessional em Fragmento de Mata Atlântica na Região do Médio Vale do Paraíba do Sul, Pinheiral, Rio de Janeiro. MSc. Thesis. Universidade Federal Rural do Rio de Janeiro, Seropédica, Rio de Janeiro, Brazil.
-
Mann HB. 1945. Nonparametric tests against trend. Econometrica 13: 245-259. doi: 10.2307/1907187
» https://doi.org/10.2307/1907187 -
MapBiomas. 2024a. Projeto MapBiomas - Coleção 8 da Série Anual de Mapas de Cobertura e Uso, Transição, Desmatamento e Vegetação Secundária e Idade da Vegetação Secundária do Brasil. https://brasil.mapbiomas.org/ 5 Aug. 2024.
» https://brasil.mapbiomas.org/ -
MapBiomas. 2024b. Projeto MapBiomas - Coleção beta da Série Anual de Solos do Brasil. Available from: Available from: https://brasil.mapbiomas.org/ 7 Aug. 2024.
» https://brasil.mapbiomas.org/ -
MapBiomas. 2024c. Projeto MapBiomas - Coleção 3 da Série Anual de Área e Cobertura queimada Anual e Acumulada do Brasil. https://brasil.mapbiomas.org/ 8 Aug. 2024.
» https://brasil.mapbiomas.org/ -
Marques MC, Grelle CE. 2021. The Atlantic Forest. History, Biodiversity, Threats and Opportunities of the Mega-diverse Forest. Cham, Springer . doi: 10.1007/978-3-030-55322-7
» https://doi.org/10.1007/978-3-030-55322-7 -
Miles J. 2014. Tolerance and variance inflation factor. Wiley StatsRef: Statistics reference online. New York, Wiley. doi: 10.1002/9781118445112.stat06593
» https://doi.org/10.1002/9781118445112.stat06593 - MMA - Ministério do Meio Ambiente. 2024. Painel de Unidades de Conservação Brasileira. Brasília, Ministério do Meio Ambiente.
-
Mota MTD, Bressane A, Roveda JAF, Roveda SRMM. 2019. Classification of successional stages in atlantic forests: a methodological approach based on a fuzzy expert system. Ciência Florestal 29: 519-530. doi: 10.5902/1980509830688
» https://doi.org/10.5902/1980509830688 - Myers N, Mittermeier RA, Mittermeier CG, Da Fonseca GA, Kent J. 2000. Biodiversity hotspots for conservation priorities. Nature 403: 853-858. doi: 10.1038/35002501
-
Myers N. 2023. Tropical deforestation: rates and patterns. In: Brown K, Pearce DW (eds.). The causes of tropical deforestation. London, Routledge. p. 27-40. doi: 10.4324/9781003428190
» https://doi.org/10.4324/9781003428190 -
Oliveira- Filho AT, Fontes MAL. 2000. Patterns of floristic differentiation among Atlantic Forests in Southeastern Brazil and the influence of climate. Biotropica 32: 793-810. doi: 10.1111/j.1744-7429.2000.tb00619.x
» https://doi.org/10.1111/j.1744-7429.2000.tb00619.x -
Oliveira-Silva AE, Piratelli AJ, Zurell D, Silva FR. 2022. Vegetation cover restricts habitat suitability predictions of endemic Brazilian Atlantic Forest birds. Perspectives in Ecology and Conservation 20: 1-8. doi: 10.1016/j.pecon.2021.09.002
» https://doi.org/10.1016/j.pecon.2021.09.002 -
Papeş M, Tupayachi R, Martínez P, Peterson AT, Powell GVN. 2010. Using hyperspectral satellite imagery for regional inventories: a test with tropical emergent trees in the Amazon Basin. Journal of Vegetation Science 21: 342-354. doi: 10.1111/j.1654-1103.2009.01147.x
» https://doi.org/10.1111/j.1654-1103.2009.01147.x -
Pastório FF, Gasper ALD, Vibrans AC. 2020. Successional stages of Santa Catarina atlantic subtropical evergreen rainforest: A classification method proposal. Cerne 26: 162-171. doi: 10.1590/01047760202026022651
» https://doi.org/10.1590/01047760202026022651 -
Piffer PR, Calaboni A, Rosa MR, Schwartz NB, Tambosi LR, Uriarte M. 2021. Ephemeral forest regeneration limits carbon sequestration potential in the Brazilian Atlantic Forest. Global Change Biology 28: 630-643. doi: 10.1111/gcb.15944
» https://doi.org/10.1111/gcb.15944 -
Piffer PR, Rosa MR, Tambosi LR, Metzger JP, Uriarte M. 2022. Turnover rates of regenerated forests challenge restoration efforts in the Brazilian Atlantic forest. Environmental Research Letters 17: 045009. doi: 10.1088/1748-9326/ac5ae1
» https://doi.org/10.1088/1748-9326/ac5ae1 -
Pohlert T. 2023. trend: Non-Parametric Trend Tests and Change-Point Detection. R package version 1.1.6. doi: 10.32614/CRAN.package.trend
» https://doi.org/10.32614/CRAN.package.trend -
Poorter L, Amissah L, Bongers F, et al. 2023. Successional theories. Biological Reviews 98: 2049-2077. doi: 10.1111/brv.12995
» https://doi.org/10.1111/brv.12995 -
QGIS Development Team. 2025. QGIS Geographic Information System. Open Source Geospatial Found. https://qgis.org/ 05 Aug. 2024
» https://qgis.org/ -
Querino CAS, Beneditti CA, Machado NG, da Silva MJG, da Silva Querino JKA, dos Santos Neto LA, et al. 2016. Spatiotemporal NDVI, LAI, albedo, and surface temperature dynamics in the southwest of the Brazilian Amazon forest. Journal of Applied Remote Sensing 10: 026007-026007. doi: 10.1117/1.JRS.10.026007
» https://doi.org/10.1117/1.JRS.10.026007 -
R Core Team. 2025. A Language and Environment for Statistical Computing. Vienna, R Foundation for Statistical Computing. https://www.r-project.org/ 05 Aug. 2024
» https://www.r-project.org/ -
Rezende CL, Scarano FR, Assad ED, et al. 2018. From hotspot to hopespot: An opportunity for the Brazilian Atlantic Forest. Perspectives in Ecology and Conservation 16: 208-214. doi: 10.1016/j.pecon.2018.10.002
» https://doi.org/10.1016/j.pecon.2018.10.002 -
Rio de Janeiro, Brasil. 1991. Lei Estadual n. 1.901, de 29 de novembro de 1991. Dispõe sobre a criação do Parque Estadual da Serra da Tiririca e dá outras providências. http://acervo.socioambiental.org/acervo/documentos/lei-n-1901-de-291191-dispoe-sobre-criacao-do-parque-estadual-da-serra-da-tiririca 05 Aug. 2024
» http://acervo.socioambiental.org/acervo/documentos/lei-n-1901-de-291191-dispoe-sobre-criacao-do-parque-estadual-da-serra-da-tiririca - Rouse JW, Haas RH, Schell JA, Deering DW, Harlan JC. 1973. Monitoring the vernal advancement and retrogradation (green wave effect) of natural vegetation. NASA/GSFC Type III Final Report . Greenbelt, Goddard Space Flight Center.
-
Rozendaal DMA, Bongers F, Aide TM, et al. 2019. Biodiversity recovery of Neotropical secondary forests. Science Advances 5: eaau3114. doi: 10.1126/sciadv.aau3114
» https://doi.org/10.1126/sciadv.aau3114 -
Santana RO, Delgado RC, Schiavetti A. 2020. The past, present and future of vegetation in the Central Atlantic Forest Corridor, Brazil. Remote Sensing Applications: Society and Environment 20: 100357. doi: 10.1016/j.rsase.2020.100357
» https://doi.org/10.1016/j.rsase.2020.100357 -
Schmidt MWI, Torn MS, Abiven S, et al. 2011. Persistence of soil organic matter as an ecosystem property. Nature 478: 49-56. doi: 10.1038/nature10386
» https://doi.org/10.1038/nature10386 -
Simon SM, Glaum P, Valdovinos FS. 2023. Interpreting random forest analysis of ecological models to move from prediction to explanation. Scientific Reports 13: 3881. doi: 10.1038/s41598-023-30313-8
» https://doi.org/10.1038/s41598-023-30313-8 -
Silva RG, dos Santos AR, Pelúzio JBE, et al. 2021. Vegetation trends in a protected area of the Brazilian Atlantic forest. Ecological Engineering 162: 106180. doi: 10.1016/j.ecoleng.2021.106180
» https://doi.org/10.1016/j.ecoleng.2021.106180 -
Silveira EMDO, Cunha LIF, Galvão LS, Withey KD, Acerbi Junior FW, Scolforo JRS. 2021. Modelling aboveground biomass in forest remnants of the Brazilian Atlantic Forest using remote sensing, environmental and terrain-related data. Geocarto International 36: 281-298. doi: 10.1080/10106049.2019.1594394
» https://doi.org/10.1080/10106049.2019.1594394 -
Singh M, Huang Z. 2022. Analysis of forest fire dynamics, distribution and main drivers in the Atlantic Forest. Sustainability 14: 992. doi: 10.3390/su14020992
» https://doi.org/10.3390/su14020992 -
SOS Mata Atlântica. 2024. Annual report. https://sosmar.org.br 16 Sept. 2024.
» https://sosmar.org.br -
Souza CR, Maia VA, de Aguiar-Campos N, et al. 2021. Long-term ecological trends of small secondary forests of the Atlantic Forest hotspot: A 30-year study case. Forest Ecology and Management 489: 119043. doi: 10.1016/j.foreco.2021.119043
» https://doi.org/10.1016/j.foreco.2021.119043 -
Souza CM Jr, Shimbo JZ, Rosa MR, et al. 2020. Reconstructing three decades of land use and land cover changes in Brazilian biomes with Landsat archive and Earth Engine. Remote Sensing 12: 2735. doi: 10.3390/rs12172735
» https://doi.org/10.3390/rs12172735 -
Sothe C, Almeida CMD, Liesenberg V, Schimalski MB. 2017. Evaluating Sentinel-2 and Landsat-8 data to map successional forest stages in a subtropical forest in Southern Brazil. Remote Sensing 9: 838. doi: 10.3390/rs9080838
» https://doi.org/10.3390/rs9080838 -
Spearman C. 1961. The Proof and Measurement of Association Between Two Things. In: Jenkins JJ, Paterson DG (eds.). Studies in Individual Differences: The Search for Intelligence. New York, Appleton-Century-Crofts. p. 45-58. doi: 10.1037/11491-005
» https://doi.org/10.1037/11491-005 -
Swanson ME, Franklin JF, Beschta RL, et al. 2011. The forgotten stage of forest succession: early-successional ecosystems on forest sites. Frontiers in Ecology and the Environment 9: 117-125. doi: 10.1890/090157
» https://doi.org/10.1890/090157 -
Taubert F, Fischer R, Groeneveld J, et al. 2018. Global patterns of tropical forest fragmentation. Nature 554: 519-522. doi: 10.1038/nature25508
» https://doi.org/10.1038/nature25508 -
Tian FP, Zhang ZN, Chang XF, Sun L, Wei XH, Wu GL. 2016. Effects of biotic and abiotic factors on soil organic carbon in semi-arid grassland. Journal of Soil Science and Plant Nutrition 16: 1087-1096. doi: 10.4067/S0718-95162016005000080
» https://doi.org/10.4067/S0718-95162016005000080 -
Uriarte M, Schwartz N, Powers JS, Marín-Spiotta E, Liao W, Werden LK. 2016. Impacts of climate variability on tree demography in second growth tropical forests: the importance of regional context for predicting successional trajectories. Biotropica 48: 780-797. doi: 10.1111/btp.12380
» https://doi.org/10.1111/btp.12380 -
Vancutsem C, Achard F, Pekel JF, et al. 2021. Long-term (1990-2019) monitoring of forest cover changes in the humid tropics. Science advances 7: eabe1603. doi: 10.1126/sciadv.abe1603
» https://doi.org/10.1126/sciadv.abe1603 -
Venter O, Sanderson EW, Magrach A, et al. 2016. Sixteen years of change in the global terrestrial human footprint and implications for biodiversity conservation. Nature Communications 7: 12558. doi: 10.1038/ncomms12558
» https://doi.org/10.1038/ncomms12558 -
Verly OM, Leite RV, Tavares- Junior IS, et al. 2023. Atlantic forest woody carbon stock estimation for different successional stages using Sentinel-2 data. Ecological Indicators 146: 109870. doi: 10.1016/j.ecolind.2023.109870
» https://doi.org/10.1016/j.ecolind.2023.109870 -
Violle C, Navas ML, Vile D, et al. 2007. Let the concept of trait be functional! Oikos 116: 882-892. doi: 10.1111/j.0030-1299.2007.15559.x
» https://doi.org/10.1111/j.0030-1299.2007.15559.x -
Wäldchen J, Schulze ED, Schöning I, Schrumpf M, Sierra C. 2013. The influence of changes in forest management over the past 200 years on present soil organic carbon stocks. Forest Ecology and Management 289: 243-254. doi: 10.1016/j.foreco.2012.10.014
» https://doi.org/10.1016/j.foreco.2012.10.014 -
Walker LR, Wardle DA. 2014. Plant succession as an integrator of contrasting ecological time scales. Trends in Ecology & Evolution 29: 504-510. doi: 10.1016/j.tree.2014.07.002
» https://doi.org/10.1016/j.tree.2014.07.002 -
Wright SJ. 2005. Tropical forests in a changing environment. Trends in Ecology & Evolution 20: 553-560. doi: 10.1016/j.tree.2005.07.009
» https://doi.org/10.1016/j.tree.2005.07.009 -
Xiang H, Luo X, Zhang L, Hou E, Li J, Zhu Q, Wen D. 2022. Forest succession accelerates soil carbon accumulation by increasing recalcitrant carbon stock in subtropical forest topsoils. Catena 212: 106030. doi: 10.1016/j.catena.2022.106030
» https://doi.org/10.1016/j.catena.2022.106030 -
Xue J, Su B. 2017. Significant remote sensing vegetation indices: A review of developments and applications. Journal of Sensors 2017: 1353691. doi: 10.1155/2017/1353691
» https://doi.org/10.1155/2017/1353691 -
Zeileis A, Hothorn T. 2022. lmtest: Testing Linear Regression Models. R package version 0.9-40. doi: 10.32614/CRAN.package.lmtest
» https://doi.org/10.32614/CRAN.package.lmtest -
Zhu X, Liu D. 2015. Improving forest aboveground biomass estimation using seasonal Landsat NDVI time-series. Journal of Photogrammetry and Remote Sensing 102: 222-231. doi: 10.1016/j.isprsjprs.2014.08.014
» https://doi.org/10.1016/j.isprsjprs.2014.08.014 -
Zuñe-da-Silva F, Rodrigue PJFP, Rojas-Idrogo C, Delgado-Paredes GE, Enrich-Prast A, Sakuragui CM. 2022. Influence of fire on edge vegetation in an Atlantic Forest remnant in Brazil. Scientia Forestalis 50: e3824. doi: 10.18671/scifor.v50.19
» https://doi.org/10.18671/scifor.v50.19 -
Zuñe-da-Silva F, Rodrigues PJFP, Rojas-Idrogo C, Delgado-Paredes GE, Enrich-Prast A, Sakuragui CM. 2023. Tree structure and composition of a coastal remnant of the Atlantic Forest in Rio de Janeiro. Advances in Forestry Science 10: 1929-1940. doi: 10.34062/afs.v10i1.13347
» https://doi.org/10.34062/afs.v10i1.13347 -
Zuñe F, Rodrigues PJFP, Sakuragui CM, Costa AF, Delgado-Paredes GE, Rogério MG, Silva NG. 2025. Anthropogenic pressure and protected areas in the Brazilian Atlantic Forest: Serra da Tiririca State Park process and patterns. Biota Neotropica 25: e20241658. doi: 10.1590/1676-0611-BN-2024-1658
» https://doi.org/10.1590/1676-0611-BN-2024-1658 -
Zuur AF, Ieno EN, Walker NJ, Saveliev AA, Smith GM. 2009. Mixed effects models and extensions in ecology with R. New York, Springer. doi: 10.1007/978-0-387-87458-6
» https://doi.org/10.1007/978-0-387-87458-6
-
Data Availability
All the datasets supporting the results of this study are available in the SciELO Data repository, at: https://doi.org/10.48331/SCIELODATA.0B7FE9.
-
Funding information
The authors thank the Coordenação de Aperfeiçoamento de Pessoal de Nível Superior (CAPES) for awarding a doctoral scholarship to the first author (Grant No. 88887.901405/2023-00).
All the datasets supporting the results of this study are available in the SciELO Data repository, at: https://doi.org/10.48331/SCIELODATA.0B7FE9.