
 Bcl-xL, Bax, and caspase-3 immunoexpression in mesenchymal stem cells of rat bone marrow and adipose tissue subjected to chondrogenic differentiation with and without triiodothyronine: comparative study
ABSTRACT
This study aims to evaluate and compare the Bcl-xL, Bax, and caspase-3 immunoexpression in rat mesenchymal stem cells (bone marrow [BM-MSC] and adipose tissue [ASC]) with and without in vitro triiodothyronine (T3) during chondrogenic differentiation. The MSC were subjected to chondrogenic differentiation for 21 days without (control group) and with different concentrations of T3 (0.01, 1, 100, and 1000nM). Thereafter, Bcl-xL, Bax, and caspase-3 expressions were performed by immunohistochemistry (IHC) and performed using Image J. The data were examined by Shapiro Wilk test, Tukey and t-test. The T3 concentrations of 0.01, 1, and 100 nM significantly reduced Bcl-xL expression in BM-MSC but increased in ASC at 0.01nM. The 0.01 and 100nM T3 increased Bax expression in BM-MSC, whereas 1000nM increased it in ASC. Caspase-3 expression in BM-MSC is not influenced by T3 but was significantly reduced in ASC at 1 and 1000nM of T3. Comparing the two MSC sources, Bax and caspase-3 expressions were significantly higher on T3-exposed BM-MSC when compared with ASC during chondrogenic differentiation. T3 reduces Bcl-xL expression, increases Bax expression, and does not alter caspase-3 expression in BM-MSC and increases Bcl-xL and Bax expression and reduces caspase-3 expression in ASC.
Keywords:
Chondrogenesis; programmed cell death; triiodothyronine; stem cells; rats
RESUMO
O presente estudo tem como objetivo avaliar e comparar a imunoexpressão de Bcl-xL, Bax e caspase-3 em células-tronco mesenquimais de ratos (medula óssea [CTM-MO] e tecido adiposo [TA]) com e sem triiodotironina (T3) in vitro durante a diferenciação condrogênica. As MSC foram submetidas à diferenciação condrogênica por 21 dias sem (grupo controle) e com diferentes concentrações de T3 (0,01, 1, 100 e 1000nM). Posteriormente, as expressões de Bcl-xL, Bax e caspase-3 foram realizadas por imuno-histoquímica (IHC) e usando-se Image J. Os dados foram examinados pelo teste de Shapiro Wilk, Tukey e teste t. As concentrações de T3 de 0,01, 1 e 100nM reduziram significativamente a expressão de Bcl-xL em CTM-MO, mas aumentaram em CTM-TA a 0,01nM. O T3 de 0,01 e 100nM aumentou a expressão de Bax em CTM-MO, enquanto 1000nM aumentou em CTM-TA. A expressão de caspase-3 em CTM-MO não é influenciada por T3, mas foi significativamente reduzida em CTM-TA em 1 e 1000nM de T3. Comparando-se as duas fontes de MSC, a expressão de Bax e caspase-3 foi significativamente maior em CTM-MO exposto a T3 quando comparado com CTM-TA durante a diferenciação condrogênica. T3 reduz a expressão de Bcl-xL, aumenta a expressão de Bax e não altera a expressão de caspase-3 em BM-MSC, aumenta a expressão de Bcl-xL e Bax e reduz a expressão de caspase-3 em ASC.
Palavras-chave:
condrogênese; morte celular programada; triiodotironina; células-tronco; ratos
INTRODUCTION
Stem cell studies have grown exponentially in recent years, mainly in the treatment of numerous chronic diseases and serious injuries with the aim of restoring the functionality of damaged tissues and organs (Hoang et al., 2022). Thus, these cells have been used in research for therapy or prevention of lesions in bone and cartilaginous tissue (Kangari et al., 2020). Understanding the functioning and growth of organisms and how tissues are maintained throughout adulthood allows knowing the possibilities offered by stem cells in cell therapies, which represents a revolution in the understanding of tissue repair and regeneration mechanisms (Hoang et al., 2022).
Thyroid hormones (TH), thyroxine (T4) and triiodothyronine (T3), exert important effects on bone metabolism, both during embryogenesis and adulthood, and consequently influence bone differentiation, growth, and remodeling (Bakos et al., 2018). The TH act by binding to nuclear thyroid receptors (TRs), TRα and TRβ, found in several bone tissue cells (3) such as osteoblasts, osteoclasts, and chondrocytes (Basset e Williams, 2016).
In this sense, TH acts on the cartilaginous tissue, and, during the physiological process of endochondral ossification, T3 regulates the processes that involve hypertrophic differentiation of chondrocytes (Waung et al., 2012). The TH in vivo (Robsom et al., 2000) stimulate the growth and in vitro maturation of embryonic cartilaginous tissue (Burch e Lebovitz, 1982) and the growth of chondrocytes of the epiphyseal plaque, mainly of the hypertrophic zone in rat tibia culture (Miura et al., 2002).
Also, in vitro studies have shown that TH increases the potential for chondrogenic differentiation of mesenchymal stem cells from the bone marrow (BM-MSC) of rats (Assis et al., 2018). However, TH does not influence the chondrogenic differentiation of mesenchymal stem cells from adipose tissue (ASC) of this species (Elert et al., 2022). The TH have an important effect on the proliferation and apoptosis processes in vitro and in vivo (Su et al., 1997); however, no known studies evaluated the influence of TH on the apoptosis of BM-MSC and ASC on the chondrogenesis. The chondrogenesis process in vivo is continuous and consists of the stages of proliferation, hypertrophic differentiation, and apoptosis of chondrocytes (Nilsson et al., 2005). The progression of this process is directly controlled by several cytokines, growth factors and hormones, including thyroid hormones (Mackie et al., 2011).
Apoptosis, also called programmed cell death, is a physiological process (Kerr et al., 1972) that occurs in the embryonic development period and during organ involution, including both biochemical and morphological alterations. Several growth factors, cytokines, and hormones are known to act on apoptosis and thyroid hormones are considered potential inducers of this process (Kiess e Gallaher, 1998).
Additionally, Bax (Kiess e Gallaher, 1998) and caspases also induce apoptosis, and caspase-3 is one of the main enzymes implementing apoptosis. There are also antiapoptotic factors represented by Bcl-2 and Bcl-xL (Cohen, 1997).
During the process of in vitro MSC chondrogenic differentiation, the cells undergo several changes, that can be accompanied by the occurrence of programmed cell death (Gibson et al., 1997). However, apoptosis can be stimulated or inhibited depending on the constituents added to the culture medium (Wang et al., 2010). To date, the effect of TH on BM-MSC and ASC apoptosis on in vitro chondrogenesis was unknown. What is known is that T3 regulates the processes that involve hypertrophic differentiation of chondrocytes (Waung et al., 2012), since they instill proliferation and stimulate hypertrophic differentiation of chondrocytes from the in vivo epithelial plaque (Robsom et al., 2000).
Programmed cell death in vivo and regulation of the final stages of the chondrocytes life cycle are indispensable in determining the rate of chondrocytes that will enter the maturation process (Shapiro et al., 2014) therefore the apoptosis of hypertrophic chondrocytes is essential for the transition from chondrocyte to osteogenesis (Goldring et al., 2006). Since apoptosis of hypertrophic chondrocytes can be verified by changes such as activation of effector caspases and DNA fragmentation (Mackie et al., 2011).
From this, investigating the effects of different concentrations of T3 in MSC during the chondrogenic differentiation was necessary to explain in part why T3 effects on the chondrogenic differentiation of BM-MSC and ASC are different (Assis et al., 2018; Elert et al., 2022). Thus, the general objective of this study was to evaluate the expression of Bcl-xL, Bax, and caspase-3 in rat mesenchymal stem cells after in vitro chondrogenic differentiation in the absence or presence of different triiodothyronine concentrations.
MATERIALS AND METHODS
All experimental procedures were performed according to the recommendations and approval of the Ethics Committee on the Use of Animals (CEUA) of the Federal University of Espírito Santo according to protocol number 015/2020.
Aiming to reduce the number of animals in research, this work used six 30-day-old Wistar female rats to extract BM-MSC and ASC and these animals were euthanized with anesthesia overdose (sodium pentobarbital [100mg/kg] intraperitoneally). After cell extraction, a pool of each cell type (BM-MSC and ASC) was obtained. The number of animals was determined with previous studies (Assis et al., 2018; Elert et al., 2022).
The animals were taken to a surgical room and trichotomy and asepsis of the ventral abdominal, dorsum-lumbar, and posterior limbs of the animals were performed, then medial skin incision was made in the pelvic limbs, dissection of the femur and tibias bones that were subsequently disjointed and packed in a sterile tube containing DMEM (Dulbecco’s Modified Eagle Medium; Invitrogen, CA, USA).
In laminar flow, epiphyses were removed, and bone marrow was washed with DMEM solution enriched with amphotericin (25μg/L), streptomycin (100μg/mL), gentamicin (60μg/L), and penicillin (100U/mL) to obtain a cell pool. The material was centrifuged for 10 minutes at 1400g, the precipitate was resuspended, transferred to T75 bottles (Sarstedt, Numbrecht, Germany). The cells were cultured in DMEM enriched with antibiotics and antimycotics and 10% FBS (bovine fetal serum; LGC Biotechnology, Brazil) in an incubator at 37°C and 5% CO2 for approximately 30 days. The culture medium was changed twice a week.
The animals were taken to a surgical room and trichotomy and asepsis of the ventral abdominal region was performed with posterior laparotomy to obtain a pool of abdominal adipose tissue cells. This material was stored in a sterile tube with DMEM enriched with amphotericin (25μg/L), streptomycin (100μg/mL), gentamicin (60μg/L), and penicillin (100U/mL). Then, with the aid of sterile scissors, adipose tissue was fragmented and placed in a tube with collagenase type I (Sigma Aldrich, St. Louis, MO, USA) at 0.15% diluted in PBS (standard phosphate buffer solution) 0.15M and incubated for 60 minutes at 37°C and 5% CO2, with stirring every 15 minutes.
After incubation, in the laminar flow, collagenase was inactivated by adding DMEM with 10% FBS. Then, the material was centrifuged for 10 minutes at 1400g, resulting in three layers: fat, red blood cells and other blood cells, and precipitated (stromal phase). The supernatant was discarded, and the precipitate was resuspended in DMEM enriched with antibiotics and antimycotics plus 10% FBS and cultivated in T75 bottles in an oven at 37°C and 5% CO2 for approximately 30 days. The culture medium was changed twice a week.
After passaging the cells four times and reaching the confluence of 80 to 90% of the cells, the cell viability test was performed by Trypan Blue. The cells grown in T75 bottles with DMEM were washed with PBS (0.15M) and trypsinized. The cells were transferred to sterile tubes and centrifuged for 10 minutes at 1400g. The precipitate was resuspended, and part of the cells were stained with Trypan Blue, placed in Neubauer chamber, and evaluated in optical microscopic. Transparent (non-stained) cells were considered viable and blue-stained cells were considered unviable.
After the cell viability test, the cells derived from bone marrow and adipose tissue were cultured in 15mL tubes in a pellet system in standardized cell quantity (5×10⁵ cells) and in three replications. The tubes contained 500μL chondrogenic medium (StemPro Chondrogenesis; Gibco, USA) per tube, added with 3,3’,5-triiodo-L-thyronine (T3) or not, incubated for 21 days in temperature of 37°C and 5% CO2. The medium exchange was made once a week. Concentrations of 3,3’,5-triiodo-L-thyronine (T3; Sigma-Aldrich) were established from studies (Boeloni et al., 2013), with a concentration of 0.01 nM similar to the physiological concentration.
All rats (6/6) were used for extraction of a cell pool. After, this pool was used to make the experimental groups. Ten experimental groups were constituted with three replicates for each group of BM-MSC and ASC cultivated in chondrogenic medium: i) BM-MSC without T3; ii) BM-MSC with T3 (0.01nM); iii) BM-MSC with T3 (1nM); iv) BM-MSC with T3 (100nM); v) BM-MSC with T3 (1000nM); vi) ASC without T3; vii) ASC with T3 (0.01nM); viii) ASC with T3 (1nM); ix) ASC with T3 (100nM); and x) ASC with T3 (1000nM). After 21 days, the pellets were washed with 0.15M PBS and fixed in 10% buffered formaldehyde and processed by the routine method of paraffin inclusion.
After 21 days of differentiation, the pellets were washed with PBS 0.15 M, fixed in 10% buffered formaldehyde solution for one hour and processed according to the following protocol: i) alcohol 70% (30min), ii) alcohol 80% (30min), iii) alcohol 90% (30min), iv) absolute alcohol 1 (30min), v) absolute alcohol 2 (30min), vi) absolute alcohol 3 (30min), vii) xylol 1 (20min), vii) xylol 2 (20min), viii) xylol 3 (20min), ix) paraffin 1 (20min), x) paraffin 2 (20min), and xi) paraffin 3 (20min).
Subsequently, the material was put in paraffin, subjected to microtomy with 3 μm sections, placed on salinized slides, and three samples from each group were subjected to immunohistochemical reaction to evaluate the expression of Bcl-xL, Bax, and caspase-3.
Previous studies by the research group confirmed the expression of important genes for chondrogenesis in the BM-MCS and ASC mentioned above and used in this study, after chondrogenic differentiation, such as Col ll, aggrecan and Sox9. In addition, to carrying out special stains to mark the chondrogenic matrix, using Alcian blue (AB) and periodic acid of Schiff (PAS) staining as an example. The results were not presented in this article.
The selected samples were initially deparaffinated in the greenhouse at 55°C for 24 hours, and then in xylol for 20 minutes. They were then rehydrated in a series of baths in graduated alcohol, rinsed with distilled water and subjected to antigenic recovery with sodium citrate (pH 6.0) at a high temperature for 15 minutes in the microwave (maximum power, Electrolux, model MEF41). After this procedure, the slides were washed in washing buffer (TRIS, pH 7.6) for five minutes and the endogenous peroxidases were blocked with methanol and hydrogen peroxide V.10 solution at a ratio of 9:1 in TRIS (pH 7.6) for 20 minutes at room temperature.
After three baths of 5 minutes each in TRIS (pH 7.6), the slides were incubated in nonspecific protein blocking solution (3% of milk powder diluted in TRIS (pH 7.6) for 85 minutes at 27°C and then washed three times in TRIS (pH 7.6) for 5 minutes each.
The experimental slides (three per group) were incubated in a humid chamber (temperature 4 to 8°C) and overnight (12 hours) with primary antibodies anti-Bcl-xL (1:100, monoclonal produced in mouse, Sta Cruz Biotechnology), anti-Bax (1:650, monoclonal produced in mouse, Sta Cruz Biotechnology), and anti-caspase-3 cleaved (1:300, polyclonal produced in rabbit, Asp175, Cell Signaling Technology, MA Danvers). The control blades were incubated in a humid chamber (temperature of 4 to 8°C) and overnight (12 hours), in TRIS buffer solution. The next day, the slides were washed with three baths, 5 minutes each, in TRIS buffer solution (pH 7.6), then the slides were instilled with 25μL of monoclonal secondary antibody Simple Stain TM Rat MAX PO (MULTI) (Nichirei Biosciences Inc., Tokyo, JP) at room temperature (approximately 27°C) for 30 minutes. After three washes with TRIS (pH 7.6), the staining was visualized with 3,3’-diaminobenzidine (DAB, Sigma, St. Louis, MO). All slides were contrasted with Harris hematoxylin for 4 minutes, dehydrated in ethanol, cleaned in xylene, and assembled with Entellan mounting medium (Merck).
To avoid problems with interobserver variations, the IHC Profiler plugin (Varghese et al., 2014) was used from the compatibility with the open-source digital image analysis software, ImageJ. This program performs a pixel-by-pixel analysis of a digital IHC image and even assigns a score on a four-layer system (p<0.0001, CI = 95%).
Three slides of each hormone concentration and control were evaluated in each tissue obtained (BM-MSC and ASC), totaling 90 images. The protein expression value of each antibody was obtained by summing the percentage of pixels marked as positive (considering the high positive, positive, and low positive groups), and the percentage of negative marking was discarded. The predominant score of each group was also described and quantified in percentage values for better visualization provided by the software.
To describe the predominant score, after obtaining the data provided by the ImageJ software, the results were subjected to quantitative analysis using descriptive statistics with the values expressed in percentages.
For statistical analysis of protein expression variance in each group and tissue, the One-Way ANOVA test with Tukey post hoc were used. The Shapiro Wilk test was used to evaluate the normality test for the variables analyzed. And for comparing the means of each group and of each tissue, the t-test was used.
In all analyses, statistically significant results were indicated by p < 0.05. Statistical analysis was performed with GraphPad Prism 7 software (GraphPad Software, La Jolla California, USA).
RESULTS
Cell viability was evaluated before cultivation in a chondrogenic differentiation medium, finding both BM-MSC and ASC with at least 90% viability. Thus, the cells used for chondrogenic differentiation were viable, which would not be a limiting factor for the next stage of cultivation.
The control group showed significantly higher protein expression of Bcl-xL in BM-MSC (90.130±9.748; p<0.0001) compared with groups at T3 concentrations of 0.01, 1, and 100nM. The concentration of 1000nM also showed higher expression (72.960±29.610; p=0.003) compared with the groups at concentrations of 1 and 100nM of T3 (Fig. 1A, B and Fig. 2). Regarding the score, positive (10/24) and weak positive (10/24) were predominant, representing 41.67% each.
In ASC, the concentration of 0.01nM of T3 (96.560±6.372; p=0.001) showed a significantly higher protein expression of Bcl-xL compared with the control group and the other concentrations (1, 100, and 1000nM of T3) (Fig. 1A, B and Fig. 2). Regarding the score, the positive weak (12/17) was predominant, representing 70.59%. When comparing the protein expression of Bcl-xL between the BM-MSC and ASC, the protein expression of Bcl-xL was higher in the control group in the MSC (p=0.0001), whereas at the concentration of 0.01nM was higher in the ASC (p=0.0001) (Fig. 1C).
The protein expression of Bax in BM-MSC was significantly higher at concentrations of 0.01nM (66.1300±6.445; p=0.020) and 100nM of T3 (60.440±19.950; p-value 0.040) compared with the control group. And the concentration of 0.01nM of T3 (66.130±6.445) was higher when compared with that of 1000nM (Fig. 3A, B and Fig. 4). Regarding the score, the positive (13/22) was predominant, representing 59.09%. In ASC, Bax protein expression was significantly higher at the concentration of 1000nM of T3 (36.920±14.810; p=0.001) when compared with the control group and the other concentrations (0.01, 1, and 100nM of T3) (Fig. 3A, B and Fig. 4). Regarding the score, the negative (20/22) was predominant, representing 90.91%.
When comparing Bax protein expression between BM-MSC and ASC, the concentrations of 0.01nM (p=0.000), 1nM (p=0.001), and 100nM (p=0.002) and the control group (p=0.007) showed significant difference, and in all these groups, Bax protein expressions were higher in BM-MSC (Fig. 3C).
The protein expression of caspase-3 in BM-MSC showed no significant difference (p=0.114) between the groups studied (Fig. 5A,B and Fig. 6). Regarding the score, the negative (19/22) was predominant, representing 86.36%. In ASC, the protein expression of caspase-3 in groups 1 and 1000nM of T3 was lower than in the control group (13.780±0.552; p=0.020). It was also significantly higher at concentrations of 0.01nM (11.560±0.767; p=0.030), 100nM (11.980±1.321; p=0.010), and 1000nM of T3 (11.310±0.528; p=0.04) when compared with the concentration group of 1nM of T3 (Fig. 5A, B and Fig. 6). Regarding the score, the negative (16/16) was predominant, representing 100%.
When comparing the protein expression of caspase-3 between BM-MSC and ASC, this immunoexpression was higher in BM-MSC in all groups evaluated: control (p=0.002), 0.01nM (p=0.034), 1nM (p=0.0197), 100 nM (p=0.048), and 1000nM T3 (p=0.016) (Fig. 5C).

Protein expression of Bcl-xL in mesenchymal stem cells of bone marrow (BM-MSC) and adipose tissue (ASC) of 30-day-old Wistar female rats at 21 days of chondrogenic differentiation and on the effect of different concentrations of triiodothyronine (T3). (A) The control group showed significantly higher protein expression of Bcl-xL in BM-MSC (90.130±9.748; p<0.0001) compared with groups at T3 concentrations of 0.01, 1, and 100nM. The concentration of 1000nM also showed higher expression (72.960±29.610; p=0.003) compared with the groups at concentrations of 1 and 100nM of T3. (B) In ASC, the concentration of 0.01nM of T3 (96.560±6.372; p=0.001) showed a significantly higher protein expression of Bcl-xL compared with the control group and the other concentrations (1, 100, and 1000nM of T3). (C) Comparison of Bcl-xL immunoexpression between BM-MSC and ASC: the protein expression of Bcl-xL was higher in the control group in the MSC (p=0.0001), whereas at the concentration of 0.01nM was higher in the ASC (p=0.0001). #p<0.05.
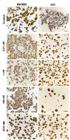
Detection of immunomark for Bcl-xL in mesenchymal bone marrow (BM-MSC) and adipose tissue (ASC) stem cells of 30-day-old Wistar female rats in the control groups and in those treated with concentrations different concentrations of triiodothyronine (T3) at 21 days of chondrogenic differentiation. Immunohistochemistry, (DAB: 3.3 diaminobenzydine tetrahydrochloride).

Protein expression of Bax in mesenchymal stem cells of bone marrow (BM-MSC) and adipose tissue (ASC) of 30-day-old Wistar female rats at 21 days of chondrogenic differentiation and on the effect of different concentrations of triiodothyronine (T3). (A) The protein expression of Bax in BM-MSC was significantly higher at concentrations of 0.01nM (66.1300±6.445; p=0.020) and 100nM of T3 (60.440±19.950; p-value 0.040) compared with the control group and the concentration of 0.01nM of T3 (66.130±6.445) was higher when compared with that of 1000nM. (B) In ASC, Bax protein expression was significantly higher at the concentration of 1000nM of T3 (36.920±14.810; p=0.001) when compared with the control group and the other concentrations (0.01, 1, and 100nM of T3). (C) Comparison of Bax immunoexpression between BM-MSC and ASC: the concentrations of 0.01nM (p=0.000), 1nM (p=0.001), and 100nM (p=0.002) and the control group (p=0.007) showed significant difference, and in all these groups, Bax protein expressions were higher in BM-MSC. #p<0.05.
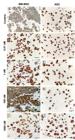
Detection of immunoexpression for Bax in mesenchymal stem cells of the bone marrow (BM-MSC) and of adipose tissue (ASC) of 30-day-old Wistar female rats in the control groups and treated with concentrations different concentrations of triiodothyronine (T3) at 21 days of chondrogenic differentiation. Immunohistochemistry (DAB: 3,3-diaminobenzidine tetrahydrochloride).

Protein expression of caspase-3 by the immunohistochemistry technique in mesenchymal stem cells of the bone marrow (BM-MSC) and adipose tissue (ASC) of 30-day-old Wistar female rats at 21 days of chondrogenic differentiation and on the effect of different concentrations of triiodothyronine (T3). (A) The protein expression of caspase-3 in BM-MSC showed no significant difference (p=0.114) between the groups studied. (B) In ASC, the protein expression of caspase-3 in groups 1 and 1,000nM of T3 was lower than in the control group (13.780±0.552; p=0.020). It was also significantly higher at concentrations of 0.01nM (11.560±0.767; p=0.030), 100nM (11.980±1.321; p=0.010), and 1,000nM of T3 (11.310±0.528; p=0.04) when compared with the concentration group of 1nM of T3. (C) Comparison of caspase-3 immunoexpression between BM-MSC and ASC: this immunoexpression was higher in BM-MSC in all groups evaluated: control (p=0.002), 0.01nM (p=0.034), 1nM (p=0.0197), 100nM (p=0.048), and 1,000nM T3 (p=0.016). #p<0.05.

Detection of immunoexpression for caspase-3 in mesenchymal bone marrow (BM-MSC) and adipose tissue (ASC) of 30-day-old Wistar female rats in the control groups and in those treated with concentrations different concentrations of triiodothyronine (T3) at 21 days of chondrogenic differentiation. Immunohistochemistry (DAB: 3,3-diaminobenzidine tetrahydrochloride). Marking score: A: Weak positive. B, C, D, E, F, G, H, I, J: Negative. The protein expression of caspase-3 in BM-MSC showed no significant difference between the groups studied. In ASC, the protein expression of caspase-3 in groups 1 and 1,000nM of T3 was lower than in the control group. It was also significantly higher at concentrations of 0.01nM, 100nM, and 1,000nM of T3 when compared with the concentration group of 1nM of T3.
DISCUSSION
This study demonstrates that the expression of the anti-apoptotic protein of Bcl-xL in BM-MSC varied depending on the T3 concentration, since most T3 concentrations evaluated (0.01, 1, and 100nM) showed a decrease in the expression. On the contrary, in ASC, the expression of this protein increased at the lowest in the evaluated concentration (0.01nM of T3) which is considered a physiological concentration (Ishida et al., 1995). Note that, physiologically Bcl-xL is highly expressed in chondrocytes from the growth plate of chicks and this expression does not vary with the degree of cell maturation (Pucci et al., 2007). On the contrary, hypothyroid rats with low circulating TH concentration presented low Bcl-xL and Bcl-2 expression (anti-apoptotic) and high Bax expression (pro-apoptotic) in the cerebellum (Singh et al., 2003). Conversely, T3 (1 and 10nM) stimulates the expression of Bcl-xL in human hepatoma cells that overexpress TRα (Chi et al., 2012). Also, T3 at the concentration of 10−7M (equals 100 nM), increases the expression of TH receptors (TRα and TRβ) in pancreatic islet beta cells, increases the expression of Bcl-xL and Bcl-2, decreases the expression of Bax, Bad, and caspase-3, and consequently inhibited apoptosis in vitro in these cells (Falzacappa et al., 2006).
Thus, the action of TH on Bcl-xL expression may vary depending on the cell type, T3 concentration used, and serum TH concentration. Additionally, the genetic background and the cellular microenvironment, as well as the place of obtention and the concentration of extrinsic agents such as T3 in in vitro differentiation may interfere in the extent of DNA damage and the level of different proteins (Vermeulen et al., 2003).
Regarding the expression of the pro-apoptotic marker Bax in CSM of rats after chondrogenesis, a concentration-dependent overexpression was observed, since BM-MSC showed an increase in expression in concentrations such as 0.01 and 100 nM of T3. Whereas in ASC, Bax expression increased in high T3 concentration (1000 nM). Partially corroborating these results, studies prove that Bax expression progressively increases towards the hypertrophic zone of the growth plate of bovine fetuses (Hillarby et al., 1996) and increases in differentiated chondrocytes obtained from chick growth plate (Pucci et al., 2007). Moreover, the increase of Bax may mean a greater chance of the cells dying from apoptosis and the tissue being replaced by bone tissue (Crombrugghe et al., 2001), since this stage is essential for the process of terminal differentiation in bone growth plaque in vivo (Waung et al., 2012). Thus, we infer that Bax expression increases in differentiated cells and that T3 is probably one of the factors that stimulate, in a concentration-dependent way, this increase.
Contrary to what was observed in this study regarding Bax expression, a study found that treatment with T3 (5nM) decreased the expression of this protein and also other pro-apoptotic factors such as caspases 3, 7 and 9, Pmaip1, and Apaf1 and increased the expression of anti-apoptotic factors such as Bcl2l2 and Bag1 in cortical neuron culture of mice subjected to a hypoxic environment and, consequently protected neurons from hypoxic injury (0.2% O2) (Li et al., 2019). This difference to the research in question may be related to the different cell types, the different concentrations, and the adverse microenvironment. Thus, showing that these factors directly influence the action of TH on the expression of pro- and anti-apoptotic factors and consequently on apoptosis.
When evaluating the expression of caspase-3 in CSM, T3 shows no effect on this expression in BM-MSC but has concentration-dependent action in ASC, since the expression of caspase-3 decreases in these cells at concentrations of 1 and 1000nM of T3. The extrinsic agent, in this case T3, did not interfere in a potential expression of caspase-3 in BM-MSC; however, protein was present, which makes the apoptosis process irreversible once the effector caspase is activated (Marti et al., 2002). Corroborating this, a study found that caspase-3 is expressed in hypertrophic chondrocytes collected from chick growth plate and that this protein is essential for apoptosis (Pucci et al., 2007).
However, interestingly, the expression of caspase-3 decreased in ASC on the influence of T3. Thus, the action of T3 may be different in these cells compared with BM-MSC, since they are distinct cell types. This hypothesis can be supported, at least partially, by a study that found that treatment with T3 (5 nM) decreased the expression of this pro-apoptotic factor and others such as caspases 7 and 9, Bax, Pmaip1, and Apaf1 and increased the expression of anti-apoptotic factors such as Bcl2l2 and Bag1 in a culture of cortical neurons of mice subjected to a hypoxic environment (0.2% O2) (Li et al., 2019). This similarity to the research in question may be related to the occurrence of a hypoxic microenvironment in pellets formed during chondrogenic differentiation. However, these are different cell types and different concentrations of T3, which may have influenced the observed response discrepancy.
A surprising finding regarding the expression of the protein caspase-3 is that concentrations of 0.01 and 100nM of T3 did not influence this expression, so something related to the internal environment such as apoptosis inhibitor proteins (APs), which are the only molecules capable of inhibiting the activity of fetor caspases such as caspases 3 and 7 (Deveraux e Reed, 1999), may be interfering in the expression and consequently not allowing the action of this T3 concentration. Another possible consideration, which may partly explain this finding, is the expression profile of hormonal mechanisms using dose-response kinetics where small concentrations have effects opposite to large concentrations according to the inducing agent of this response, such as cell stress (Hayes, 2007).
In addition to evaluating the expression of pro- and anti-apoptotic factors in each cell type (BM-MSC and ASC), the protein expressions between these two cells were compared. Interestingly, the Bcl-xL expression was predominantly similar among the studied cells, Bax expression was higher in BM-MSC compared with ASC in most concentrations studied, except for 1000nM, and caspase-3 expression was higher in BM-MSC in all groups evaluated. In view of these results, note that the cultivation conditions and T3 concentrations used were the same for both cell types. Moreover, with these results BM-MSC may be more prone to apoptosis at the end of the chondrogenic differentiation, compared with ASC, since bone marrow cells had higher expression of pro-apoptotic proteins. And this may be related to the activation of several factors, which have not yet been elucidated, related to apoptosis in BM-MSC and not activation in ASC.
The T3 is distinctly influenced by the immunoexpression of anti- and pro-apoptotic markers in BM-MSC and ASC subjected to chondrogenic differentiation. Thus, this difference in response may be one of the mechanisms that may explain the different effects of T3 during the chondrogenic differentiation of MSC from bone marrow and adipose tissue studied previously. In this context, studies demonstrated that TH increases the potential for in vitro chondrogenic differentiation of BM-MSC from rats (Assis et al., 2018). However, TH does not influence the chondrogenic differentiation of ASC of this animal species (Elert et al., 2022). Since the cultivation conditions were the same for both cell types, T3 influence in BM-MSC during the chondrogenic differentiation should be considered, and also note that this is a first experiment and that further studies are needed to verify other factors involved. Thus, apoptosis may favor the better chondrogenic differentiation of BM-MSC under the effect of T3 compared with ASC.
In this context, in vitro, cellular stress triggers the apoptosis process (Mosser et al., 2000) and this can result in mitochondrial dysfunction, such as DNA injury, pH reduction, oxidative stress, and growth factor deprivation, with translocation of pro-apoptotic proteins (Parolin e Reason, 2001) or result in cellular defense response, preventing the release of cytochrome c and the processing of pro-caspases 3 and 9 (Mosser et al., 2000).However, this is only one hypothesis, since no other factors were valid in this study, besides the expression of Bcl-xL, Bax, and caspase-3.
Another assumption about the difference in expression between bone marrow and adipose tissue MSC is about a possible variation between the number of receptors for TH, in the activation of these receptors or in the cell uptake between the different cell types. What is known is that thyroid hormones act on target cells by binding to their nuclear receptors (TRs) and, when activated, are the gene transcription factors that potentiate the promoter regions of target genes and interact with the complexes of co-repressors and coactivators. The binding of the complex to a promoter region of the target gene may increase or suppress the expression of this gene (Guterman et al., 2014). In the absence of T3, TRs suppress the expression of target genes by interacting with transcriptional co-repressors, such as SMRT, (silencing mediator of retinoic acid and thyroid receptors) (Darras et al., 2015). Thus, studying the T3 receptors in CSM, both bone marrow and adipose tissue, could answer this hypothesis in the future.
Regarding the T3 flow in the target cells, cell uptake, via plasma membrane, happens by processes mediated by transporters and may vary between cells of different origins. For example, in erythrocytes and rat hepatocytes, T3 transporters were identified as proteins with molecular masses of 52 and 55kDa, whereas in other cells, such as mouse astrocytes, T3 uptake seems to be widely mediated by L or T amino acid transport systems (Henneman et al., 2001).
From the results obtained, the effect of triiodothyronine may vary according to the stem cell source. These effects of T3 treatment on in vitro chondrogenic differentiation could be related to variations in the number of receptors for this hormone, but this study did not evaluate that. Hormones produce non-monotonic responses, that is, have a nonlinear relationship between dose and effect, this may be related to the cell type, with the presence of specific receptors and cofactors, location of the receptors, regulation and desensitization of the receptor, and affinity to the receptor. At low doses, some hormones bind almost exclusively to a type of receptor, but at high doses they can also weakly bind to multiple hormone receptors (Vandenberg et al., 2012).
The results of this study are unprecedented and provide relevant information regarding the influence of TH on the expression of pro- and anti-apoptotic factors. In the present study, it is believed that no limitations were found due to the experimental model used, since rats, within the limits of each species, are widely used experimental models. The results found also brought perspectives for further research to verify the route by which T3 influences the expression of these factors, such as checking whether transporters and receptors for thyroid hormones vary, verifying the signaling pathways that are activated or not in CSM during chondrogenic differentiation and with treatment with T3. Moreover, note that the expression of Bcl-xL, Bax, and caspase-3 proteins individually was evaluated, using the immunohistochemistry technique, and the predominance of one marker over the other was not evidenced, which could be observed in the future.
CONCLUSION
In conclusion, T3 influences differently the immunoexpression of anti- and pro-apoptotic markers in BM-MSC and ASC subjected to chondrogenic differentiation; T3 reduces the expression of the anti-apoptotic protein Bcl-xL in BM-MSC and increases it in ASC subjected to in vitro chondrogenic differentiation; T3 increases the expression of the pro-apoptotic protein Bax, both in BM-MSC and ASC, subjected to in vitro chondrogenic differentiation; T3 reduces the expression of the pro-apoptotic protein caspase-3 in ASC subjected to chondrogenic differentiation in vitro, but does not alter the expression of caspase-3 in BM-MSC. The expression of Bcl-xL, Bax, and caspase-3 is significantly higher in BM-MSC compared to ASC subjected to chondrogenic differentiation without T3. The expression of Bax and caspase-3 is significantly higher in BM-MSC compared to ASC subjected to chondrogenic differentiation with T3.
REFERENCES
- ASSIS, H.A.; ELERT, N.C.; AZEVEDO, A.L.B.P. et al. Dose-dependent effect of triiodothyronine on the chondrogenic differentiation of mesenchymal stem cells from the bone marrow of female rats. J. Pharm. Pharmacol., v.70, p.89-100, 2018.
- BAKOS, B.; TAKACS, I.; STERN, P.H.; LAKATOS, P. Skeletal effects of thyroid hormones. Clin. Rev. Bone Miner. Metab., v.16, p.57-66, 2018.
- BASSET, D.J.H.; WILLIAMS, G.R. Role of thyroid hormones in skeletal development and bone maintenance. Endocrinol. Rev., v.37, p.135-187, 2016.
- BOELONI, J.N.; OCARINO, N.M.; GOES, A.M.; SERAKIDES, R. Triiodotironina não aumenta a diferenciação osteogênica reduzida pela idade de células tronco mesenquimais da medula óssea de ratas. Arq. Bras. Endocrinol. Metab., v.57, p.62-70, 2013.
- BURCH, W.M.; LEBOVVITZ, H.E. Triiodothyronine stimulation of in vitro growth and maturation of embryonic chick cartilage. Endocrinology, v.111, p.462-468, 1982.
- CHI, H.C.; CHEN, S.L.; LIAO, C.J. et al. Thyroid hormone receptors promote metastasis of human hepatoma cells via regulation of TRAIL. Cell Death Differ., v.19, p.1802-1814, 2012.
- COHEN, G.M. Caspases: the executioners of apoptosis. Biochem. J., v.326, p.1-16, 1997.
- CROMBRUGGHE, B.; LEFEBVRE, V.; NAKASHIMA, K. Regulatory mechanisms in the pathways of cartilage and bone formation. Curr. Opin. Cell Biol., v.13, p.721-727, 2001.
- DARRAS, V.M.; HOUBRECHTS, A.M.; HERCK, S.L.J.V. Intracellular TH metabolism as a local regulator of nuclear thyroid hormone receptor-mediated impact on vertebrate development. Biochim. Biophys. Acta, v.1849, p.130-141, 2015.
- DEVERAUX, Q.L.; REED, J.C. IAP family proteins-suppressors of apoptosis. Genes Dev., v.13, p.239-252, 1999.
- ELERT, N.C.; ASSIS, H.A.; ROMÃO, L.P. et al. Triiodothyronine does not influence in vitro chondrogenic differentiation of adipose tissue-derived stem cells from young female rat. Ciênc. Rural, v.52, p.e20210509, 2022.
- FALZACAPPA, C.V.; PANACCHIA, L.; BUCCI, B. et al. 3,5,3´-Triiodothyronine (T3) is a survival factor for pancreatic β-cells undergoing apoptosis. J. Cell Physiol., v.206, p.309-321, 2006.
- GIBSON, G.; LIN, D.L.; ROQUE, M. Apoptosis of terminally differentiated chondrocytes in culture. Exp. Cell Res., v.233, p.372-382, 1997.
- GOLDRING, M.B.; TSUCHIMOCHI, K.; IJIRI, K. The control of chondrogenesis. J. Cell Biochem., v.1, p.33-44, 2006.
- GUTERMAN, P.D.; MARTIN, L.N.; TRUDEAU, V.L. Mechanisms of crosstalk between endocrine systems: regulation of sex steroid hormone synthesis and action by thyroid hormones. Gen. Comp. Endocrinol., v.203, p.69-85, 2014.
- HAYES, D.P. Nutritional hormonesis. Eur. J. Clin. Nutr., v.61, p.147-159, 2007.
- HENNEMAN, G.; DOCTER, R.; FRIESEMA, E.C.H. et al. Plasma membrane transport of thyroid hormones and its role in thyroid hormone metabolism and bioavailability. Endocrinol. Rev., v.22, p.451-476, 2001.
- HILLARBY, M.C.; KING, K.E.; BRADY, G. et al. Localization of gene expression during endochondral ossification. Ann. N. Y. Acad. Sci., v.785, p.263-266, 1996.
- HOANG, D.M.; PHAM, P.T.; BACH, T.Q. et al. Stem cell-based therapy for human diseases. J. Recept. Signal Transduct., v.7, p.1-41, 2022.
- ISHIDA, H.; BELLOWS, C.G.; AUBIN, J.E.; HEERSCHE, J.N.M. Tri-iodothyronine (T3) and dexamethasone interact to modulate osteoprogenitor cell differentiation in fetal rat calvaria cell cultures. Bone, v.16, p.545-549, 1995.
- KANGARI, P.; TALAEE-KHOZANI, T.; RAZEGHIAN-JAHROMI, I.; RAZMKHAH, M. Mesenchymal stem cells: amazing remedies for bone and cartilage defects. Stem Cell Res. Ther., v.11, p.1-21, 2020.
- KERR, J.F.R.; WYLLIE, A.H.; DURRIE, A.R. Apoptosis: a basic biological phenomenon with wide ranging implications in tissue kinetics. Br. J. Cancer, v.26, p.239-257, 1972.
- KIESS, W.; GALLAHER, B. Hormonal control of programmed cell death/apoptosis. Eur. J. Endocrinol., v.138, p.482-491, 1998.
- LI, J.; ABE, K.; MILANESI, A. et al. Thyroid hormone protects primary cortical neurons exposed to hypoxia by reducing DNA methylation and apoptosis. Endocrinology, v.60, p.2243-2256, 2019.
- MACKIE, E.J.; TATARCZUCH, L.; MIRAMS, M. The skeleton: a multi-functional complex organ: the growth plate chondrocyte and endochondral ossification. J. Endocrinol., v.211, p.109-121, 2011.
- MARTI, A.; GRABER, H.; LAZAR, H. et al. Caspases: decoders of apoptotic signals during mammary involution. Caspase activation during involution. Adv. Exp. Med. Biol., v.480, p.195-201, 2002.
- MIURA, M.; TANAKA, K.; KOMATSU, Y. et al. Thyroid hormones promote chondrocyte differentiation in mouse ATDC5 cells and stimulate endochondral ossification in fetal mouse tibias through iodothyronine deiodinases in the growth plate. J. Bone Miner. Res., v.17, p.443-454, 2002.
- MOSSER, D.D.; CARON, A.W.; BOURGET, L. et al. The chaperone function of hsp70 is required for protection against stress-induced apoptosis. Mol. Cell Biol., v.20, p.7146-7159, 2000.
- NILSSON, O.; MARINO, R.; LUCA, F. et al. Endocrine regulation of the growth plate. Horm. Res., v.64, p.157-165, 2005.
- PAROLIN, M.B.; REASON, I.J.M. Apoptose como mecanismo de lesão nas doenças hepatobiliares. Arq. Gastroenterol., v.38, p.138-144, 2001.
- PUCCI, B.; ADAMS, C.S.; FERTALA. et al. Development of the terminally differentiated state sensitizes epiphyseal chondrocytes to apoptosis through caspase-3 activation. J. Cell Physiol., v.210, p.609-615, 2007.
- ROBSOM, H.; SIEBLER, T.; STEVENS, D.A. et al. Thyroid hormone acts directly on growth plate chondrocytes to promote hypertrophic differentiation and inhibit clonal expansion and cell proliferation. Endocrinology, v.141, p.3887-3897, 2000.
- SHAPIRO, I.M.; LAYFIELD, R.; LOTZ, M. et al. Boning up on autophagy: the role of autophagy in skeletal biology. Autophagy, v.10, p.7-19, 2014.
- SINGH, R.; UPADHYAY, G.; KUMAR, S. et al. Hypothyroidism alters the expression of Bcl-2 family genes to induce enhanced apoptosis in the developing cerebellum. J. Endocrinol., v.176, p.39-46, 2003.
- SU, Y.; SHI, Y.; STOLOW, M.A.; SHI, Y.B. Thyroid hormone induces apoptosis in primary cell cultures of tadpole intestine: cell type specificity and effects of extracellular matrix. J. Cell Biol., v.139, p.1533-1543, 1997.
- VANDENBERG, L.N.; COLBORN, T.; HAYES, T.B. et al. Hormones and endocrine-disrupting chemicals: low-dose effects and nonmonotonic dose responses. Endocrinol. Rev., v.33, p.378-455, 2012.
- VARGHESE, F.; BUKHARI, A.B.; MALHOTRA, R.A. IHC profiler: an open source plugin for the quantitative evaluation and automated scoring of immunohistochemistry images of human tissue samples. PLoS One, v.9, p.e96801, 2014.
- VERMEULEN, K.; BERNEMAN, Z.N.; BOCKSTAELE, D.R.V. Cell cycle and apoptosis. Cell Prolif., v.36, p.165-175, 2003.
- WANG, C.; CHEN, L.; KUO, P. et al. Apoptosis in chondrogenesis of human mesenchymal stem cells: effect of serum and medium supplements. Apoptosis, v.15, p.439-449, 2010.
- WAUNG, J.A.; BASSETT, D.J.H.; WILLIAMS, G.R. Thyroid hormone metabolism in skeletal development and adult bone maintenance. Trends Endocrinol. Metab., v.23, p.155-162, 2012.


 Marking score:A; C: Positive. B, D, F, G, H, J: Weak Positive. I: Negative. The control group showed higher protein expression of Bcl-xL in BM-MSC compared with groups at T3 concentrations of 0.01, 1, and 100nM and the concentration of 1000nM also showed higher expression compared with the groups at concentrations of 1 and 100nM of T3. In ASC, the concentration of 0.01nM of T3 showed a significantly higher protein expression of Bcl-xL compared with the control group and the other concentrations (1,100, and 1,000nM of T3).

 Marking score: A, E, G, I, J: Positive. B, C, D, F, H: Negative. The protein expression of Bax in BM-MSC was significantly higher at concentrations of 0.01nM and 100nM of T3 compared with the control group. The concentration of 0.01nM of T3 was higher when compared with that of 1,000nM in ASC, Bax protein expression was significantly higher at the concentration of 1,000nM of T3 when compared with the control group and the other concentrations.

