
 Comparative analysis of neighborhood satisfaction based on income: application of the Kano model in a case study in the state of Paraná
Abstract
This study analyzes differences in the classification of neighborhood attributes based on individuals’ perceptions of satisfaction and dissatisfaction, proposing a non-linear classification method inspired by the Kano model. Increasing urbanization demands a better understanding of residents’ needs, with neighborhood satisfaction serving as an important indicator of urban quality of life. The methodology included a questionnaire with 50 urban variables, covering social aspects, services, transportation, and the physical environment, using a Likert scale. The sample consisted of 283 responses from residents of Paraná, focusing on a comparative analysis between the low- and high-income extremes of the sample. The study used multivariate analyses to calculate satisfaction/dissatisfaction with the neighborhood. The results highlighted variables such as safety and public spaces as essential for both groups but revealed significant differences in expectations between these two distinct income strata. While ease of mobility was considered attractive to the high-income group, it was viewed as one-dimensional by the low-income group. The research shows that urban priorities are shaped by socioeconomic conditions, helping guide public policies that better address residents' needs and improve urban quality.
Keywords
Resudential satisfaction; Kano model; Quality of life; Urban environment; Income inequality
Resumo
Este estudo analisa as diferenças na classificação dos atributos do bairro com base na percepção de satisfação e insatisfação dos indivíduos, propondo um método de classificação não linear inspirado no modelo Kano. A crescente urbanização exige uma melhor compreensão das necessidades dos moradores, sendo a satisfação com o bairro um importante indicador da qualidade de vida urbana. A metodologia incluiu um questionário com 50 variáveis urbanas, abrangendo aspectos sociais, serviços, transporte e ambiente físico, utilizando uma escala Likert. A amostra foi composta por 283 respostas de moradores do Paraná, focando em uma análise comparativa entre os extremos de baixa e alta renda da amostra. O estudo utilizou análises multivariadas para calcular a satisfação/insatisfação com o bairro. Os resultados destacaram variáveis como segurança e espaços públicos como essenciais para ambos os grupos, mas revelaram diferenças significativas nas expectativas entre esses dois estratos distintos de renda. Enquanto a facilidade de mobilidade foi considerada atrativa para o grupo de alta renda, foi vista como unidimensional pelo grupo de baixa renda. A pesquisa mostra que as prioridades urbanas são influenciadas pelas condições socioeconômicas, contribuindo para orientar políticas públicas que atendam melhor às necessidades dos moradores e melhorem a qualidade urbana.
Palavras-chave
Satisfação residencial; Modelo de Kano; Qualidade de vida; Meio urbano; Desigualdade de renda
1 Introduction
On a global scale, cities face various challenges related to the quality of life of their inhabitants, with problems spanning social, environmental, economic, and infrastructure aspects (El Din et al., 2013). In this sense, neighborhood satisfaction, as a reflection of the quality of the urban environment, can be a critical indicator for understanding well-being. Neighborhood satisfaction can be understood as an important component of quality of life, acting as a mediator between the physical-social environment and individual well-being. It is recognized as a tool for measuring environmental quality (Mridha, 2023; Esperidião, 2025), since, given how residents interpret and experience their surroundings, it is essential to determine their level of satisfaction (Ferreira, 2016; Ciorici; Dantzler, 2018).
It is observed that studies on satisfaction have increased in recent years, influenced by various characteristics: social, cultural, contextual, and geographical (Aigbavboa; Thwala, 2018; Emami; Sadeghlou, 2021; Ramos-Esperidião et al., 2024). However, the factors determining satisfaction are not well defined and are frequently discussed through multidisciplinary approaches (Fontolan et al., 2024).
In general, the literature on neighborhood satisfaction assumes a linear relationship among variables, meaning that all variables would have the same degree of influence on an individual’s satisfaction and dissatisfaction. Nevertheless, recent research has indicated that such relationships are not linear (Yin et al., 2016; Dong et al., 2019; Cao et al., 2020). In this regard, various methods have been applied to understand where improvement efforts should be directed in products and services, based on satisfaction (Matzler; Sauerwein; Heischmidt, 2003; Mikulić; Prebežac, 2008). However, few studies have explored such analyses in urban studies (Esperidião, 2025).
Yin et al. (2016) presented a pioneering study on the application of importance-performance analysis and the conceptualization of an importance grid for urban environment characteristics. By considering the performance and importance of attributes, the method used allowed for the identification of priorities for the improvement of different neighborhoods. Also in China, Cao et al. (2020) analyzed the nonlinear relationships between neighborhood satisfaction and urban environment attributes, employing impact asymmetry analysis. The results demonstrated that most characteristics had asymmetric influences on satisfaction; that is, the attributes did not influence satisfaction and dissatisfaction in the same way, which implies a hierarchy of importance among neighborhood attributes in generating satisfaction.
Although most studies have adopted a linear approach to explore neighborhood satisfaction, recent research has presented a nonlinear approach (Yin et al., 2016; Dong et al., 2019; Cao et al., 2020). The study by Yin et al. (2016) used IPA and the Three-Factor Theory to classify neighborhood characteristics as basic performance factors. Sidewalk maintenance, low neighborhood traffic, good street lighting, and safe recreational areas for children were identified as priorities for improvement. Additionally, the following were identified as basic factors: low crime rates, good public transportation systems, and proximity to parks and open spaces. The study demonstrated that the variables do not exhibit linear behavior when urban environment variables are analyzed, indicating that improvement priorities must be identified.
Therefore, there is a need to explore which aspects are truly capable of generating satisfaction in individuals, which are basic, and which generate dissatisfaction. For if an aspect exists in the neighborhood, it does not necessarily generate satisfaction, and its absence does not necessarily generate dissatisfaction. Similarly, the absence of an aspect does not necessarily cause dissatisfaction. This knowledge can be useful for formulating urban public policies that are in line with individuals’ needs.
Thus, the objective of this study was to analyze differences in the ranking of neighborhood attributes by applying an innovative nonlinear method, originally proposed in this study and based on Kano’s model (Kano et al., 1984). Based on the construction of a measure of satisfaction/dissatisfaction with the neighborhood, a questionnaire comprising 50 variables, using a 7-point Likert scale, was administered to a sample of 283 residents of the state of Paraná. The data were stratified by income focusing on a comparative analysis between the low- and high-income extremes of the sample, allowing for comparative analyses between socioeconomic groups. This approach enabled the identification of variations in perceptions of urban attributes among the analyzed strata, contributing to a more sensitive and refined analytical tool for assessing urban quality of life.
2 Conceptual-methodological foundation
Satisfaction is a concept explored in various fields of study, serving as a means of evaluating products or services in areas such as tourism, marketing, and health (Aigbavboa; Thwala, 2018). Kano et al. (1984), for example, introduced one of the most widely used quality models in the literature by moving away from the linear approach to the impact of product and service performance on customer satisfaction (Mikulić; Prebežac, 2011). The theory of attractive quality, or Kano model, is a quality management method that allows one to visualize, through a graph, how different attributes of a product or service affect customer satisfaction, based on a non-linear assumption. The proposed methodology uses a structured questionnaire consisting of pairs of questions (functional and dysfunctional questions). One question asks about the consumer’s feelings in the case of an attribute being met (“functional”), and the other asks about feelings in the case of an attribute not being met (“dysfunctional”). The data are analyzed using an evaluation table that results in the categorization of attributes for each respondent, and the frequencies of these categorizations are used to determine the final classification of the perceived quality of an attribute (Dace; Stibe; Timma, 2020). Originally, the attributes were classified as: must-be quality, one-dimensional quality, attractive quality, indifferent quality, and reverse quality, as shown in Figure 1.
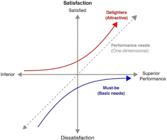
Conceptual representation of the Kano model developed by the authors based on Kano et al. (1984)
Although it identifies non-linear relationships, the Kano model deals with objective attributes; therefore, performance analyses may be somewhat unreliable when evaluating different attributes (Mikulić; Prebežac, 2011). In other words, the method does not take into account the current level of performance of the attributes. In an effort to improve the original methodology, some authors have modified the wording of the questions as well as the categories or subcategories (Mikulić; Prebežac, 2011).
It is therefore understood that analyzing the model in isolation is not sufficient for precise decision-making, making it necessary to apply it in conjunction with other techniques for a better interpretation of how each attribute affects satisfaction (Camargos Neto, 2021). Multimethod studies provide greater credibility to research, as reliability can be assessed through the convergence—or lack thereof—of results, and the strength of one method can compensate for the limitations of another (Brewer; Hunter, 2006).
According to Mikulić and Prebežac (2011), the Kano model is useful in the product or service design phase because it facilitates the categorization of existing and non-existing attributes according to their potential to generate satisfaction or dissatisfaction. However, a reasonable level of performance of the analyzed attributes must be assumed. Finally, it is worth noting that one of the limitations of the method is that it does not reveal the relative importance of various attributes in the overall evaluation of the product or service (Mikulić; Prebežac, 2011).
Other approaches have emerged using the categorization proposed by the Kano model, such as Penalty-Reward Contrast Analysis (PRCA). Brandt (1987) introduced this method, which identifies the contrast between the influence of low performance (penalty) and high (reward) of the attribute on overall satisfaction through recoding with dummy variables. The technique was developed to identify attributes related to transportation services, but it has been widely adopted in various fields to classify attributes using Kano’s categorization (Mikulić; Prebežac, 2011). Using a multiple regression equation, PRCA identifies four types of factors: basic, attractive, one-dimensional, and neutral, offering a detailed view of how each attribute impacts satisfaction (Picolo; Tontini, 2008).
Residents’ satisfaction with their neighborhood involves both affective and cognitive elements (Bonaiuto et al., 2004). This means that individuals do not merely rationally evaluate the physical and service attributes of their neighborhood but also develop feelings and emotional attachments to their place of residence. When residents are satisfied with their neighbors and the physical environment of their neighborhood, they tend to exhibit greater emotional well-being, higher community involvement, and a more positive perception of their quality of life (Hur; Morrow‐Jones, 2008; Colin; Pelicioni, 2018).
Studies assessing satisfaction with the urban environment involve distinct and complex variables, such as sociodemographic characteristics (Aigbavboa; Thwala, 2018; Esperidião et al., 2024), local services and green spaces (Mouratidis, 2018), safety regarding crime, public spaces, appearance, and accessibility (Lee et al., 2017; Mouratidis, 2018; Emami; Sadeghlou, 2021). Research has indicated that neighborhood satisfaction is closely related to residential satisfaction, as individuals seek to have their daily needs met in the neighborhood where they live (Esperidião et al., 2024). The literature also suggests a close relationship between neighborhood satisfaction and individuals’ overall quality of life (Bonaiuto et al., 2004; Gifford; Sussman, 2012; Lee, 2021). Lee, Newman, and Day (2024) noted that the neighborhood environment, including its sociodemographic composition and the social processes that occur there, plays an important role in shaping residents’ perceptions and, consequently, in their quality of life. Therefore, residents’ perceptions of the quality of life in the neighborhood are a determining factor in their overall satisfaction.
Studies have shown that residents who perceive their neighborhood as safe, clean, and well-maintained tend to report higher levels of satisfaction (Hur; Morrow-Jones, 2008). On the other hand, socially vulnerable communities, which exhibit high tolerance but low resilience to neighborhood problems, experience greater impacts on their perceptions and satisfaction, requiring greater attention—especially toward improving the social environment (Lee; Newman; Day, 2024). There is a distinction between the neighborhood environment measured objectively and the environment perceived by residents. This subjective perception appears to carry greater weight in determining residential satisfaction (Orstad et al., 2017; Lee et al., 2017).
Dong et al. (2023) investigated the factors influencing residents’ satisfaction across six old neighborhoods in Harbin, China. Using a mixed-methods approach, the study combined grounded theory with factor analysis and Impact Asymmetry Analysis (IAA). The variables covered a broad set of neighborhood attributes, including infrastructure, activity spaces, property management, neighborhood facilities, and the social environment. The findings showed that most neighborhood factors have non-linear associations with satisfaction, challenging the linear assumption commonly adopted in literature. The linear assumption suggests that as a neighborhood attribute improves, residents’ satisfaction increases proportionally. However, the study provided evidence that this relationship is often non-linear. For example, housing infrastructure and utility quality were found to have a non-linear relationship with satisfaction: a certain baseline level is necessary to meet residents’ expectations, but beyond a certain threshold, further improvements do not significantly increase satisfaction. The study also acknowledges some limitations, particularly its focus on a single location, which may restrict the generalizability of the findings to other contexts.
Individual factors such as sociodemographic characteristics also influence residents’ perceptions and satisfaction, such that different groups may value certain neighborhood characteristics differently (Parkes; Kearns; Atkinson, 2002; Greif, 2015). Therefore, the relationship between perception and satisfaction is complex, involving both objective neighborhood characteristics and the way residents subjectively interpret and evaluate their residential environment. The literature briefly presented here indicates that investigating the urban environment using product and service quality tools is valid and can offer new insights for urban planning.
3 Methods
The research strategy of this study aimed to analyze differences in the classification of neighborhood attributes based on residents’ levels of satisfaction and dissatisfaction. An inductive approach was adopted, starting from the observation of specific phenomena to formulate general conclusions. The investigation was grounded in the Survey method and the Kano model. The Survey method enabled systematic data collection, while the Kano model allowed for the creation of a method to classify neighborhood characteristics into five categories: mandatory, one-dimensional, attractive, indifferent, and reverse (Kano et al., 1984).
The literature review allowed for the identification of the most relevant variables related to neighborhood satisfaction, as presented by Esperidião (2025). Thus, the selected variables were divided into three main constructs: satisfaction/dissatisfaction with the neighborhood, neighborhood characteristics and the sociodemographic profile of the participants.
The variables related to neighborhood characteristics were divided into five groups: Social Environment (SE), Service Provision (SP), Transportation and Circulation (TC), Environmental Aspects (EA) and Physical Environment (PE), as presented in Table 1, totaling 50 variables studied.
Participant satisfaction was assessed using the following question: “How satisfied/dissatisfied are you with the following aspects: Social Environment (SE), Service Provision (SP), Transportation and Mobility (TM), Environmental Aspects (EA) and Physical Environment (PE)?”, using a satisfaction/dissatisfaction scale. To apply the approach proposed by Kano et al. (1984), the questions were posed in both functional (“How satisfied are you…?”) and dysfunctional (“How dissatisfied are you…?”) forms.
Perceptions regarding neighborhood attributes were investigated with the question: “Do you agree that the following aspects exist in your neighborhood?”, on an agreement scale ranging from “strongly disagree” to “strongly agree.”
The sociodemographic profile allowed for the stratification of the data, which consists of dividing the sample into subgroups that share a certain degree of homogeneity regarding one or more factors. In this study, stratification by income into three subgroups was used; however, the analyses were conducted between the lowest-income and highest-income groups.
Participants were recruited through a non-probability, convenience sampling strategy. The invitation to participate was distributed via institutional emails and digital social networks (such as WhatsApp, LinkedIn, and Instagram), utilizing a snowballing technique where initial participants forwarded the link to their networks. The target population consisted of Brazilians over 18 years of age who had resided in the same location for more than one year. The data collection was conducted online through Google Forms. To mitigate data transmission fears and ensure psychological safety regarding sensitive demographic metrics, the landing page prominently displayed the Research Ethics Committee (CEP) approval code from the Federal University of Technology – Paraná (UTFPR), Curitiba Campus (CAAE 54527421.5.0000.5547 on 10 March 2022). It explicitly stated that the questionnaire was completely anonymous, no personal identifying data (such as names, IPs, or emails) would be logged, and answering was entirely voluntary
Upon completing all stages of the survey method planning, the data collection process was initiated. Responses were gathered online via Google Forms across three periods: between May and August 2022, May and September 2023, and from October 2024 to January 2025. Participants were invited through social media and email, and answering the questions was entirely voluntary. The collected data were analyzed using R software and Statistical Package for the Social Sciences (SPSS), version 24. The data analysis consisted of the following steps:
-
development of a measure of satisfaction/dissatisfaction with the neighborhood;
-
stratification of the data by income;
-
multivariate correlation analyses between neighborhood characteristics and the measure of satisfaction/dissatisfaction with the neighborhood, using the stratified data;
-
linear normalization of the correlation results;
-
development of a classification diagram based on the Kano model; and
-
comparative analysis of classification variation across the analyzed strata.
The detailed methodology and its stages are described in Esperidião (2025).
Initially, a dimensionality analysis was performed on responses related to satisfaction and dissatisfaction with the neighborhood to develop the measure. The measurement of perceptions regarding neighborhood attributes was conducted using a questionnaire grounded in Item Response Theory (IRT), which bases its analyses on the total test score and depends on the sample of items and respondents; IRT focuses on the properties of each item individually. This approach allows for the creation of invariant measurement scales, where satisfaction estimates (latent trait) do not depend exclusively on the specific set of items administered.
To construct the satisfaction measure, the Gradual Response Model (GRM) was adopted, originally proposed by Samejima (1969). This model is an extension of IRT for items with ordered response categories, making it the most appropriate for the 7-point Likert-type scales used in this study. The GRM assumes that the items are unidimensional, that is, that the responses are explained by a single dominant latent trait (in this case, satisfaction with the neighborhood), and that there is local independence among the items. The analysis followed the methodological procedures detailed by Andrade, Tavares and Valle (2000), using the marginal maximum likelihood function to estimate the discrimination (a) and difficulty (b) parameters of the items.
The data were stratified according to gross family income based on the national minimum wage during the initial data collection period (2022), which was R$ 1,212.00. The following subgroups were analyzed: “low income” (up to R$ 4,848.00, corresponding to up to 4 minimum wages) and “high income” (above R$ 12,120.00, corresponding to more than 10 minimum wages). For each sample stratum, correlations were calculated between neighborhood characteristics and measures of satisfaction and dissatisfaction with the neighborhood. Spearman’s correlation coefficient, appropriate for nonparametric data, was used to describe the mutual relationship between two variables. The relationships can be positive (coefficient +1), negative (coefficient -1), or no relationship (coefficient 0). The significant correlations used in the study were those with significance levels of 5% and 1%. The correlation results were linearly normalized to ensure that all values fall within the same scale range, thereby avoiding disproportionalities in the data. Linear normalization (or Min-Max normalization) uses the following formula: X' = (X - Xmin) / (Xmax- Xmin), where X is the original value, Xmin is the minimum value of the characteristic, and Xmax is the maximum value.
With the normalized results, it was possible to create diagrams based on the Kano model for classifying the neighborhood’s attributes. The X-axis represented the dissatisfaction coefficients, while the Y-axis was used for the satisfaction coefficients.
The theory of attractive quality, or Kano model, proposes a methodology for describing the relationship between performance and satisfaction with an attribute. Based on the reference studies, the variables were classified into four quadrants (Yin et al., 2016):
-
basic factors: do not increase satisfaction if expectations are met, but cause dissatisfaction if they are absent;
-
attractive factors: do not cause dissatisfaction if they are not met, but increase satisfaction if they exist;
-
unidimensional (performance) factors: have a symmetrical impact on satisfaction and dissatisfaction, depending on whether they are met or not; and
-
neutral factors: have little importance for performance.
Finally, a comparative analysis of the variation in the classification of neighborhood attributes across the analyzed sample strata was conducted to identify differences between the two subgroups in relation to income.
4 Analysis of results
4.1 Sample profile
The sample was characterized using 13 variables, such as city size, neighborhood type, gender, marital status, and gross family income, among others. A total of 360 responses were collected, and the data were randomly stratified, with the initial criterion being to eliminate results with more blank responses, since no response was mandatory. Questionnaires with 95% of the responses filled out (116 out of 122 questions) were considered valid.
Although the questionnaire was made available throughout Brazil, there was a pattern of responses from the Southern region, with a predominance in the state of Paraná; therefore, the sample was limited to that state. Thus, the sample consisted of 283 valid responses.
Thus, regarding the characteristics of the respondents, it was observed that the predominant profile consists of young adults aged 25 to 39 (58.7%), with a college degree or higher (63.6%), who are single (47.3%) and childless (55.5%), with an average household income between R$ 4,848.00 and R$ 12,120.00 (40.3%), as shown in Table 2. It can be inferred that the total sample represents a population that does not live in a situation of scarcity, that is, they have the financial means to seek more satisfactory living conditions.
For income stratification, the first stratum, termed “low income,” consisted of 93 respondents, defined as those with a gross family income of up to R$ 4,848.00. The second stratum analyzed was “high income,” consisting of 76 respondents, defined as those with a gross family income above R$ 12,120.00. We chose to analyze the extremes of the sample to obtain a clearer analysis of the differences based on income.
4.2 Statistical analyses
To develop the satisfaction/dissatisfaction measurement scale, it was necessary to verify the dimensions acting on the set of variables. Principal component analysis was applied using R software. According to Kaiser’s criterion, which considers only eigenvalues above 1 as dimensions, both satisfaction and dissatisfaction are unidimensional. Satisfaction had an eigenvalue of 3.4269 for component 1, explaining 68.54% of the variance. Dissatisfaction, on the other hand, had an eigenvalue of 3.0630, with 61.26% of the variance explained by a single component. Thus, a unidimensional polynomial Item response theory (IRT) model can be used to establish the scale for measuring satisfaction/dissatisfaction with the neighborhood. Subsequently, it was possible to establish the model parameters for the neighborhood satisfaction and dissatisfaction scales. To measure levels of satisfaction and dissatisfaction with the neighborhood, the study utilized Samejima’s (1969) Gradual Response Model, processed using the
Multidimensional Item Response Theory (MIRT) library in R software. Analysis of the parameters demonstrated that the model has high technical consistency, since the discrimination values (parameter "a") exceeded 1 on both scales, indicating that the items can accurately differentiate respondents’ profiles. Although the satisfaction model presented slightly higher discrimination indices, both models exhibited an adequate distribution of the "b" parameters, confirming a balanced progression in the intensity of the responses.
Furthermore, the analysis of the Information Curve and standard errors validated the measurement’s effectiveness, with the highest statistical precision concentrated in the range between -2 and +2 standard deviations. Since this interval covers 95.45% of the scale values, it can be concluded that the model is highly reliable and capable of providing robust data with low standard error for the vast majority of the surveyed sample.
According to the model, the satisfaction and dissatisfaction scales are derived from the values obtained when the mean was set to 4, and a standard deviation of 1.5 was applied to the score generated by the model. This adjustment was intended to establish a satisfaction/dissatisfaction scale with values approximating the seven-point Likert scale used in the evaluation of neighborhood attributes.
Using these values, Spearman’s correlation was applied to the values obtained from the questionnaire for each of the 50 neighborhood attributes analyzed, considering the total sample (N = 283). The correlations with dissatisfaction are all negative, while the correlations with satisfaction are all positive, as shown in Table 3. An asterisk (*) indicates significant correlations at the 0.01 level and two asterisks (**) at the 0.05 level.
4.3 Classification of attributes
Using the correlation values, graphs were plotted to classify the attributes according to the Kano model (Figures 2 and 3). The dissatisfaction scale values were plotted on the X-axis (horizontal), while the satisfaction values represent the Y-axis (vertical). The dotted lines indicate the midpoint of the values and allow for division into four quadrants, classified as: basic, attractive, one-dimensional, and neutral (Yin et al., 2016). Basic factors do not increase satisfaction if expectations are met, but cause dissatisfaction if they are not met; attractive factors do not cause dissatisfaction if they are not met, but increase satisfaction if they are met; unidimensional factors have a symmetrical impact on satisfaction and dissatisfaction, depending on whether they are met or not; finally, neutral factors have little importance for performance.


Of the 50 variables analyzed, only 17 had the same classification for both groups. Steeply sloping streets, distance to shops, pavement, and parking spaces were classified as neutral factors, meaning they have little influence. Six variables exhibit a linear relationship with satisfaction, meaning they are unidimensional. These are: safety regarding crime, concern for sustainability, public spaces, feeling part of the neighborhood, appearance, and stormwater drainage. Among the basic variables — that is, those that cause dissatisfaction if unmet but do not generate satisfaction — are: crime, risk of natural disasters, deforestation, and animals associated with trash. Three variables were classified as attractive, meaning they cause satisfaction but do not generate dissatisfaction if absent: ease of getting around the neighborhood, lighting, and garbage collection.
Regarding the differences found, four variables are unidimensional for the higher-income group but attractive for the lower-income group: green spaces (existence and as a place for socializing), number of trees, and parks. Cultural activities and bike paths, which are unidimensional for the higher-income group, are attractive to the lower-income group. Variables that are neutral for the lower-income group (recycling collection, accessibility for people with disabilities, distance to recreational areas, and accessible sidewalks) are considered attractive to the higher-income group. Ease of access to recreational areas and maintenance of public spaces, also attractive to higher-income groups, become one-dimensional for lower-income groups. Retail, shopping malls, and ease of access to retail are basic factors for lower-income groups and attractive to higher-income groups.
Ten variables were classified as neutral for high-income households: vandalism, distance to schools, and ease of reaching other locations (one-dimensional for low-income households); schools, supermarkets, support services, and not being isolated from the city (basic for low-income households); health clinics, distance to work, and public transportation (attractive for low-income households). Factors neutral for lower-income households (permanent preservation areas, pollution, and the absence of open sewers) were classified as basic for higher-income households.
Five unidimensional variables for lower-income groups were classified as basic for higher-income groups: safety for children to play, neighborhood privacy, potholes, litter on the streets, and investment potential. Finally, the relationship with neighbors is a basic factor for higher-income groups, while it is an attractive factor for lower-income groups.
Factors such as safety regarding crime and public spaces proved to be unidimensional for the groups, meaning they are essential for satisfaction. This points to the need for public policies that prioritize safety and the improvement of community spaces, especially in more vulnerable areas.
On the other hand, variables classified as neutral for low-income groups (recyclable waste collection and accessible sidewalks) are seen as attractive to high-income groups. This suggests a distinct perception of quality of life among the groups, where elements considered “standard” may be valued differently in lower-income contexts. This difference can lead to a cycle of marginalization, where the lack of basic infrastructure is normalized in low-income areas, while improvements are expected in more privileged areas.
Furthermore, the transition from variables that are one-dimensional in one group to attractive features in another—as in the case of green spaces and bike lanes—highlights the importance of considering social interaction and access to recreational spaces. For the high-income group, these characteristics are seen as an indicator of quality of life, while for the low-income group, they may represent an opportunity for socialization and well-being. Therefore, it is essential that urban policies integrate the creation of public spaces that foster social interaction, meeting the needs of all groups.
4.4 Discussion of results
The analyses revealed that several variables showed distinct classifications between the high- and low-income groups. The results indicated that the meaning of certain urban attributes can vary substantially depending on individuals’ socioeconomic context. Furthermore, the results suggested that recognizing urban attributes that behave differently across groups can guide initiatives that address both basic infrastructure in low-income areas and the creation of attractive spaces in high-income areas.
The results indicated that urban quality of life, measured by individuals’ satisfaction with the neighborhood in which they reside, can have significant implications for urban planning, given the differences among population strata. Urban environment attributes, such as safety, mobility, and service availability, influence quality of life in distinct ways among residents, playing diverse roles depending on the socioeconomic context of each group. It is understood that there is an importance in incorporating residents’ perceptions into the urban planning process, highlighting the need for public policies to take into account the expectations and needs of the local population.
The methodological application of the Kano Model adapted to the urban space grounded in the theoretical precepts of Kano et al. (1984) and the expansions by Matzler and Sauerwein (2002) for regression analysis with dummy variables, demystifies the premise that the continuous improvement of any infrastructure yields a linear and constant gain in citizens' perception of well-being. By demonstrating that attributes such as basic sanitation and environmental aspects operate as basic factors (Must-be), the study dialogues empirically with the findings of Mikulić and Prebežac (2011) on impact asymmetry, showing that these elements function as an indispensable regulatory baseline: their absence collapses satisfaction, but their technical expansion does not generate additional enchantment. This asynchronous behavior demands that urban planning break away from traditional metrics of a linear matrix, such as the classical models of Martilla and James (1977) on Importance-Performance Analysis (IPA), since the marginal return on resident satisfaction varies radically among groups of variables, rendering the saturation of investments in already consolidated areas an allocative inefficiency of public resources.
Deepening this dynamic through a socioeconomic lens, the discussion relies on the frameworks of Marans (2003), Marans and Stimson (2011) and Campbell (1976) regarding the subjectivity of urban quality of life (UQOL), revealing that "urban enchantment" is profoundly shaped by the privations and material capital of each stratum. In neighborhoods occupied by the low-income population, where mobility barriers and housing shortages are historical, the centrality of supply networks acts as a basic factor for subsistence, whereas social and community interaction variables, widely advocated by authors analyzing the Global South, such as Westaway (2006), emerge as the great attractive vectors of satisfaction. Conversely, as preconceived by the theories of segregation and residential preference of Sirgy et al. (2000), the high-income stratum channels its expectations toward the preservation of public safety as a non-negotiable premise, electing active mobility infrastructure and specialized leisure as factors of urban enchantment. By mapping these structural divergences through the analytical cross-referencing of these authors, the work provides the conceptual toolkit necessary to design targeted and spatially just public policies. Based on the operational behavior of the attributes categorized by the Kano model, specific guidelines for urban public policies can be established. For variables classified as unidimensional in both groups (such as public safety and the provision of public spaces), interventions must be continuous and universal, as these elements form the fundamental threshold of urban quality of life; their degradation directly compromises the evaluation of the neighborhood regardless of income.
Contrarily, for attributes whose behavior shifted between strata, distinct operational approaches are required. In low-income areas, variables like public health clinics, basic schools, and public transport shifted to attractive or basic factors, requiring targeted infrastructure delivery to mitigate historic urban deficits. Meanwhile, variables such as green areas, parks, and bike lanes—which represent attractive factors for low-income residents but unidimensional ones for high-income groups—should be planned in vulnerable areas as strategic induction tools. In these low-income neighborhoods, deploying quality public parks not only offers an opportunity for socialization but acts as an active vector for socio-spatial inclusion, elevating overall satisfaction more effectively than if implemented in areas where such infrastructure is already normalized. Regarding the innovative method, structured data collection considering both residents’ satisfaction and dissatisfaction with neighborhood attributes was fundamental to the development of the method—an approach not adopted in the reference studies used.
It should be noted that the division of neighborhood attributes into quadrants based on correlations between satisfaction and dissatisfaction, while useful for categorizing variables, should be interpreted with caution. As mentioned, the determination of the boundary between quadrants can lead to distortions, especially for variables located near the dividing lines. The classifications are more stable when the variables are distant from these boundaries, allowing for a clearer categorization. The presence of unidimensional factors in the graph, which demonstrated high correlations for both satisfaction and dissatisfaction, reflects the symmetry of these variables in relation to resident satisfaction, indicating that they are essential elements of urban quality of life.
These findings highlight the nonlinear classification proposed in this study, which not only contributes to a more detailed analysis of urban quality of life but also offers a tool for formulating public policies better suited to the specific needs of each socioeconomic stratum. The segmentation of variables into different categories can help make urban policies more targeted, prioritizing the attributes that most impact resident satisfaction across different income levels.
5 Conclusions
The results of this research reveal important distinctions in perceptions of urban quality among groups of different income brackets, highlighting the complexity of the relationship between neighborhood attributes and residents’ satisfaction. The application of the nonlinear classification method, developed in this study based on the Kano model, allowed for the classification of urban variables according to their correlations with satisfaction and dissatisfaction, generating an analysis that highlighted the specific needs of each socioeconomic stratum.
This research contributes to a deeper understanding of the dynamics that affect quality of life in cities, suggesting that interventions focused on improving the urban environment can directly influence residents’ satisfaction. In this regard, it is essential that public policymakers adopt a holistic approach that considers not only the objective aspects of the urban environment but also the subjective dimensions of citizens’ perceptions to promote neighborhoods that foster satisfaction as a core component of urban quality of life.
Although the results of this study provide a robust analysis of residents’ perceptions, several limitations must be acknowledged. First, the sample was restricted to residents of the state of Paraná, which may limit the generalizability of the findings to other regions of Brazil or to urban contexts with different socioeconomic characteristics. Furthermore, the nature of data collection, conducted via an online questionnaire, potentially introduced selection bias due to internet access and participant availability.
Two significant limitations regarding the sample profile must also be addressed. First, there is a pronounced socio-educational bias, as approximately 87% of the respondents hold at least a higher education degree; this overrepresentation limits generalizability, as highly educated individuals may interpret and demand different quality standards from the urban environment compared to the broader population. Second, economic stratification relied strictly on self-reported household income, which is susceptible to social desirability and non-disclosure biases despite anonymity guarantees.
Moreover, a critical limitation is the lack of geographical context regarding the specific urban areas that respondents inhabit or frequent. Even when controlling for socioeconomic strata and education levels, individuals’ perceptions of urban attributes are deeply rooted in their daily lived experiences within specific neighborhood typologies. By not accounting for these distinct urban environments, the study may overlook how the physical reality of different city contexts—such as varying levels of infrastructure, local amenities, or accessibility—shapes the divergent subjective evaluations provided by residents.
Lastly, while isolating the extreme income groups was a deliberate choice to capture polarized perceptions, this strategy reduced the active analytical sample to 169 respondents. Although non-parametric Spearman correlations are robust for smaller, unequal subgroups, the findings should be interpreted as exploratory trends rather than definitive regional generalizations.
Future research may further expand the analysis by incorporating a more comprehensive characterization of the urban contexts investigated, including physical and social indicators of the municipalities involved, such as population size, municipal Gross Domestic Product , education levels, health sector conditions, and the availability of public spaces and green areas. The integration of these contextual variables may enhance the interpretation of residents’ perceptions and strengthen the applicability of the findings to urban planning processes and public policy development.
Finally, the proposed innovative method represents a significant methodological contribution; however, its application was limited to the specific context of this study. Therefore, it is essential that this method be applied in other urban contexts and among different social groups to validate its effectiveness and verify whether the results can be replicated. Application in varied contexts will provide a better understanding of its full potential and limitations.
-
ESPERIDIÃO, A. R.; FONTOLAN, B. L.; DEL ROIO, I. G.; IAROZINSKI NETO, A. Comparative analysis of neighborhood satisfaction based on income: application of the Kano model in a case study in the state of Paraná. Ambiente Construído, Porto Alegre, v. 26, e155241, jan./dez. 2026. ISSN 1678-8621 Associação Nacional de Tecnologia do Ambiente Construído. http://dx.doi.org/10.1590/s1678-86212026000101026
-
Declaration of Generative AI and AI-Assisted Technologies in the Writing Process
The authors declare that generative artificial intelligence tools were used solely to support linguistic revision and improve the clarity of the manuscript, without any involvement in the study conception, methodological design, data analysis or interpretation, or in the formulation of results and conclusions. Full responsibility for the scientific content, including data, analyses, interpretations, and editorial decisions, rests entirely with the authors.
-
Financial Support
This study was financed by the Coordenação de Aperfeiçoamento de Pessoal de Nível Superior (CAPES) – Finance Code 001.
Data Availability Statement
The data supporting the findings of this study are available from the corresponding author on reasonable request.
References
- AIGBAVBOA, C.; THWALA, W. Residential satisfaction and the evolution of housing policy Abingdon: Routledge, 2018.
- ANDRADE, D. F.; TAVARES, H. R.; VALLE, R. C. Item response theory: concepts and applications. São Paulo: ABE, 2000.
- BONAIUTO, M. et al Residential satisfaction and perceived urban quality. Encyclopedia of Applied Psychology, v. 3, p. 267-272, 2004.
- BRANDT, R. D. A procedure for identifying value-enhancing service components using customer satisfaction survey data. Add Value to Your Service, v. 6, n. 1, p. 61-65, 1987.
- BREWER, J.; HUNTER, A. Foundations of Multimethod research: synthesizing styles. Thousand Oaks: Sage, 2006.
- CAMARGOS NETO, H. Percepção de qualidade em serviços logísticos: um estudo no setor atacadista sob a ótica dos varejistas. Belo Horizonte, 2021. Dissertação (Mestrado em Administração) – Faculdade de Ciências Empresariais, Belo Horizonte, 2021.
- CAMPBELL, A. Subjective measures of well-being. American psychologist, v. 31, n. 2, p. 117, 1976.
- CAO, J. et al Prioritizing neighborhood attributes to enhance neighborhood satisfaction: An impact asymmetry analysis. Cities, v. 105, p. 102854, 2020.
- CIORICI, P.; DANTZLER, P. A. Neighborhood satisfaction: a study of a low-income urban community. Urban Affairs Review, v. 55, n. 3, p. 107808741875551, mar. 2018.
- COLIN, E. C. S.; PELICIONI, M. C. F. Territoriality, local development, and health promotion: a case study in a historic village in Santo André, São Paulo. Health and Society, v. 27, p. 1246-1260, 2018.
- DACE, E.; STIBE, A.; TIMMA, L. A holistic approach to managing environmental quality using the Kano model and social cognitive theory. Corporate Social Responsibility and Environmental Management, v. 27, n. 2, p. 430-443, 2020.
- DONG, W. et al Examining pedestrian satisfaction in gated and open communities: an integration of gradient boosting decision trees and impact-asymmetry analysis. Landscape and Urban Planning, v. 185, p. 246-257, 2019.
- DONG, Y. et al What neighborhood factors are critical to resident satisfaction with old neighborhoods? An integration of ground theory and impact asymmetry analysis. Cities, v. 141, p. 104460, 2023.
- EL DIN, H. S. et al Principles of urban quality of life for a neighborhood. HBRC journal, v. 9, n. 1, p. 86-92, 2013.
- EMAMI, A.; SADEGHLOU, S. Residential satisfaction: a narrative literature review toward the identification of core determinants and indicators. Housing, Theory and Society, v. 38, n. 4, p. 512-540, 2021.
- ESPERIDIÃO, A. R. et al Relationship between urban environment characteristics and satisfaction: the brazilian perspective. RPER, n. 67, p. 25-39, 2024.
- ESPERIDIÃO, A. R. Study of nonlinear classification methods for neighborhood attributes based on residents’ satisfaction perceptions Curitiba, 2025. 157 f. Thesis (Ph.D. in Civil Engineering) – Federal Technological University of Paraná, Curitiba, 2025.
- FERREIRA, F. A. F. Are you pleased with your neighborhood? A fuzzy cognitive mapping-based approach for measuring residential neighborhood satisfaction in urban communities. International Journal of Strategic Property Management, v. 20, n. 2, p. 130-141, 2016.
- FONTOLAN, B. L. et al Factor analysis of neighborhood satisfaction based on individual perception in the Brazilian context. Arquitetura Revista, v. 19, n. 1, p. 56-72, 2024.
- GIFFORD, R.; SUSSMAN, R. The psychological needs of city dwellers: Implications for sustainable urban planning. In: METROPOLITAN sustainability. Cambridge: Woodhead Publishing, 2012.
- GREIF, M. The intersection of homeownership, race, and neighborhood context: Implications for neighborhood satisfaction. Urban Studies, v. 52, n. 1, p. 50-70, 2015.
- HUR, M.; MORROW-JONES, H. Factors that influence residents' satisfaction with neighborhoods. Environment and Behavior, v. 40, n. 5, p. 619-635, 2008.
- KANO, N. et al Attractive quality and must-be quality. Hinshitsu, v. 14, p. 39-48, 1984.
- LEE, K.-Y. Relationship between satisfaction with the physical environment, neighborhood satisfaction, and quality of life in Gyeonggi, Korea. Land, v. 10, n. 7, p. 663, 2021.
- LEE, R. J.; NEWMAN, G.; DAY, W. Neighborhood abandonment and quality of life: A comparison of neighborhood satisfaction and housing value measures. Cities, v. 150, p. 1050-11, 2024.
- LEE, S. M. et al The relation of perceived and objective environment attributes to neighborhood satisfaction. Environment and Behavior, v. 49, n. 2, p. 136-160, 2017.
- MARANS, R. W. Understanding environmental quality through quality of life studies: the 2001 DAS and its use of subjective and objective indicators. Landscape and Urban Planning, v. 65, n. 1-2, p. 73-83, 2003.
- MARANS, R. W.; STIMSON, R. J. (ed.). Investigating quality of urban life: theory, methods, and empirical research. London: Springer Science & Business Media, 2011.
- MATZLER, K.; SAUERWEIN, E. The factor structure of customer satisfaction: an empirical test of the importance grid and the penalty‐reward‐contrast analysis. International journal of service industry management, v. 13, n. 4, p. 314-332, 2002.
- MATZLER, K.; SAUERWEIN, E.; HEISCHMIDT, K. Importance-performance analysis revisited: the role of the factor structure of customer satisfaction. The Service Industries Journal, v. 23, n. 2, p. 112-129, 2003.
- MIKULIĆ, J.; PREBEŽAC, D. A critical review of techniques for classifying quality attributes in the Kano model. Managing Service Quality: An International Journal, v. 21, n. 1, p. 46-66, 2011.
- MIKULIĆ, J.; PREBEŽAC, D. Prioritizing improvement of service attributes using impact range-performance analysis and impact-asymmetry analysis. Managing Service Quality: An International Journal, v. 18, n. 6, p. 559-576, 2008.
- MOURATIDIS, K. Is a compact city livable? The impact of compact versus sprawled neighborhoods on neighborhood satisfaction. Urban Studies, v. 55, n. 11, p. 2408-2430, 2018.
- MRIDHA, M. Looking through the Models: a critical review of residential satisfaction. Buildings, v. 13, n. 5, p. 1183, 2023.
- ORSTAD, S. L. et al A systematic review of agreement between perceived and objective neighborhood environment measures and associations with physical activity outcomes. Environment and Behavior, v. 49, n. 8, p. 904-932, 2017.
- PARKES, A.; KEARNS, A.; ATKINSON, R. What makes people dissatisfied with their neighborhoods?. Urban Studies, v. 39, n. 13, p. 2413-2438, 2002.
- PICOLO, J. D.; TONTINI, G. Analysis of the Penalty-Reward Contrast (PRC): identifying opportunities for improvement in a service. RAM. Mackenzie Journal of Administration, v. 9, p. 35-58, 2008.
- RAMOS-ESPERIDIÃO, A. et al Urban environment factors and neighborhood satisfaction: differences between the capital and the interior of Paraná. Revista de Urbanismo, n. 51, p. 1-23, 2024.
- SAMEJIMA, F. Estimation of latent ability using a response pattern of graded scores. Psychometrika, v. 1, n. 17, p. 1-100, 1969.
- SIRGY, M. J.; RAHTZ, D. R.; CICIC, M.; UNDERWOOD, R. A method for assessing residents' satisfaction with community-based services: a quality-of-life perspective. Social Indicators Research, v. 49, n. 3, p. 279–316, 2000.
- WESTAWAY, M. S. A longitudinal investigation of satisfaction with personal and environmental quality of life in an informal South African housing settlement, Doornkop, Soweto. Habitat International, v. 30, n. 1, p. 175–189, 2006.
- YIN, J. et al Applying the IPA–Kano model to examine environmental correlates of residential satisfaction: a case study of Xi'an. Habitat International, v. 53, p. 461-472, 2016.
Edited by
-
Editor-in-chief:
Enedir Ghisi
-
Guest editor:
Rosaria Ono


