 Effects of drying on the bioactive compounds in organic sweet potatoes (Ipomoea batatas)
ABSTRACT.
Sweet potato (Ipomoea batatas L.) is a source of vitamin A, carbohydrates, organic acids, and minerals. It is rich in bioactive compounds, making it a very healthy food. Indeed, it helps in the prevention of various diseases such as cardiovascular diseases, certain types of cancer, and in controlling the glycemic index of people with diabetes. Additionally, it provides nutrients for at-risk groups, such as children and pregnant women with deficiencies in magnesium and vitamin A. In its natural form, sweet potatoes have high water activity, making them highly perishable and reducing their shelf life. This study aimed to evaluate the influence of the drying process at different temperatures (50, 60, and 70°C) and thicknesses (1, 2, and 3 mm) on the antioxidant content and phenolic compounds of two sweet potato cultivars: BDI (Brasilândia) and BDII (not cataloged). The drying process was evaluated based on 10 mathematical models, comparing the coefficient of determination (R²), chi-square (χ²) value, and root mean squared error (RMSE). The Page model stood out for the BDI cultivar and the diffusion approximation and Page models were significant for the BDII cultivar. The total phenolic content ranged from 71.67 to 99.33 mg gallic acid equivalents 100 g-1. The 2,2'-azinobis (3-ethylbenzothiazoline-6-sulfonic acid) (ABTS) and ferric reducing antioxidant power (FRAP) methods were used to quantify antioxidant activity, with values ranging from 21.93 to 51.53 µmol Trolox 100 g-1 and 656.34 to 1021 µM ferrous sulfate 100 g-1, respectively. A drying temperature of 70°C combined with a thickness of 1 mm required a shorter drying time to reach the equilibrium moisture content, between 2 and 3 hours.
Keywords:
Sweet potato; antioxidant activity; total phenolics; thickness; mathematical models
Introduction
Sweet potato (Ipomoea batatas L.) is considered the seventh most important food crop in the world in terms of human consumption. It is grown in 111 countries, with 83.1% of production located in Asia, 13.3% in Africa, 2.9% in the Americas, 0.7% in Oceania, and 0.1% in Europe (Food and Agriculture Organization of the United Nations [FAO], 2016; Montefusco et al., 2014). China is the largest producer of sweet potatoes in the world, responsible for 90% of the total production, approximately 117 million tons per year (FAO, 2016; Zhu et al., 2017).
This tuberous root is a hardy species, easy to maintain and adapt, and has good drought resistance. Although it is perennial, it is considered an annual plant, with a tender and creeping stem that helps combat erosion and the growth of weeds (Santos et al., 2012). It originates from the Andes Mountains but is cultivated throughout the Americas, from the Amazon to more temperate regions such as Rio Grande do Sul and the Pacific Coast; on other continents such as Africa and Asia; and can adapt to altitudes up to 3000 m (Silveira et al., 2016). In Brazil, the largest producer in sweet potato producer in Latin America, cultivation increases each year. In 2020, approximately 805,400 tons of sweet potatoes were produced, exceeding the production of 595,977 tons in 2016 and 669,400 tons in 2017 (Amaro et al., 2019; Instituto Brasileiro de Geografia e Estatística, 2020).
Sweet potato presents high genetic variability, leading to numerous shapes and colors of the leaves and roots. Additionally, the flesh can vary in color, including white, cream, dark cream, pale yellow, yellow, red, orange, and purple (Mendoza, 2018; Mohanraj & Sivasankar, 2014). Cultivation of sweet potato is more efficient than any other root crop, making it an affordable and essential crop for food security, especially in developing countries. It is an excellent source of energy; fiber; bioactive compounds such as antioxidants, provitamin A, and B complex vitamins; and minerals such as calcium, phosphorus, iron, and ascorbic acid (Araujo et al., 2015; Aziz et al., 2018; Berni et al., 2015; He et al., 2015; Kubow et al., 2016; Mohanraj & Sivasankar, 2014; Sun et al., 2014).
Antioxidants are compounds that can prevent the negative effects of free radicals, as they are reactive molecules that play a role in reducing the risk of developing various diseases such as diabetes, hypertension, coronary heart disease, neurodegenerative diseases, and certain types of cancer (Mohanraj & Sivasankar, 2014; Santos et al., 2012). Among these, phenolic compounds are the focus of extensive research due to their biological activity. They can function as metal ion chelators or free radical scavengers, interfering with the initiation and propagation stages of the oxidative process responsible for the auto-oxidation of lipids present in both foods and cellular membranes (Santos et al., 2012). Several methods are used to measure the antioxidant activity of these bioactive compounds. One of the most widely used methods involves capturing the 2,2'-azinobis (3-ethylbenzothiazoline-6-sulfonic acid) (ABTS) radical, which can be generated through chemical and enzymatic reactions. This method can be utilized to measure the activity of both hydrophilic and lipophilic compounds. Another method capable of determining antioxidant activity is the ferric reducing antioxidant power (FRAP) method (Thaipong et al., 2006).
Due to the high availability of water and nutrients, sweet potato is quite perishable. Reducing water activity is one way to increase its shelf life. Among the drying methods, oven drying is used most commonly for food preservation. This process is based on the removal of water by convection, where hot air passes through a very thin layer and is then conducted into the food. This process tends to be very slow due to the low thermal diffusivity of food (Silva et al., 2018). Drying kinetics can be understood as the rate of water removal from the food, influenced by specific external and internal factors such as the drying air speed, temperature, and relative humidity (Silva et al., 2015). The presence and quantity of antioxidants in plant-based foods are mainly influenced by species, cultivation practices, processing type, and storage conditions. The objective of this study was to evaluate the influence of drying temperatures (50, 60, and 70°C) on the antioxidant and phenolic compound content of two organic sweet potato (I. batatas) cultivars sliced into three different thicknesses (1, 2, and 3 mm).
Material and methods
Chemicals and reagents
Sodium carbonate, potassium persulfate, and ferric chloride were purchased from Dinâmica (Indaiatuba, Brazil). Ethanol and citric acid were purchased from Synth (Diadema, Brazil). The Folin-Ciocalteu reagent, gallic acid, ABTS, 6-hydroxy-2,5,7,8-tetramethylchroman-2-carboxylic acid (Trolox), and 2,4,6-Tris(2-pyridyl)-s-triazine (TPTZ) were purchased from Sigma-Aldrich (São Paulo, Brazil).
Samples
Two sweet potato (I. batatas) cultivars were examined: The first, Brasilândia (BDI), has purple skin, an elongated shape, and light flesh. The second, an unidentified cultivar (BDII), has light skin, a round shape, and purple-pigmented flesh. The samples were sourced from the municipality of Quinta do Sol, Paraná State, Brazil (23º51'08" S, 52º07'47" W, and an altitude of 422 m). After selecting the samples, any coarse dirt adhered to the surface was removed, and the samples were transported to the Food Packaging Laboratory (DAL) at the main campus of the State University of Maringá, where they were stored under refrigeration until use.
Washing and sanitization
The samples were washed, sanitized, and then sliced to a thickness of 1, 2, or 3 mm using a flexible stainless steel Ecolumi Mandoline vegetable slicer (Gedex, São Paulo, Brazil). The slices were measured using a Digmatic micrometer (Mitutoyo, New Delhi, India) to ensure the cutting was precise. Then, the slices were immersed in a 1% citric acid aqueous solution for 10 minutes to prevent enzymatic browning, followed by a rinse in distilled water.
Drying samples
The sweet potato slices were dried using forced convection in an air-circulation and renewal oven (TE - 394/1, Tecnal, Piracicaba, Brazil) at 50, 60, or 70°C with a constant airflow speed of 1 m s-1. The samples were weighed using a Avy 220 semi-analytical balance (Shimadzu, Kyoto, Japan) with an accuracy of 0.01 g.
Drying curves
Initially, the samples were weighed at 15-minutes intervals during the first hour, then every 30 minutes for the next 5 hours, and finally every 60 minutes until they reached a constant mass (equilibrium moisture content) with a final moisture content of less than 0.10 ± 0.01 g water g-1 dry mass.
Methodology
Determination of the physicochemical composition
The moisture (forced convection method), ash (incineration of organic matter method), protein (Kjeldahl method), and lipid (Soxhlet method) contents were determined according to Horowitz (2002). The carbohydrate content was determined by the difference method.
Determination of bioactive compounds
Preparation of extracts
Dried and crushed sweet potato samples were subjected to extraction in an ethanol-water solution (95:5, v v-1), with 1 g of sample per 20 mL of solution. The samples were agitated manually for 30 seconds in the dark. After homogenization, the samples were incubated for 60 minutes at room temperature (Thaipong et al., 2006). Then, they were centrifuged (Universal 320 R, Hettich Centrifuge, Tuttlingen, Germany) at 9,000 rpm for 15 minutes at 27°C. The supernatant was removed and transferred to test tubes protected from light and stored in a freezer at -18°C until use.
Determination of the Total Phenolic Content
The total phenolic content was determined based on the spectrophotometric method proposed by Singleton and Rossi (1965). A 0.125-mL aliquot of the extract was transferred to a test tube, to which 0.125 mL of Folin-Ciocalteu reagent diluted in distilled water (1:1, v v-1) and 2.25 mL of 3.79 M sodium carbonate were added. The mixture was incubated for 30 minutes in the dark. Subsequently, the absorbance at 725 nm was measured with a UV M51 spectrophotometer (BEL Engineering, Monza, Italy). A calibration curve was prepared with gallic acid as the standard (y = 0.0014x + 0.0697; R2 = 0.9904) to estimate the total phenolic content, expressed as milligrams of gallic acid equivalents (GAE) per 100 g of the sample (mg GAE 100 g-1).
Determination of the total antioxidant capacity by the abts method
The ABTS radical cation decolorization assay was performed as described by Thaipong et al. (2006). The ABTS+ radical was formed by reacting 7 mM ABTS solution with 140 mM potassium persulfate in the dark. The absorbance at 734 nm was adjusted to 0.700 (± 0.05) with 95% ethanol (v v-1). In triplicate, 3.0 mL of the ABTS+ radical solution and 30 µL of each extract were mixed, and the absorbance was read every 6 minutes with a UV M51 spectrophotometer (BEL Engineering). Trolox was used as a standard for the calibration curve (0-100 µM g-1; y = -0.0003x + 0.6889; R2 = 0.9925). The results are expressed as Trolox equivalents (µMol Trolox g-1) on a dry matter basis.
Determination of antioxidant activity by the frap method
The FRAP solution was prepared fresh at the time of analysis, using 25 mL of 0.3 M acetate buffer solution, 2.5 mL of TPTZ solution, and 2.5 mL of 20 mM ferric chloride solution (Thaipong et al., 2006). In test tubes, 90 µL of each extract, 270 µL of distilled water, and 2.7 mL of FRAP reagent were added and incubated at 37°C in a water bath for 30 minutes. The absorbance at 595 nm was measured with a UV M51 spectrophotometer (BEL Engineering). The FRAP reagent was used as a blank, and Trolox solution (0-100 µM g-1) was used as the standard for constructing the calibration curve (y = 0.0016x - 0.0368; R2 = 0.9901). All readings were performed in triplicate. The results are expressed as Trolox equivalents (µMol Trolox g-1) on a dry matter basis.
Statistical analysis
STATISTICA 10.0 (StatSoft, Tulsa, OK, USA) was used for data analysis. The data were subjected to analysis of variance (ANOVA), followed by Tukey’s test to determine differences between the means. A p-value < 0.05 was considered to indicate a statistically significant difference. Pearson correlation coefficients were calculated to evaluate the relationship between the total phenolic content and antioxidant capacity (ABTS and FRAP).
Mathematical models
The moisture content at different times was calculated using Equation 1:
(1)
where MR is the moisture ratio (dimensionless value), Mx is the moisture content of the product represented on a dry basis (db), Mx0 is the equilibrium moisture content of the product (db), and Mxi is the initial moisture content of the product (db).
The 10 most commonly used mathematical models to fit the experimental drying curve data for vegetable products (Table 1) were considered. STATISTICA 10.0 was used to employ non-linear regression analysis by the Gauss-Newton method to obtain the constants for the selected models.
To assess the fit of each model, the coefficient of determination (R²), the chi-square (χ²) value, and the root mean squared error (RMSE)-calculated using Equations 12, 13, and 14, respectively-were considered.
(12)
(13)
(14)
In Equations 12 and 14, MRobs is the experimentally observed value; MRest is the value calculated by the model; n is the number of experimental observations; and GLR is the degree of freedom of the model (observations minus the number of model parameters).
The Arrhenius equation (Equation 15) was used to calculate the effective diffusivity (D) as a function of absolute temperature:
(15)
where Do is the pre-exponential factor, Ea is the activation energy (kJ mol-1), R is the universal gas constant (8.134 kJ kmol-1 K), and Tab is the absolute temperature (K).
Results and discussion
The centesimal composition of the BDI and BDII sweet potato cultivars did not show a significant difference (Tukey’s test, p > 0.05, Table 2), except for the ash content, with was approximately 17% higher for BDII compared with BDI.
The protein and lipid contents are similar to those found by Fontes et al. (2012), which were 5.82% and 0.3%, respectively, for the Mona Liza yellow sweet potato variety. Araujo et al. (2015) found a slightly higher moisture content of 69.23% for the RBS Rubissol variety of sweet potato flour. The ash contents from the present study correspond with the values reported by Alam et al. (2016), which ranged from 0.30% to 0.54%. Those authors analyzed the centesimal composition of nine types of sweet potatoes subjected to different thermal processes, and observed values consistent with those reported in the present study.
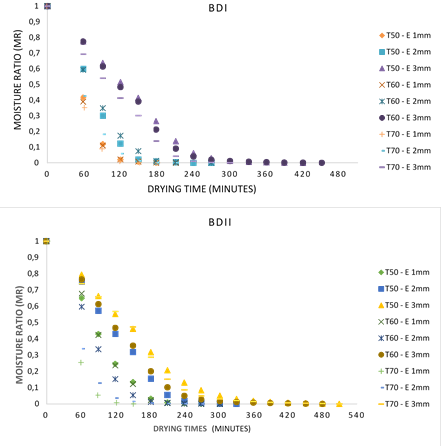
The drying curves for the BDI and BDII sweet potato cultivars are presented in Figure 1. The time required to reach the equilibrium moisture content (db) decreased as the temperature increased. For example, it took 60% longer to reach db at 50°C (0.0145 db in 270 minutes) than at 70°C (0.0084 db in 180 minutes) for the same thickness (3 mm).
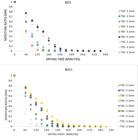
Drying increased due to variations in temperature and thickness. The drying time increased by 50% at 70°C and a thickness of 3 mm (180 minutes) compared with 50°C and a thickness of 1 mm (90 minutes), reaching db values of 0.0108 ± 0.001 and 0.0041 ± 0.001, respectively. The relationship between temperature and thickness also became clearer for the BDII cultivar at 50°C and a thickness of 3 mm and at 70°C and a thickness of 1 mm. Increasing the sample thickness reduces the drying rates due to the greater difficulty in evaporating water from thicker samples.
As drying commences, there is a significant drop in moisture due to the evaporation of surface water, which is easily removed. Over time, the removal rate decreases due to internal moisture resistance, as the remaining water is bound to the polar groups of the constituent molecules. Therefore, the higher the drying temperature, the more easily the sample reaches equilibrium, as long as the thickness remains constant (Viana et al., 2018).
Ten mathematical models were used to fit the drying data for the BDI and BDII cultivars (see Supplementary Material Tables S1 and S2). The fit quality of each model was evaluated by considering R², the χ² value, and the RMSE. According to Doymaz (2011), mathematical models with a better fit (R² > 0.99) and a lower χ² value and RMSE are capable of predicting drying phenomena effectively.
The Page model (Equation 3) provided the best fit for the data obtained from drying the samples at 50, 60, and 70°C and a thicknesses of 1 and 2 mm, with the highest R² (> 0.999) and the lowest and least variable χ² values (0.0001-0.0009) and RMSE (0.00247-0.00668). Consistent with these results, Souza et al. (2019) found that the Page model for drying temperatures of 45, 55, 65, and 75°C also showed R² > 0.99 and RMSE < 0.003 when studying the mathematical modeling of biofortified sweet potatoes.
The diffusion approximation model (Equation 10) and the Page model provided the best fit for the drying process at 50°C and a thicknesses of 1 and 3 mm; at 60ºC and a thicknesses of 1, 2, and 3 mm; and at 70ºC and a thicknesses of 1 and 3 mm, with R² > 0.999, χ² values of 0.0001-0.0010, and RMSE of 0.0037-0.00976 (Supplementary Material - Table S2). Compared with the present study, Souza et al. (2019) reported lower R² for the diffusion approximation model for different drying temperatures of biofortified sweet potatoes.
For all models, except for the Thompson model (Equation 6) (see Supplementary Material - Tables S3 and S4), the k value was < 1 for all three drying temperatures and thicknesses, indicating slow evaporation while drying the BDI and BDII cultivars. Ekwere et al. (2019) reported similar results when evaluating the drying process of sweet potatoes at different thicknesses and temperatures. For the BDI and BDII cultivars, the Thompson model showed the highest k values (> 1). For the BDI cultivar, the value was 15.86238 at 50°C and a thickness of 1 mm and 15.54347 at 70°C and a thickness of 3 mm. For the BDII cultivar, the k value was 10.9597 and 10.5356 at 60°C and a thickness of 1 and 2 mm, respectively (Supplementary Material - Table S4). The increase in drying air temperature positively influenced the k parameter, as higher temperatures facilitate the loss of free water from the food. These results are consistent with Leite et al. (2015). Moreover, according to Silva et al. (2014), the k parameter represents the effects of external drying conditions.
The effective diffusion coefficients and R² (Table 3) increased as the drying temperature increased for all three thicknesses and for the BDI and BDII cultivars. There was a strong correlation between the effective diffusion coefficients and absolute temperature (K), with R² > 0.99.
There was a reduction in effective diffusivity when the thickness increased (BDI: 8.7 × 10⁻¹² m² s-1 for 1 mm, 3.4 × 10⁻¹² m² s-1 for 2 mm, and 1.47 × 10⁻¹² m² s-1 for 3 mm; BDII: 3.0 × 10⁻¹⁰ m² s-1 for 1 mm, 6.7 × 10⁻¹⁰ m² s-1 for 2 mm, and 8.6 × 10⁻¹⁰ m² s-1 for 3 mm). Souza et al. (2019) reported that the effective diffusivity value for biofortified sweet potatoes dried at 45-75°C ranged from 7.55 × 10⁻¹¹ to 19.24 × 10⁻¹¹ m² s-1.
Effective diffusivity (m2 s-1) at 50, 60, and 70°C and a thickness of 1, 2, and 3 mm for the BDI and BDII sweet potato cultivars.
The activation energy of the BDI and BDII samples was calculated according to Equation 15. The average value-considering the three drying temperatures (50, 60, and 70°C) and three thicknesses (1, 2, and 3 mm)-was 18.95 kJ mol-1 for BDI and 22.5 kJ mol-1 for BDII. Souza et al. (2019) found a similar average activation energy (29.18 kJ mol-1) for biofortified sweet potatoes within the temperature range of 45 to 75°C. Activation energy is defined as the ease by water molecules overcome the energy barrier during migration within the product. The lower the activation energy, the faster the water removal rate (Silva et al., 2014).
After drying the sweet potatoes through forced convection, the total phenolic content and antioxidant capacity were determined to assess whether the drying temperature (50, 60, and 70°C) and thicknesses (1, 2, and 3 mm) significantly influenced the bioactive compounds of the BDI and BDII cultivars. ANOVA revealed that, as expected, the cultivar and drying temperature affected the antioxidant capacity. In addition, the cultivar × temperature and temperature × thickness interactions strongly and significantly affected the antioxidant capacity. Thickness did not influence the antioxidant capacity of the sweet potato cultivars. Therefore, further analysis was conducted: The sample means for the total phenolic content and antioxidant capacity based on the ABTS and FRAP methods were compared with Tukey’s test (Tables 4 and 5).
The total phenolic content (mg gallic acid equivalents 100 g-1) and antioxidant capacity, evaluated with the 2,2'-azinobis (3-ethylbenzothiazoline-6-sulfonic acid) (ABTS, µmol Trolox 100 g-1) and ferric reducing antioxidant power (FRAP, µM ferrous sulfate 100 g-1) methods, of sweet potato samples as a function of the drying temperature and sample thickness.
For the BDI and BDII cultivars, at 70°C there was a significant increase in the total phenolic content and antioxidant capacity based on the FRAP method, regardless of the thickness. Phenolic compounds are generally sensitive to temperature variations, with losses occurring during drying. However, in some cases, the opposite effect can occur. Savas (2022) evaluated the drying of three potato varieties and reported an increase in the phenolic content as the temperature increased, a behavior similar to that observed in the present study. According to Yang et al. (2010), an increase in the phenolic content as temperature increases can be related to cell disruption during thermal processing, allowing greater extraction of these compounds.
There was significant variation in antioxidant capacity based on the FRAP method at 70°C, which was not observed with the ABTS method. The antioxidant capacity of foods depends on many factors, such as substrate properties and phenolic compound composition. Different methods for determining antioxidant capacity presented in the literature (ABTS, FRAP, 2,2-diphenyl-1-picrylhydrazyl [DPPH], etc.) may vary according to the different phenolic compounds present in the sample. For example, some antioxidant compounds may lead to a high FRAP value but relatively low ABTS radical scavenging, as observed in the present study. Therefore, it is recommended to use more than one method to assess the antioxidant capacity of a sample (Tejeda et al., 2020).
At 70°C, there was also a variation in antioxidant compounds based on the thickness (only for the BDII cultivar): Thicker samples had a lower total phenolic content and antioxidant capacity based on the FRAP method. As the final moisture content of the samples was fixed, thicker samples required a longer drying time, resulting in the degradation of bioactive compounds.
When evaluating the cultivar × temperature interaction (Table 5), the BDII cultivar had a lower total phenolic content and antioxidant capacity based on the FRAP method compared with the BDI cultivar.
Considering the total phenolic content, there was a significant difference between the BDI and BDII cultivars for two conditions: 70°C and a thickness of 2 mm, and 50°C and a thickness of 3 mm (Table 5). The process is faster when the drying air temperature is increased, reducing food exposure. The Maillard reaction favors the formation of compounds that have antioxidant effects.
Regarding the total antioxidant capacity based on the ABTS method, there were significant differences between the BDI and BDII cultivars: BDI had the highest antioxidant capacity, particularly at 50°C and a thicknesses of 1, and at 70°C and a thickness of 2 mm (Table 5). This difference may be related to the genotype. Evaluating temperature and cultivars, BDII was more affected by the increase in temperature compared with BDI. This may be attributed to the phenolic constituents that can degrade more easily with increasing temperature.
The total phenolic content (mg gallic acid equivalents 100 g-1) and antioxidant capacity, evaluated with the 2,2'-azinobis (3-ethylbenzothiazoline-6-sulfonic acid) (ABTS, µmol Trolox 100 g-1) and ferric reducing antioxidant power (FRAP, µM ferrous sulfate 100 g-1) methods, of sweet potato samples as a function of the cultivar and drying temperature.
In the analysis of antioxidant activity based on the FRAP method, there were significant cultivar × temperature interactions at 70°C and a thickness of 2 mm, and at 50°C and a thickness of 3 mm (Table 5). This behavior can be attributed to the characteristics of each genotype and the temperature, which can alter the chemical composition and the concentration of phenolic compounds, potentially increasing antioxidant activity.
When evaluating the antioxidant capacity by different methods, Nascimento et al. (2021) recommended an assessment of the correlation between these methods and the phenolic content (Table 6). In the present study, the correlation between the total phenolic content and the antioxidant capacity based on the FRAP method was strong (> 0.68). This correlation indicates that samples with a higher phenolic content exhibit greater antioxidant capacity by the FRAP method. On the other hand, the correlation between phenolic compounds and ABTS was moderate (< 0.67) (Taylor, 1990), indicating that other components in the samples, besides phenolic compounds, may directly react with the ABTS radicals. The Pearson correlation analysis supports the ANOVA results that demonstrated significant variations in phenolic compounds and FRAP in sweet potato samples based on the drying temperature and thickness.
Pearson correlation coefficients between the total phenolic content and antioxidant capacity, evaluated with the 2,2'-azinobis (3-ethylbenzothiazoline-6-sulfonic acid) (ABTS) and ferric reducing antioxidant power (FRAP) methods, of sweet potato samples dried at different temperatures.
Conclusion
A drying temperature of 70°C combined with a thickness of 1 mm required a shorter drying time to reach the equilibrium moisture content, between 2 and 3 hours. The diffusion approximation and Page models provided the best fit for the experimental data, denoted by a high R² and a low χ² value and RMSE. The relationship between the diffusion coefficient and drying temperature can be described by the Arrhenius equation, which showed an R² > 0.99. The diffusion coefficient increases as the temperature increases and decreases as the thickness increases, indicating that the higher the diffusivity, the lower the activation energy. The highest concentrations of bioactive compounds were observed at a drying temperature of 70°C.
Data availability
The data used in the search were made available publicly, and can be accessed through the link https://docs.google.com/document/d/1SwMB4yn4KrneO_uet6bASvqLPA0dNpLQ/edit?usp=drive_link&ouid=112278213560242074207&rtpof=true&sd=true
References
-
Alam, M. K., Rana, Z. H. & Islam, S. N.. (2016). Comparison of the proximate composition, total carotenoids and total polyphenol content of nine orange-fleshed sweet potato varieties grown in Bangladesh. Foods, 5(3), 1-10. https://doi.org/10.3390/foods5030064
» https://doi.org/https://doi.org/10.3390/foods5030064 -
Amaro, G. B., Talamini, V., Fernandes, F. R., Silva, G. O. & Madeira, N. R.. (2019). Desempenho de cultivares de batata-doce para rendimento e qualidade de raízes em Sergipe. Revista Brasileira de Ciências Agrárias, 14(1), 1-6. https://doi.org/10.5039/agraria.v14i1a5628
» https://doi.org/https://doi.org/10.5039/agraria.v14i1a5628 -
Araujo, C. S. P., Andrade, F. H. A., Galdino, P. O. G. & Pinto, M. S. C.. (2015). Desidratação de batata-doce para fabricação de farinha. Agropecuária Científica no Semiárido, 11(4), 33-41. https://doi.org/10.30969/acsa.v11i4.687
» https://doi.org/https://doi.org/10.30969/acsa.v11i4.687 -
Aziz, A. A., Padzil, A. M. & Muhamad, I. I.. (2018). Effect of incorporating purple-fleshed sweet potato in biscuit on antioxidant content, antioxidant capacity and colour characteristics. Malaysian Journal of Analytical Sciences, 22(4), 667-675. https://doi.org/10.17576/mjas-2018-2204-13
» https://doi.org/https://doi.org/10.17576/mjas-2018-2204-13 -
Berni, P., Chitchumroonchokchai, C., Caniatti-Brazaca, S. G., Moura, F. F. & Failla, M. L.. (2015). Comparison of content and in vitro bioaccessibility of provitamin A carotenoid in home cooked and commercially processed orange fleshed sweet potato (Ipoema batatas Lam). Plant Foods for Human Nutrition, 70, 1-8. https://doi.org/10.1007/s11130-014-0458-1
» https://doi.org/https://doi.org/10.1007/s11130-014-0458-1 -
Doymaz, I.. (2011). Thin-layer drying characteristics of sweet potato slices and mathematical modelling. Heat and Mass Transfer, 47, 277-285. https://doi.org/10.1007/s00231-010-0722-3
» https://doi.org/https://doi.org/10.1007/s00231-010-0722-3 -
Ekwere, I. U., Reuben, E. B. & Oseribho, O. I.. (2019). Mathematical and kinetic modelling for convective hot air drying of sweet potatoes (Ipomoea batatas L. ). American Journal of Chemical Engineering, 7(1), 22-31. https://doi.org/10.11648/j.ajche.20190701.13
» https://doi.org/https://doi.org/10.11648/j.ajche.20190701.13 -
Fontes, L. C. B., Sivi, T. C., Ramos, K. & Queiroz, F. P. C. (2012). Efeito das condições operacionais no processo de desidratação osmótica de batata-doce. Revista Brasileira de Produtos Agroindustriais, 14(1), 1-13. https://doi.org/10.15871/1517-8595/rbpa.v14n1p1-13
» https://doi.org/https://doi.org/10.15871/1517-8595/rbpa.v14n1p1-13 -
Food and Agriculture Organization of the United Nations. (2016). FAOSTAT: Crops and livestock products. FAO. http://www.fao.org/faostat/en/#data/QC
» http://www.fao.org/faostat/en/#data/QC -
He, X., Li, X., Lv, Y. & He, Q.. (2015). Composition and color stability of anthocyanin-based extract from purple sweet potato. Food Science and Technology, 35(3), 468-473. https://doi.org/10.1590/1678-457X.6687
» https://doi.org/https://doi.org/10.1590/1678-457X.6687 - Horowitz, W. (2002). Official methods of analysis of the AOAC International (17th ed.). AOAC International.
-
Instituto Brasileiro de Geografia e Estatística. (2020). Sistema IBGE de Informação Safra. IBGE. http://www.ibge.gov.br
» http://www.ibge.gov.br -
Kubow, S., Iskandar, M. M., Sabally, K., Azadi, B., Ekbatan, S. S., Kumarathasan, P., Das, D. D., Burgos, G. & Felde, T.. (2016). Biotransformation of anthocyanin’s from two purple-fleshed sweet potato accessions in a dynamic gastrointestinal system. Food Chemistry, 192, 171-177. https://doi.org/10.1016/j.foodchem.2015.06.105
» https://doi.org/https://doi.org/10.1016/j.foodchem.2015.06.105 -
Leite, A. L., Silva, F. S., Porto, A. G., Piasson, D. & Santos, P.. (2015). Contração volumétrica e cinética de secagem de fatias de banana variedade terra. Pesquisa Agropecuária Tropical, 45(2), 155-162. https://doi.org/10.1590/1983-40632015v4530270
» https://doi.org/https://doi.org/10.1590/1983-40632015v4530270 -
Mendoza, J., Vargas, P., Evangelista, M., Sartori, M. & Ming, L.C.. (2018). Physicochemical characteristics of three accessions of sweet potato cultivated by traditional growers of Vale do Ribeira, São Paulo State, Brazil. Acta Horticulturae, 3, 953-958. https://doi.org/10.17660/ActaHortic.2018.1194.135
» https://doi.org/https://doi.org/10.17660/ActaHortic.2018.1194.135 -
Mohanraj, R. & Sivasankar, S.. (2014). Sweet potato (Ipomoea batatas Lam.) - A valuable medical food: A review. Journal of Medical Food, 17(7), 733-741. https://doi.org/10.1089/jmf.2013.2818
» https://doi.org/https://doi.org/10.1089/jmf.2013.2818 -
Montefusco, A., Durante, M., Grassi, S., Piro, G., Dalessandreo, G. & Lenucci, M. S.. (2014). Assessment of sweet potato (Ipomoea batatas (L.) Lam.) for bioethanol production in southern Italy. Plant Biosystems, 148, 1117-1126. https://doi.org/10.1080/11263504.2014.965799
» https://doi.org/https://doi.org/10.1080/11263504.2014.965799 -
Nascimento, J. V., Giuliangeli, V. C., Kato, T., Calliari, C. M. & Shirai, M. A.. (2021). Compostos fenólicos e capacidade antioxidante de extratos de flor de Clitoria ternatea L. Research, Society and Development, 10(11), 1-7. https://doi.org/10.33448/rsd-v10i11.19450
» https://doi.org/https://doi.org/10.33448/rsd-v10i11.19450 -
Santos, J., Souza, D. C. L., Santana, M. M., Castro, A. A. & Silva, G. F.. (2012). Estudo da cinética de secagem de batata-doce (Ipomoea batatas). Revista Brasileira de Produtos Agroindustriais, 14(4), 323-328. https://doi.org/10.15871/1517-8595/rbpa.v14n4p323-328
» https://doi.org/https://doi.org/10.15871/1517-8595/rbpa.v14n4p323-328 -
Savas, E.. (2022). The modelling of convective drying variables’ effects on the functional properties of sliced sweet potatoes. Foods, 11(5), 1-16. https://doi.org/10.3390/foods11050741
» https://doi.org/https://doi.org/10.3390/foods11050741 - Silva, E. S., Oliveira, J., Machado, A. V. & Costa, R. D.. (2015). Secagem de grãos e frutas: Revisão bibliográfica. Revista Brasileira de Agrotecnologia, 5(1), 19-23.
-
Silva, L. M. M., Souza, F. C., Souza, E. P., Mata, M. E. R. M. C. & Duarte, M. E. M.. (2014). Modelos de predição da cinética de secagem dos grãos de guandu. Brazilian Journal of Food Technology, 17(4), 310-318. https://doi.org/10.1590/1981-6723.3014
» https://doi.org/https://doi.org/10.1590/1981-6723.3014 -
Silva, P. I. S., Oriente, S. F., Ramos, N. J. S., Gouveia, D. S., Mota, M. M. A. & Rodrigues, C. G.. (2018). Aplicação de modelos matemáticos no estudo da cinética de secagem da casca da batata-doce (Ipomoea batatas). IV Encontro Nacional da Agroindústrias, 1, 97924, 1-7. https://doi.org/10.17648/enag-2018-91646
» https://doi.org/https://doi.org/10.17648/enag-2018-91646 - Silveira, M. A., Souza, F. R., Alvim, T. D., Dias, L. E., Santana, W. R., Vital, M. D. & Costa, D. M. (2016). A cultura da batata-doce como fonte de matéria prima para produção de etanol. Boletim Técnico UFT. Laboratório de Sistemas de Produção de Energia a Partir de Fontes Renováveis - LASPER/UFT.
-
Singleton, V. L. & Rossi, J. A.. (1965). Colorimetry of total phenolics with phosphomolybdic-phosphotungstic acid reagents. American Journal of Enology and Viticulture, 16(3), 144-158. https://doi.org/10.5344/ajev.1965.16.3.144
» https://doi.org/https://doi.org/10.5344/ajev.1965.16.3.144 -
Souza, D. G., Resende, O., Moura, L. C., Ferreira Junior, W. N. & Andrade, J. W. S.. (2019). Drying kinetics of the sliced pulp of biofortified sweet potato (Ipomoea batatas L. ). Engenharia Agrícola, 39(2), 176-181. https://doi.org/10.1590/1809-4430-Eng.Agric.v39n2p176-181/2019
» https://doi.org/https://doi.org/10.1590/1809-4430-Eng.Agric.v39n2p176-181/2019 -
Sun, H., Mu, T., Xi, L., Zhang, M. & Chen, J.. (2014). Sweet potato (Ipomoea batatas L. ) leaves as nutritional and functional. Food Chemistry, 156(1), 380-389. https://doi.org/10.1016/j.foodchem.2014.01.079
» https://doi.org/https://doi.org/10.1016/j.foodchem.2014.01.079 -
Taylor, R.. (1990). Interpretation of the correlation coefficient: A basic review. Journal of Diagnostic Medical Sonography, 6(1), 35-39. https://doi.org/10.1177/87564793900060010
» https://doi.org/https://doi.org/10.1177/87564793900060010 -
Tejeda, L., Mollinedo, P., Aliaga-Rossel, E. & Peñarrieta, J. M.. (2020). Antioxidants and nutritional composition of 52 cultivars of native Andean potatoes. Potato Research, 63, 579-588. https://doi.org/10.1007/s11540-020-09458-w
» https://doi.org/https://doi.org/10.1007/s11540-020-09458-w -
Thaipong, K., Boonprakob, U., Crosby, K., Cisneros-Zevallos, L. & Byrne, D. H.. (2006). Comparison of ABTS, DPPH, FRAP, and ORAC assays for estimating antioxidant activity from guava fruit extracts. Journal of Food Composition and Analysis, 19(6-7), 669-675. https://doi.org/10.1016/j.jfca.2006.01.003
» https://doi.org/https://doi.org/10.1016/j.jfca.2006.01.003 -
Viana, K. M., Rigueto, C. V. T., Borges, R. T., Ribeiro, C. R. M. & Geraldi, C. A. Q.. (2018). Extração e estudo da cinética de secagem da fécula da batata-doce. Natural Resources, 8(1), 1-8. https://doi.org/10.6008/CBPC2237-9290.2018.001.0001
» https://doi.org/https://doi.org/10.6008/CBPC2237-9290.2018.001.0001 -
Yang, J., Chen, J., Zhao, Y. & Mao, L.. (2010). Effects of drying processes on the antioxidant properties in sweet potatoes. Agricultural Sciences in China, 9(10), 1522-1529. https://doi.org/10.1016/S1671-2927(09)60246-7
» https://doi.org/https://doi.org/10.1016/S1671-2927(09)60246-7 -
Zhu, Z., Guan, Q., Koubaa, M., Barba, F. J., Roohinejad, S., Cravotto, G., Yang, X., Li, S. & He, J.. (2017). HPLC-DAD-ESI-MS² analytical profile of extracts obtained from purple sweet potato after green ultrasound-assisted extraction. Food Chemistry, 215, 391-400. https://doi.org/10.1016/j.foodchem.2016.07.157
» https://doi.org/https://doi.org/10.1016/j.foodchem.2016.07.157
Edited by
-
Associate Editor in charge:
Alessandro Lucca BracciniCarlos Alberto Scapim