
 EFFICIENCY ASSESSMENT OF BRAZILIAN UNIVERSITIES: A DATA ENVELOPMENT ANALYSIS MODEL
Abstract
This article assesses the efficiency of 53 Brazilian federal universities, aiming to establish targets that enable these institutions to achieve greater efficiency. The study employs Data Envelopment Analysis (DEA) with constant returns to scale, using management indicators defined by the Brazilian Federal Court of Accounts (TCU) for the year 2017 as inputs and outputs. The findings reveal that 35.48% of large universities and 31.82% of medium-sized universities met the efficiency criteria. The results propose specific targets for each inefficient institution to improve its performance, with the goal of increasing graduation success rates and the overall evaluation by the Coordination for the Improvement of Higher Education Personnel (CAPES). It is concluded that the majority of universities deemed efficient are located in the Southern and Southeastern regions of Brazil.
Keywords:
data envelopment analysis; efficiency; federal universities.
Resumo
Este artigo avalia a eficiência de 53 universidades federais brasileiras, com o objetivo de estabelecer metas que permitam a essas instituições alcançar maior eficiência. Utilizando a Análise Envoltória de Dados (DEA) com retornos constantes de escala, foram considerados como entradas e saídas os indicadores de gestão estipulados pelo Tribunal de Contas da União (TCU) para o ano de 2017. Constatouse que 35,48% das grandes universidades e 31,82% das universidades de médio porte atenderam aos critérios de eficiência. Os resultados sugerem metas específicas para que cada instituição que não atingiu a eficiência possa melhorar seu desempenho, com vistas a aumentar suas taxas de sucesso na graduação e a avaliação geral pela Coordenação de Aperfeiçoamento de Pessoal de Nível Superior (CAPES). Conclui-se que a maioria das universidades consideradas eficientes está localizada nas regiões Sul e Sudeste do Brasil.
Palavras-chave:
análise envoltória de dados; eficiência; universidades federais.
Resumen
Este artículo evalúa la eficiencia de 53 universidades federales brasileñas, con el objetivo de establecer metas que permitan a estas instituciones alcanzar una mayor eficiencia. Utilizando el Análisis Envolvente de Datos (DEA) con retornos constantes de escala, se consideraron como insumos y productos los indicadores de gestión estipulados por el Tribunal de Cuentas de la Unión (TCU) para el año 2017. Se constató que el 35,48% de las universidades grandes y el 31,82% de las universidades de tamaño mediano cumplieron con los criterios de eficiencia. Los resultados sugieren metas específicas para que cada institución ineficiente pueda mejorar su desempeño, con vistas a aumentar sus tasas de éxito en la graduación y la evaluación general por la Coordinación de Perfeccionamiento de Personal de Nivel Superior (CAPES). Se concluye que la mayoría de las universidades consideradas eficientes se encuentran en las regiones Sur y Sudeste de Brasil.
Palabras clave:
análisis envolvente de datos; eficiencia; universidades federales.
1 INTRODUCTION
Issues related to performance and efficiency evaluation have become increasingly relevant in the context of Brazilian Federal Universities (IFES). During the 1980s and 1990s, the assessment process in higher education was strengthened through the development of systems aimed at evaluating student performance and systematizing indicators related to institutional conditions, such as infrastructure, human resources, and, in particular, faculty qualification. Among the instruments used during this period were the Institutional Evaluation Program of Brazilian Universities (PAIUB) and the National Examination of Courses, which adopted different assessment approaches. PAIUB focused on institutional self-assessment and encouraged universities to identify their own weaknesses, whereas the National Examination of Courses, better known as Provão, aimed to measure graduating students’ level of knowledge in relation to curricular guidelines.
At the beginning of the 21st century, the National Higher Education Assessment System (SINAES), established by Law No. 10,861 of April 14, 2004, consolidated a new normative framework for higher education assessment in Brazil. In contrast to previous initiatives such as PAIUB and the National Examination of Courses, SINAES organized the evaluation of institutions, undergraduate courses, and student performance in an integrated manner, under the coordination of the Ministry of Education. Its assessment approach was based on broad dimensions, including teaching, research, extension, social responsibility, institutional management, faculty, facilities, and student performance (Brasil, 2004).
In this same context, the Federal Court of Accounts (TCU), whose main role is to oversee the use of public resources and verify the regularity, legitimacy, and efficiency of public management, defined, through Decision 408/2002 (Brasil, 2002), a set of performance indicators to be included in the Management Reports of federal universities. These indicators were intended to support external control and the historical monitoring of institutional performance indexes.
These assessments are composed of performance indicators that allow analyzing the quality of higher education institutions in Brazil. The information that is obtained with these indexes can guide the IFES in the creation of public policies aimed at improving undergraduate and graduate courses, strengthening research, as well as improving the organization. In view of this situation, it is extremely important that the focus of federal public institutions be on the development of quality indicators that promote a clear interpretation of the data and make it possible to analyze the efficiency and productivity of the actions performed, to optimize the available resources, directing them those for the priority areas that were detected in the evaluation process.
Megginson, Mosley and Pietri (1998) define efficiency as the relationship between input and product (input and output). An efficient institution achieves higher products (results, productivity, performance) related to the inputs (labor, material, money, machines, and time) necessary to achieve them. The organization that minimizes the cost of the resources used to reach a certain purpose is considered efficient or can maximize the results with a certain amount of inputs.
Ferreira and Gomes (2012) argue that from an economic point of view, efficiency is a relative concept defined by the comparison between different production units that use the same inputs to produce the same product. Tupy and Yamaguchi (1998) complement that the efficiency of a productive unit, is understood as a comparison between observed values and optimum values of inputs and products. This comparison can take the form of a relationship between the quantity of the product obtained and its maximum level, given the quantity of the input used, or the relationship of the quantity of input used and its minimum required to produce, given the quantity of product obtained, or some combination of the two.
Given this context, the research objective is to analyze the efficiency level of Brazilian Federal Universities, through the projection of the production frontier of each Higher Education Institution and later to verify the Federal Higher Education Institutions that are benchmarks for the other IFES inefficient, in addition to determining the goals that non-efficient IFES need to reach to reach the production frontier.
2 METHODOLOGY
2.1 Data Envelopment Analysis
As a model of quantitative analysis, an application of Data Envelopment Analysis (DEA) was carried out, with the aim of evaluating the efficiency of Federal Universities, as well as identifying which were the inefficient units and what they needed to do to improve their performance.
Amaral (1999) reports that Data Envelopment Analysis is a non-parametric method that allows to evaluate the relative efficiency of the so-called Decision-Making Units - DMU's, where each unit is characterized by an operation plan that relates the quantities of inputs consumed and the products (output) generated. Efficiency is relative because it compares the productivity of the DMU° executed plan (observed) in relation to the productivity of the operation plans executed by the other DMU’s.
In 1978, Charnes, Cooper and Rhodes developed a technique for constructing production frontiers and efficiency indicators, using multiple inputs and outputs. This technique, known as Data Envelopment Analysis (DEA), aims to compare several Decision-Making Units (DMUs) that perform similar tasks but differ in the quantities of inputs they consume and outputs they produce.
The authors note that there are various formulations of DEA models. This research employs the CCR model, also referred to as the CRS (Constant Returns to Scale) model, which evaluates total efficiency, identifies both efficient and inefficient DMUs, and measures the distance of the inefficient units from the linear efficiency frontier.
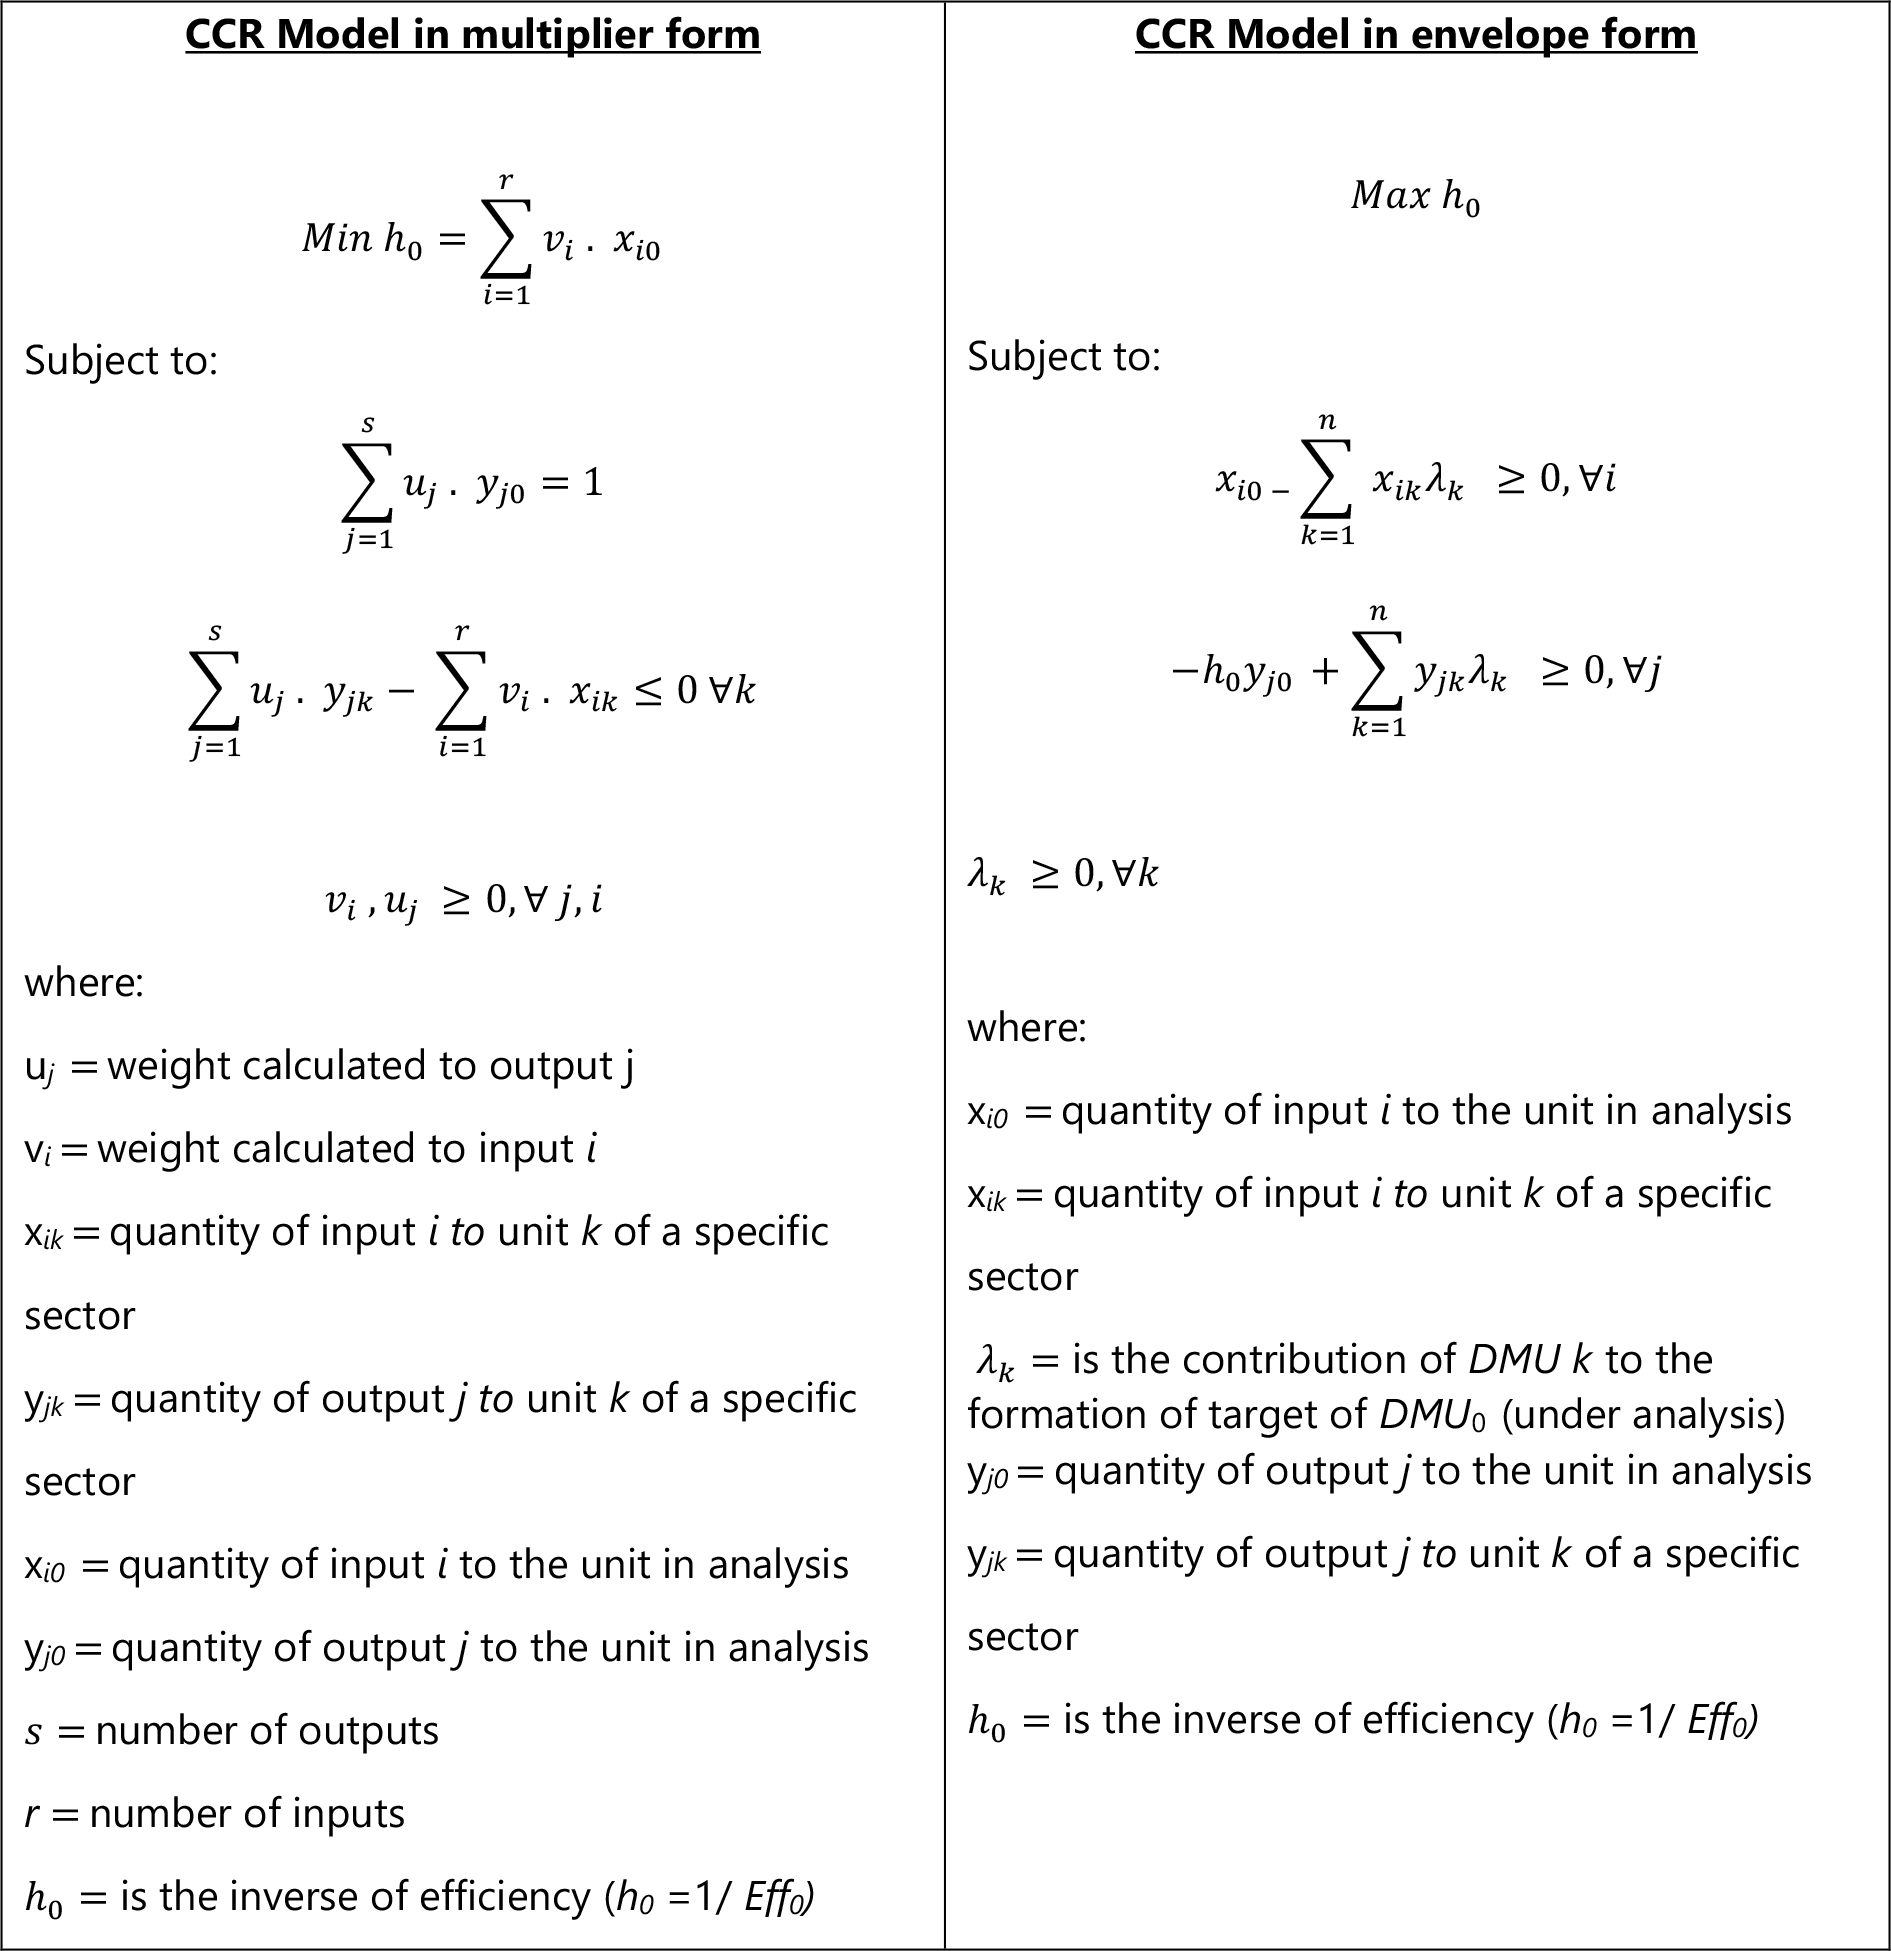
When it comes to formulations, being radial models, there is also a need to fix the analysis perspective (input orientation or output orientation). In this article, the choice was made to orient towards outputs since the objective is to keep the quantity of inputs unchanged while seeking greater production of outputs. Table 1 presents the model's calculation format as a mathematical programming problem. In the model in the form of multipliers, weights are decision variables and contribute to cases where inputs and outputs may have different orders of magnitude. The envelope model allows to determine the goals for each inefficient DMU to become efficient, as well as to identify which efficient units are considered benchmarks for non-efficient units. Then, in the envelope model, the benchmarks of inefficient units are those in which the ʎ (lambda) coefficients obtained are different from zero.
It is important to understand that the standard boundary model allows each DMU to choose the weights for each variable in a way that improves its result, and the DMU will choose weights that favor its efficiency, reducing the discrimination power of the models by pointing out many DMU's in the set as being efficient. This benevolence is limited in the CCR and BCC models in which many units are considered efficient, generating many ties at the level of 100% efficiency (Ferreira; Gomes, 2012).
To improve this model discrimination problem, Mello et al. (2005) presents the concept of inverted frontier in which it offers a solution when exchanging inputs for outputs of the original model. This inverted frontier is made up of DMU’s with the worst management practices (and can be called an inefficient frontier). It can also be said that DMU's belonging to the inverted border have the best practices from an opposite perspective. For this reason, the author proposes that to DMU’s, an aggregate efficiency index must be calculated, which is the arithmetic mean between efficiency in relation to the original frontier and inefficiency in relation to the inverted frontier.

CCR models in the form of multipliers and in the form of the envelope according to Mello et al. (2005) oriented to outputs
There is yet another solution that can be applied called the compound frontier in which the composite efficiency scores are obtained through the arithmetic mean between the standard efficiency and the inefficiency (1 minus efficiency) related to the inverted frontier. Finally, there is still the possibility of normalizing these scores, dividing all these efficiency scores by the highest score found (Mello et al., 2008).
2.2 Empirical research procedures
The main source of data used to choose the variables inputs and outputs was the Annual Management Report of the Federal Court of Accounts for the 2017 information, which include the performance indicators defined by the Brazilian Federal Court of Accounts (TCU) for monitoring the management of these institutions
The survey comprised 53 (fifty-three) of the total number of Brazilian Federal Universities. After a review of studies on the application of Data Envelopment Analysis in Higher Education in recent years, it was decided to use the variables employed by Costa et al. (2012):
Outputs:
Graduation Success Rate (TSG) Concept for Graduate Studies (CAPES) Inputs:
Current Cost / Equivalent Student (CCAE)
Full Time Student / Equivalent Teacher (ATIPE)
Full Time Student / Equivalent Employee (ATIFE)
Faculty Qualification Index (IQCD)
To meet the objectives of this work, it was considered the orientation to outputs, that is, to the product generated, the Capes / MEC Concept for Graduate Studies and the Graduate Success Rate. Since when it comes to providing public service as universities are, the inputs are difficult to change, as there are legal standards to be followed in the IFES, such as the Annual Budget Law that is defined according to federal government criteria, as well as the form of entry of technicians and teachers at the university through a public tender, which imposes legal procedures for increasing and reducing staff.
To minimize problems related to the heterogeneity of IFES, this work sought to insert a complementary technique called cluster analysis or cluster analysis. In this research, after delimiting the sample with 53 (fifty-three) Federal Institutions of Higher Education, these were divided into two groups to classify the proximity between them, considering two variables in this process. The Teaching Staff Qualification Index (IQCD) and CAPES Concept variables were used for Graduate Studies.
The similarity between the samples was calculated in the IBM SPSS software based on the Euclidean distance, using the hierarchical grouping by the Ward method. The Ward method is a hierarchical grouping procedure in which the similarity measure used to join clusters is calculated as the sum of squares between the two groupings made over all variables. This method tends to result in clusters of approximately equal sizes due to its minimization of internal variation (Anderson, 2005).
After the result of the IFES grouping, the performance indicators of each decisionmaking unit (university) delimited in the study were processed in the SIAD v.3.0 software (Integrated Decision Support System). SIAD v.3.0 was produced by researchers from the Universidade Federal Fluminense and made available at the link http://www.professores.uff.br/joaocsmello/?ddownload=246 using the CCR model (constant return of scale) with orientation to the output (Meza et al., 2005).
3 RESULTS AND DISCUSSIONS
3.1 Analysis of the efficiency of Brazilian Federal Universities
After performing the cluster analysis with the sample of 53 IFES, Table 1 shows the formation of the two groups, after analyzing the dendrogram, and the average values of the two variables used in the conglomerate.
Table 2 shows the scores calculated for standard efficiency, inverted efficiency, composite efficiency and for the normalized composite efficiency of the IFES in Group 1. The result showed that eleven universities with score 1 were considered efficient: UFMG, UFCG, UFPR, UFRJ, UFRGS, UFV, UNB, UFPA, UFJF, UTFPR and UFPEL which represent 35.48% of the total IFES in Group 1.
Continuing the analysis of Table 2 referring to Group 1, we have that IFES with scores below 1 in the standard efficiency result were considered by the method as inefficient, in the total of 20 (twenty) Educational Institutions, even with the lowest weights advantageous processed by the model. 64.52% of the total of thirty-one IFES in Group 1 are represented, and the three universities with the lowest indexes were UFF with 0.76, FURG with 0.80 and UFPB with 0.82.
Table 3 shows the scores calculated for standard efficiency, inverted efficiency, composite efficiency and for the standardized composite efficiency of the IFES in Group 2, which is the group with the lowest average in the graduate indexes. The result achieved in the standard efficiency item shows that 07 (seven) federal universities were considered efficient with a score of 1: UFPI, UFERSA, UFVJM, UNIVASF, UFRA, UFSJ and UNIFAL, representing 31.82% of the total IFES in Group 2.
It is also verified that the 15 (fifteen) IFES considered inefficient by the standard model, which represent 68.18% of the total of twenty-two universities in Group 2, with emphasis on the three with the lowest indexes, the UFFS with 0.80, UFAC with 0.81 and UFS with 0.87, according to Table 3.
It is important to understand that the benchmarks of inefficient units are determined by their projection on the efficiency frontier, the benchmark being a unit in which the other inefficient unit can mirror itself. These references for inefficient units are those in which the obtained coefficients are different from zero and the benchmarks of the units considered efficient are themselves. Table 4 presents the result of the references in Group 1 and Table 5 for Group 2.
It is noticeable that the applied model resulted in several benchmarks for each inefficient IFES, some with strong partnership indexes and others with weak indexes, but the important thing is to understand that the non-efficient units, through the result of these references, consider the efficient IFES as references to followed to improve their performance indicators.
According to Table 6 for Group 1 described, the current values of inputs and the desirable values for these inputs are presented. These targets or targets are calculated with a view to projecting inefficient IFES at the efficiency frontier, considering their benchmarks. A reference is considered for the expected values, for each input and output in a situation in which the inefficient university, according to the model, becomes efficient.
Interpreting the result in Table 6, it is analyzed that, in relation to the outputs produced, the inputs CCAE, ATIFE, ATIPE or IQCD, in some cases, are higher than necessary in relation to the performance of the set of IFES analyzed. The use of the DEA model does not allow us to request that this factor never suffer an indication of decrease, which should always be remembered when interpreting the data.
Even with the suggestions for decreasing some of the inputs of some IFES analyzed, the model requested goals or targets for all CAPES and TSG outputs, which is the main objective of the analysis of the inefficient ones, that is, considering their benchmarks, an increase in products was proposed for reach the production frontier. A percentage was defined for the outputs of each analyzed inefficient institution.
In the general analysis of Table 6, there is a variation in the results suggested by the model, but in all cases, there is a recommendation to increase TSG and CAPES, which are the main goals for inefficient institutions to reach the production frontier. In some variables, the reduction in inputs was suggested, however, the reductions and additions requested were based on the benchmarks of each inefficient IFES. What can be interpreted in these data is that even with excess inputs presented by inefficient IFES, it did not imply improvements in the Capes Concept and in the Graduation Success Rate. In the case of the excess of IQCD, it can be interpreted as underutilization of qualified teachers.
In relation to Table 7, the DEA-CCR also recommended goals to be achieved for inefficient universities. It can be seen in the results of Group 2 that in some cases it was also proposed to reduce inputs, in addition to the increase in products already expected by the model. The results of the model suggested a reduction in the inputs CCAE, ATIPE, ATIFE, that is, it was shown that there are excesses in the indicators Current Cost per Equivalent Student, Full Time Student per Equivalent Teacher and Full Time Student per Equivalent Employee.
It can also be seen in Table 7 that, the model proposed to all inefficient IFES, additions to all CAPES and TSG variables, which is the main objective of the outputoriented model. It is observed that, in all cases when recommending this reduction of inputs, the model may be demonstrating that these institutions presented difficulties in the optimization of their resources to maximize their products, since when calculating productivity and comparing them to their benchmarks failed to reach the efficiency frontier.
It can be inferred from these excesses of ATIFE and ATIPE as a model suggestion for the IFES to review their structures, that is, to analyze whether the student / teacher or student / employee relationship is compromising the result of their productivity. In the case of excess CCAE, that is, Student Cost can be interpreted as a recommendation of the method that IFES should review their priorities with public policies adopted to improve their productivity.
On the one hand, the most favorable regional economic conditions are expected to play a part in the efficiency standards of universities in Brazil. For example, it is a plausible hypothesis to suppose that the IFES in the center of southern Brazil are more "efficient" than universities located in the North and Northeast of Brazil. However, there may be successful higher education institutions due to their management and the contingent conditions that surround them.
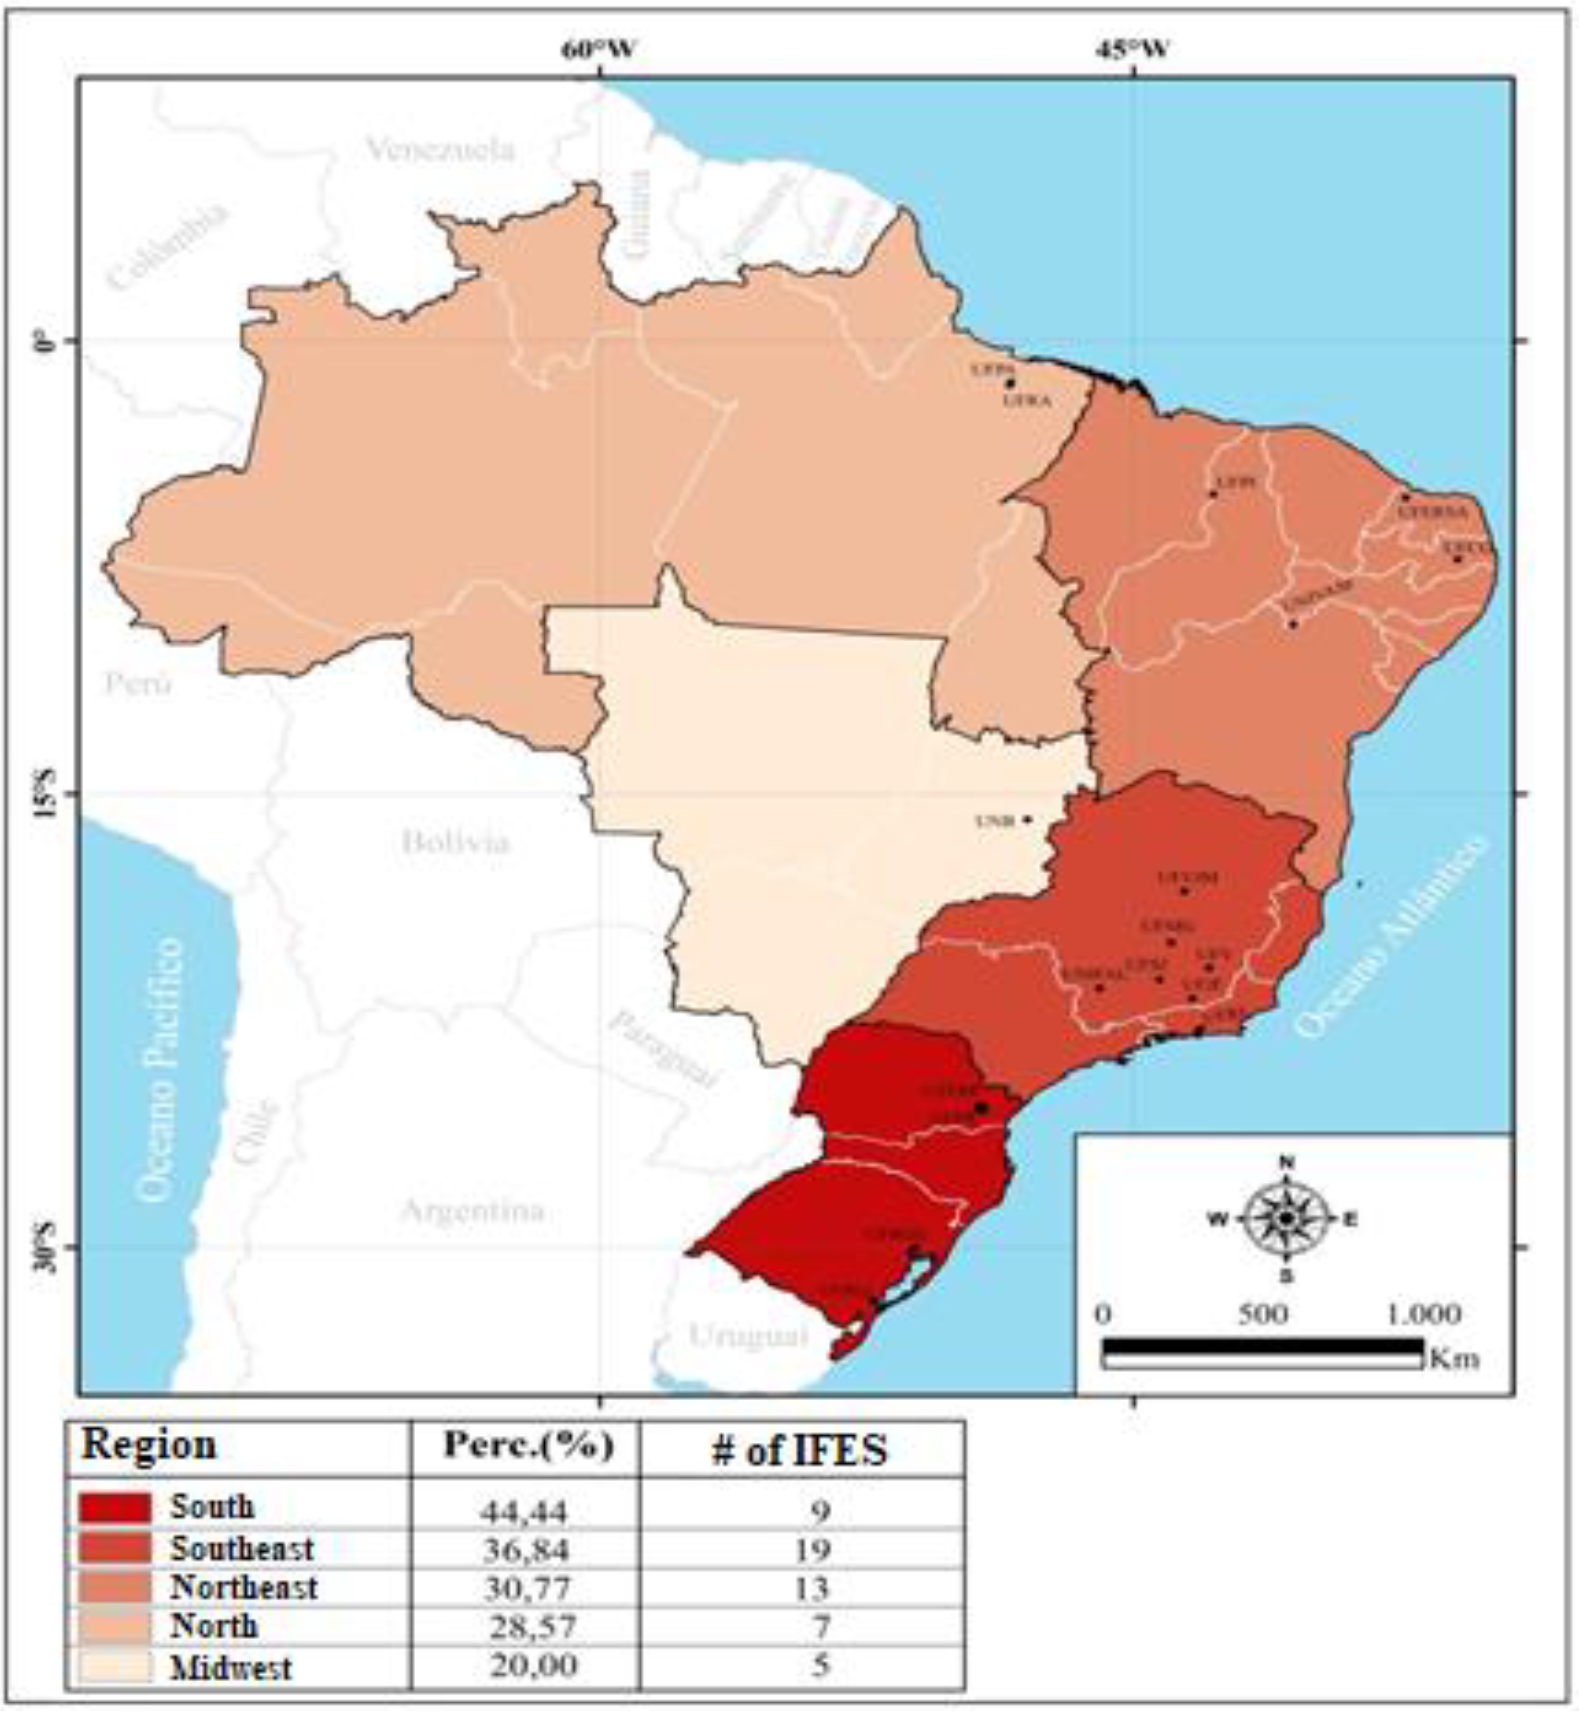
As shown in Figure 2, the results of this research demonstrate that in relative terms the largest number of efficient universities is concentrated in the South Region, that is, of the total of 9 (nine) of IFES that are in the South Region, 44.44% were considered efficient. Next is the Southeast Region, which out of a total of 19 (nineteen) Federal Institutions of Higher Education 36.84% were defined as efficient by the standard result. In the Northeast Region, 30.77% of the total of 13 (thirteen) IFES was efficient, while in the North Region, of the total of 07 (seven) IFES, also 28.57% was efficient. Finally, in the Midwest, 20% of the total of 05 (five) IFES was considered efficient.
Another issue to consider when analyzing Figure 2 is that with the process of regional deconcentrating of higher education, in the last fifteen years, many mediumsized universities have excelled in terms of efficiency and resource optimization. As was shown in the research among the IFES considered efficient, UFERSA and UNIVASF are in cities far from large urban centers in the Northeast Region, with UFERSA headquartered in Mossoró-RN, and UNIVASF in the city of Petrolina-PE. In the Southeast Region, the UFVJM universities that have headquarters in the city of Diamantina, UNIFAL, in Alfenas and UFSJ in São João Del Rei, all in the state of Minas Gerais, stand out. All these institutions, which according to the study analyzed, were efficient in their management, especially regarding good rates in graduate school, considering the local reality of each one.
What can be inferred from this, is that in Brazil when universities were created or only campuses in regions with good demographic density, but with low university coverage, it is evident that, even in cities with less purchasing power or with less favorable socioeconomic indexes, it was possible to result in good institutions of higher education.
4 FINAL REMARKS
The objective of this research was to analyze the efficiency level of Brazilian Federal Universities. For this, a sample with 53 IFES was used. The applied methodology was the Data Envelopment Analysis, CCR model (constant scale returns) and the cluster analysis. In order to homogenize the sample, it was divided into two groups, the first group with the highest rates in research and graduate studies and the second group focusing more on teaching. The indicators chosen for the survey were recommended by the Federal Court of Accounts, with four inputs (CCAE, ATIPE, ATIFE, IQCD) and two outputs (CAPES, TSG).
The results of the standard efficiency found showed that in Group 1 the model presented 11 (eleven) efficient IFES. In Group 2, it resulted in 07 (seven) efficient Universities. In Group 1, the institutions considered efficient were UFMG, UFCG, UFPR, UFRJ, UFRGS, UFV, UNB, UFJF, UFPEL, UTFPR and UFPA representing 35.48% of the total group. In Group 2, the ones considered efficient were UFPI, UFERSA, UFVJM, UNIVASF, UFRA, UFSJ and UNIFAL, which represents 31.82% of the total of Group 2. In the normalized compound efficiency, UFMG was considered highly efficient in Group 1 when obtaining score 1, and in Group 2 UFPI also obtained this score and it is also delimited with high efficiency.
Also, according to the DEA-CCR model, the standard frontier, efficient Universities with a score of 1 became possible benchmarks for inefficient IFES. According to Group 1, UFPEL was considered a reference for 18 (eighteen) non-efficient units, while UFMG was an excellent partner for 16 (sixteen) inefficient units and UFRGS for 09 (nine) IFES, which can be explained by the high indexes Capes Concept and Graduation Success Rate of these institutions. In Group 2, the IFES considered benchmarks for the other inefficient ones were UFERSA being a reference for 15 (fifteen) inefficient units, UFPI considered a benchmark for 10 (ten) units and UFVJM an excellent partner for 7 (seven) inefficient IFES.
Regarding the goals or targets that the DEA-CCR model suggested to inefficient institutions that, to reach the production frontier, they should in all cases increase their Capes Concept and the Graduation Success Rate, varying according to each IFES in relation to comparison with its benchmarks. Result that can contribute to the management of these universities to evaluate their actions and improve their planning and thus increase the efficiency of their bodies.
It is important to note that, in the total of 53 Universities surveyed, 35 IFES, according to the standard frontier, were defined as inefficient, that is, those that did not reach score 1. One of the ways that can lead to improving the indexes of these institutions is to increase the Graduation Success Rates, which includes training in teaching, and the Capes Concept, which evaluates graduate studies and research. It is suggested that there is an internal evaluation of these indexes and that they be invested in public policies aimed at improving these indicators, mainly in the case of TSG, in which, one of the problems of this indicator is due to the high rate of dropout and retention in Higher Education Institutions, that is, many students drop out or fail during their undergraduate periods.
Regarding the result of university performance by region, it was found that the largest number of efficient universities is in the South and Southeast. However, one should not disregard the fact that some universities considered to be medium-sized have excelled in optimizing their resources even though they are in areas with lower socioeconomic indexes such as UFERSA located in Mossoró-RN, or UFVJM in DiamantinaMG.
It is important in this context that federal educational institutions find optimizing strategies in the management of undergraduate and graduate courses with a view to increasing their productivity, according to the regional vocations of each institution and its region of coverage.
AI USE STATEMENT
The artificial intelligence tool ChatGPT was used to assist with the technical and grammatical revision of the text during its translation from Portuguese into English.
DATA AVAILABILITY STATEMENT
The complete dataset supporting the findings of this study has been published within the article itself.
References
- AMARAL, Odete dos Santos et al. Avaliação da eficiência produtiva das unidades acadêmicas da Universidade do Amazonas, nos anos de 1994 e 1995, empregando análise envoltória de dados. 1999. Dissertação (Mestrado) - Universidade Federal de Santa Catarina, Centro Tecnológico, Florianópolis, 1999.
- ANDERSON, Rolph E. et al. Análise multivariada de dados Porto Alegre: Bookman, 2005.
- BRASIL. Lei nº 10.861, de 14 de abril de 2004 Institui o Sistema Nacional de Avaliação da Educação Superior - SINAES. Brasília, DF: Presidência da República, 2004.
- BRASIL. Tribunal de Contas da União - TCU. Decisão 408 - Plenário. Relatório Consolidado de Auditoria Operacional. Brasília, DF, 2002.
-
CHARNES, Abraham; COOPER, William W.; RHODES, Edwardo. Measuring the efficiency of decision making units. European Journal of Operational Research, Amsterdam, v. 2, n. 6, p. 429-444, 1978. DOI: 10.1016/0377-2217(78)90138-8. Disponível em: https://www.sciencedirect.com/science/article/abs/pii/0377221778901388 Acesso em: 6 jun. 2024.
» https://doi.org/10.1016/0377-2217(78)90138-8.» https://www.sciencedirect.com/science/article/abs/pii/0377221778901388 -
COSTA, Edward Martins et al. Eficiência e desempenho no ensino superior: uma análise da fronteira de produção educacional das IFES brasileiras. Revista de Economia Contemporânea, Rio de Janeiro, v. 16, n. 3, p. 415-440, 2012. DOI: 10.1590/S1415-98482012000300003. Disponível em: https://www.scielo.br/j/rec/a/VMp6StXRyHq9f7MYgS53BPb/?format=html⟨=pt Acesso em: 6 jun. 2024.
» https://doi.org/10.1590/S1415-98482012000300003.» https://www.scielo.br/j/rec/a/VMp6StXRyHq9f7MYgS53BPb/?format=html⟨=pt - FERREIRA, Carlos Marinho de Carvalho; GOMES, Adriano Provenzano. Introdução à análise envoltória de dados: teoria, modelos e aplicações. Viçosa, MG: Editora UFV, 2012.
- MEGGINSON, Leon C.; MOSLEY, Donald C.; PIETRI, Paul H. Administração: conceitos e aplicações. São Paulo: Harbra, 1998.
- MELLO, J. C. C. B. S. et al. Curso de análise envoltória de dados. In: SIMPÓSIO BRASILEIRO DE PESQUISA OPERACIONAL, 37., 2005, Gramado, RS. Anais [...] Gramado, RS, 2005.
-
MELLO, J. C. C. B. S. et al. DEA Advanced Models for Geometric Evaluation of used Lathes. WSEAS Transactions on Systems, Athens, v. 7, n. 5, p. 510-520, 2008. Disponível em: https://dl.acm.org/doi/abs/10.5555/1456007.1456017 Acesso em: 6 jun. 2024.
» https://dl.acm.org/doi/abs/10.5555/1456007.1456017 -
MEZA, Lidia Angulo et al. ISYDS-Integrated System for Decision Support (SIADSistema Integrado de Apoio à Decisão): a software package for data envelopment analysis model. Pesquisa Operacional, Rio de Janeiro, v. 25, n. 3, p. 493-503, 2005. Disponível em: https://www.scielo.br/j/pope/a/ZMsS7jdb7r9SxBhFxhmNjKR/?lang=en Acesso em: 6 jun. 2024.
» https://www.scielo.br/j/pope/a/ZMsS7jdb7r9SxBhFxhmNjKR/?lang=en - TUPY, Oscar; YAMAGUCHI, Luís. Eficiência e produtividade: conceitos e medição. Agricultura em São Paulo, São Paulo, 1998.

 Source: own elaboration
 Source: Research Data (2020)