 Association of Morpho-Physiological Traits to Identify Salinity Tolerance in Newly Developed Sugarcane Genotypes
Abstract
Sugarcane is severely impacted by abiotic stresses and is cultivated across various agro-climatic environments. Hence, to evaluate the potential of twenty-four co-canes, we conducted an experiment under three levels of saline water irrigation viz., 4, 8 and 12 dS m-1 ECiw along with control (ECiw ~ 0.4). Leaf chlorophyll content and SPAD index constantly decreased with increase in irrigation water salinity along with RWC which reduced by 3.88%, 12.51 % and 20.23% under 4, 8 and 12 dS m-1 ECiw, respectively. Similarly, gas exchange attributes (Pn, gS, E) decreased in the range of 8 - 10%; 20 - 30% and 35 - 47% respectively. On an average, Na+ ions accumulated in range of 0.478 - 1.194% and K+ content reduced by 25.09 - 56.27% under 4, 8, 12 dS m-1 ECiw, respectively. Sugar yield (CCS %) declined to 21.71, 53.08 and 67.38% and cane yield (t ha-1) reduced by 19.34, 50.43 and 64.8 % with irrigation salinity of 4, 8 and 12 dS m-1 ECiw. Based on growth and yield parameters, these co-canes were categorized as tolerant (Co 15023, Co 0238, Co 13035 and Co 0118) and sensitive (Co 14036, Co 12027, Co 14026 and Co 13034). PCA biplot analysis and Association/Cluster analysis using heatmap also categorized these advanced lines into sensitive, moderately tolerant and tolerant category. Additionally, differential expression of salinity-responsive genes (SOS1, SOS2, SOS3, HKT, and NHX1) further distinguished tolerant genotypes like Co 13035 by their enhanced ionic homeostasis under salt stress. Briefly, we can say that physiological and ionic traits are important indictors in governing yield and identified tolerant advanced lines can be leveraged in hybridization programs aimed at developing new high-yielding, salt-tolerant breeding lines.
Keywords:
Sugarcane; Salinity; Physiology; Na+/K+; Yield; Cluster analysis; Correlations.
HIGHLIGHTS
• Twenty four co-canes were evaluated with four levels of saline irrigation water viz., Control, ECiw ~ 4, 8 and 12 dS m-1.
• Co-canes Co 15023, Co 0238, Co 13035 and Co 0118 showed higher salt tolerance potential than other lines and maintain higher physiological traits along with yield.
• Co-canes Co 14036, Co 12027, Co 14026 and Co 13034 were highly sensitive towards water salinity.
• These co-canes accumulated Na+ ions in range of 0.478 - 1.194 %, while K+ content reduced by 25.09 - 56.27 % under ECiw ~ 4 dS m-1, ECiw ~ 8 dS m-1 and ECiw ~ 12 dS m-1, respectively.
• The identified sugarcane lines can be promoted further for detailed farmer field trails and can be included in breeding advancement for propagation.
INTRODUCTION
Sugarcane (Saccharum spp.) is a member of the Poaceae family and ranks amongst the top ten most cultivated crops globally, thriving in tropical and subtropical regions, including areas with limited or inconsistent water availability [1-3]. As a significant cash crop, sugarcane is primarily grown for sugar and ethanol production in these regions [4]. In India, the second-largest sugar producer and consumer globally, sugarcane is grown on approximately 5.0 million hectares, with an average yield of 68 tons ha-1. By 2030, it is projected that the country will need 33.0 million tons of sugar. To meet this demand, sugarcane productivity must increase to 110 tons per hectare, assuming the cultivation area remains steady at 5.0 million hectares.
Sugarcane, classified as a glycophyte, exhibits a high sensitivity to salinity throughout various growth stages. Salt stress can negatively influence the entire crop during critical phases, including germination, seedling, vegetative, and maturity stages. Notably, high salinity during the early growth stages disrupts normal physiological functions and cellular metabolic balance by altering osmotic and ionic regulation [5-6]. Research indicates that salt concentrations exceeding 8 dS m⁻1 can lead to significant reductions in physiological traits and yield, with potential decreases of up to 50% [7-9]. Salinity adversely affects sugarcane yield in two primary ways: it hampers growth rates and overall yield while also disrupting the sucrose accumulation patterns in the stalk. In some cases, salinity can result in stunted growth or complete growth failure, causing yields to drop to 50% or less of their potential [10].
Soil salinization is becoming a rising concern for agriculture, particularly in the world's most productive crop areas. The combination of water scarcity and elevated salinity levels significantly hinders plant growth in these saline-affected areas. Crop yields in various semi-arid and arid zones are being restricted by growing salinity levels caused by irrigation methods. The negative effects of salinity on agricultural productivity manifest in both plant growth and land usability. Among agro-processing industries in India, the sugar industry is the second largest, engaging approximately 45 million farmers and affecting about 7.5% of the rural population. Recent estimates indicate that around 5% of cultivated land is currently impacted by salinity, with projections suggesting that escalating salinization could reduce available agricultural land by 30% within the next 25 years and by up to 50% by 2050 [11-12]. Salinity stress can arise from specific deficiencies or toxicities, or from the accumulation of harmful ions in the root zone [13-14]. Elevated salinity disrupts plant growth and development, resulting in lower photosynthetic efficiency and altered sucrose storage in the stalks. The detrimental impacts of salinity on growth rates, tillering, and reproductive stages ultimately constrain crop yields. Therefore, it is essential to identify promising co-cane varieties from the existing germplasm that can counteract the adverse impact of soluble salts in root zone, thereby sustaining growth and productivity in saline environments.
MATERIAL AND METHODS
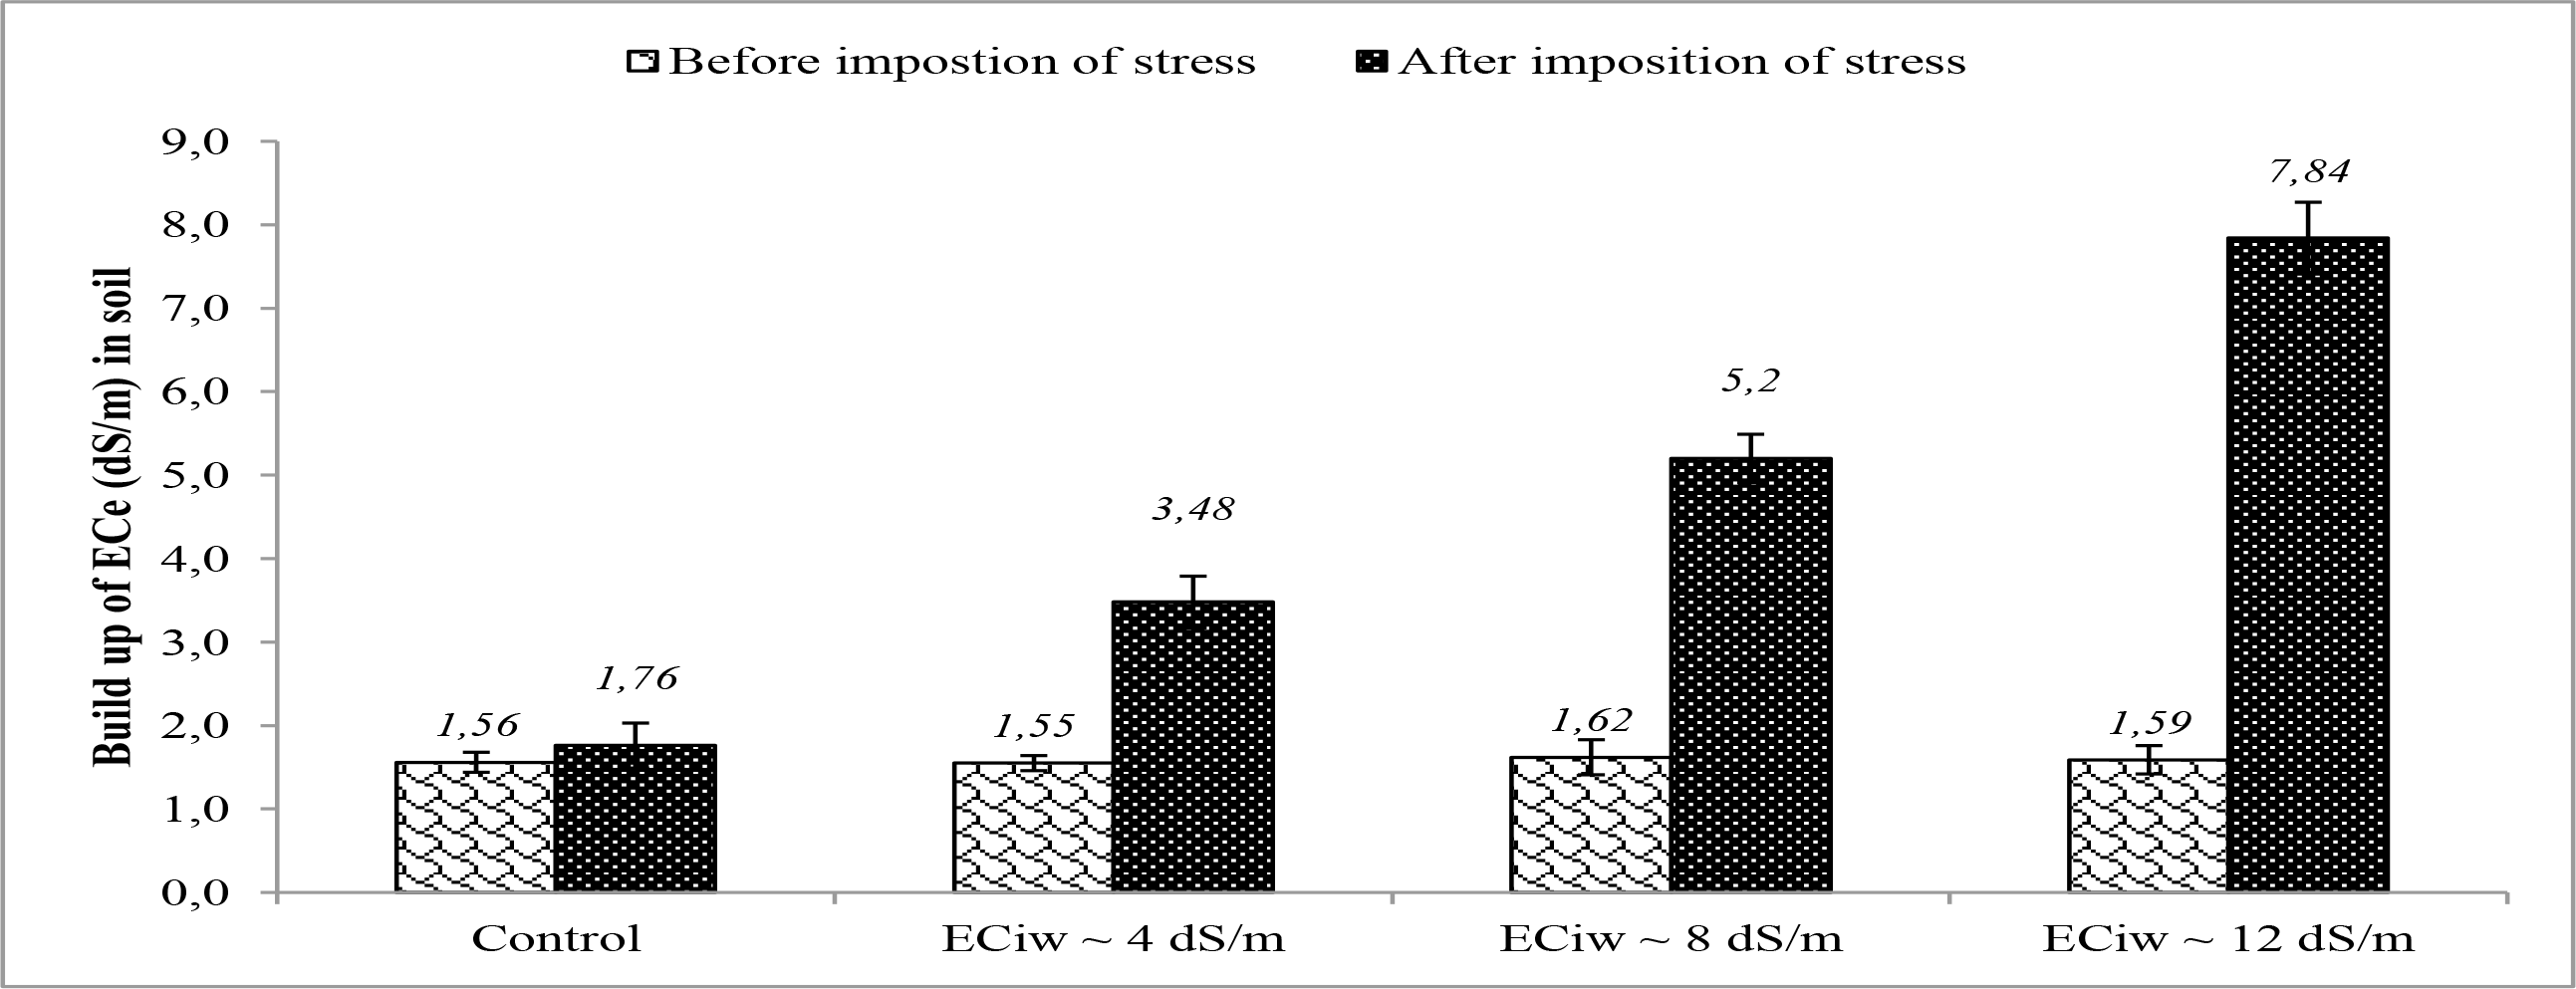
A factorial randomized block design (RBD) experiment was performed over three consecutive years (2015-16, 2016-17, and 2017-18) to evaluate the salt tolerance potential of twenty-four sugarcane lines (Co-canes). During 2015-16, experiment was performed in four replications at natural saline experimental farm of ICAR-CSSRI at Village Nain, Panipat, Haryana [15]. But due to high heterogeneity of soil salinity, the experiment was shifted to ICAR-Sugarcane Breeding Institute, Regional Centre; Karnal has a subtropical, sub-humid climate marked by hot summers during 2016-2017 and 2017-2018. Twenty-four recently developed sugarcane lines were evaluated in round pits of size 60x45 cm under four different levels of saline water i.e. control (best available water), 4, 8 and 12 dS m-1 ECiw. The planting was conducted in early March 2016 using a half ridge irrigation method, utilizing a seed rate of 12 two-budded sets for each genotype. The buds were initially provided with normal irrigation water for one month, with watering intervals of 7 to 10 days to facilitate germination. After 30 days post-planting, natural saline water was collected from the Nain experimental farm in Panipat (Table 1), was applied at 10-day intervals until the onset of the monsoon season. Afterwards, saline irrigation was given till harvesting, as per the requirement of the crop. Initial ECe of soil was 1.51 - 1.62 (0-30 cm) and 2.1-2.56 (30-60 cm) and built up of soil salinity with saline irrigation was measured (Figure 1) after the harvest of sugarcane crop.
Analysis of variance for physiological responses of Co-Cane varieties to salinity induced by irrigation water
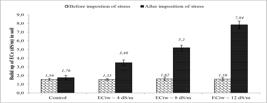
Mean and standard error of Saline water irrigation induced buildup of ECe (dS/m) in pits soil
TVD leaves (Top visible dewlap) were randomly selected, tagged and sampled for analysis of different physiological traits i.e. relative water content (%), chlorophyll content (mg g-1), SPAD reading, gas exchange attributes, ion analysis (Na+ and K+) after 2 months of imposition of salinity stress. The leaf relative water content was measured following Weatherley [16] method. Fully matured TVD leaves were collected, placed in polyethylene bags with humidity control, and transported to the laboratory using ice for preservation. The fresh weight was recorded immediately upon detachment, and the leaves were then immersed in distilled water for duration of 3 h. Once the leaves reached full turgidity, they were reweighed and then dried in an oven at 65°C for 72 h or until a stable dry weight was achieved. To determine relative water content (RWC), the formula [(FW - DW)/ (TW - DW)] x 100 was used. To assess total leaf chlorophyll content (mg g-1 FW) was assessed by incubating 200 mg of chopped leaves in 80% acetone overnight [17] and analyzing the chlorophyll levels at 663 and 645 nm using a UV-VIS spectrophotometer (Analytical Jena, Germany). SPAD readings, reflecting the greenness index of the TVD leaves, were recorded using a SPAD chlorophyll meter (model DualexR Scientific, Force A, Orsay-France). An Infrared Open Gas Exchange System (LI-6400, LICOR Inc., Lincoln, NE, USA) was utilized to measure the gas exchange characteristics, including photosynthetic rate (µmol m-2 s-1), transpiration rate (µmol m-2 s-1), and stomatal conductance (mmol m-2 s-1), between 09:00 AM and 12:00 PM. For analysis of chlorophyll fluorescence (Fv/Fm), the leaves were dark-adapted for 5 min with specialized clips and then evaluated using a Portable Pulse Modulated Fluorescence Measurer (Junior PAM Chlorophyll Fluorometer, Germany). For ion analysis, dried leaf samples underwent acid digestion in 80% nitric acid, and the resulting solution was brought to a final volume of 50 ml using DDW. After filtering the solution through Whatman filter paper no. 1, Na⁺ and K⁺ levels were determined with a flame photometer (Systronics Flame Photometer 128). The ionic contents were finally expressed in percent (%) after standard calculations. Cane yield (t ha-1) and sugar yield (t ha-1) were measured post-harvest.
Based on physiological and yield data, tolerant and sensitive genotype samples were selected on saline water irrigation (4 and 8 dS m-1 ECiw) for gene expression analysis. For this purpose, total RNA was isolated from plant leaf tissues using the Trizol reagent (Hi-media). One microgram of RNA was treated with DNase I and used for cDNA synthesis using the iScript™ cDNA Synthesis Kit (Bio-Rad), following the manufacturer’s protocol. The resulting cDNA was diluted tenfold with nuclease-free water and used as a template for quantitative PCR. Gene-specific primers were designed using the Primer Quest tool available at Integrated DNA Technologies (https://eu.idtdna.com/Primerquest/Home/Index) and the targeted genes are listed in Table 1.
Quantitative PCR was conducted using a CFX96 Real-Time PCR Detection System (Bio-Rad) in a final reaction volume of 20 µL, prepared using the SoAdvanced™ Universal SYBR® Green Supermix (Bio-Rad), as per the manufacturer’s instructions. The thermal cycling program included an initial denaturation at 95°C for 20 seconds, followed by 40 cycles of denaturation at 95°C for 3 seconds and annealing/extension at 62°C for 30 seconds. Expression levels were normalized using a reference gene, and relative quantification was determined using the 2^-∆∆Ct method. Data were analyzed using a factorial randomized block design (RBD) with two factors. To determine the critical difference (CD), comparisons among treatments and genotypes were conducted at a 5% significance level using SAS software (Version 9.3, SAS Institute Inc., Cary, NC, USA). Moreover, principal component analysis (PCA) was utilized to investigate key patterns, evaluate interrelationships among the co-canes, and categorize the physiological traits that most significantly influenced the variance in the data.
RESULTS
Physiological response
Saline water irrigation deposited salts in the soil which resulted into buildup of soil ECe (Figure 1) with increasing salt load. At harvest, it was noted that ECe values (dS m-1) increased from 1.55 to 1.76 under control condition, 1.55 to 3.48 with saline irrigation of ECiw ~ 4; 1.62 to 5.2 with saline irrigation of ECiw ~ 8 and 1.59 to 7.84 with saline irrigation of ECiw ~ 12. The main objective of the present study was to identify the salt tolerance potential and variability among these advance co-cane lines. Variance analysis using mean sum of square depicted significant variability among the treatments and the studied genotypes (Table 1). All the studied physiological traits i.e. relative water content (RWC), gas exchange attributes, ionic content were significantly influenced by the irrigation water induced salinity stress, that ultimately caused reduction in sugar yield and cane yield. In the present study the interactive effect of treatments × co-canes also found significant (Table 1 and 2). Irrigation water salinity reduced RWC of leaves by 3.88%, 12.51 % and 20.23% at ECiw ~ 4, 8 and 12 dS m-1, respectively (Table 1). Significant variability (p<0.0001) for RWC was also noted among the studied co-canes (Table 1) and it was seen that Co 14035 had the maximum RWC (85.6%) followed by Co 05009 (85.57%) and Co 12029 (84.78%) while minimum RWC was recorded in Co 13036 (75.35%), Co 15026 (78.59%) and Co 0118 (78.69%).
Chlorophyll content, an important trait involved in the process of photosynthesis also showed significant variation (p<0.0001) and found mean co-cane chlorophyll reduction of 11.24, 30.42 and 43.03 % under ECiw ~ 4, 8 and 12 dS m-1, respectively in comparison to the control treatment (Table 1).
Among twenty four co-canes, Co 98014 (1.45 mg g-1) and Co 0118 (1.41 mg g-1) retained higher chlorophyll content over salinity treatments while co-canes Co 15023, Co 06034, Co 05011, Co 11027 and Co 14034 had the lowest chlorophyll content (Table 1). SPAD reading, an alternative to measure chlorophyll through green color of leaves also depicted the similar trend and showed 12.77, 23.2 and 34.7 % reduction with the progressive salinity levels (Table 1). Similarly, leaf gas exchange parameters of co-canes were also significantly decreased by saline irrigation. Photosynthetic rate, stomatal conductance and transpiration rate decreased in the range of 8 - 10% under ECiw ~ 4 dS m-1, 20 - 30% under ECiw ~ 8 dS m-1 and 35 -47% under ECiw ~ 12 dS m-1, respectively in comparison to non-saline conditions (Table 1). Genotypic differences among co-canes for these parameters (Table 1) were observed with higher Pn values in Co 238 (26.1 µmol m-2 s-1) and Co 0118 (26.03 µmol m-2 s-1) and minimum in Co 12026 (16.86 µmol m-2 s-1) and Co 14036 (16.63 µmol m-2 s-1). A significant variability of Chlorophyll fluorescence was observed between treatment and co-canes (Table 1). With normal irrigation, Fv/Fm was 0.640 which decreased to 0.606, 0.536 and 0.459 with salinity of ECiw ~ 4, 8 and 12 dS m-1, respectively. Among co-canes, highest Fv/Fm ratio was noted in Co 13035 (0.600) followed by Co 12027 and Co 14036 (0.594) and lowest in Co 15023 (0.489) and Co 15025 (0.498).
Ionic balance
Na+ is the most notorious cation that showed significant variability among different co-canes. On an average, 0.136, 0.478, 0.744 and 1.194 % Na+ accumulated in these Co-canes under control, ECiw ~ 4 dS m-1, ECiw ~ 8 dS m-1 and ECiw ~ 12 dS m-1, respectively (Table 2) with highest Na+ (0.970%) in Co 14034 and lowest in Co 13035 (0.514%), Co 12027 (0.515%), Co 0238 (0.542%), CoS 767, Co 15027, Co 11027, Co 13033 (0.57%).Irrigation water induced salinity also significantly influenced K+ content by decreasing to 25.09, 37.1 and 56.27% under ECiw ~ 4, 8 and 12 dS m-1, respectively in comparison to the control treatment (Table 2). The variability for K+ reduction was higher in different co-canes where Co 0238, Co 06034, Co 98014 and Co 15023 showed less than 45 per cent reduction in K+ under ECiw ~ 12 dS m-1 in comparison to the control treatment while other co-canes showed reduction in the range of 55 - 80 %. We also observed significant increase of 4.7, 8.9 and 20.8 times in Na+/K+ ratio with increasing salinity levels of ECiw ~ 4, 8 and 12 dS m-1, respectively (Table 2) with minimum in Co 0238 (0.117) and maximum in Co 15027 (0.369), Co 14034 (0.318) and Co 1148 (0.288).
Cane and Sugar Yield
In addition to the physiological traits, cane yield along with sugar yield are the two most important traits to define the ability of particular co-cane against salinity stress. Significant variability was noted for sugar yield as well as for cane yield among different salinity treatments and co-canes, the interactive effect of saline irrigation and co-cane was also found significant (Table 2). Sugar yield in terms of commercial cane sugar (CCS) was 9.35 t ha-1 with normal irrigation water which declined by 21.71, 53.08 and 67.38% with saline irrigations of ECiw ~ 4, 8 and 12 dS m-1, respectively. Similar reductions were also noticed in cane yield (t ha-1) i.e. 19.34, 50.43 and 64.8 per cent under ECiw ~ 4, 8 and 12 dS m-1, respectively in comparison to the control treatment (Table 2). Higher variability’s were observed in sugar yield among different co-canes with maximum sugar yield of 9.29 and 9.47 t ha-1 in Co 15023 and 15027 followed by Co 0118 (8.08 t ha-1) whereas co-canes Co 12027 (3.86 t ha-1), Co 11027 (3.98 t ha-1) and Co 0237 (4.02 t ha-1) had the lowest sugar yield (Table 2). Highest mean cane yield was observed in Co 14036 (78.26 t ha-1), Co 15027 (75.78 t ha-1) and Co 0238 (67.67 t ha-1) and lowest in Co 12027 (28.51 t ha-1) and Co 0237 (29.55 t ha-1).
Association analysis
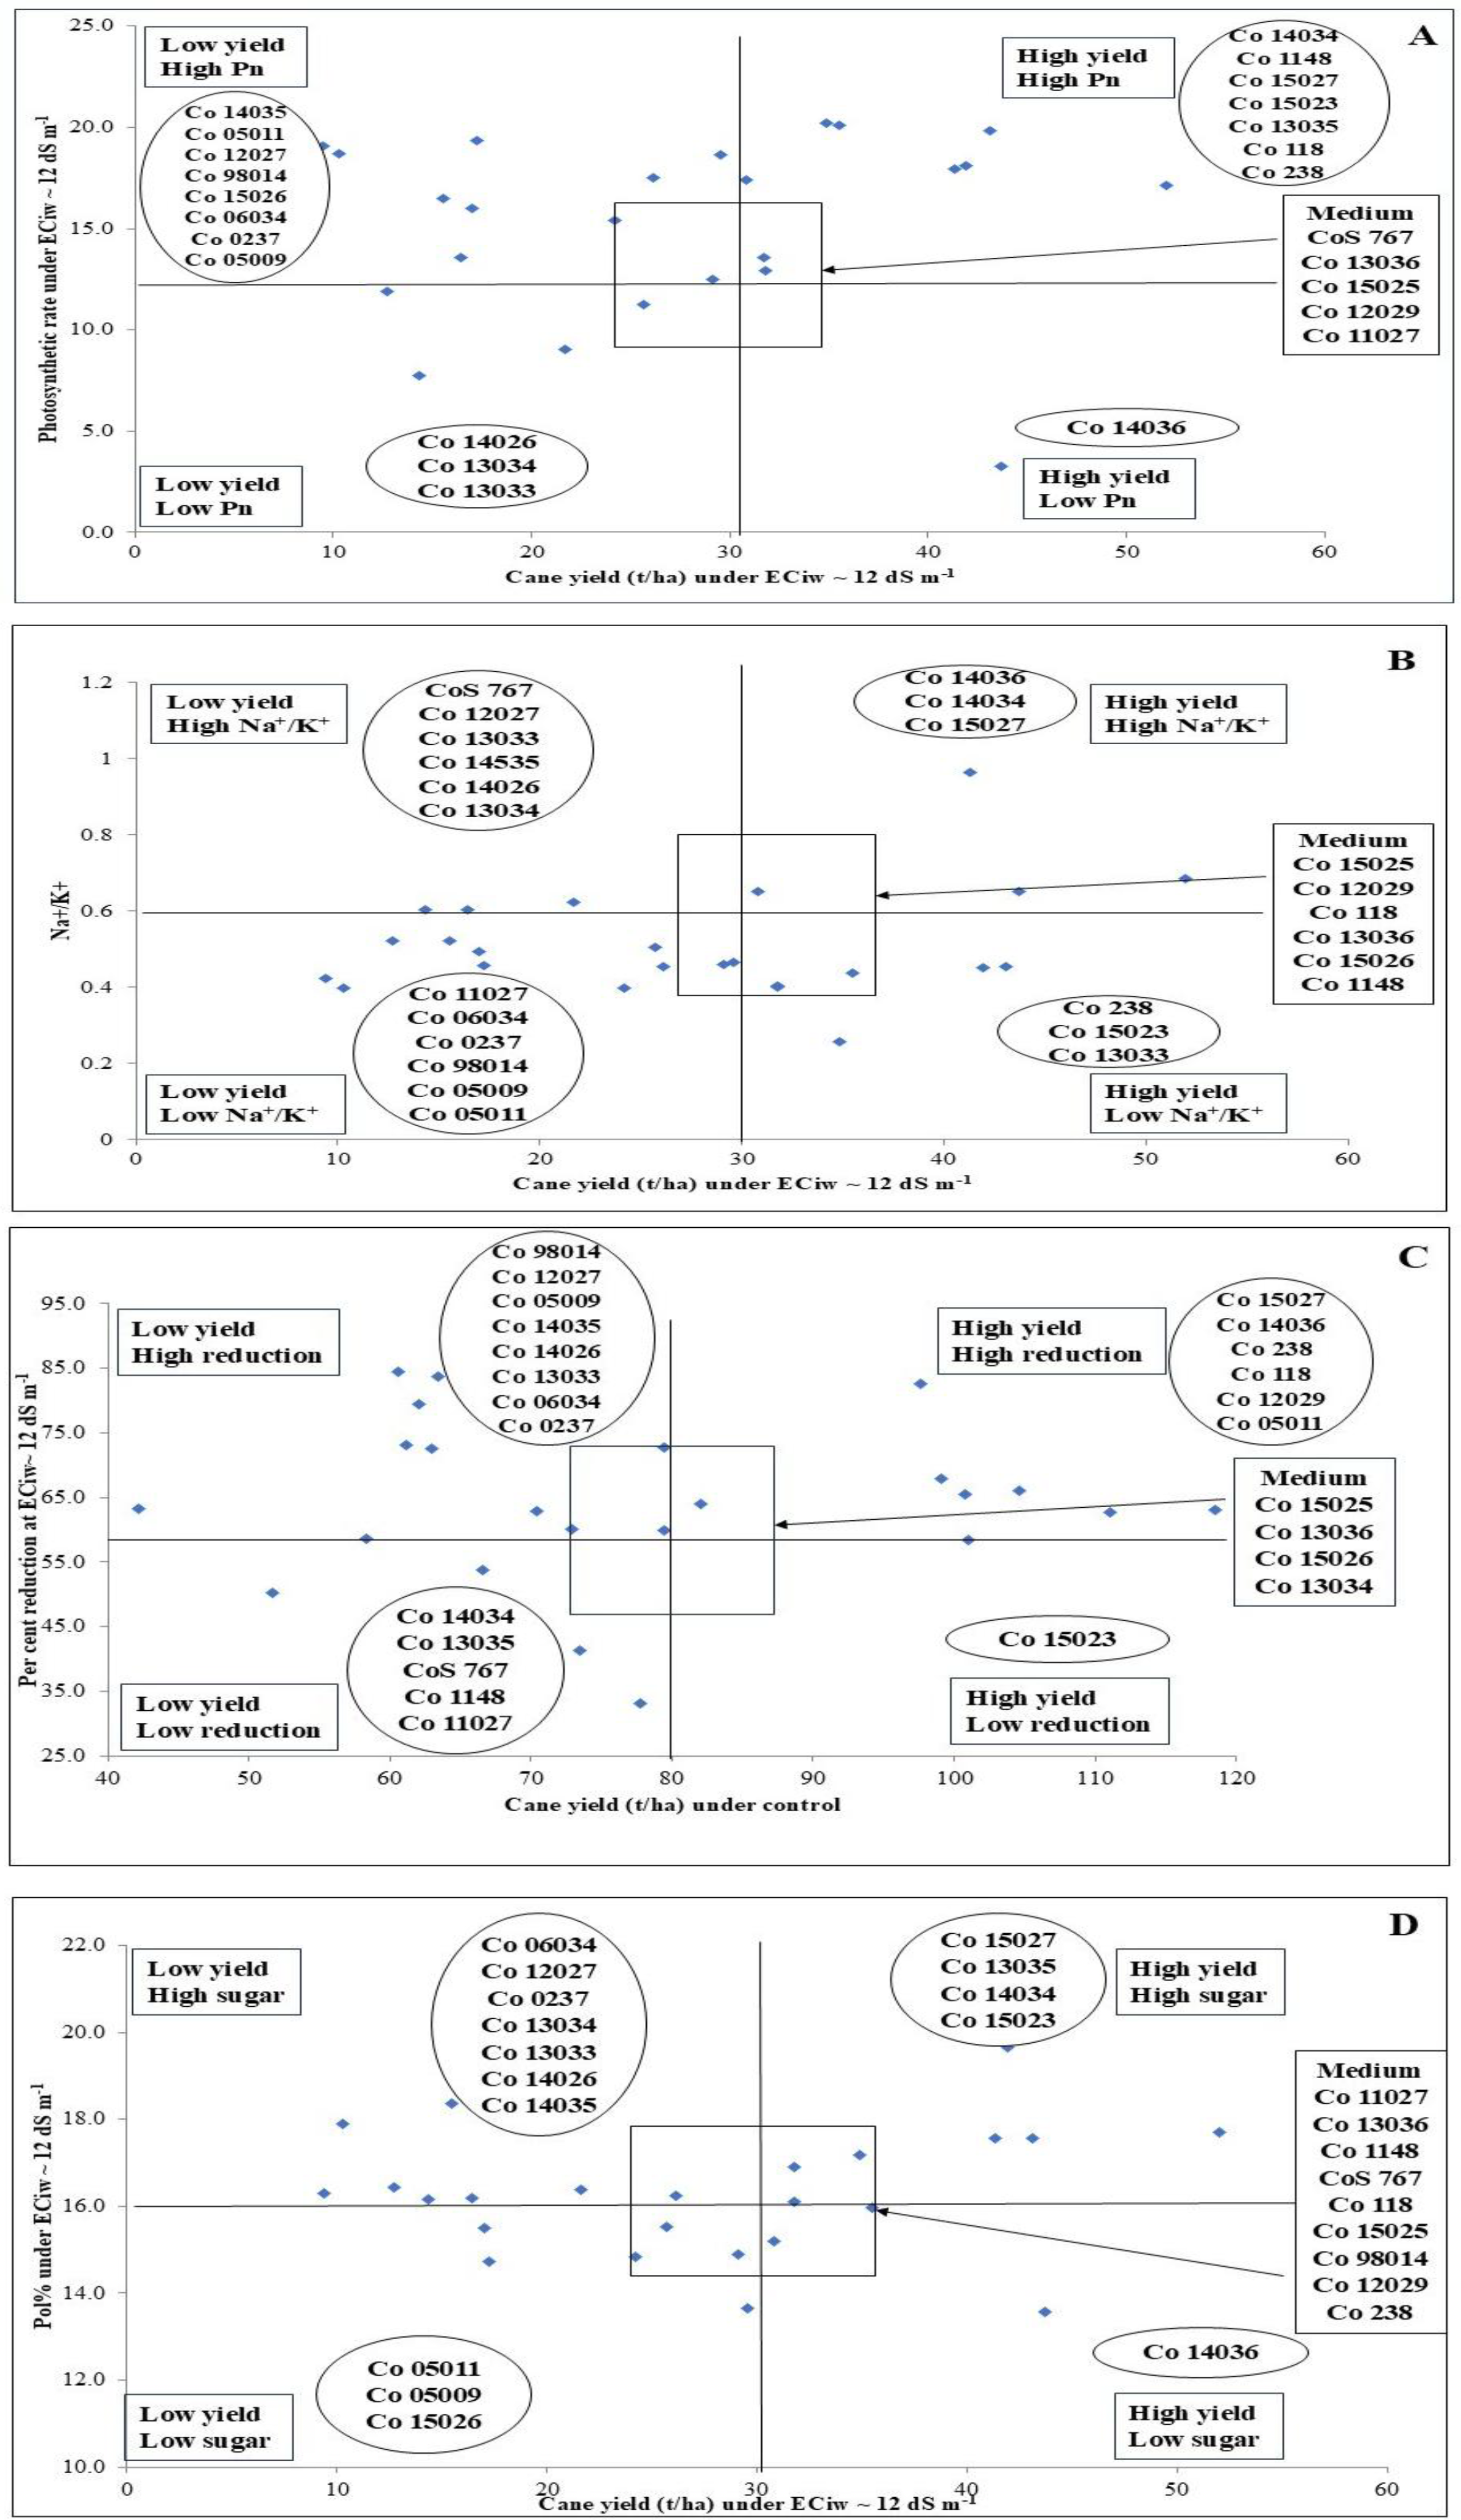
Different correlations factors were analyzed to identify trait based salt tolerant and sensitive co-canes in relation to cane yield (Figure 2A-2D). From the correlation between photosynthetic rate and cane yield with highest level of salinity, ECiw ~ 12 dS m-1 (Figure 2A), it was observed that co-canes Co 0238, Co 0118, Co 13035, Co 15027, Co 15023, Co 1148 and Co 15026 maintained higher Pn along with higher cane yield, while Co 14036 had higher yield but lower photosynthetic rate. Further, it was noted that co-cane Co 13034 and Co 14026 had the lowest Pn with low cane yield and regarded as salt sensitive. Similarly, correlation matrix between Na+/K+ ratio and cane yield under ECiw ~ 12 dS m-1 revealed that co-cane Co 0238, Co 15023 and Co 13035 had lowest Na+/K+ and higher cane yield while co-canes i.e. CoS 767, Co 12027, Co 13033, Co 14035, Co 14026 and Co 13034 had the highest Na+/K+ with lower cane yield (Figure 2B). Other co-cane that showed sensitivity due to higher accumulation of Na+ were Co 14036, Co 14034 and Co 15027 having highest Na+/K+ ratio with higher cane yield (Figure 2B). In addition, the correlation matrix of cane yield under normal conditions vs per cent reduction in yield under ECiw ~ 12 dS m-1 revealed that Co 15023 had the higher yield with lower reduction in yield and hence categorized as tolerant, whereas, Co 05011, Co 12029, Co 0118, Co 0238, Co 14036 and Co 15027 showed higher yield but the per cent reduction was more than 55% (Figure 2C). On the other hand, the correlation between cane yield and pol% (% sucrose) under ECiw ~ 12 dS m-1 showed co-canes Co 15023, Co 15027, Co 13035 and Co 14034 with higher yield along with higher pol% while Co 05009 and Co 15026 had the lowest yield with lowest pol% (Figure 2D) and only Co 14036 showed higher cane yield with low values for pol%. Based on these correlations, these co-canes could be categorized as tolerant (Co 15023, Co 0238, Co 13035 and Co 0118) and sensitive (Co 14036, Co 12027, Co 14026 and Co 13034).
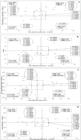
Scatter plot correlations between different traits to identify trait based salt tolerant and sensitive co-cane
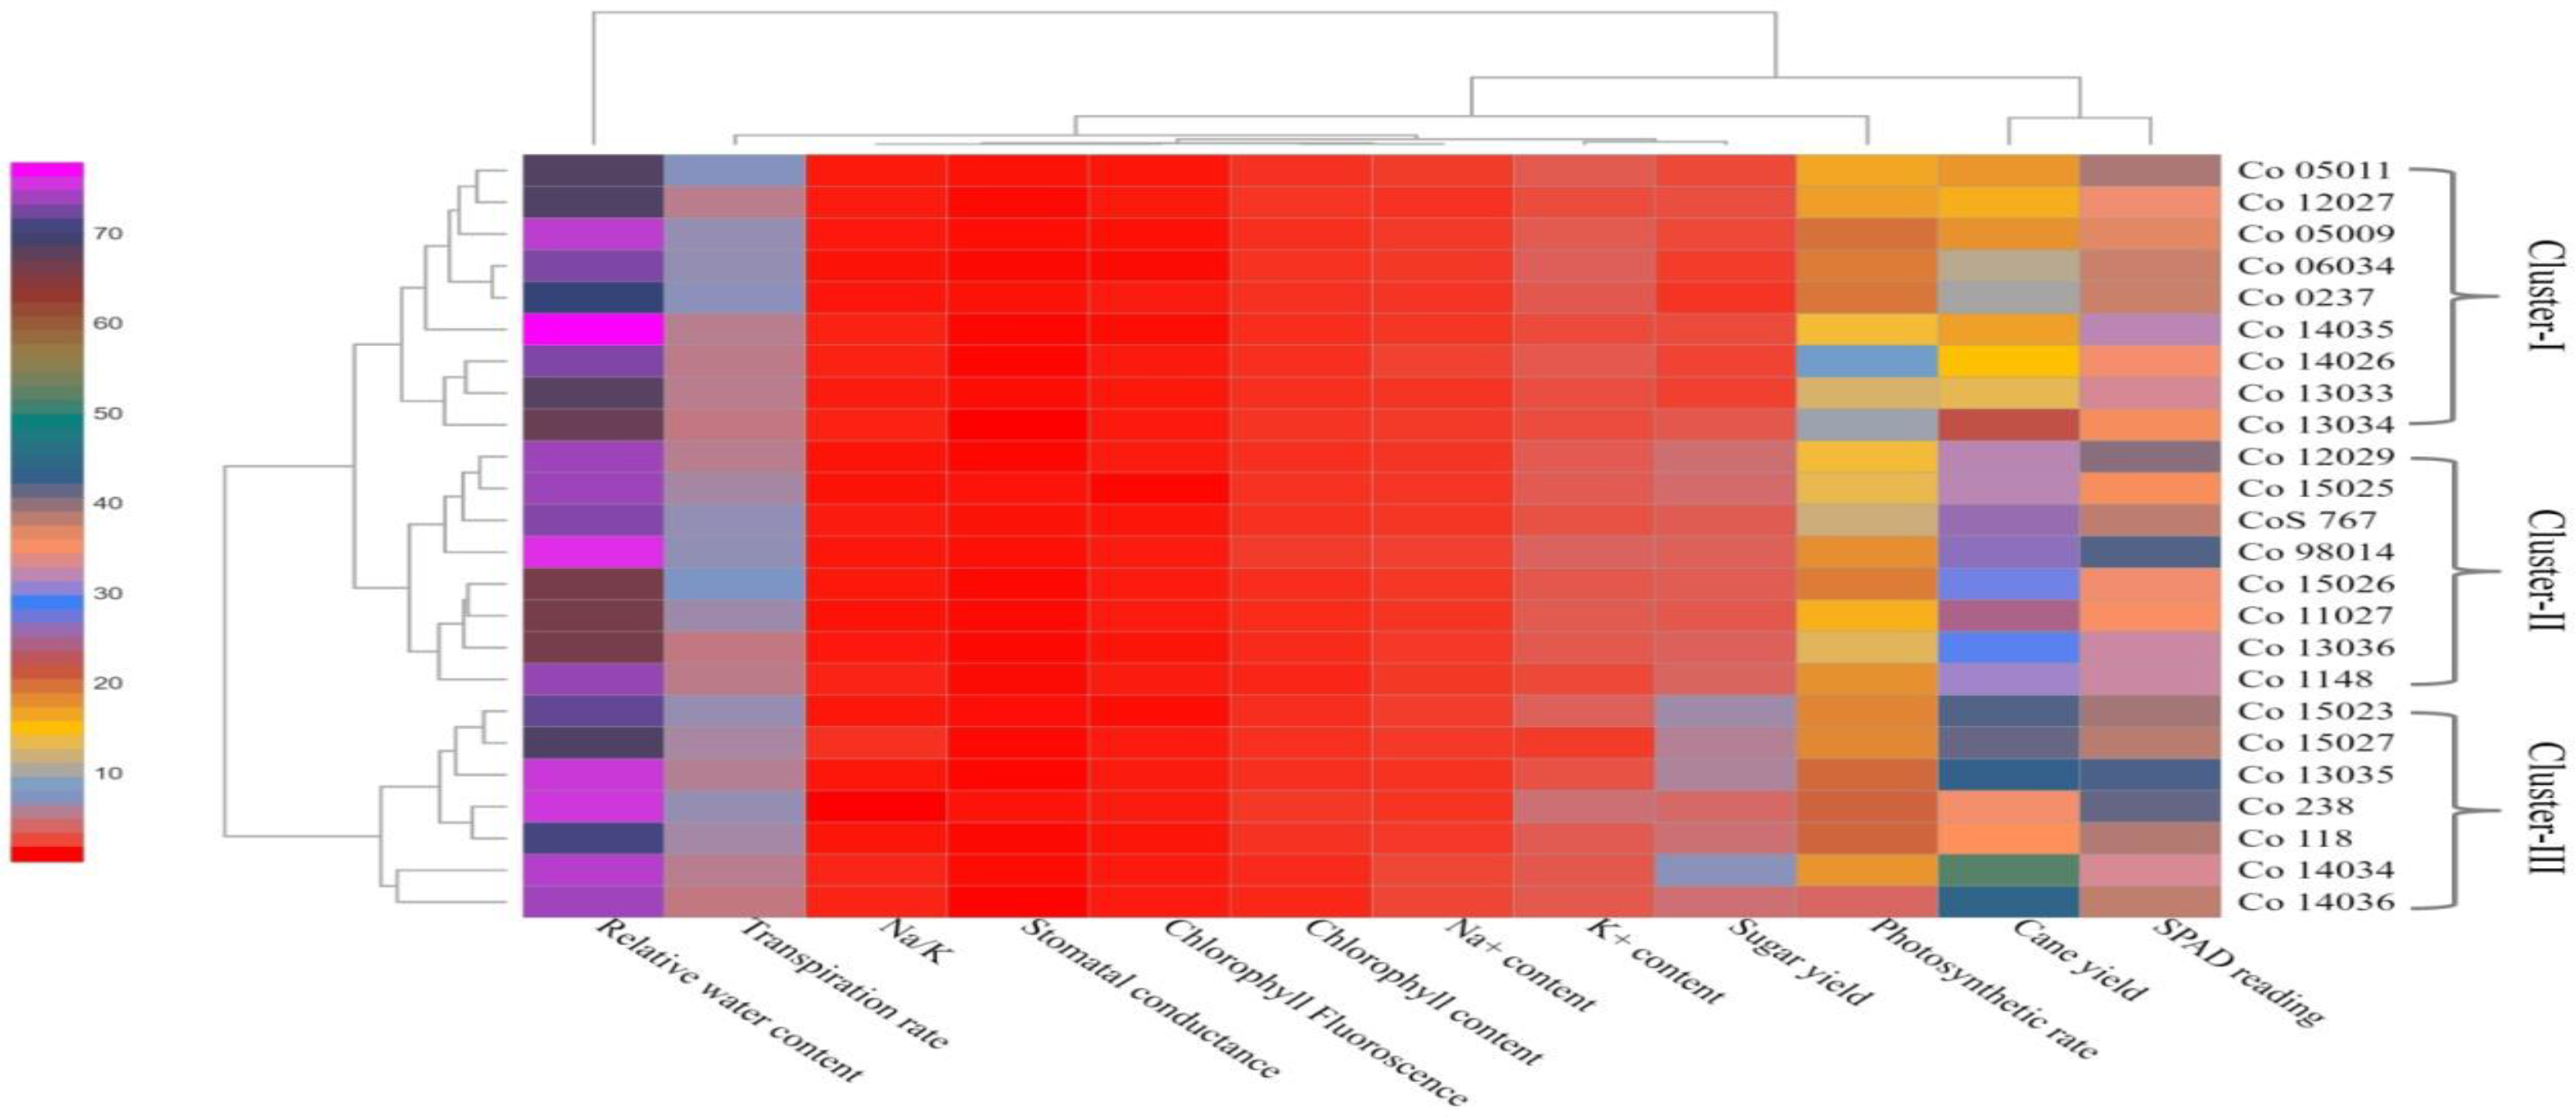
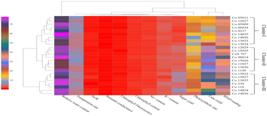
Association/cluster analysis of physiological and yield traits using heatmap through DisplayR software (https://www.displayr.com), grouped all the co-cane genotypes into three main clusters (Cluster I, II and III) (Figure 3). A total of 9 genotypes were grouped in the Cluster I (Co 05011, Co 12027, Co 05009, Co 06034, Co 0237, Co 14035, Co 14026, Co 13033, Co 13034), 8 genotypes in the Cluster II (Co 12029, Co 15025, CoS 767, Co 98014, Co 15026, Co 11027, Co 13036, Co 1148) and 7 genotypes in the Cluster III (Co 15023, Co 15027, Co 13035, Co 238, Co 118, Co 14034, Co 14036). Cluster I denoted maximum genotypes as salt sensitive except Co 05011 while, most of genotypes in Cluster III were salt tolerant (Figure 3). Pearson’s correlation analysis was also performed to access the association between studied traits under different levels of saline irrigation (Figure 3). A positive correlation of cane yield was observed with all the parameters except Na+ and Na+/K+ ratio. Highest significant positive correlation was noted between cane yield and CCS (0.97**) and between Na+ and Na+/K+ (0.91**) while a negative correlation of all the physiological traits was observed with Na+ which further increased with increasing level of salinity. Overall, the correlation analysis revealed that these physiological traits were directly related to yield and any deviation/disturbance in these traits led to decline the corresponding yield.
Principal Component Analysis
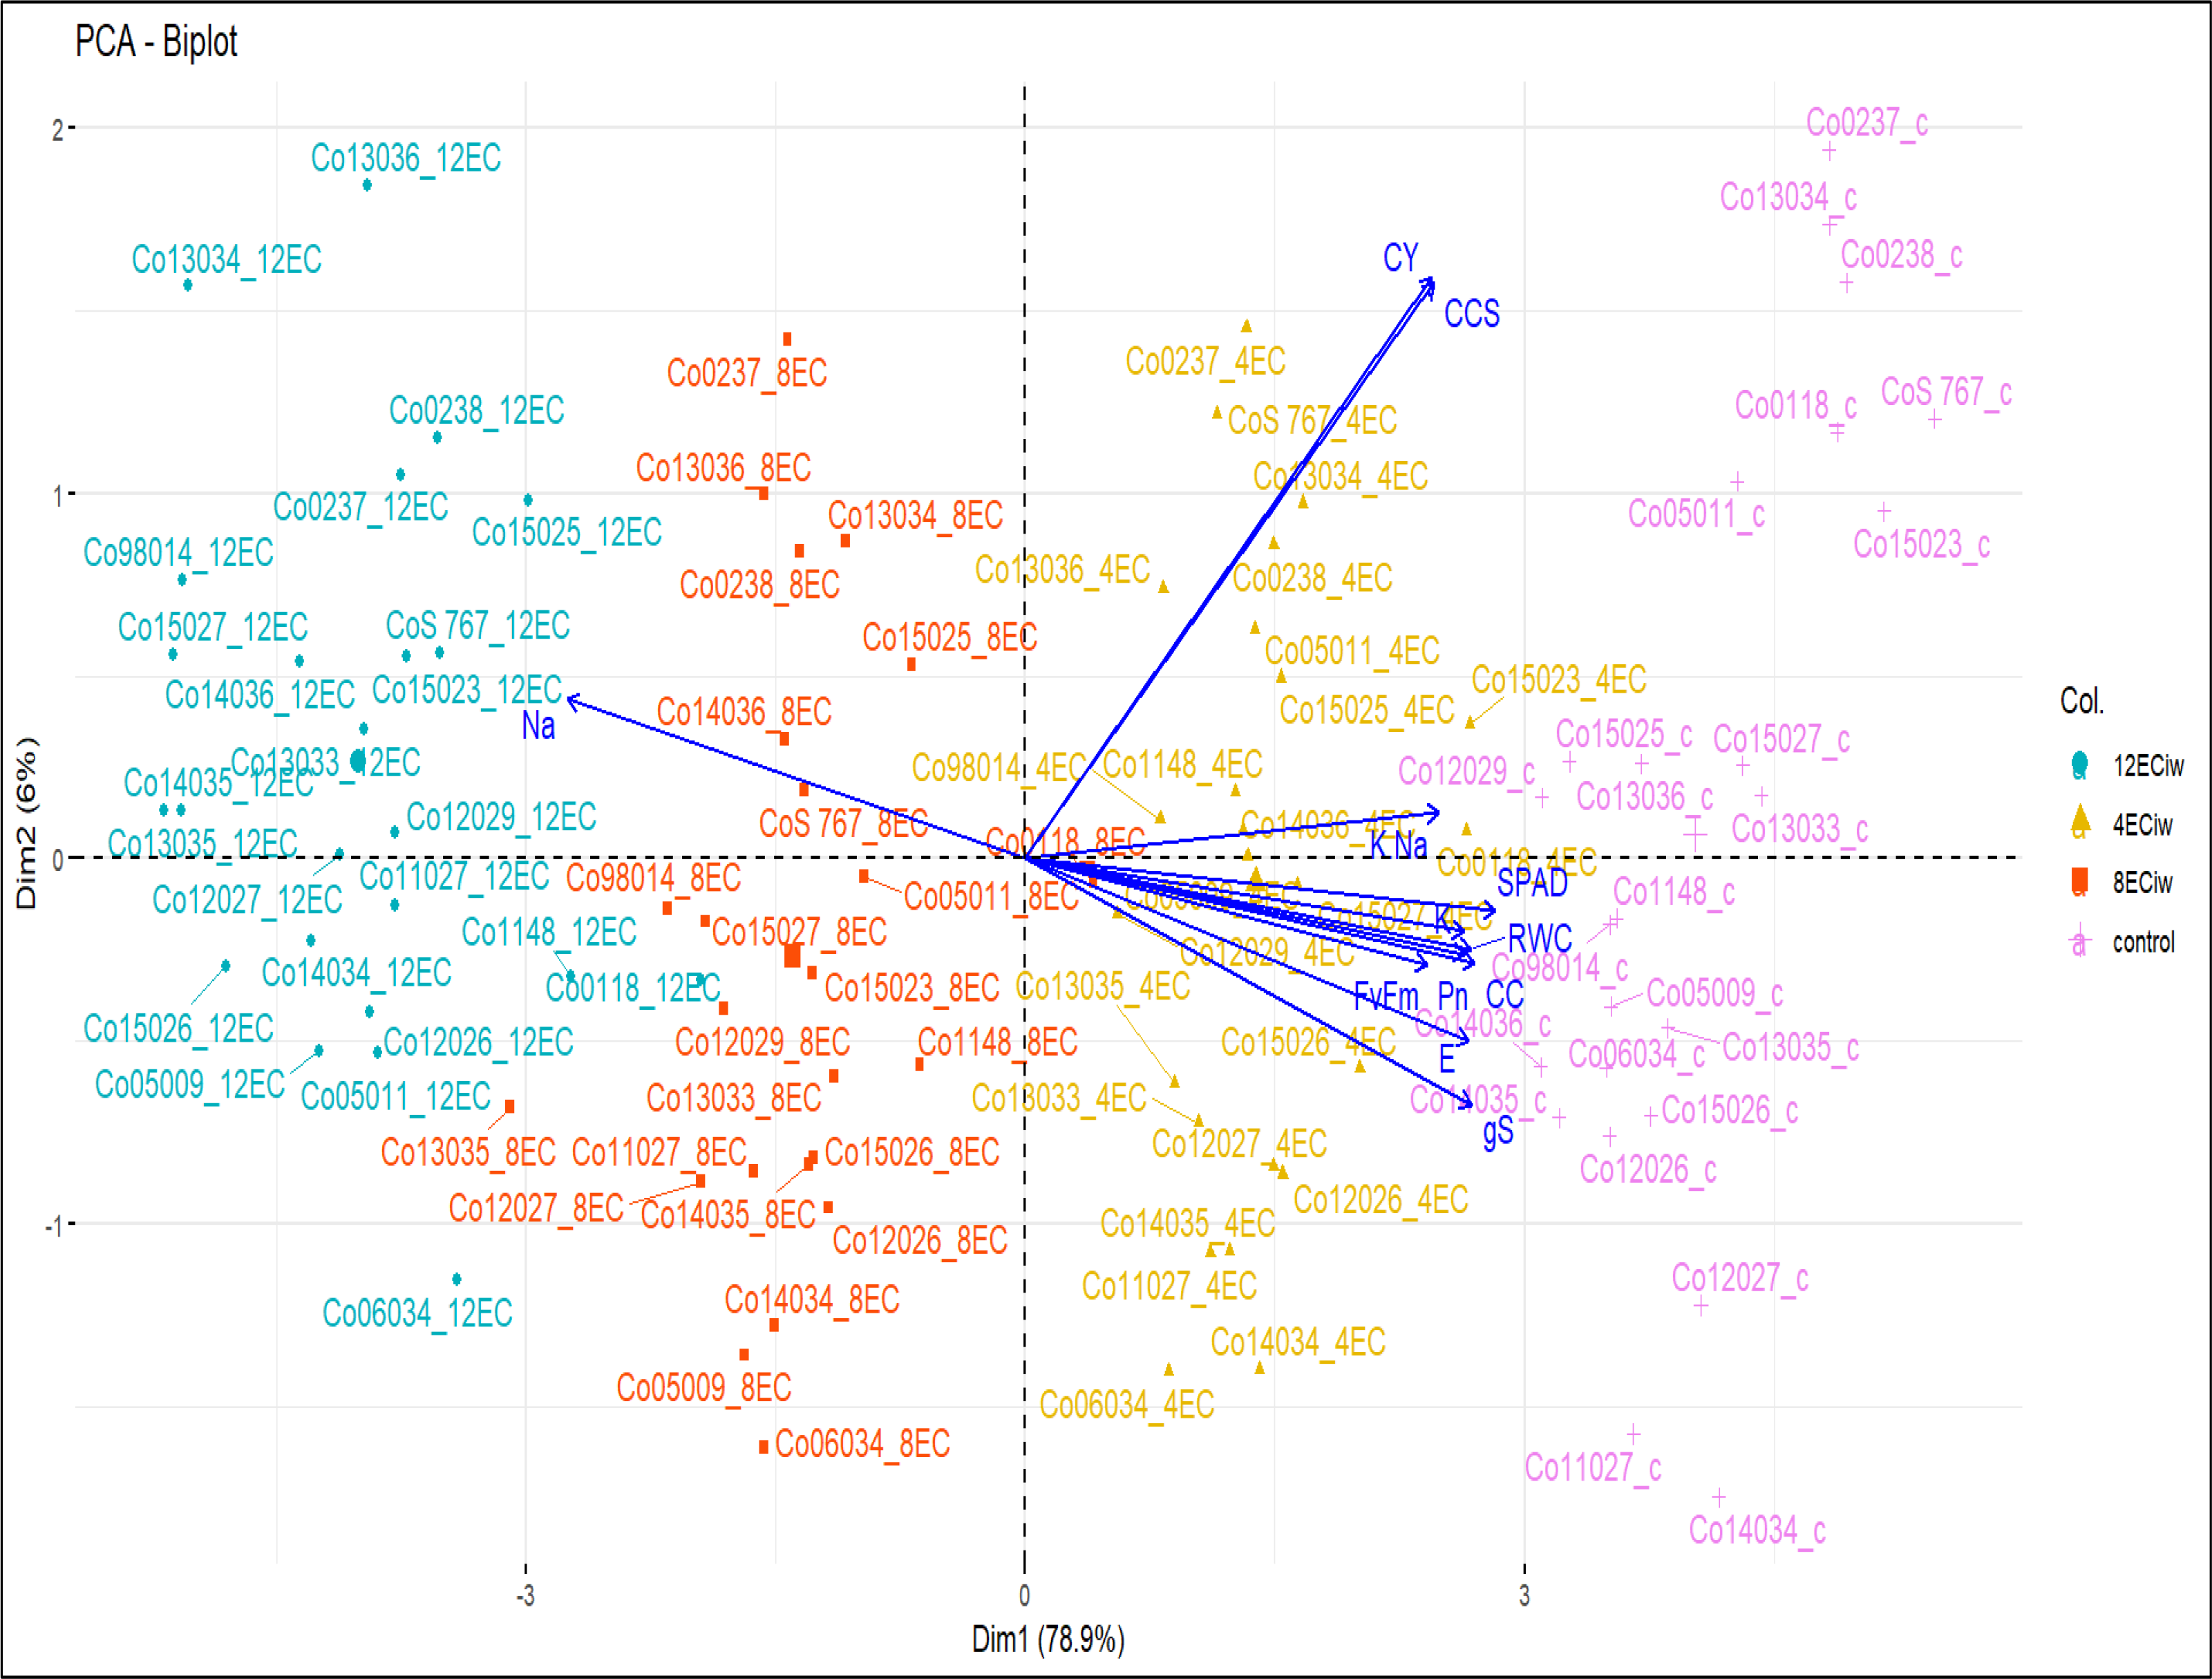
In PCA, control and every other salinity level (4ECiw, 8ECiw, 12ECiw) were utilized to assess the correlations among morpho-physiological and ionic traits of each individual recorded separately under each treatment, and among the genotypes (Figure 4). A data matrix comprising 12 traits for 24 genotypes was created and analyzed using R (package: factoextra) to extract the 12 principal components and their loadings for the associated traits (Figure 4). After getting the cumulative variance percent, among the first 12 principal components (PCs), the first two (PC1 and PC2) were especially prominent contributed 85% of it and were used to draw PCA biplot (Figure 4).
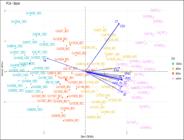
A three-way principal component biplot (PC-biplot) was constructed to examine the interactions among genotypes × soil-salinity × variables/traits (12) responses with 24 sugarcane genotypes under control (normal/non-salinity environment), 4ECiw, 8 ECiw and 12 ECiw conditions. The first two principal components (PC1 and PC2) accounted for 78.9% and 6% of the variance. The length of the vectors for each trait shows their relative importance and contribution to these components, while their distance and direction from the origin reveal how much they affect PC1 and PC2. The vectors aligned on each other (<450 angle) are positively correlated/associated with each-other; vectors at perpendicular and opposing forces revealed no association and negative association respectively. Na, CY, CCS, K/Na, SPAD, RWC, K, CC, Pn, Fv/Fm, E, gS.
Individual principal component (PC) vectors assigned variance scale values to all traits, contributing to the overall variability. These vectors facilitated the generation of the principal component biplot (PC-biplot) using factoextra package in R [18]. The PC-biplot of the variables reflected three clusters; first cluster comprised of maximum genotypic traits-i.e., K/Na, SPAD, RWC, K , CC, Pn, Fv/Fm, E, gS; second category comprised of CY, CCS and Na content was having opposing vector of traits K/Na, SPAD, RWC, K , CC, Pn, Fv/Fm, E, gS; indicating negative association with all these characteristics (Figure 4). Vector of Na has arrow in the direction where salinity is increasing and thus it reduces plant growth, development and cane yield in sugarcane under salinity stress condition. The PCA biplot was utilized to analyze the distribution of 24 sugarcane genotypes, facilitating a deeper understanding of their genetic potential in response to salinity stress. It incorporated all morpho-physiological and ionic traits, allowing for a comprehensive comparison of genotypic performance across different levels of salinity stress. At the control treatment (violet colored), all 24 genotypes displayed highest values of traits CY, CCS, K/Na, SPAD, RWC, K, CC, Pn, Fv/Fm, E, gS since they were clustered near the arrow of these traits and in opposition of Na. In control treatment genotypes Co0767, Co15023, Co0118 and Co0238 had highest cane yield and under 4EC salinity stress Co13034, Co0238, Co0767 showed better performance. Genotype Co15025 constantly showed better performance under all three salinity levels although its performance is average under control.
Gene expression analysis
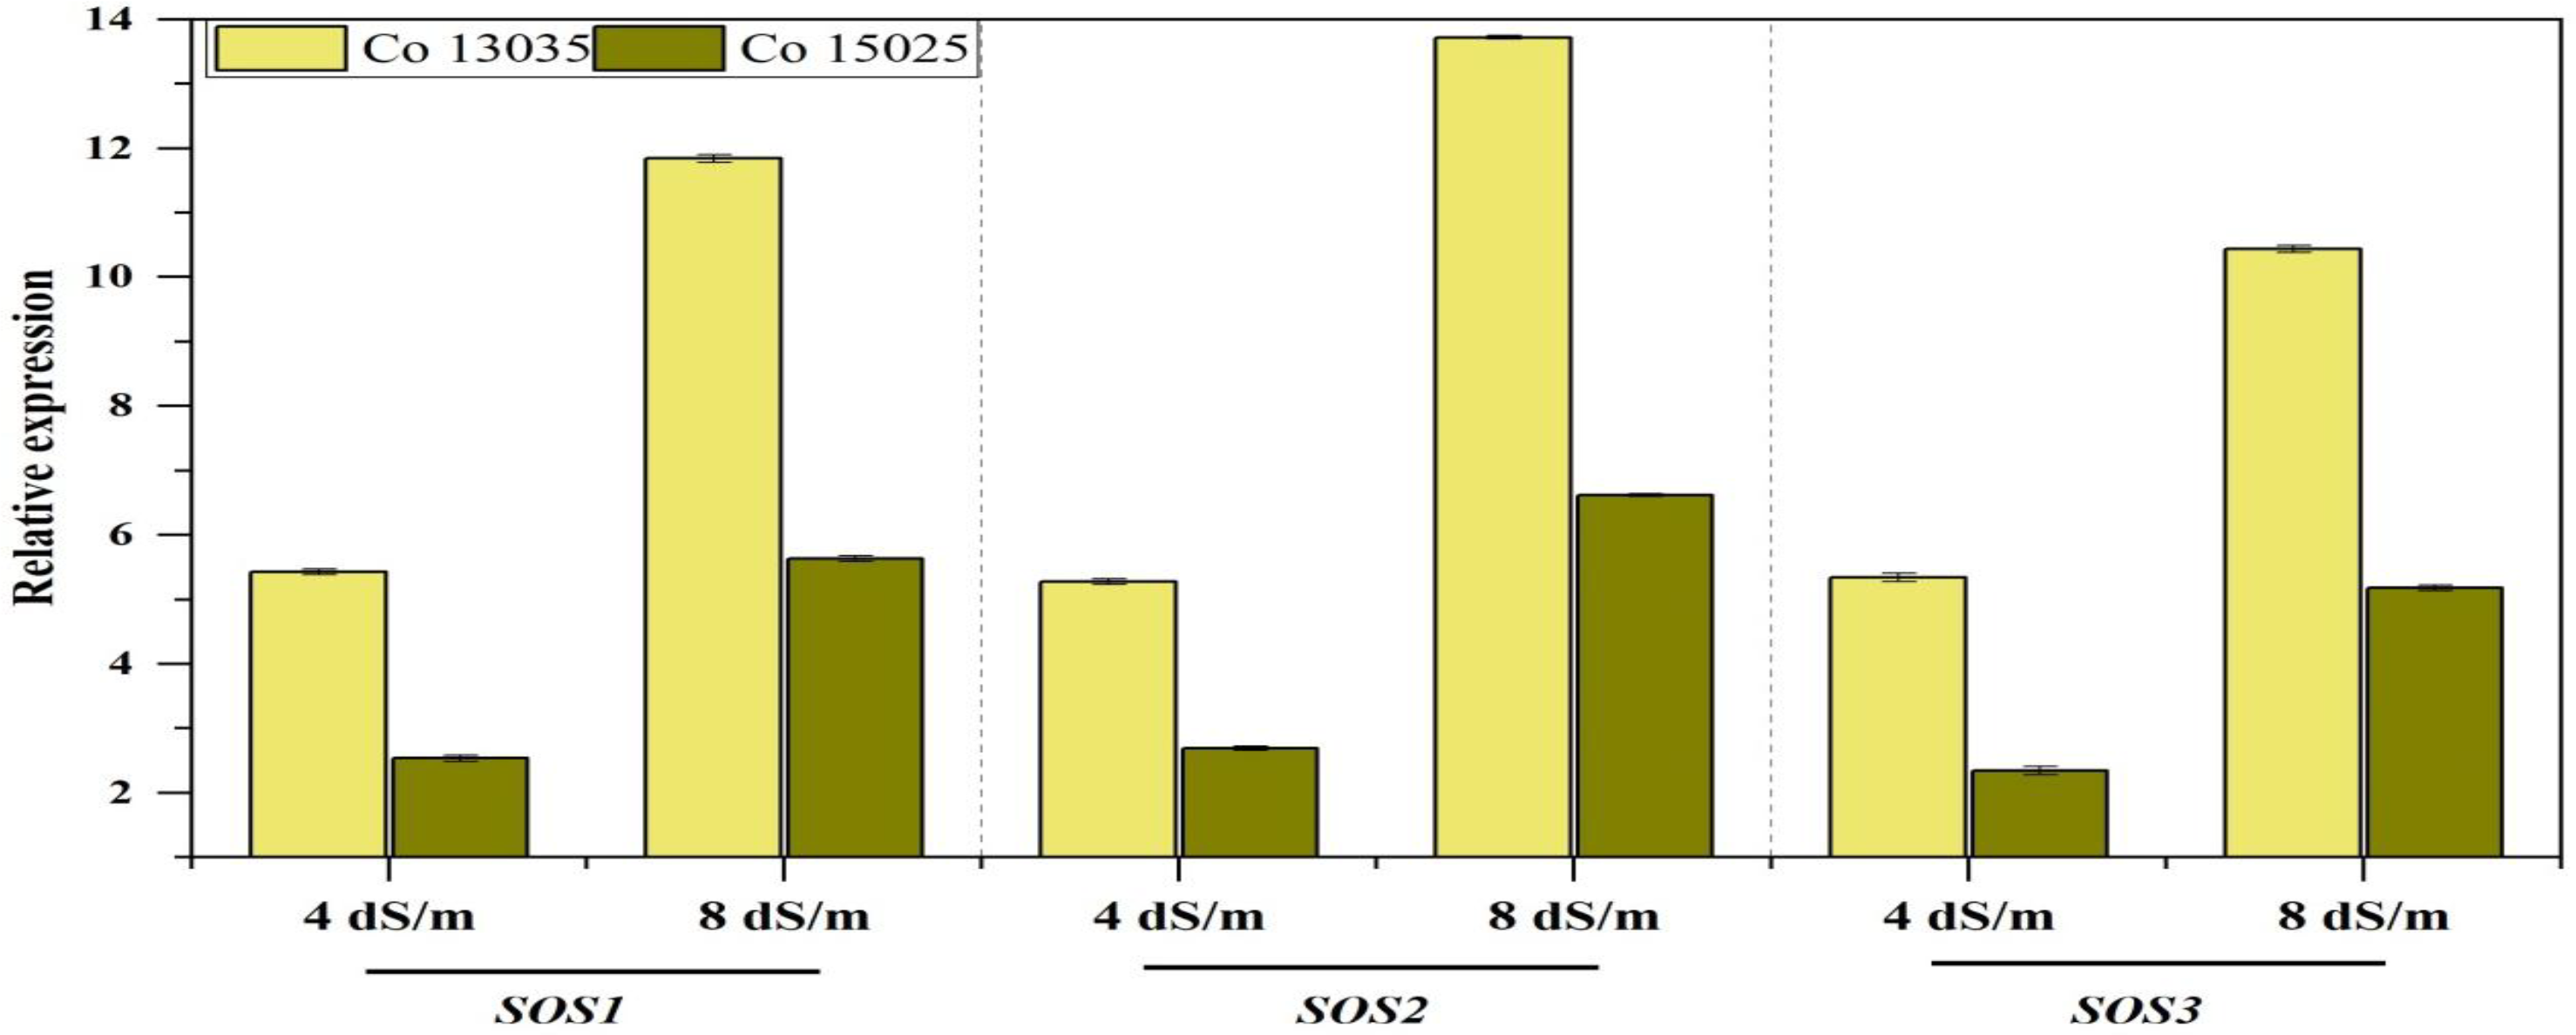
The three SoSOS (salt overly sensitive) genes were differentially expressed in leaves under salinity stress in tolerant (CO 13035) and sensitive (Co 15025) Co-cane. The expression profiles of three Salt Overly Sensitive (SOS) pathway genes, SOS1, SOS2, and SOS3- in leaf tissues under saline conditions (4 and 8 dS/m ECiw) revealed significant genotype-dependent differences between Co 13035 and Co 15025 (Figure 5).
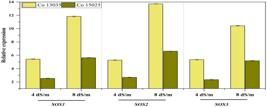
Bar chart for Relative expression of SOS1, SOS2, and SOS3 genes in sugarcane genotypes Co 13035 and Co 15025 under saline irrigation (4 and 8 dS/m ECiw).
The interaction between salinity level and genotype was highly significant, suggesting a differential transcriptional response linked to salinity tolerance. For SOS1, Co 13035 showed markedly higher expression, with approximately 5.3-fold and 12-fold increases at 4 and 8 dS/m, respectively, compared to Co 15025, which exhibited only about 2.3-fold and 3.5-fold induction at the same salinity levels. This elevated expression of SOS1 in Co 13035 under increasing salinity indicates an enhanced ability to mediate Na⁺ efflux via the plasma membrane Na⁺/H⁺ antiporter, supporting its role in ionic homeostasis under stress conditions. Similarly, SOS2, a key regulatory kinase of the SOS pathway, was significantly up-regulated in Co 13035, with 5-fold and 13.5-fold increases under 4 and 8 dS/m, respectively. In contrast, Co 15025 showed comparatively lower induction, with 2.4-fold and 6.2-fold increases. The up-regulation of SOS2 in Co 13035 suggests robust activation of downstream signaling components involved in ion homeostasis and stress adaptation. For SOS3, a calcium-binding protein that activates SOS2 under salt-induced cytosolic Ca2⁺ spikes, Co 13035 again demonstrated upregulated expression, with 5.8-fold and 10.6-fold induction under 4 and 8 dS/m, while Co 15025 showed only 2-fold and 4.5-fold increases. This coordinated upregulation of SOS gene cascade in Co 13035 shows a strong and organized response to salt stress, helping in better ion movement, signaling, and overall tolerance to salinity.
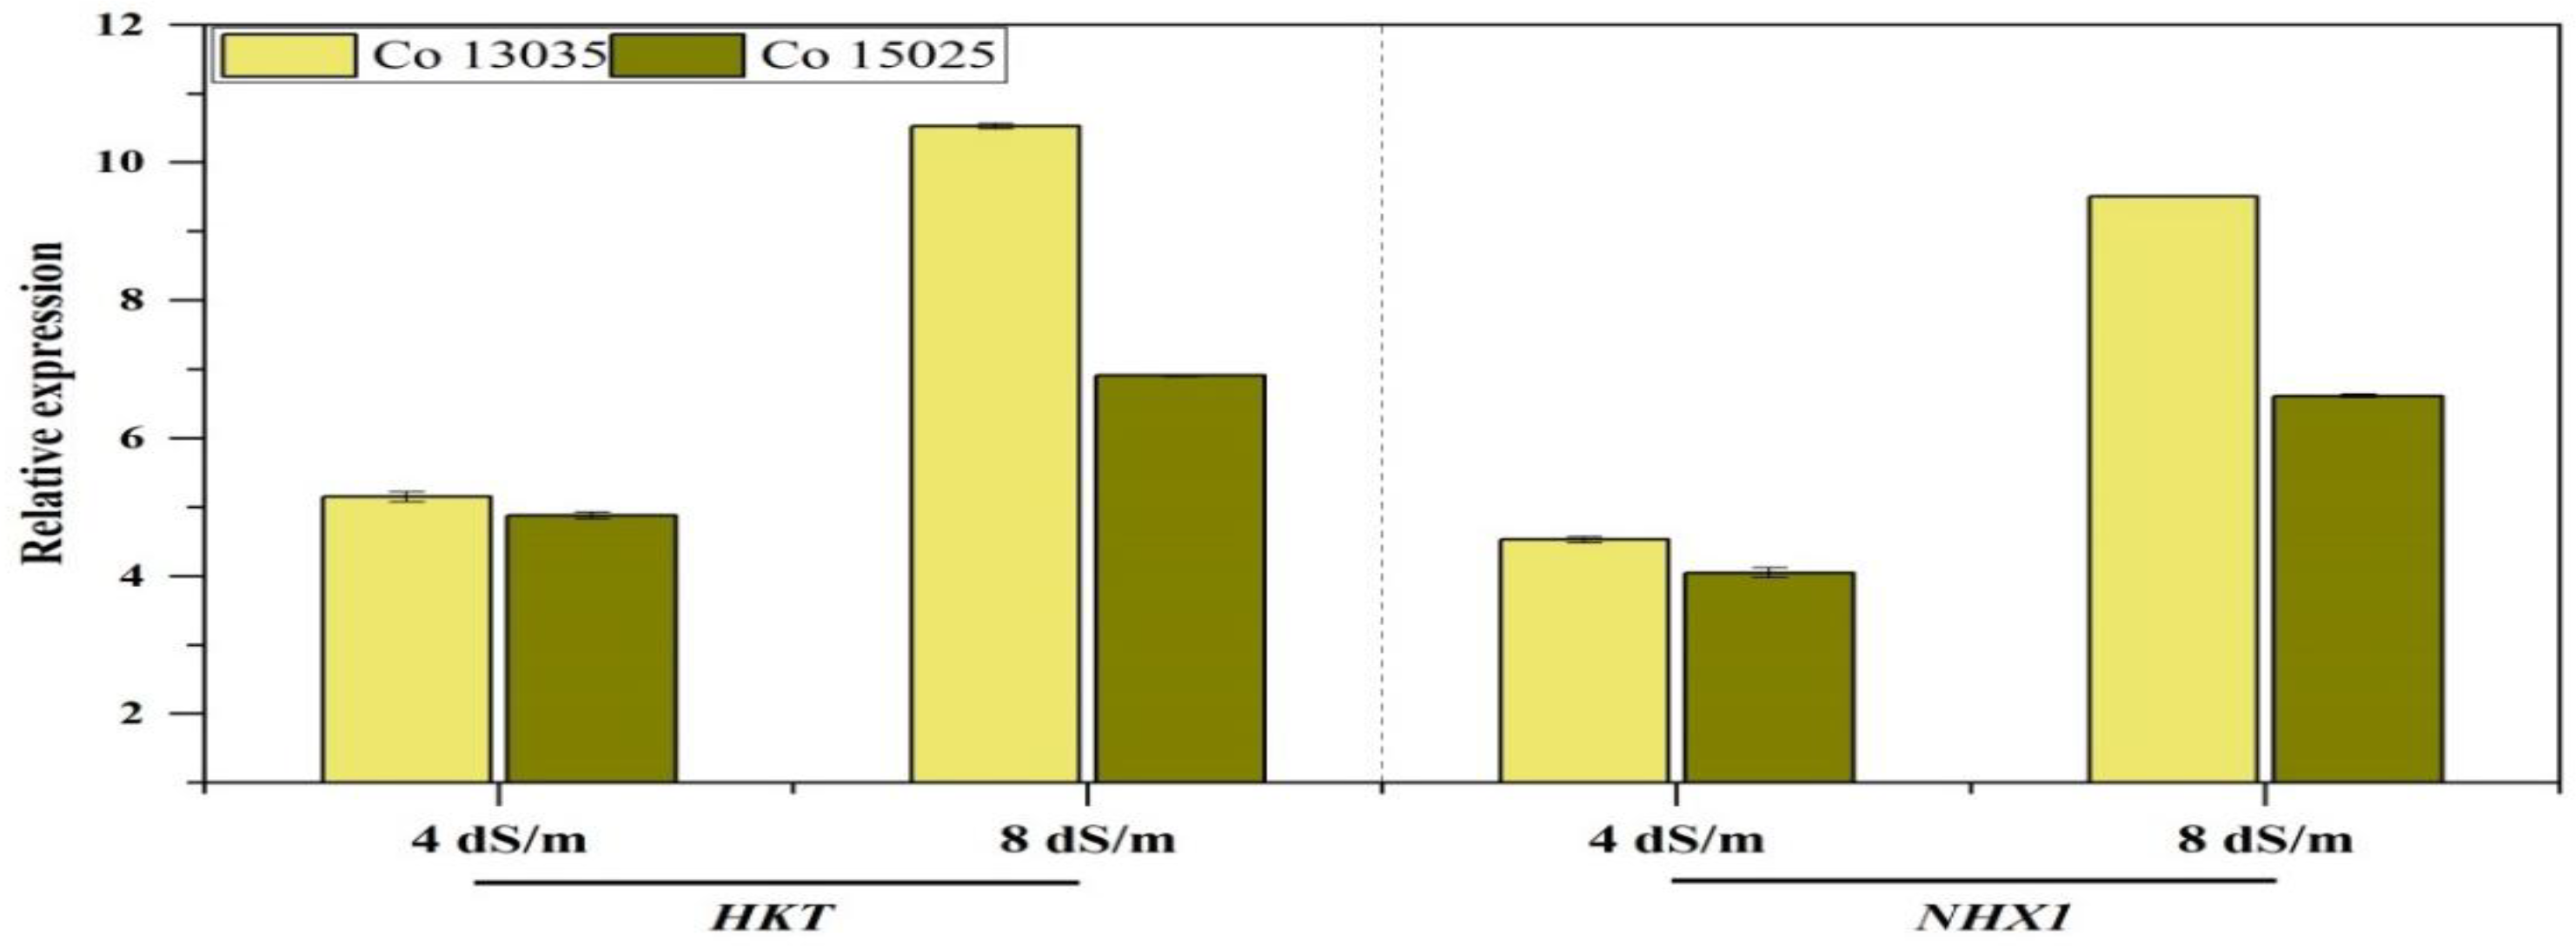
To further elucidate the ion homeostasis mechanism under salinity stress, expression levels of HKT and NHX1 were analyzed in sugarcane genotypes Co 13035 and Co 15025 under 4 and 8 dS/m ECiw. As shown in Figure 6, both genes exhibited genotype and treatment-dependent regulation. For HKT, a Na⁺ transporter associated with Na⁺ exclusion and K⁺ retention, Co 13035 showed significantly higher expression (10.5-fold) at 8 dS/m, compared to 6.9-fold in Co 15025. Expression levels were similar at 4 dS/m. Similarly, NHX1, which encodes a vacuolar Na⁺/H⁺ antiporter, was also more strongly upregulated in Co 13035 (9.5-fold at 8 dS/m) than in Co 15025 (6.6-fold), while both genotypes showed comparable expression at 4 dS/m.
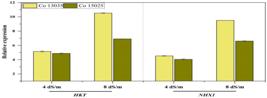
Bar chart for Relative expression levels of HKT and NHX1 genes in sugarcane genotypes Co 13035 and Co 15025 under saline irrigation (4 and 8 dS/m ECiw).
DISCUSSION
It is well known that salt tolerance ability is not uniform and differs inherently from crop to crop and genotype to genotype as well as with duration and stage of plant growth under abiotic stresses particularly salinity stress [19-20]. A significant genotypic variation was observed among the studied co-canes in the present study. The physiological data recorded in top visible dewlap (TVD) leaves during the formative phase [21] after the continuous saline water irrigation of ECiw ~ 4, 8 and 12 dS m-1 applied 30 days after sowing (DAS) showed significant variations. Mainly, salinity stress led to a rapid, osmotic phase that hampered growth of young leaves and a slower, ionic phase that caused nutritional imbalance, leaf senescence and reduction in the activities of enzymes involved in physiological mechanisms [10, 22-24]. Water is an essential and important determinant of metabolic activity for survival of plant under stress conditions [25-27]. Sugarcane (C4 plant) needs high amount of water for proper growth and development i.e. 1200 to 1800 mm in the subtropical zone and 1600-2700 mm in tropical zone [28-29]. During formative phase sugarcane necessitates an amount of 550 mm water [30]. Among plant water relations, relative water content (RWC) is an important physiological trait that depicts the water status of plants at cellular and tissues level. Salinity reduced the water uptake capability of plants that may interfere with the normal metabolism and the obtained results were supported by the fact that higher RWC helped in maintaining osmotic balance and sequestration of toxic ions that might be crucial for growth and development [19, 31].
The observed reduction of 11-43% in chlorophyll content might be due to increased activity of chlorophyllase (chlorophyll degrading enzyme) or reduced activity of ALA synthase (chlorophyll synthesis enzyme) that resulted in chlorosis of leaves, the visible symptoms of salinity stress [18, 32]. Irrigation water salinity causes excessive accumulation of Na+ and Cl- in the leaf tissues that might cause destruction in the chlorophyll pigment through loss of greenness or restrict its synthesis [26]. Photosynthesis is an important indicator that directly influences plant growth and productivity [33-34]. Normally salinity lowers the photosynthetic rate, may be due to stomatal limitations (stomatal closure due to decreased CO2), non-stomatal limitations (decreased photosynthetic activity in mesophyll tissue) or both [34-35].The reduction in these particular traits might be due to the reduced CO2 availability through stomata or disturbance in photosystem II activity [32, 36]. Another possible reason for such reduction could be attributed to reduced efficiency of ribulose-1, 5-bisphosphate (RuBP) carboxylase, or to the sensitivity of PSII to excessive accumulation of Na+ in the leaf tissues [34, 37]. It is well-known that salinity causes reduction in gaseous exchange attributes but the response is genotypic dependent as we have observed here. Saline water irrigation induced accumulation of Na+ and Cl- decreased the availability of water to the plant tissues by reducing leaf turgor and soil osmotic potential, that ultimately led to decrease in rate of gS by closing stomata as has been reported earlier [38-40]. Furthermore, stomata movement (opening and closing) could be the main limiting factor that led to depressed transpiration in sugarcane [20, 41]. Chlorophyll fluorescence (Fv/Fm), another important trait to monitor the effect of irrigation water induced salinity by reflecting the maximum efficiency of the light absorption and its conversion into chemical energy is directly correlated with the quantum yield of net photosynthesis [42-43]. Such variations under salinity stress indicated disturbances in PS II that hastens regeneration of RuBP under stress situations or stomata closure induced by salinity induced osmotic stress and ionic stress [44-46]. Other important aspect of salinity effects in any crop is the accumulation pattern of ions particularly Na+ and K+. Generally, plants face a dilemma about sodium metabolism i.e. minimal uptake of Na+ is desirable to build osmotic potential, to absorb water and maintain turgor, whereas excess Na+ is toxic for the same plant [23-24]. It is well established that both Na+ and K+ ions compete for entry into plant root cells due to electrophysiological similarity and thus replacement of K+ by Na+ often leads to nutritional imbalances [14, 47]. The excessive/higher accumulation of Na+ in the leaves could led to detrimental effects on the availability of water in root medium that can lead to cell dehydration, reduced turgor and disturb plant metabolism [48]. Na+/K+ is widely used as an important trait in salinity screening programmes [49-50] and an optimal Na+/K+ ratio is essential for maintaining the enzymatic reactions in the cytoplasm [51]. The co-canes which maintained low tissue Na+/K+ ratio could be considered as salinity tolerant because high Na+ interferes with K+, Ca2+ nutrition and disturbs normal metabolism and plant growth [22, 52-53]. As we have observed that better performing co-canes maintain lower Na+/K+ ratio, thus, it can be inferred from the study that maintaining a low Na+/K+ ratio can be assumed one of critical strategy in selecting salt tolerant co-canes. Irrigation water induced salinity results in loss of turgor, lowered water potential, higher accumulation of toxic. These findings from the gene expression analysis affirm the critical role of the SOS signaling pathway in salinity tolerance and highlight Co 13035 as a relatively salt-tolerant genotype, likely due to its stronger transcriptional activation of Na⁺ extrusion and signaling mechanisms. This supports earlier studies linking elevated SOS gene expression with improved salt exclusion and stress adaptation in sugarcane [54-55]. The elevated expression of antiporters like NHX1 and HKT in Co 13035 suggests more efficient Na⁺ retrieval from xylem, contributing to a favorable K⁺/Na⁺ ratio under salt stress [56-57]. NHX1 plays a vital role in compartmentalizing excess cytosolic Na⁺ into vacuoles, thereby preventing Na⁺ toxicity and contributing to osmotic adjustment [58]. Similar response has been reported in VvNHX1 expression in grapevine [59] and other salt-tolerant species. These findings suggest that Co 13035 has a stronger ion regulation system involving both Na⁺ exclusion through HKT and vacuolar sequestration via NHX1. Such transcriptional activation under salinity stress enhances the plant's ability to maintain cellular ion homeostasis and reduce salt-induced injury. Together with the previously observed upregulation of SOS1, SOS2, and SOS3, the coordinated induction of HKT and NHX1 genes in Co 13035 highlights a robust and integrated salt stress tolerance mechanism. The synergy between SOS signaling and ion transporter activity underlines the genotype’s better ability to manage ionic and osmotic stress, ultimately contributing to its better growth and yield performance under saline conditions [60-61].
CONCLUSION
Co-canes can be identified based on their physiological traits and their correlation with yield and sugar content categorizes them into salt tolerant and sensitive when grown in saline irrigated conditions. The study revealed significant genotypic variability in morpho-physiological and molecular responses of sugarcane genotypes under varying salinity stress. Traits such as RWC, chlorophyll content, gas exchange parameters, and ion accumulation patterns were markedly affected by increasing salinity, leading to reduced cane and sugar yields. Genotypes like Co 13035 and Co 0238 exhibited better physiological performance and yield stability under stress. Moreover, the enhanced expression of SOS1, SOS2, SOS3, HKT, and NHX1 genes in Co 13035 underscores its robust ionic homeostasis and salt tolerance potential. These findings can guide the selection and breeding of salt-tolerant sugarcane genotypes for sustainable cultivation in salt-affected regions.
-
Funding:
This research received no external funding.
-
Abbreviations: ECiw - Electrical conductivity of irrigation water; RWC - Relative water content; SPAD - Soil plant analysis development; Pn - Photosynthetic rate; gS - Stomatal conductance; E - Transpiration rate; Na - Sodium; K - Potassium; FW - Fresh weight; DW - Dry weight; TW - Turgid weight; Fv - Variable fluorescence; Fm - Maximum fluorescence.
-
Institutional Review Board Statement: Not applicable” for studies not involving humans or animals.
-
Informed Consent Statement: Not applicable” for studies not involving humans or animals.
-
Use of Generative Artificial Intelligence: The author declare that did not use the artificial intelligence.
Acknowledgments:
We thank ICAR-CSSRI, Karnal and ICAR-SBI, Regional Center, Karnal for logistic support to complete this study.
Data Availability Statement:
Data will be available from corresponding author on reasonable request.
REFERENCES
-
1 Sánchez-Ken JG, Clark LG. Phylogeny and a new tribal classification of the Panicoideaes. l. (Poaceae) based on plastid and nuclear sequence data and structural data. Am J Bot. 2010 Oct; 97(10): 1732-48. doi: https://doi.org/10.3732/ajb.1000024
» https://doi.org/10.3732/ajb.1000024 -
2 Pooja, Nandwal AS, Chand M, Kumari A, Goel V, Rani B, et al. Soil moisture deficit induced changes in antioxidant defense mechanism of sugarcane varieties differing in maturity. Ind J Agr Sci. 2020 Jun; 90(6): 56-61. doi: https://doi.org/10.56093/ijas.v90i3.101458
» https://doi.org/10.56093/ijas.v90i3.101458 -
3 Zhao D, Zhu K, Momotaz A, Gao X. Sugarcane plant growth and physiological responses to soil salinity during tillering and stalk elongation. Agriculture 2020 Dec; 10(12):608. doi: https://doi.org/10.3390/agriculture10120608
» https://doi.org/10.3390/agriculture10120608 -
4 Preet K, Dhansu P, Sehrawat N, Kumar R, Appunu C, Vengavasi K, et al. Morpho-physiological analysis of salinity tolerance in sugarcane genotypes. Plant Physiol Rep. 2024 Jun; 29(2): 356-66. doi: https://doi.org/10.1007/s40502-024-00782-8
» https://doi.org/10.1007/s40502-024-00782-8 -
5 Negrao S, Schmockel SM, Tester M. Evaluating physiological responses of plants to salinity stress. Ann Bot. 2017 Sep; 119(1): 1-11. Doi: https://doi.org/10.1093/aob/mcw191
» https://doi.org/10.1093/aob/mcw191 -
6 Acosta Motos JR, Ortuño MF, Bernal Vicente A, Diaz-Vivancos P, Sanchez Blanco MJ, Hernandez JA. Plant Responses to Salt Stress: Adaptive Mechanisms. Agronomy 2017 Feb; 7(1): 18. Doi: https://doi.org/10.3390/agronomy7010018
» https://doi.org/10.3390/agronomy7010018 -
7 Plaut Z, Meinzer FC, Federman E. Leaf development, transpiration and ion uptake and distribution in sugarcane cultivars grown under salinity. Plant soil. 2000 Jan; 218: 59-69. doi: https://doi.org/10.1023/a:1014996229436
» https://doi.org/10.1023/a:1014996229436 -
8 Santana MJ de, Carvalho J de A, Souza KJ de, Sousa AMG de, Vasconcelos CL, Andrade LA de B. Effects of irrigation water salinity upon the sprouting and initial development of sugar cane (Saccharum spp) and on soils with different textural levels. Science Agrotech.. 2007 Oct; 31(5): 1470-6. doi: https://doi.org/10.1590/s1413-70542007000500030
» https://doi.org/10.1590/s1413-70542007000500030 -
9 Dhansu P, Kulshreshtha N, Kumar R, Raja AK, Pandey SK, Goel V, et al. Identification of drought-tolerant co-canes based on physiological traits, yield attributes and drought tolerance indices. Sugar Tech 2021 Mar; 23 (3): doi: https://doi.org/10.1007/s12355-021-00967-7
» https://doi.org/10.1007/s12355-021-00967-7 -
10 Kumar R, Meena MR, Kulshreshtha N, Kumar A, Ram B. Genotypic response of recently evolved sugarcane Co-clones under different levels of saline irrigation water. J Suga. Res. 2017 Jun; 7(2):159-68. doi: https://doi.org/10.37580/jsr.2019.2.9.196-198
» https://doi.org/10.37580/jsr.2019.2.9.196-198 -
11 Patade VY, Sujata B, Penna S. Halopriming imparts tolerance to salt and PEG induced drought stress in sugarcane. Agr Eco Environ. 2009 Feb; 134(1-2):24-8. Doi: https://doi.org/10.1016/j.agee.2009.07.003
» https://doi.org/10.1016/j.agee.2009.07.003 -
12 Mann A, Kumar N, Kumar A, Lata C, Kumar A, Meena BL, et al. De novo transcriptomic profiling of differentially expressed genes in grass halophyte Urochondra setulosa under high salinity. Sci Rep. 2021 Mar; 11(3):5548. Doi: https://doi.org/10.1038/s41598-021-85220-7
» https://doi.org/10.1038/s41598-021-85220-7 -
13 Kumar A, Kumar A, Kumar P, Lata C, Kumar S. Effect of individual and interactive alkalinity and salinity on physiological, biochemical and nutritional traits of Marvel grass. Ind J Expt Biol. 2018 Aug; 56(8):573-81. Doi: https://doi.org/10.56093/ijas.v88i8.82578
» https://doi.org/10.56093/ijas.v88i8.82578 -
14 Lata C, Soni S, Kumar N, Kumar A, Pooja, Mann A, et al. Adaptive mechanism of stress tolerance in Urochondra (grass halophyte) using roots study. Ind. J. Agr. Sci. 2019 Jun; 89(6): 1050-2. doi: https://doi.org/10.56093/ijas.v89i6.90834
» https://doi.org/10.56093/ijas.v89i6.90834 - 15 Mandal AK, Sharma RC, Singh G, Dagar JC. Computerized database on salt affected soils in India. CSSRI/ Technical Bull./2/2010, p 28.
-
16 Weatherley PE. Studies in the water relation of cotton plants. The field measurement of water deficit in leaves. New Phytol. 1950 Jan; 49(1):81-7. Doi: https://doi.org/10.1111/j.1469-8137.1950.tb05146.x
» https://doi.org/10.1111/j.1469-8137.1950.tb05146.x -
17 Arnon DI. Copper enzymes in isolated chloroplasts polyphenoloxidase in Beta vulgaris Plant Physiology 1949 Jan; 24(1):1-15. Doi: https://doi.org/10.1104/pp.24.1.1
» https://doi.org/10.1104/pp.24.1.1 - 18 Kassambara A, Fabian M. Extract and Visualize the Results of Multivariate Data Analyses [R package factoextra version 1.0.7], 2020.
- 19 Pooja, Nandwal AS, Chand M, Singh K, Mishra AK, Kumar A, et al. Varietal variation in physiological and biochemical attributes of sugarcane varieties under different soil moisture regimes. Ind J Expt Biol. 2019 Oct; 57(10):721-32.
-
20 Soni S, Kumar A, Sehrawat N, Kumar A, Kumar N, Lata C, et al. Effect of saline irrigation on plant water traits, photosynthesis and ionic balance in durum wheat genotypes. Saudi J Biol Sci. 2021 Apr; 28(4): 2510-7. doi: https://doi.org/10.1016/j.sjbs.2021.01.052
» https://doi.org/10.1016/j.sjbs.2021.01.052 -
21 Venkataramana S, Rao PNG, Naidu KM. The effects of water stress during the formative phase on stomatal resistance and leaf water potential and its relationship with yield in ten sugarcane varieties. Field Crop Res. 1986; 13: 345-53. doi: https://doi.org/10.1016/0378-4290(86)90035-3
» https://doi.org/10.1016/0378-4290(86)90035-3 -
22 Kumar A, Kumar A, Lata C, Kumar S. Eco-physiological responses of Aeluropus lagopoides (grass halophyte) and Suaeda nudiflora (non-grass halophyte) under individual and interactive sodic and salt stress. South Afr J Bot. 2016 Jul; 105 (7):36-44. doi: https://doi.org/10.1016/j.sajb.2015.12.006
» https://doi.org/10.1016/j.sajb.2015.12.006 - 23 Kumar A, Mann A, Lata C, Kumar N, Sharma PC. Salinity induced physiological and molecular responses of halophytes. In: Dagar JC (Ed.), Research developments in saline agriculture. Springer Nature Singapore Pte Ltd., 2019, pp. 331-56.
-
24 Kumar A, Mann A, Kumar A, Kumar N, Meena BL. Physiological response of diverse halophytes to high salinity through ionic accumulation and ROS scavenging. Internat J Phytorem. 2021 Feb; 23(10): 1041-51. doi: https://doi.org/10.1080/15226514.2021.1874289
» https://doi.org/10.1080/15226514.2021.1874289 -
25 Pooja, Nandwal AS, Chand M, Kumari A, Goel V, Rani B, et al. Genotypic differences in growth behavior and quality parameters of sugarcane (Saccharum officinarum) varieties under moisture stress conditions. Ind J Agr Sci. 2019 Jan; 89(1): 65-72. doi: https://doi.org/10.56093/ijas.v89i1.86160
» https://doi.org/10.56093/ijas.v89i1.86160 -
26 Dhansu P, Kumar R, Kumar A, Vengavasi K, Raja AK, Vasantha S, et al. Differential physiological traits, ion homeostasis and cane yield of sub-tropical sugarcane varieties in response to long-term salinity stress. Sustainability. 2022 Oct; 14(20): 13246. doi: https://doi.org/10.3390/su142013246
» https://doi.org/10.3390/su142013246 -
27 Yadav T, Kumar A, Yadav RK, Yadav G, Kumar R, Kushwaha M. Salicylic acid and thiourea mitigate the salinity and drought stress on physiological trait governing yield in pearl millet-wheat. Saudi J Biol Sci. 2020 Aug; 27(8):2010-7. Doi: https://doi.org/10.1016/j.sjbs.2020.06.030
» https://doi.org/10.1016/j.sjbs.2020.06.030 -
28 Verma IJ, Das HP, Ghanekar MG. A study of water requirement of sugarcane (Saccharum officinarum L.) in gangetic plains. Mausam 2004 Apr;55(2):339-44. doi: https://doi.org/10.54302/mausam.v55i2.1137
» https://doi.org/10.54302/mausam.v55i2.1137 - 29 Srivastava RN, Singh SB, Singh S. Water management in sugarcane. In Sugarcane Crop Production and improvement, ed. Singh SB, Rao GP, Solomon S and Gopalasundaram P, 511-530 Texas: Studium Press LLC, 2007.
-
30 Mall RK, Sonkar G, Bhatt D, Sharma NK, Baxla AK, Singh KK. Managing impact of extreme weather events in sugarcane in different agro-climatic zones of Uttar Pradesh. Mausam 2016 Jan; 67(1): 233-50. doi: https://doi.org/10.54302/mausam.v67i1.1187
» https://doi.org/10.54302/mausam.v67i1.1187 -
31 Sheoran P, Basak N, Kumar A, Yadav RK, Singh R, Sharma R, et al. Ameliorants and salt tolerant varieties improve rice wheat production in soils undergoing sodification with alkali water irrigation in Indo-Gangetic Plains of India. Agr Water Manage. 2021 Jan;243(1):106492. doi: https://doi.org/10.1016/j.agwat.2020.106492
» https://doi.org/10.1016/j.agwat.2020.106492 -
32 Garg N, Singla R. Growth, photosynthesis, nodule nitrogen and carbon fixation in the chickpea cultivars under salt stress. Brazilian J Plant Physiol. 2004 Dec;16(3):137-46. doi: https://doi.org/10.1590/s1677-04202004000300003
» https://doi.org/10.1590/s1677-04202004000300003 -
33 Ashraf M. Some important physiological selection criteria for salt tolerance in plants. Flora - Morphology Distribution 2004 Mar;199:361-76. doi: https://doi.org/10.1078/0367-2530-00165
» https://doi.org/10.1078/0367-2530-00165 - 34 Kumar A, Krishnamurthy SL, Lata C, Kumar P, Devi R, Kulshrestha N, et al. Effect of dual stress (salinity and drought) on gas exchange attributes and chlorophyll fluorescence characteristics in rice. Ind J Agr Sci. 2016 Jun; 86(6): 19-27.
-
35 Lu HB, Qiao YM, Gong XC, Li HQ, Zhang Q, Zhao ZH, et al. Influence of drought stress on the photosynthetic characteristics and dry matter accumulation of hybrid millet. Photosynthetica 2015 Apr; 53(4): 306-11. doi: https://doi.org/10.1007/s11099-015-0120-7
» https://doi.org/10.1007/s11099-015-0120-7 -
36 Bernacchi C, Calfapietra C, Davey PA, Wittig VA, Scarascia Mugnozza G, Raines CA, et al. Photosynthesis and stomatal conductance responses of poplars to free-air CO2 enrichment (PopFACE) during the first growth cycle and immediately following coppice. New Phytol. 2003 Jul;159(3):609-21. doi: https://doi.org/10.1046/j.1469-8137.2003.00850.x
» https://doi.org/10.1046/j.1469-8137.2003.00850.x - 37 Guerrier G. Capacites PEPCase et MDH extraites des plantules germees en milieu sale: des parameters biochimiques de l' ecophysiologic de la plante. Seed Sci. Tech. 1988;16:571-8.
-
38 Tester M, Davenport R. Na+ tolerance and Na+ transport in higher plants. Ann Bot. 2003 Apr.; 91(5): 503-27. doi: https://doi.org/10.1093/aob/mcg058
» https://doi.org/10.1093/aob/mcg058 -
39 Chaves MM, Flexas J, Pinheiro C. Photosynthesis under drought and salt stress: regulation mechanisms from whole plant to cell. Annals Bot. 2009 Feb;103(4):551-60. doi: https://doi.org/10.1093/aob/mcn125
» https://doi.org/10.1093/aob/mcn125 -
40 Yang D, Peng S Wang F. Response of photosynthesis to high growth temperature was not related to leaf anatomy plasticity in Rice (Oryza sativa L.). Front Plant Sci. 2020 Feb;11:26. doi: https://doi.org/10.3389/fpls.2020.00026
» https://doi.org/10.3389/fpls.2020.00026 -
41 Sheoran P, Kumar A, Singh A, Kumar A, Parjapat K, Sharma R, et al. Pressmud alleviates soil sodicity stress in a rice-wheat rotation: Effects on soil properties, physiological adaptation and yield-related traits. Land Degrad Develop. 2021 Apr; 32 (9): 2735-48. doi: https://doi.org/10.1002/ldr.3953
» https://doi.org/10.1002/ldr.3953 -
42 Maxwell K, Johnson GN. Chlorophyll fluorescence - a practical guide. J Expt. Bot. 2000 Apr;51(345):659-68. doi: https://doi.org/10.1093/jexbot/51.345.659
» https://doi.org/10.1093/jexbot/51.345.659 -
43 Graça JP, Rodrigues FA, Farias JRB, Oliveira MCN, Hoffmann-Campo CB, Zingaretti SM. Physiological parameters in sugarcane cultivars submitted to water deficit. Brazilian J Plant Physiol. 2010 Dec; 22 (3):189-97. doi: https://doi.org/10.1590/s1677-04202010000300006
» https://doi.org/10.1590/s1677-04202010000300006 -
44 Dionisio-Sese ML, Tobita S. Effects of salinity on sodium content and photosynthetic responses of rice seedlings differing in salt tolerance. J Plant Physiol. 2000 Jul; 157(1):54-8. doi: https://doi.org/10.1016/s0176-1617(00)80135-2
» https://doi.org/10.1016/s0176-1617(00)80135-2 - 45 Kafi M. Effect of salinity and light on photosynthesis, respiration and chlorophyll fluorescence in salt-sensetive wheat (Triticum aestivum) cultivars. J Agr Sci Tech. 2009 Jan; 11(5): 547-55.
-
46 Kumar N, Nandwal AS, Waldia RS, Singh S, Devi S, Sharma KD, et al. Drought tolerance in chickpea as evaluated by root characteristics, plant water status, and membrane integrity and chlorophyll fluorescence techniques. Expt Agr. 2012 Mar; 48(3):378-87. doi: https://doi.org/10.1017/s0014479712000063
» https://doi.org/10.1017/s0014479712000063 -
47 Benito B, Haro R, Amtmann A, Cuin TA, Dreyer I. The twins K+ and Na+ in plants. J. Plant. Physiol. 2014 May; 171(9):723-31. doi: https://doi.org/10.1016/j.jplph.2013.10.014
» https://doi.org/10.1016/j.jplph.2013.10.014 - 48 Taiz L, Zeiger E. Plant Physiology, 4th edn, Sinauer Associates, Inc.; ISBN 978-0878938568, Sunderland, Massachusetts. 2006.
-
49 Shabala S, Cuin TA. Potassium transport and plant salt tolerance. Physiol Plant. 2008 Aug; 133(4): 651-69. doi: https://doi.org/10.1111/j.1399-3054.2007.01008.x
» https://doi.org/10.1111/j.1399-3054.2007.01008.x -
50 Koksal N, Alkan-Torun A, Kulahlioglu I, Ertargin E, Karalar E. Ion uptake of marigold under saline growth conditions. Springerplus. 2016 Feb;5(1):139. doi: https://doi.org/10.1186/s40064-016-1815-3
» https://doi.org/10.1186/s40064-016-1815-3 -
51 Essah PA, Davenport R, Tester M. Sodium influx and accumulation in Arabidopsis Plant Physiol. 2003 Sep; 133(1):307-18. doi: https://doi.org/10.1104/pp.103.022178
» https://doi.org/10.1104/pp.103.022178 -
52 Maathuis FJM, Amtmann A. K+ nutrition and Na+ toxicity: the basis of cellular K+/Na+ ratios. Ann Bot. 1999 Aug; 84(2):123-33. doi: https://doi.org/10.1006/anbo.1999.0912
» https://doi.org/10.1006/anbo.1999.0912 -
53 Tavakkoli E, Fatehi F, Coventry S, Rengasamy P, McDonald GK. Additive effects of Na and Cl ions on barley growth under salinity stress. J Expt Bot. 2011 Jan; 62(6): 2189-203. doi: https://doi.org/10.1093/jxb/erq422
» https://doi.org/10.1093/jxb/erq422 -
54 Zhou Y, Lai Z, Yin X. Hyperactive mutant of a wheat plasma membrane Na+/H+ antiporter improves the growth and salt tolerance of transgenic tobacco. Plant Sci. 2016 Dec; 253:176-86. doi: https://doi.org/10.1016/j.plantsci.2016.09.016
» https://doi.org/10.1016/j.plantsci.2016.09.016 -
55 Feki K, Brini F, Ben Amar S. Comparative functional analysis of two wheat Na+/H+ antiporter SOS1 promoters in Arabidopsis thaliana under various stress conditions. J Appl Genet. 2015 Feb; 56(1): 15-26. doi: https://doi.org/10.1007/s13353-014-0228-7
» https://doi.org/10.1007/s13353-014-0228-7 -
56 Guo H, Zhang L, Cui YN. Identification of candidate genes related to salt tolerance of the secretohalophyte Atriplex canescens by transcriptomic analysis. BMC Plant Biol. 2019 May; 19(1): 213. doi: https://doi.org/10.1186/s12870-019-1827-6
» https://doi.org/10.1186/s12870-019-1827-6 -
57 Jabeen Z, Irshad F, Hussain N. NHX-Type Na+/H+ Antiporter Gene Expression Under Different Salt Levels and Allelic Diversity of HvNHX in Wild and Cultivated Barleys. Frontiers in Genetics. 2022 Feb; 12: 809988. doi: https://doi.org/10.3389/fgene.2021.809988
» https://doi.org/10.3389/fgene.2021.809988 -
58 Sharma H, Sharma A, Sidhu S, Upadhyay SK. Na+/H+ antiporter (NHX) and salt stress tolerance. Cation Transporters in Plants. 2021 Jan; 99-113. doi: https://doi.org/10.1016/b978-0-323-85790-1.00008-7
» https://doi.org/10.1016/b978-0-323-85790-1.00008-7 -
59 Upadhyay A, Upadhyay AK, Bhirangi RA 2012. Expression of Na+/H+ antiporter gene in response to water and salinity stress in grapevine rootstocks. Plant Biol. 2012 Feb; 56(4): 762-66. doi: https://doi.org/10.1007/s10535-012-0240-x
» https://doi.org/10.1007/s10535-012-0240-x -
60 Brindha C, Vasantha S, Raja AK, Tayade AS. Characterization of the Salt Overly Sensitive pathway genes in sugarcane under salinity stress. Physiol. Plant. 2021 Apr; 171(4): 667-87. doi: https://doi.org/10.1111/ppl.13245
» https://doi.org/10.1111/ppl.13245 -
61 Chakraborty K, Basak N, Bhaduri D. Ionic basis of salt tolerance in plants: Nutrient homeostasis and oxidative stress tolerance. Plant Nutrients and Abiotic Stress Tolerance. 2018 Jun; 325-62. doi: https://doi.org/10.1007/978-981-10-9044-8_14
» https://doi.org/10.1007/978-981-10-9044-8_14
-
Editor-in-Chief:
Bill Jorge Costa
-
Associate Editor:
Adriel Ferreira da Fonseca