 Analysis of the dry matter and essential nutrient accumulation of maize (Zea mays L.) in the main phenophases
Abstract
Increasing and maintaining maize yield to feed the growing population faces challenges due climate change limitations and soil degradation. Knowledge of nutrient dynamics particularly at critical stages of plant growth and development is crucial for effective fertilization decisions. The experiment was carried out in 2022 at the Látókép Crop Production Experimental Site of the University of Debrecen, Hungary. The aim was to evaluate the dynamics of nutrient accumulation in maize at six different phenological stages. After collecting the test plants and dividing them into various parts, average dry matter and nutrient concentrations were determined. Results demonstrated that the plant parts absorbed nutrients differently at each growth stage. Most of the nutrients accumulated in grains during the post-silking stage were primarily redirected from the vegetative organs. Only N, P, Mg, S, and Zn contributed significantly to the grain’s mineral content. The maximum dry matter accumulation was 23784.4 kg*ha-1. Nutrient accumulation was in the order of K > N > P > Ca > Mg > S > Fe > Mn > Zn > Cu > B. This research emphasizes the importance of improving our understanding of nutritional crop requirements and their distribution in maize plants during developmental phenophases for optimal maize yield and quality.
Keywords:
maize development; growth stage; food security; nutrient remobilization; precision crop nutrition
Resumo
Aumentar e manter a produção de milho para alimentar a população crescente enfrenta desafios devido às limitações impostas pelas mudanças climáticas e pela degradação do solo. O conhecimento da dinâmica dos nutrientes, particularmente em estágios críticos do crescimento e desenvolvimento das plantas, é crucial para decisões eficazes de fertilização. O experimento foi realizado em 2022 no Campo Experimental de Produção Vegetal Látókép da Universidade de Debrecen, na Hungria. O objetivo foi avaliar a dinâmica do acúmulo de nutrientes no milho em seis estágios fenológicos diferentes. Após coletar as plantas de teste e dividi-las em várias partes, foram determinadas as concentrações médias de matéria seca e nutrientes. Os resultados demonstraram que as partes da planta absorveram nutrientes de forma diferente em cada estágio de crescimento. A maioria dos nutrientes acumulados nos grãos durante o estágio pós-florescimento foi redirecionada principalmente dos órgãos vegetativos. Apenas N, P, Mg, S e Zn contribuíram significativamente para o conteúdo mineral do grão. O acúmulo máximo de matéria seca foi de 23.784,4 kg*ha-1. O acúmulo de nutrientes foi na ordem de K > N > P > Ca > Mg > S > Fe > Mn > Zn > Cu > B. Esta pesquisa enfatiza a importância de melhorar nossa compreensão das necessidades nutricionais das culturas e sua distribuição nas plantas de milho durante as fenofases de desenvolvimento para obter produtividade e qualidade ideais do milho.
Palavras-chave:
desenvolvimento do milho; estágio de crescimento; segurança alimentar; remobilização de nutrientes; nutrição de culturas de precisão
1. Introduction
Maize is one of the most cultivated crops globally, grown on some 200 million (M) ha (Erenstein et al., 2022) with a global average yield of 5640 kg*ha−1 (Zhang et al., 2023b). As a C4 plant, maize has special morphological feature called Kranz anatomy, which makes the crop well-suited to hot and dry climates (Sedelnikova et al., 2018). However, due to extensive breeding interventions, maize became suitable for cold regions as well (Chaudhary et al., 2014). The plant is considered a major source of nutrition for humans and animals, as well as raw material for manufacturing (Zhang et al., 2020). Maize is rich in carbohydrates, fiber, essential vitamins, and minerals. Its nutritional composition makes it a valuable tool for combating malnutrition, especially in vulnerable regions where other nutritious options are limited. In addition, as the world’s population continues to grow to an estimated 9 billion people by 2050 (Godfray et al., 2010; Del Borghi et al., 2022), inflation in food demands is expected to rise by 70% (Randive et al., 2021; Zhai et al., 2022). Therefore, raising maize yield is such a global priority for food and feed security. In order to achieve this goal, the use of fertilizers in addition to other balanced inputs, has been playing an important role in plant growth and development, consequently promoting high-yield agriculture (Ahmad et al., 2023). However, of the factors hindering plant growth and limiting optimal yield are those associated with plant-specific requirements, such as water availability and mineral nutrient imbalance. The sensitivity of maize to water and essential nutrient availability was brought to attention by Nagy (2006), especially throughout the physiological stages, which are crucial for the crop's healthy growth. During the growth season, maize nutrient demand and uptake change dynamically (Vágó et al., 2014) and are associated with important vegetative or reproductive growth stages (Stewart et al., 2021). These authors reported that, for most nutrients, the maximum nutrient uptake occurs between V-10 and V-14 and reaching a plateau at VT/R, creating a sigmoidal shape of the seasonal uptake. During the vegetative stage, as growth rate accelerates, nutrient uptake and accumulation increase, and the nutrient demand becomes higher. At this point, the plant can take up large amounts of nitrogen, phosphorus, potassium, and other nutrients. Therefore, it is considered as a critical stage and any deficiency experienced can negatively impact the final yield. Then, during the reproductive stage, maize cobs begin to form, which are the main yield factors and are greatly influenced by nutrient availability. Therefore, a high amount of essential nutrients is required for grain development. Subsequently, from the grain filling to the maturity stage, maize accumulates a large amount of minerals. At the time of physiological maturity, the accumulation of dry matter and minerals is complete. It is, therefore, essential to understand the nutrient requirements of a plant according to its phenological phase in order to be able to establish a fertilizer management plan, especially for modern genotypes with high production potential (Cavalcante et al., 2018). This study aimed to determine the progression of macro- and micronutrient accumulation in different phenological stages of maize biomass for the purpose of understanding and revealing its specific nutrient requirements to guide precision nutrient supply decisions.
2. Materials and Methods
2.1. Description of the experimental area
The research was carried out in 2022 at the Látókép Crop Production Experimental Site of the University of Debrecen, located in West of Debrecen (47°33' N 21°26' E), Hungary. The experiment was laid on calcareous chernozem soil, having the physical and chemical properties as presented in Table 1.
2.2. Climatic conditions
According to the collected daily weather data obtained from the weather station at the Látókép Experimental Site, April was characterized by cool temperature, and it was 2.2 °C cooler compared to the multi-year average temperature (Table 2). May, in contrast, was warmer. Positive anomalies of 2.9 °C in June, 2.1 °C in July, and 2.7 °C in August were registered during the cropping season, i.e. significant warm weather accompanied by little precipitation during the three summer months with a total rainfall of 56.6 mm. The lack of rainfall resulted in severe drought. These conditions, in consequence, were unfavorable for maize production. A significant change in weather conditions occurred during September in the form of heavy rainfall with a total of 152 mm, which led to delay the harvesting time to October (Gombos et al., 2023; Gombos and Nagy, 2023).
Monthly and half-year characteristics of the precipitation and temperature (Debrecen-Látókép) in 2022.
2.3. Experimental design, treatment, and data collection
The maize excellence, randomized split-plot field experiment was started in 2018, to evaluate the physiological and yield parameters of different maize genotypes with advanced precision farming technology. In 2022, the fifth year with identical parameters, the experiment was sown on 26th April with a plant spacing of 15.6 cm, and a total plant population of 62 000 plants/ha, and they were harvested on 10th October. The research was conducted analyzing the results of two maize hybrids (FAO350 and FAO420) of mid-maturity characteristics with high production areas in Hungary, making the results relevant to later practical use cases.
A drip irrigation system was installed in the experiment from 27th May and lasted until 11th August providing 8 mm of irrigation water per 2 days (28 total applications, which is the equivalent of 456.8 mm). Data collection was done considering the maize phenological stages classification system proposed by Hanway (1963) who established the developmental stages before silking based on the number of leaves. Hanway defined subsequent stages based on grain development and divided the growing season of maize into 11 stages. During the growing season, at six different phenological stages, the nutrient composition of the studied hybrids was evaluated using 4 randomized replications from each hybrid, respectively. Thus, at the V6, V12, R1 (Silking), R2 (Blister), R4 (Dough), and R6 (Maturity) stages, four randomly selected plants were collected from each hybrid, partitioned into leaves, stalk with tassel, ear with silk, cob, kernels and husk. The plant parts were placed in paper bags, which were oven-dried at 60 °C for 72 h (to 120 h depending on the stage) and then weighed to obtain the dry matter (DM) of the plants. As a next step, they were sent to the laboratory in order to analyze their nutrient concentrations. Therefore, 0.5 g of the prepared average sample was weighed and 5 ml of distilled cc. HNO3 and 3 ml of 30% H2O2 were added. Then, the samples were destructed using an Ethos Plus Milestone microwave destructor and in accordance with Application Note 076, followed by measurements in ICAM 7000 spectrophotometer, measuring the wavelength spectral line of the plasma light emission characteristic of each element.
2.4. Statistical analysis
Data were subjected to analysis of variance (ANOVA) to identify the significant differences in the essential nutrient content between each phenological stage. Means were compared using Tukey’s test where the mean differences were considered significant at p<0.05. Pearson’s correlation analysis and cluster analysis were performed. Minitab v19.2020.1 software was used for statistical analyses and graphs were created using Minitab and MS Excel 365.
3. Results
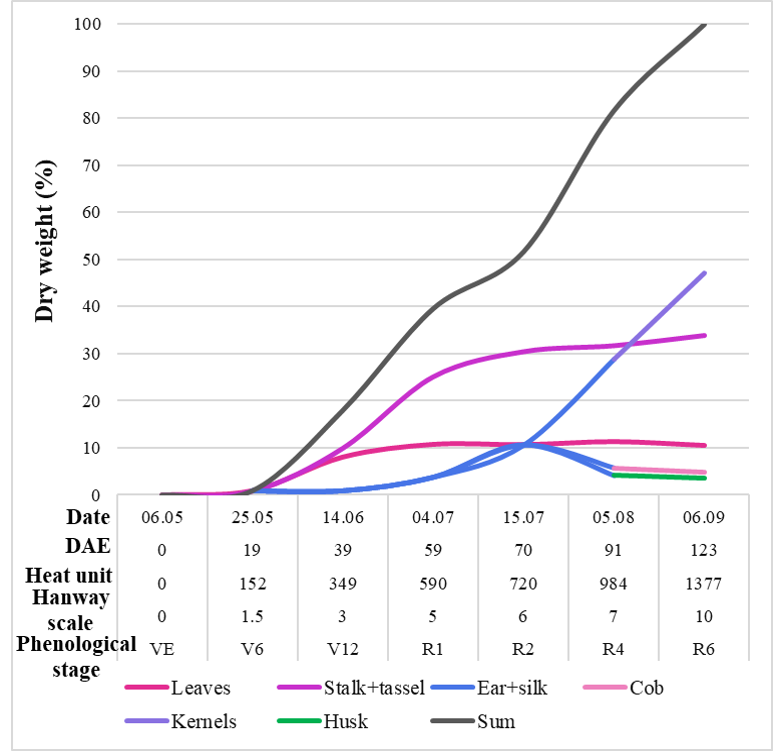
The emergence of the studied hybrids occurred 10 days after sowing. The development of maize plants can be divided into three main stages characterizing the early vegetative stage (VE until V6), the vegetative stage (V6 until R1), and the reproductive and grain filling stage (R1 until R6). The average yield produced by the crops was 13.4 kg*ha-1. The accumulation of plant parts dry matter, for instance, that of leaves, stalks, ear, kernels, cob, and husk during the growing season can be divided into three main phases. Up to V6, the accumulation of dry matter at this phase was slow and the plants accumulated 216.8 kg*ha-1 of both leaves and stalk, which corresponds to only 0.9% of the total accumulated dry matter at the end of the growing season (23784.4 kg*ha-1) (Figure 1). From then on, a large accumulation of dry matter takes place mainly by the vegetative organs to the R1 stage, accumulating 2543 kg*ha-1 of leaves dry matter, 5990.3 kg*ha-1 of stalk dry matter, and 894.5 kg*ha-1 of ear dry matter, respectively, corresponding to 10.7%, 25.2%, and 3.8% of the total accumulated dry matter at the end of the cycle. The overall rate of dry matter accumulation of the studied maize significantly increased to reach its maximum value at the physiological maturity stage as the kernels reached their maximum weight. At this phase (R6), the kernels held the highest dry matter accumulated at 11208.9 kg*ha-1, corresponding to 47.2% of the total accumulated dry matter, followed by the stalk with 33.9% (8082.3 kg*ha-1), and then the leaves with 10.5% (2485.8 kg*ha-1).
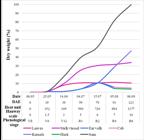
Dry matter accumulation of maize as a function of phenological stages. DAE = days after emergence. VE = emergence.
3.1. Macronutrients absorption
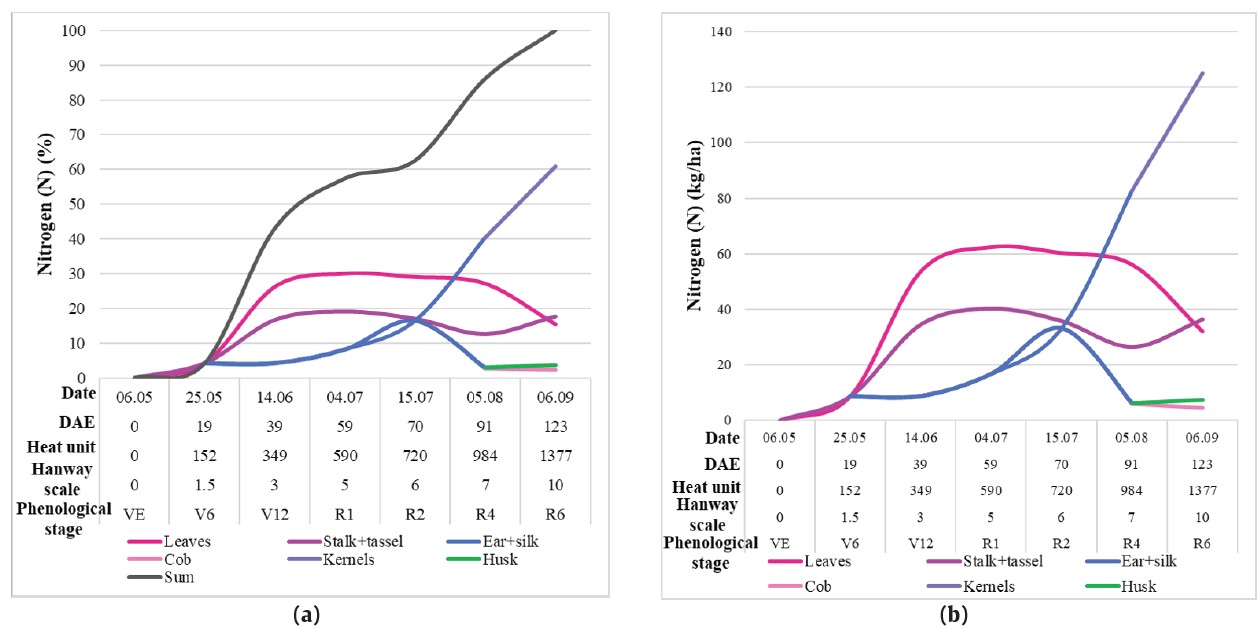
From the early stage of maize development, the demand for nitrogen was relatively small but increased rapidly in the subsequent stages. The leaves had a higher N demand compared to other organs until reaching the R4 stage when the N mobilization into the kernels occurred and accumulated the highest N content. Up to V6, the plant accumulated 8.69 kg*ha-1 of nitrogen which is the equivalent of 4.25% of the total N accumulated at the end of the cycle (Figure 2). Later on, the N absorption mainly by the plant vegetative organs increased significantly. The leaves accumulated the highest (62.5 kg*ha-1) nitrogen content at the R1 stage, followed by 40.3 kg*ha-1 in the stalk and 16.7 kg*ha-1 in the ear. This is equivalent to 30%, 19.2%, and 8.1% of the total N accumulated at the end of the growing season. After R1, as the ear development occurred, the N accumulation increased as the accumulation of nitrogen by leaves and stalk progressively decreased by 0.5 kg*ha-1 day-1 and 0.06 kg*ha-1 day-1, respectively. At the end of the growth cycle, the accumulation of nitrogen content in the kernels, stalk, leaves, husk, and cob was 125.1 kg*ha-1 (60.8%), 36.5 kg*ha-1 (17.8%), 32.1 kg*ha-1 (15.5%), 7.4 kg*ha-1 (3.6%) and 4.6 kg*ha-1 (2.3%) respectively, totaling 205.7 kg*ha-1 (100%).
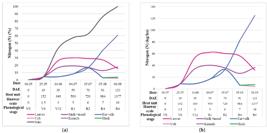
Nitrogen uptake of maize as a function of phenological stages, in percentage (a) and in Kg*ha-1 (b).
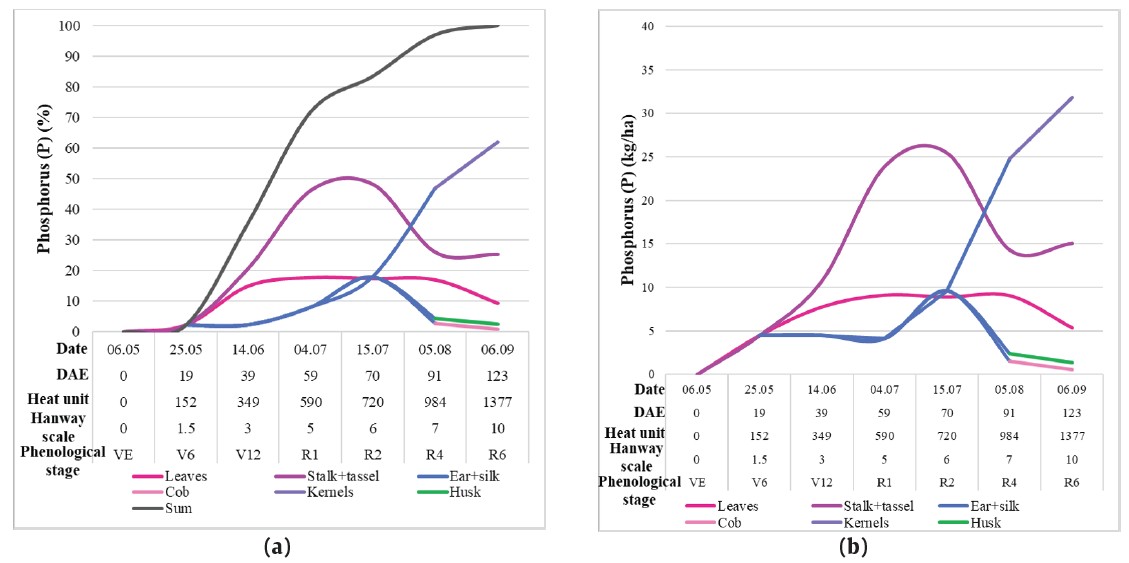
At the initial vegetative phase, the P demand was small, where the plant accumulated 4.5 kg*ha-1 of phosphorus at V6, corresponding to 2.2% of the total phosphorus accumulated at the end of the growing season (Figure 3). Later, the P uptake by the plant parts increased, specifically by the stalk with a rate of 0.5 kg*ha-1 day-1. Thus, at the R1 stage, the stalk accumulated 23.9 kg*ha-1 (46.1%), whereas the leaves and the ear accumulated relatively lower amounts of phosphorus of 9.1 kg*ha-1 (17.7%) and 4.1 kg*ha-1 (8%) respectively. From then on, the P accumulation in the stalk remained higher than in the other organs until the R2 stage, where it started to decrease as the P mobilization switched to the kernels. At the physiological maturity, the phosphorus uptake was highest in the kernels with 31.8 kg*ha-1, followed by the stalk that accumulated 15.1 kg*ha-1, leaves with 5.4 kg*ha-1, husk with 1.3 kg*ha-1 and cob with 0.5 kg*ha-1, respectively corresponding to 62%, 25.3%, 9.3%, 2.4%, and 1%, and totaling 54 kg*ha-1 (100%).
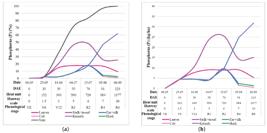
Phosphorus uptake of maize as a function of phenological stages, in percentage (a) and in Kg*ha-1 (b).
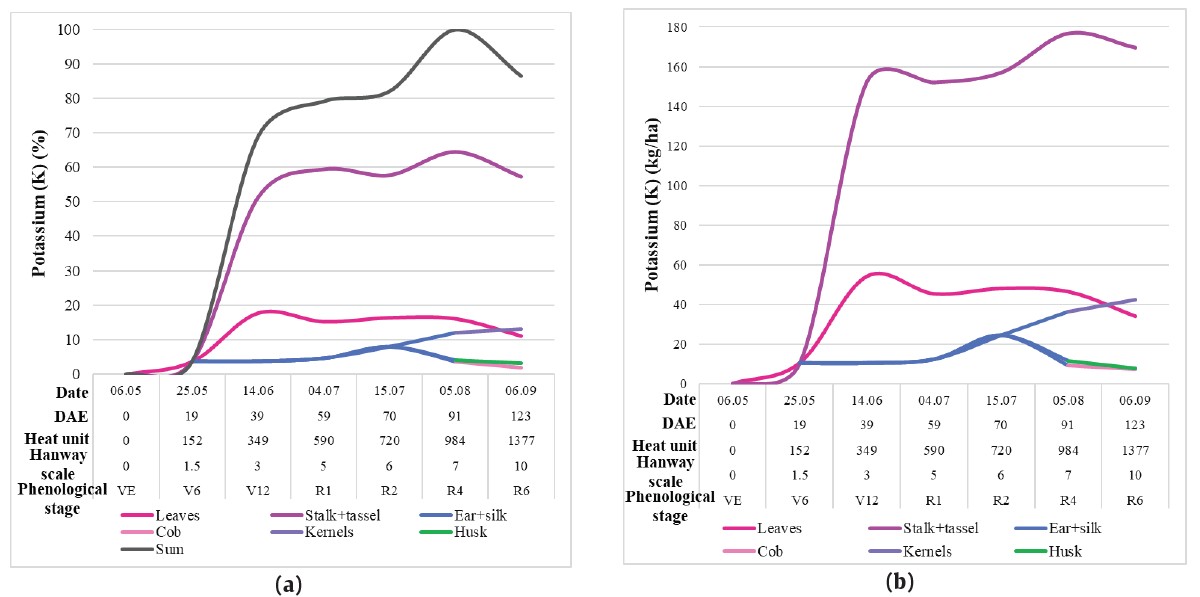
It was surprising to observe the potassium uptake curve throughout the plant's developmental stages. In contrast to N and P, a higher K uptake was observed in the vegetative parts than in the reproductive parts of the plant. It is evident from the graph below that K demand by the stalk was of major significance which needed a greater amount of potassium than that of nitrogen (Figure 4). K uptake was relatively rapid early in the growing season. Up to the R1 stage, the accumulation of potassium content was 152.1 kg*ha-1 (59.4%) in the stalk, 45.4 kg*ha-1 (15.2%) in the leaves, and 12.3 kg*ha-1 (4.5%) in the ear. The accumulation rate from the V6 to the silking stage was 1 kg*ha-1 day-1 for the leaves, 3.7 kg*ha-1 day-1 for the stalk, and 0.3 kg*ha-1 day-1 for the ear. At the physiological maturity, the stalk, kernels, leaves, husk, and cob accumulated respectively, 169.7 kg*ha-1, 42.3 kg*ha-1, 34.1 kg*ha-1, 7.8 kg*ha-1, and 7.1 kg*ha-1, corresponding to 57.2%, 13.1%, 11.1%, 3.2%, and 1.9% and totaling 261 kg*ha-1 (86.6%). The rate observed in this period was 0.8 kg*ha-1 day-1.
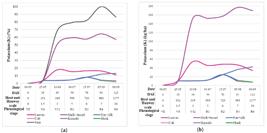
Potassium uptake of maize as a function of phenological stages, in percentage (a) and in Kg*ha-1 (b).
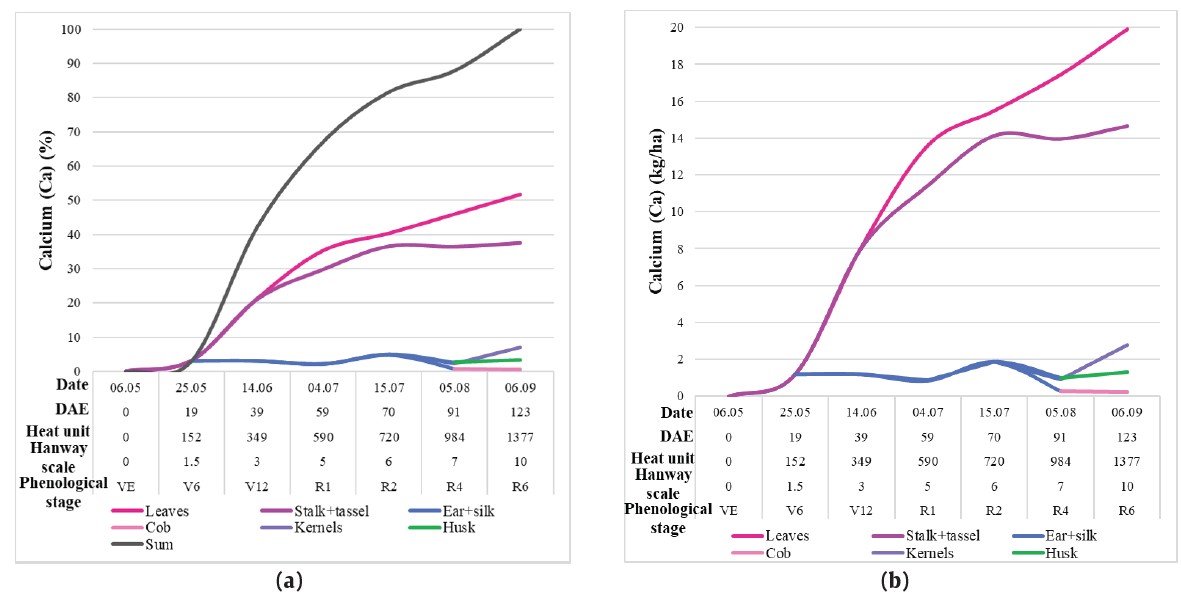
Calcium accumulation by the leaves and stalk was largely compared to the ear and its components during the whole growing season. On the one hand, the highest Ca accumulation by the leaves and the stalk occurred especially between stages V12 and R6 with an average daily accumulation of 0.3 kg*ha-1 day-1, and accumulating at the end of the cycle 19.9 kg*ha-1 (51.6%) and 14.7 kg*ha-1 (37.4%) respectively (Figure 5). On the other hand, the ear calcium uptake was small, accumulating at R1 only 0.9 kg*ha-1, corresponding to 2.2% of the total Ca accumulated at the end of the cycle. From then on, the accumulation of Ca was shifted to the ear components accumulating at the final stage, 2.8 kg of Ca (7%) in the kernels, 1.3 kg*ha-1 of Ca (3.3%) in the husk, and 0.3 kg*ha-1 of Ca (0.7%) in the cob. The total Ca accumulation by the plant at the end of the cycle was 39 kg*ha-1 (100%).
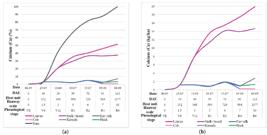
Calcium uptake of maize as a function of phenological stages, in percentage (a) and in Kg*ha-1 (b).
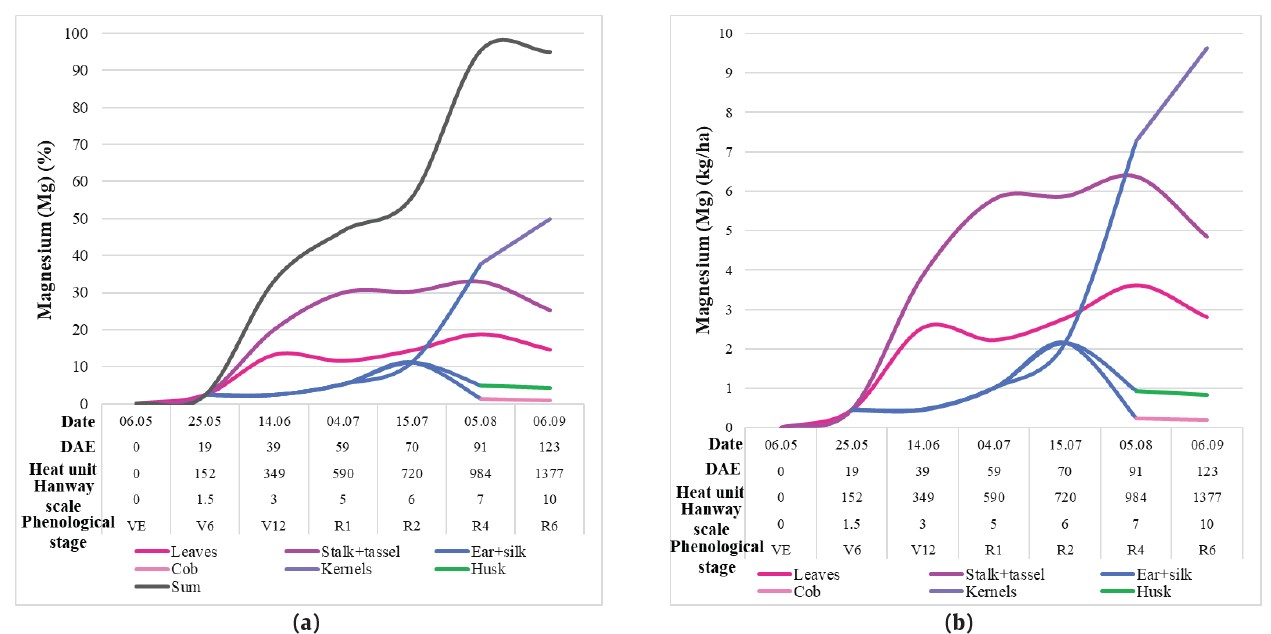
During the initial stage of plant development, the demand for Mg was small up to the V6 stage. Later, the uptake of Mg increased as the plant continued to grow. At the R1 stage, the stalk accumulated the most Mg content compared to the other plant organs with 5.8 kg*ha-1 corresponding to 29.9% (Figure 6). Whereas the leaves and the ear accumulated respectively 2.2 kg*ha-1 (11.5%) and 1 kg*ha-1 (5.2%). Until the R4 stage, the uptake of Mg by the stalk and leaves continued to increase and the allocation of nutrients into the ear occurred, thus distributing its concentration among the different components. The accumulation rate of magnesium during the period between R1 and R4 was 0.04 kg*ha-1 day-1 for the leaves and 0.02 kg*ha-1 day-1 for the stalk when it was 0.04 kg*ha-1 day-1 and 0.1 kg*ha-1 day-1, respectively, in the same organs in the previous period. The highest Mg accumulation occurred at the R6 stage by the kernels, and it accounted for 9.6 kg*ha-1, corresponding to 49.9%. The stalk, leaves, husk, and cob accumulated 4.8 kg*ha-1 (25.2%), 2.8 kg*ha-1 (14.6%), 0.8 kg*ha-1 (4.3%), and 0.2 kg*ha-1 (1%), respectively. At the end of the cycle, the maize plant accumulated 18.3 kg*ha-1 of Mg content.
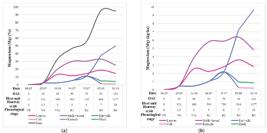
Magnesium uptake of maize as a function of phenological stages, in percentage (a) and in Kg*ha-1 (b).
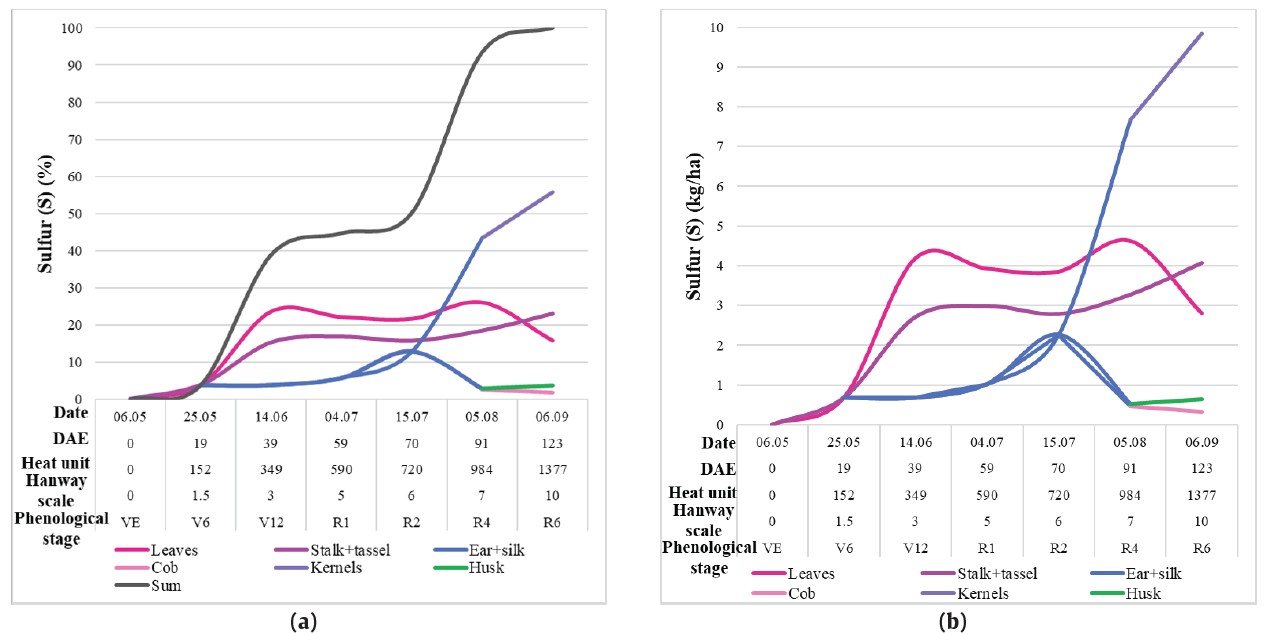
A slight similarity can be noticed between the curve of sulfur accumulation and nitrogen accumulation during the growing season but with a smaller amount (Figure 7). At the early stage of the vegetative development, the plant uptake of S was small up to V6 when it increased. However, the S accumulation curve, especially in the leaves, and in the stalk fluctuated throughout the growth cycle. It can be observed from the graph below that at the V12 stage, the leaves accumulated higher S content than the stalk, respectively accounting for 4.2 kg*ha-1 (23.7%) and 2.7 kg*ha-1 (15.3%). Later, the rate of S uptake decreased until the R2 stage. From R2 to R6 stages, the S accumulation in the leaves fluctuated when it continued to increase in the stalk. At the end of the cycle, the total S taken up by the plant was 17.7 kg*ha-1, which corresponds to 9.8 kg*ha-1 (55.7%) in the kernels, 4.1 kg*ha-1 (23%) in the stalk, 2.8 kg*ha-1 (15.8%) in the leaves, 0.7 kg*ha-1 (3.7%) in the husk, and 0.3 kg*ha-1 (1.8%) in the cob.
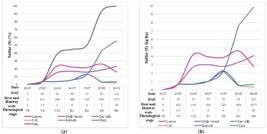
Sulfur uptake of maize as a function of phenological stages, in percentage (a) and in Kg*ha-1 (b).
3.2. Micronutrient absorption
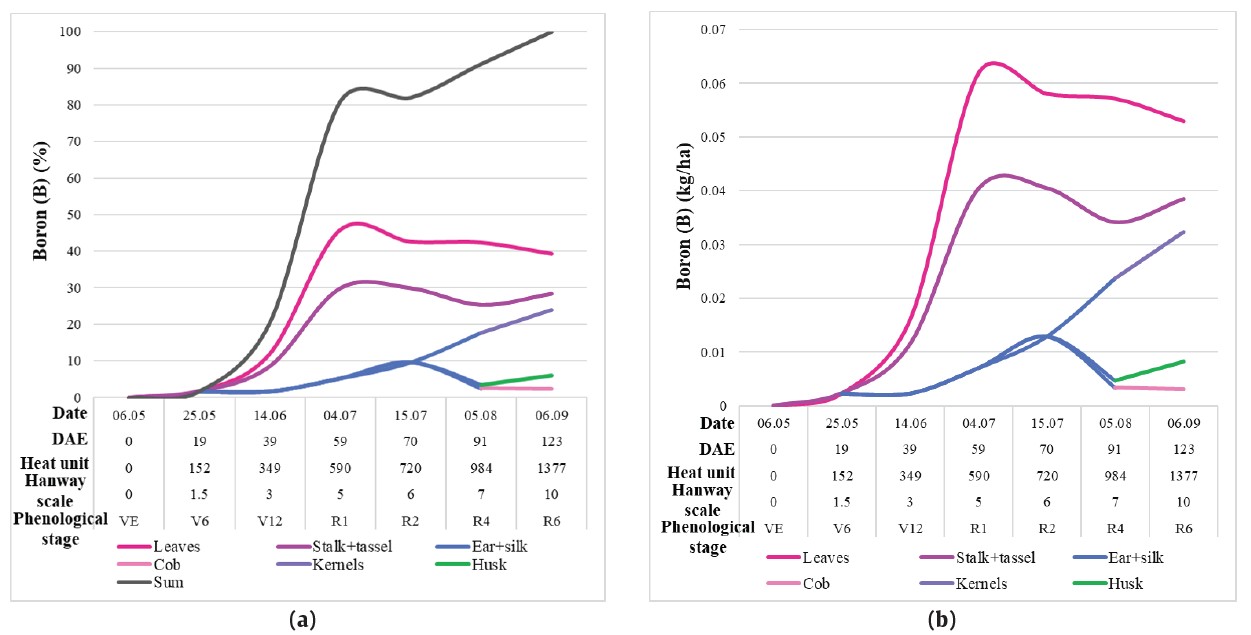
During the life cycle of maize plants, B accumulation was higher in the leaves compared to the other organs. During the initial stage of plant development, there was a small accumulation of boron of 0.002 kg*ha-1 (1.7%) until V6. However, soon after, its uptake tremendously increased (Figure 8). The highest accumulation of the boron content was observed at the R1 stage in the leaves and stalk with 0.062 kg*ha-1 (45.8%) and 0.04 kg*ha-1 (29.9%), respectively, while the ear accumulated 0.007 kg*ha-1 (5.3%). From then on, boron accumulation in the leaves and stalk progressively decreased, while the accumulation of boron in the ear increased during its development. At the R4 stage, the boron uptake by ear was partitioned into the kernels in large concentrations compared to the husk and cob. Progressing towards physiological maturity, the demand for boron by the leaves continued to decrease, while the stalk appeared to uptake higher concentrations. At the end of the cycle, the final boron content accumulated by the plant was 0.135 kg*ha-1 (100%), where the leaves, stalk, kernels, husk, and cob accumulated 0.053 kg*ha-1 (39.3%), 0.038 kg*ha-1 (28.4%), 0.032 kg*ha-1 (24%), 0.008 kg*ha-1 (6.1%) and 0.003 kg*ha-1 (2.3%), respectively.
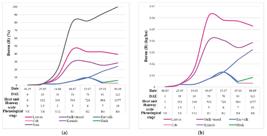
Boron uptake of maize as a function of phenological stages, in percentage (a) and in Kg*ha-1 (b).
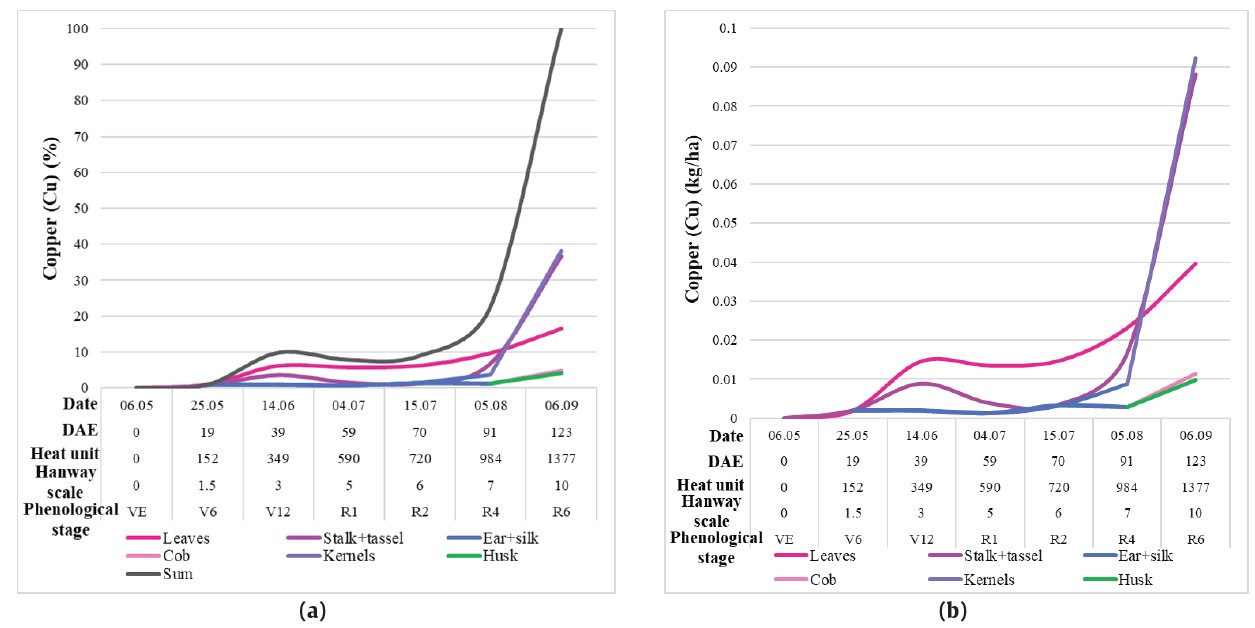
Copper accumulation by the plant parts (leaves, stalk, ear, and its components) during the growing season was in smaller amounts than that of boron before reaching the maturity stage (Figure 9). However, between stages R4 and R6, the demand for Cu by the stalk and the kernels steadily increased approaching 0.009 kg*ha-1 and even above that. The rate of Cu accumulation observed during this period was 0.0005 kg*ha-1 day-1 for the leaves, 0.002 kg*ha-1 day-1 for the stalk, and 0.002 kg*ha-1 day-1 for the kernels. The total Cu accumulated by the plant at the end of the cycle was 0.24 kg*ha-1, being 0.09 kg*ha-1 (38.2%) in the kernels, 0.09 kg*ha-1 (36.6%) in the stalk, 0.04 kg*ha-1 (16.4%) in the leaves, 0.01 kg*ha-1 (4.7%) in cob and 0.01 kg*ha-1 (4.1%) in the husk.
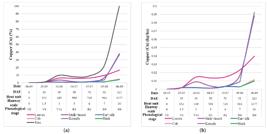
Copper uptake of maize as a function of phenological stages, in percentage (a) and in Kg*ha-1 (b).
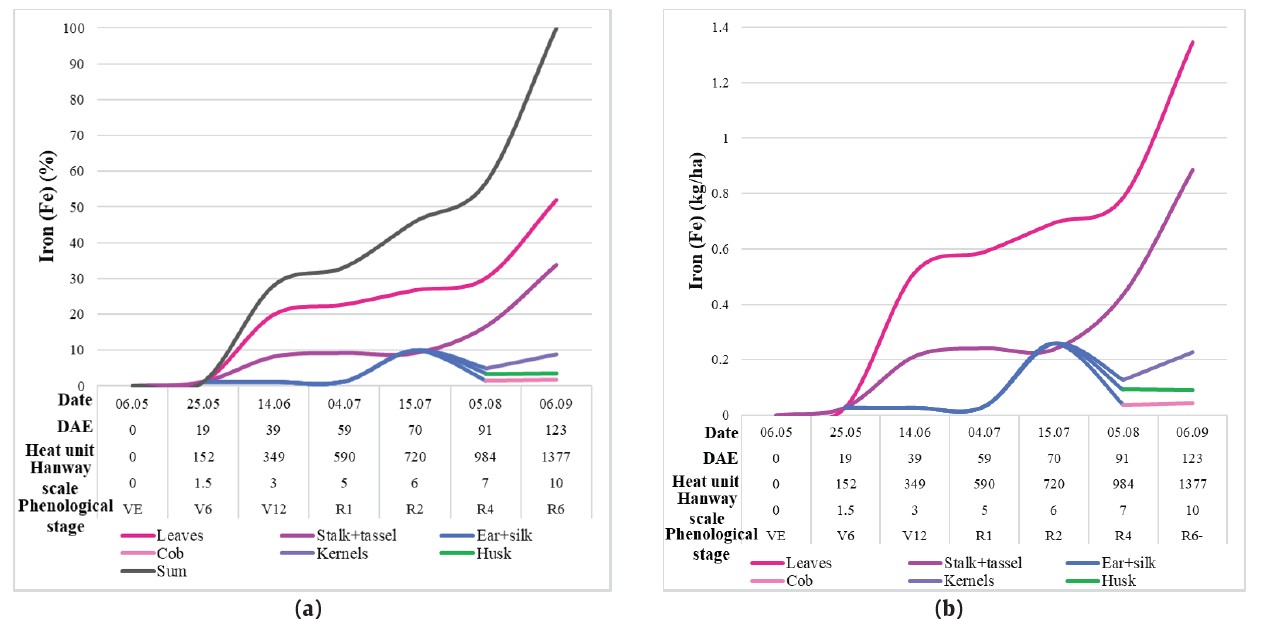
Up to V6, the Fe uptake pattern showed small amounts. An increase was shown towards subsequent stages, with large Fe accumulation observed in the leaves compared to other plant organs (Figure 10). Thus, the rate of Fe accumulation was 0.01 kg*ha-1 day-1 during the period from V6 until R6 for the leaves and 0.008 kg*ha-1 day-1 for the stalk. At the end of the growing season, the plant accumulated a total of 2.6 kg*ha-1 of Fe and was distributed as follows: 1.3 kg*ha-1 (51.9%) in leaves, 0.9 kg*ha-1 (33.9%) in stalk, 0.2 kg*ha-1 (8.9%) in kernels, 0.09 kg*ha-1 (3.6%) in husk and 0.04 kg*ha-1 (1.7%) in the cob.
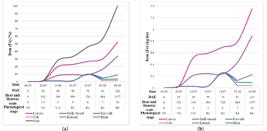
Iron uptake of maize as a function of phenological stages, in percentage (a) and in Kg*ha-1 (b).
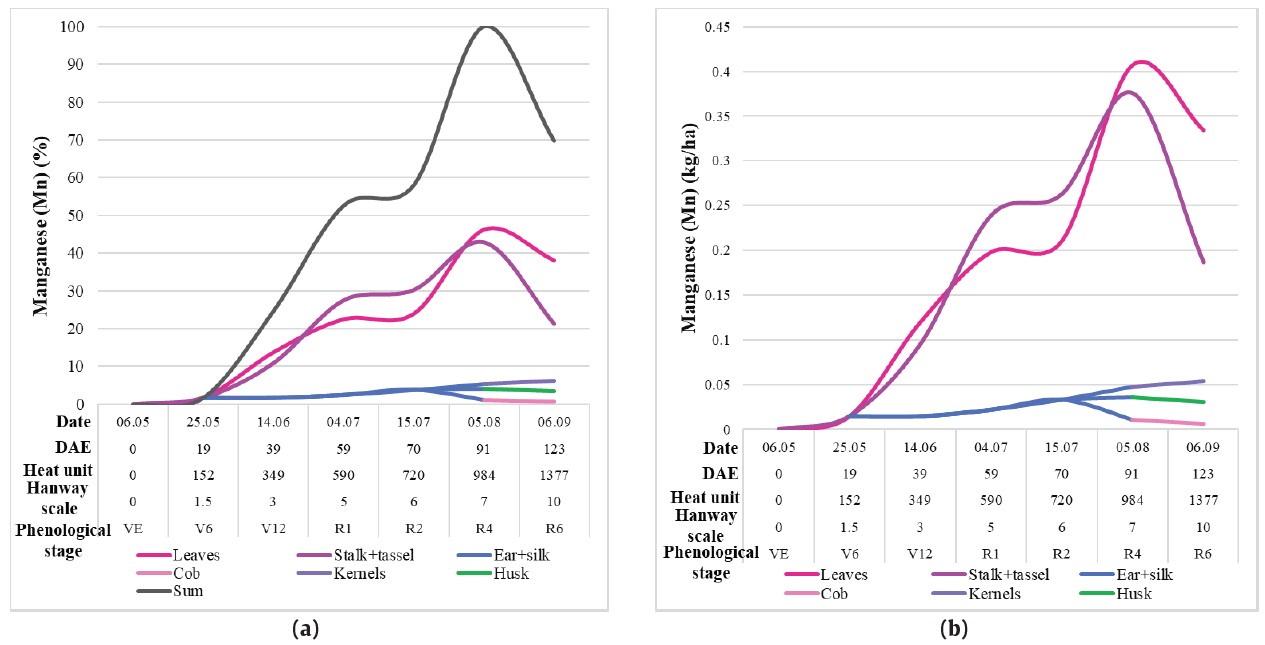
A small accumulation of manganese had been shown by the plant at the initial stage of plant development. From the V6 stage, the Mn accumulation in the leaves and stalk increased significantly, although the ear showed a relatively small accumulation of Mn content (Figure 11). At the silking stage, the Mn uptake accounted for 0.24 kg*ha-1 in the stalk, 0.2 kg*ha-1 in leaves, and 0.02 in the ear, which corresponded to 27.5%, 22.5% and 2.5%, respectively, of the total Mn accumulated at the end of the cycle. Up to the R4 stage, the plant accumulated the highest Mn content throughout the entire growing season in the leaves and stalk, accounting to 0.4 kg*ha-1 (46.3%) and 0.38 kg*ha-1 (42.9%), respectively. The observed rate of Mn accumulation during the period between R1 and R4 was 0.006 kg*ha-1 day-1 for the leaves, and 0.004 kg*ha-1 day-1 for the stalk while it was 0.004 kg*ha-1 day-1 and 0.006 kg*ha-1 day-1, respectively, during the previous phase. Later, progressing toward the physiological maturity phase, the Mn uptake by these organs slowly decreased to reach 0.3 kg*ha-1 (38.2%) of Mn accumulation in leaves and 0.2 kg*ha-1 (21.4%) of Mn accumulation in the stalk. The kernels, husk, and cob showed smaller Mn uptake accounting for 0.05 kg*ha-1 (6.1%), 0.03 kg*ha-1 (3.5%), and 0.01 kg*ha-1 (0.7%), respectively. The total Mn accumulated by the maize plant at the end of the cycle was 0.61 kg*ha-1.
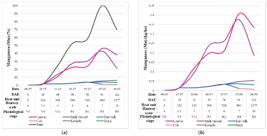
Manganese uptake of maize as a function of phenological stages, in percentage (a) and in Kg*ha-1 (b).
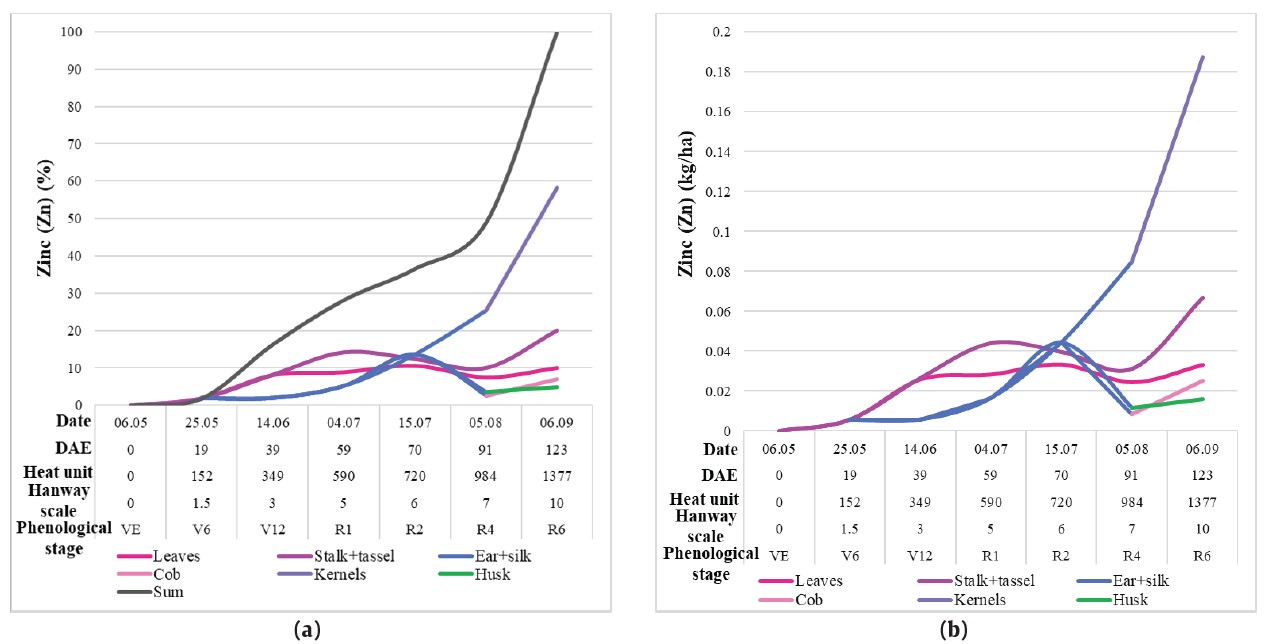
During the growing season, notable zinc accumulation occurred at the R6 stage in the kernels (Figure 12). At the V6 stage, Zn uptake by the plant was only 0.01 kg*ha-1 which corresponds to 1.9% of the total Zn accumulated at the end of the cycle. At the R1 stage, the stalk accumulated the highest amount of Zn and accounted for 0.04 kg*ha-1 (14.2%), while the leaves and the ear accumulated 0.03 kg*ha-1 (8.9%) and 0.02 kg*ha-1 (5.1%), respectively. At the end of the plant growth cycle, the maize plant accumulated a total of 0.3 kg*ha-1 of Zn content, distributed as follows: 0.2 kg*ha-1 (58.2%) in the kernels, 0.07 kg*ha-1 (20%) in the stalk, 0.03 kg*ha-1 (10%) in the leaves, 0.03 kg*ha-1 (7.1%) in the cob, and 0.02 kg*ha-1 (4.8%) in the husk.
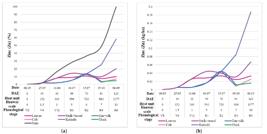
Zinc uptake of maize as a function of phenological stages, in percentage (a) and in Kg*ha-1 (b).
3.3. Analysis of variance
The analysis of variance revealed a strong significance (p<0.001) of the nitrogen, phosphorus, potassium, magnesium, sulfur, zinc, and copper content in maize between the different phenological stages, indicating that the accumulation of the different nutrients with different amounts is strongly associated with changes in growth stages (Table 3). Potassium exhibited the highest F value, showing a high correlation between potassium content and growth stages, possibly greater than those of other nutrients. The least strong, but still significant association (p<0.01) was shown in calcium between the phenological stages, indicating that, during the different growth stages, its role was mainly supportive rather than crucial. However, boron showed a moderate significance (p<0.05) between the different phenological stages. While this element has an impact on maize growth and development, it was less pronounced compared to nutrients such as potassium or sulfur. At the same time, manganese and iron did not show a statistically significant difference between the observed different maize growth stages, as indicated by a higher P-value. This finding may suggest that they were not as critical as the other nutrients during some growth stages.
Results of analysis of variance between the different phenological stages in the maize nutrient composition. Debrecen – Látókép, 2022.
As indicated in the grouping analysis (Table 4), the highest nutrient uptake and accumulation by maize, mainly nitrogen, phosphorus, potassium, magnesium, calcium, sulfur, zinc, and manganese, occurred during V6, i.e. the first stage of the vegetative phenophases.
However, maize accumulated the most boron at the silking stage (R1), whereas higher amounts of copper were needed by the plants at the maturity stage. According to the results obtained, nitrogen content at V6 was significantly different from V12, and R6. Phosphorus content at V6 was significantly different from R1, R2, R4 and R6. However, its accumulation at R1 was not significantly different from that at R2. Potassium uptake at V6 was not significantly different from V12 but it was significantly different from R1 and R6. Significant differences can be noticed for magnesium at V6 from that at V12, R1, and R6. Calcium accumulation at V6 showed significant differences from R1, R4 and R6. The accumulation of sulfur at V6 was significantly different from V12, R1, and R6. However, for iron content, a non-significant difference can be noticed between the phenological stages. Zinc was significantly different at V6 from the rest of the growth stages. Boron content was only significantly different between R1 and R4. For copper, a non-significant difference was noticed between V6 and R6, as well as between R1, R2 and R4. Manganese, however, showed a non-significant difference between all stages of maize growth and development.
3.4. Cluster analysis and heatmap
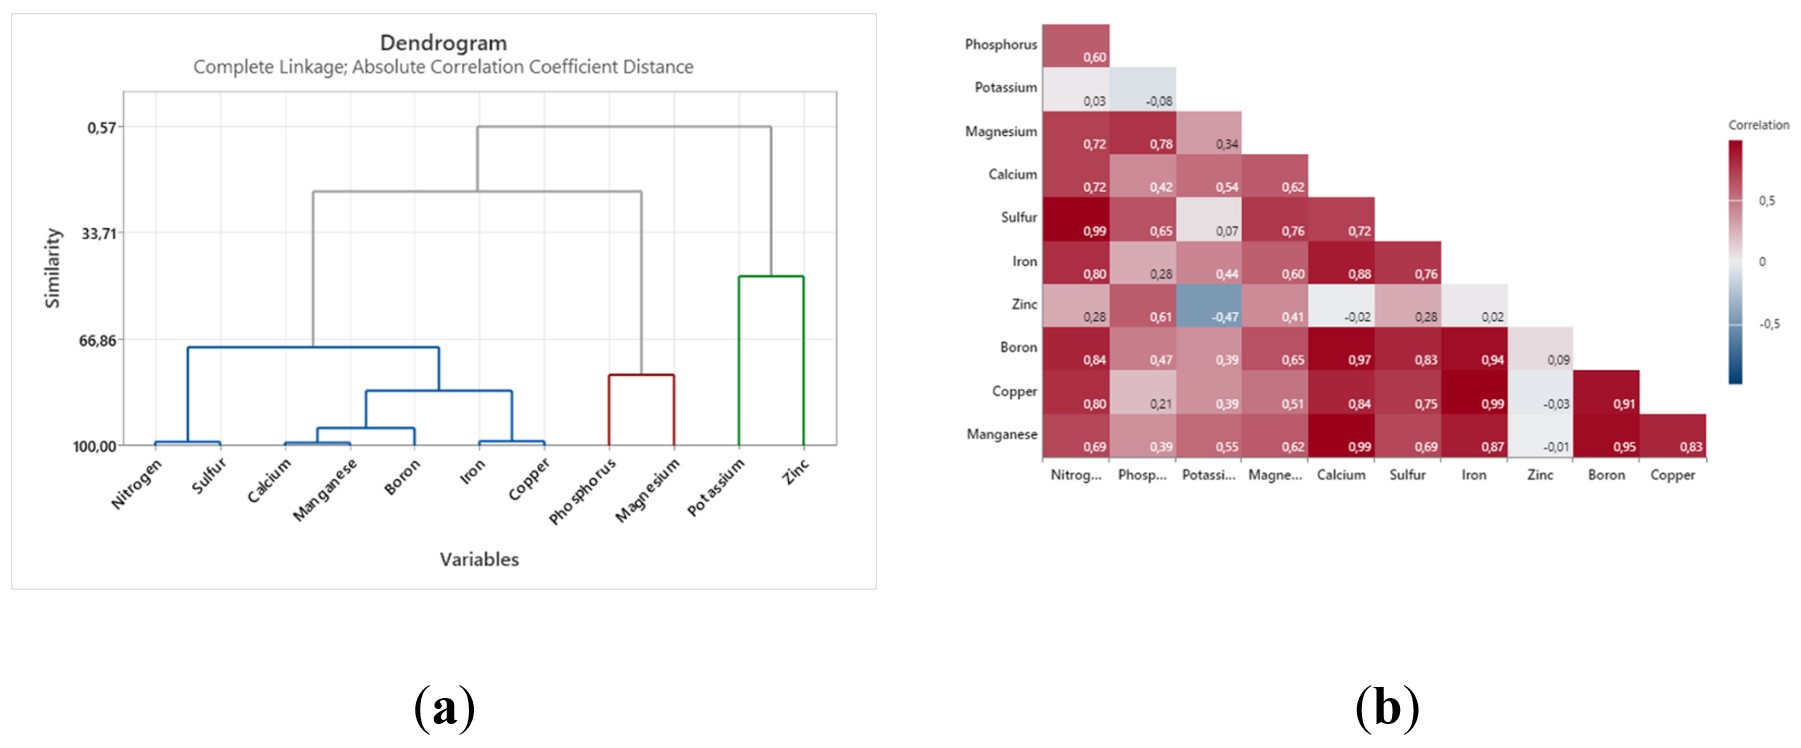
The cluster analysis allowed to identify three main groups of nutrient contents accumulated by both maize hybrids as a function of phenological stages.
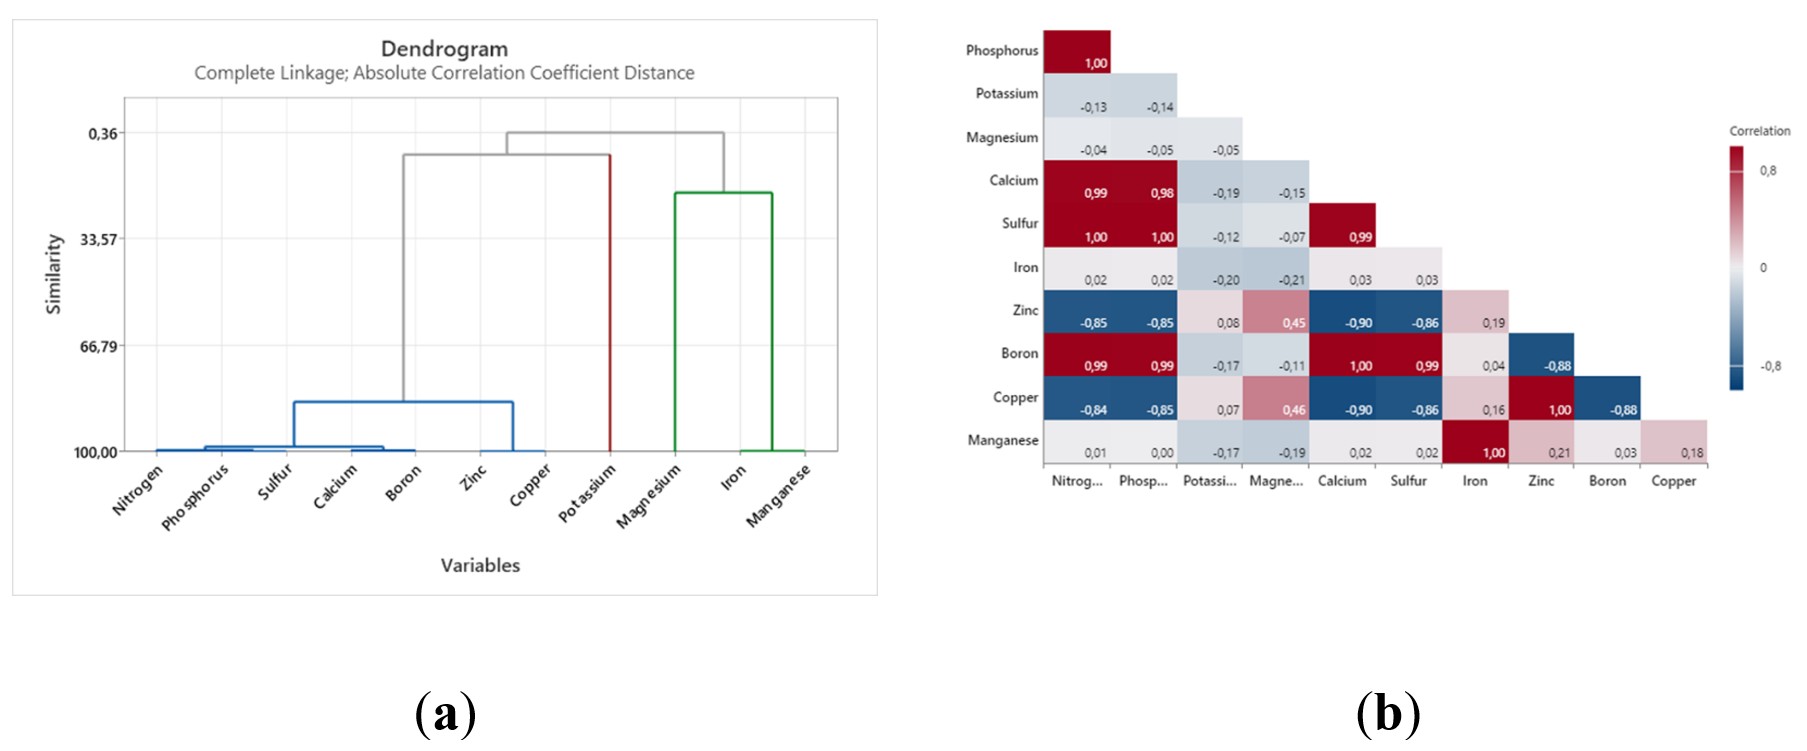
At the 6-leaf stage, the first group includes nitrogen, phosphorus, sulfur, calcium, boron, zinc, and copper, the second group includes potassium, and the third group includes magnesium, iron, and manganese (Figure 13).
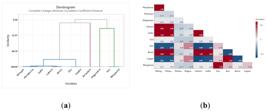
The dendrograms of cluster analysis based on the correlation coefficients distance of the essential nutrient at V6 (a), and heatmaps of Pearson correlation coefficient matrix (b).
The correlation heatmap revealed that nitrogen had a stronger linear correlation with phosphorus as well as sulfur, as the correlation coefficient between the features approaches one. Nitrogen had also a significant positive correlation with calcium and boron. Phosphorus had a stronger linear correlation with sulfur. In addition, phosphorus had a significant positive correlation with calcium and boron. Potassium had a positive correlation but was not significant with both zinc and copper. Magnesium had a positive correlation but was not significant with both zinc and copper. Calcium had a stronger linear correlation with boron and had a positive significant correlation with sulfur. Sulfur had a positive significant correlation with boron. Iron had a stronger linear correlation with manganese. Zinc had a stronger linear correlation with copper.
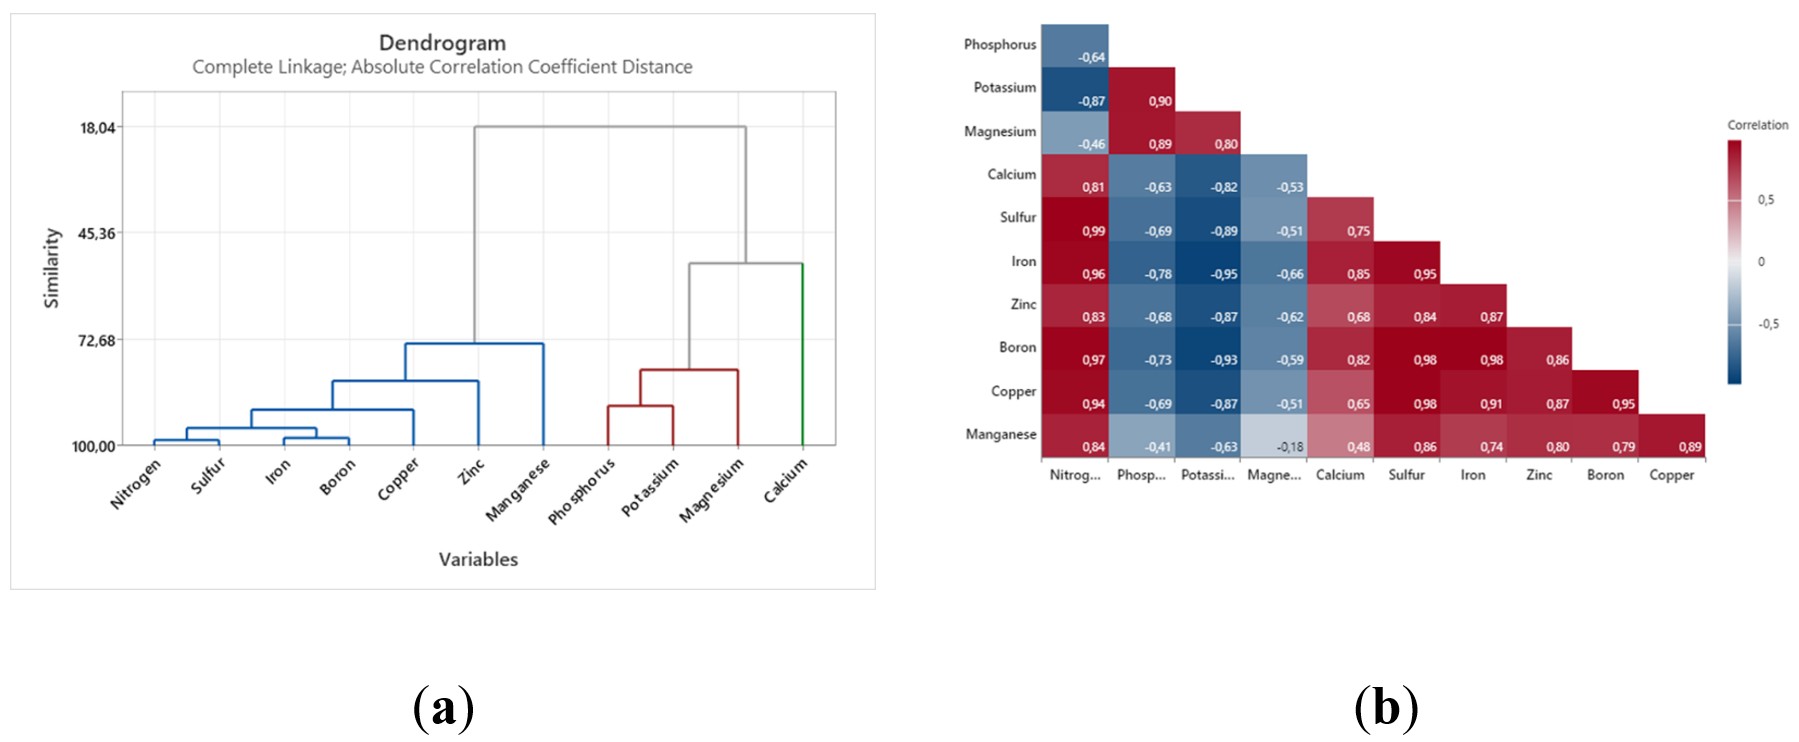
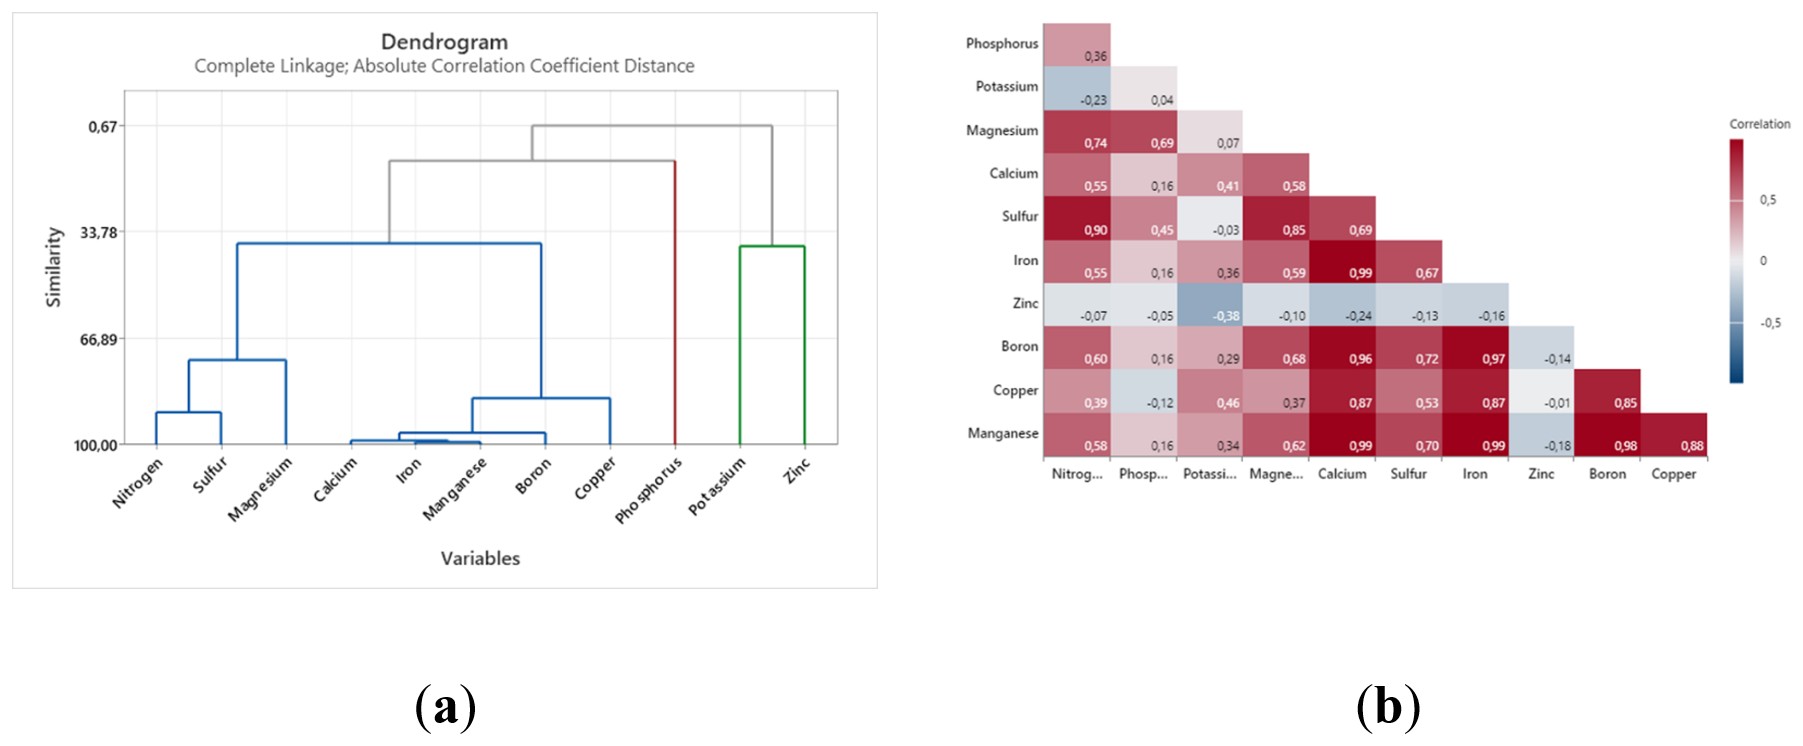
At the 12-leaf stage, the first group contains nitrogen, sulfur, iron, boron, copper, zinc, and manganese, the second group contains phosphorus, potassium, and magnesium, and the third group contains calcium (Figure 14).
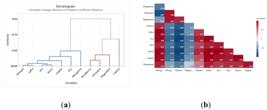
The dendrograms of cluster analysis based on the correlation coefficients distance of the essential nutrient at V12 (a), and heatmaps of Pearson correlation coefficient matrix (b).
According to the correlation heatmap, nitrogen had a strong positive correlation with sulfur, boron, iron, copper, manganese, zinc, and calcium. Phosphorus had a significant positive correlation with both potassium and magnesium. Potassium had a significant positive correlation with magnesium. At the same time, magnesium had a significant negative correlation with iron, zinc, boron, calcium, sulfur, and copper and a non-significant negative correlation with manganese. Calcium had a significant positive correlation with iron, boron, sulfur, zinc, copper, and manganese. Sulfur had a significant positive correlation with copper, boron, iron, manganese, and zinc. Iron had a significant positive correlation with boron, copper, zinc, and manganese. Zinc had a significant positive correlation with copper, boron, and manganese. Boron had a significant positive correlation with copper and manganese. Copper had a significant positive correlation with manganese.
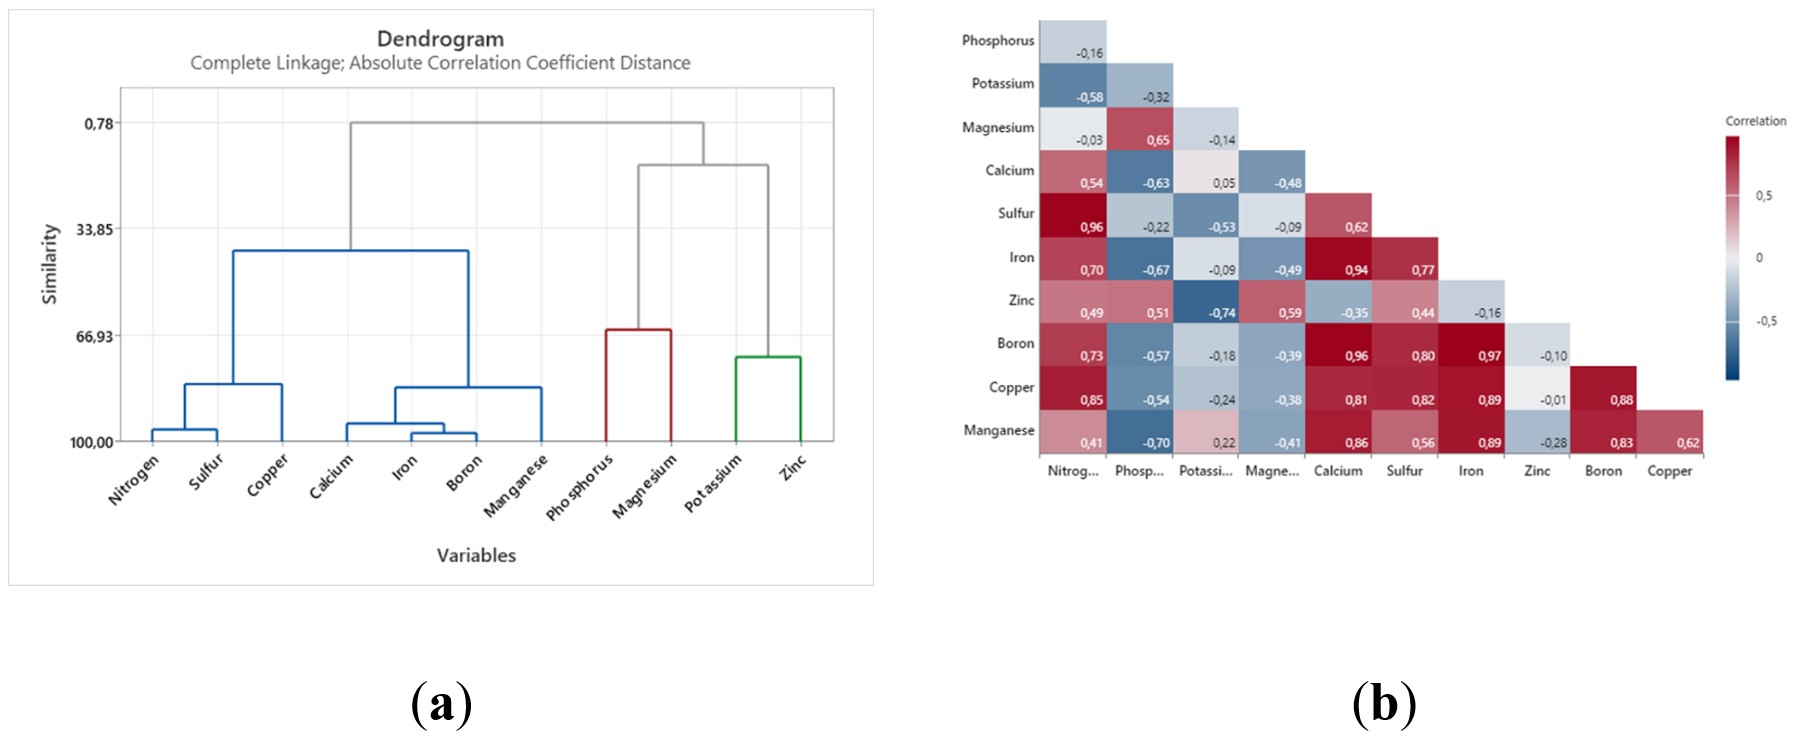
At the R1 stage, the first group incorporates nitrogen, sulfur, copper, calcium, iron, boron, and manganese, the second group incorporates phosphorus and magnesium, and the third group incorporates potassium and zinc (Figure 15).
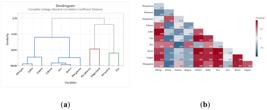
The dendrograms of cluster analysis based on the correlation coefficients distance of the essential nutrient at R1 (a), and heatmaps of Pearson correlation coefficient matrix (b).
The correlation heatmap revealed that nitrogen had a strong positive correlation with sulfur, copper, boron, and iron. Nitrogen showed also a positive correlation with calcium, zinc, and manganese. Phosphorus had a positive correlation with magnesium and zinc. Potassium had a significant negative correlation with zinc and a slight positive correlation with manganese and calcium. Manganese had a positive correlation with zinc. Calcium had a strong positive correlation with boron, iron, manganese, copper, and sulfur. Sulfur had a strong positive correlation with copper, boron, and iron. It had also a positive correlation with manganese and zinc. Iron had a strong positive correlation with boron, copper, and manganese. At the same time, zinc showed a negative correlation with manganese, boron, and copper. Boron showed a strong positive correlation with copper and manganese. Copper had a significant positive correlation with manganese.
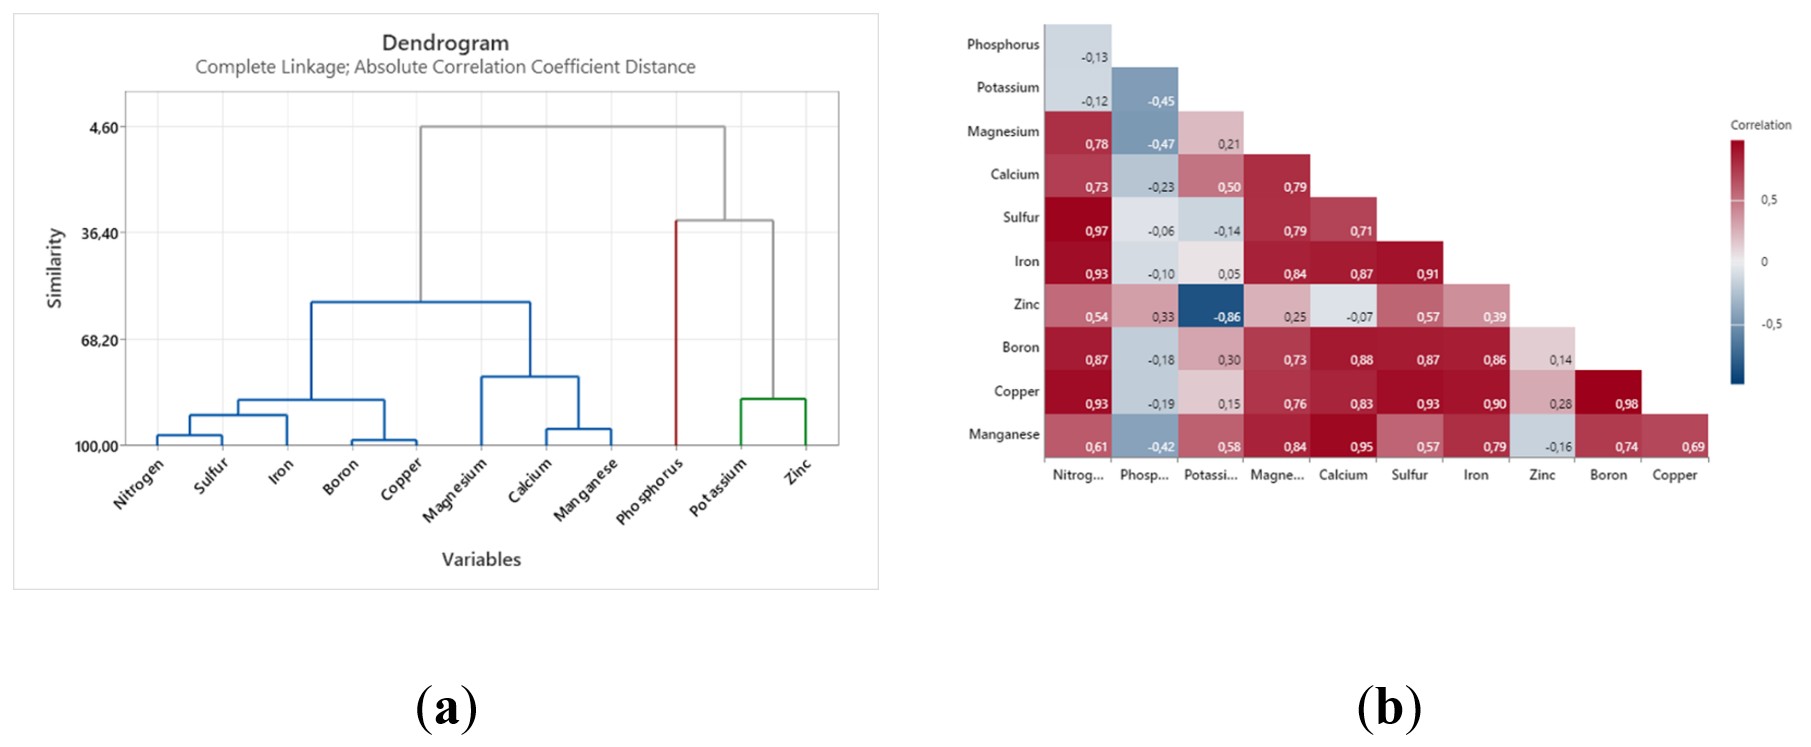
At the R2 stage, the first group involves nitrogen, sulfur, iron, boron, copper, magnesium, calcium, and manganese, the second group involves phosphorus, and the third group involves potassium and zinc (Figure 16).
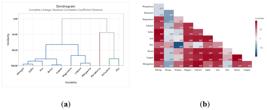
The dendrograms of cluster analysis based on the correlation coefficients distance of the essential nutrient at R2 (a), and heatmaps of Pearson correlation coefficient matrix (b).
According to the correlation heatmap, nitrogen had a strong positive correlation with sulfur, iron, copper, boron, magnesium, calcium, manganese, and zinc. Phosphorus showed a slight positive correlation with zinc. Potassium, in contrast, showed a significant negative correlation with zinc. Magnesium had a strong positive correlation with iron, manganese, calcium, sulfur, copper, and boron. Calcium had a strong positive correlation with manganese, boron, iron, copper, and sulfur. Sulfur showed a significant positive correlation with copper, iron, boron, zinc, and manganese. Iron had a strong positive correlation with copper, boron, and manganese. Zinc showed a slight positive correlation with copper and boron. Boron had a strong positive correlation with copper and manganese. Copper had a positive significant correlation with manganese.
At the R4 stage, nitrogen, sulfur, calcium, manganese, boron, iron, and copper are combined in the first group. Phosphorus and magnesium are combined in the second group and the third group includes potassium and zinc (Figure 17).
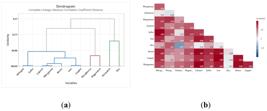
The dendrograms of cluster analysis based on the correlation coefficients distance of the essential nutrient at R4 (a), and heatmaps of Pearson correlation coefficient matrix (b).
The correlation heatmap revealed that nitrogen had a strong positive correlation with sulfur, boron, iron, copper, magnesium, calcium, manganese, and phosphorus. Phosphorus showed a significant positive correlation with magnesium, sulfur, and zinc. It had also a positive correlation with boron, calcium, manganese, iron, and copper. Potassium showed a significant negative correlation with zinc and a positive correlation with manganese, calcium, iron, boron, and copper. Magnesium had a significant positive correlation with sulfur, boron, calcium, manganese, iron, and copper and had a non-significant positive correlation with zinc. Calcium showed a strong positive correlation with manganese, boron, iron, copper, and sulfur. Sulfur had a significant positive correlation with boron, iron, copper, and manganese, and had a non-significant positive correlation with zinc. Iron had a strong positive correlation with copper, boron, and manganese. In contrast, zinc showed a correlation with the other nutrients that reach a near-zero but negative correlation with copper, and manganese, and a positive one with boron. Boron had a strong positive correlation with both manganese and copper. Copper had a significant positive correlation with manganese.
At the R6 stage, nitrogen, sulfur, magnesium, calcium, iron, manganese, boron, and copper are included in the first group the second group includes phosphorus, and the third group includes potassium and zinc (Figure 18).
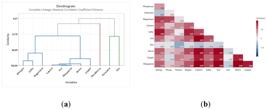
The dendrograms of cluster analysis based on the correlation coefficients distance of the essential nutrient at R6 (a), and heatmaps of Pearson correlation coefficient matrix (b).
According to the correlation heatmap, nitrogen had a strong positive correlation with sulfur and magnesium. It also showed a positive correlation with boron, manganese, calcium, iron, copper, and phosphorus. Phosphorus had a significant positive correlation with magnesium and a less significant positive correlation with sulfur, calcium, iron, boron, and manganese. Potassium showed a positive correlation with copper, calcium, iron, manganese, boron, and magnesium. Magnesium showed a strong positive correlation with sulfur, and it also had significant positive correlation with boron, manganese, iron, and calcium and a correlation with less significance with copper. However, calcium had a strong positive correlation with magnesium, iron, boron, copper, and sulfur. Sulfur showed a significant positive correlation with boron, manganese, iron, and copper. Iron had also a strong positive correlation with manganese, boron, and copper. Zinc, however, showed a slight negative correlation with manganese, boron, and copper. Boron had a strong positive correlation with both manganese and copper. Copper had a strong correlation with manganese.
4. Discussion
4.1. Partitioning of dry matter
Dry matter accumulation was rapidly increased after V6, and up to R1, large accumulation of dry matter was mainly observed in the vegetative organs, accumulating 5990.3 kg*ha-1 of stalk dry matter and 2543 kg*ha-1 of leaves dry matter. The amount of dry matter accumulated in the leaves and stalk fluctuated between stages R1 and R4. However, approaching the maturity stage, their accumulated dry weight decreased. At R6, the kernels reached a maximum dry weight of 11208.9 kg*ha-1. Thus, the increase in dry matter accumulation in the inflorescence could have resulted from the remobilization and translocation of plant nutrients and photosynthetic assimilates accumulated in the senesced vegetative parts to the inflorescence during the reproductive phase (Ferreira et al., 2024). The total dry matter accumulation was obtained at physiological maturity with 23784.4 kg*ha-1. This result exceeds 16190 kg*ha-1, i.e. the result obtained by Ferreira et al. (2024).
4.2. Nutrient dynamics within the maize plant
During the growing season, the maize plant exhibits specific nutrient requirements that vary at each phenological stage. For maize to grow and develop properly, certain nutrients are necessary. The plant’s needs, which may be shown in the plant metabolism and the tissues to which nutrients are partitioned at that specific stage, determine the concentration differences in the accumulation and uptake of each nutrient.
During the early stages of plant growth, maize primarily accumulated nitrogen, phosphorus and potassium. These macronutrients are critical for leaf pigmentation and expansion, root and stem development, and overall plant vigor. For instance, nitrogen is vital for chlorophyll synthesis and photosynthesis, enhancing leaf pigmentation, and contributing substantially to grain yield (Asare et al., 2023; PDA, 2024). Phosphorus, second most frequent limiting macronutrient for plant growth (Schachtman et al., 1998; Isidra-Arellano et al., 2021), is crucial for root, leaves and stem development (Masood et al., 2011; Liaqat et al., 2018), metabolism (structural component in nucleic acids, coenzymes, phosphoproteins, and phospholipids) (Grant et al., 2001), cellular energy transfer (Maathuis, 2009), and processes like respiration and photosynthesis (Raghothama and Karthikeyan, 2005). The variation in concentrations of these nutrients across maize vegetative organs can be clearly observed in this study. N concentrations were high in plant vegetative organs, mostly in leaves, whereas high amount of phosphorus was allocated to the stalk over the leaves up to the R2 stage. Prior silking stage, maize had the first peak of K uptake in the vegetative parts during the active vegetative growth stage. Maize’s significance potassium requirements can be attributed to its essential role in vegetative growth where it contributes to osmoregulation, ion homeostasis, enzyme activation, and photosynthetic product transport (Zhang et al., 2023a; Sadiq et al., 2017). As part of the vegetative organs, the stalk’s demand for potassium was of major significance, as it required more potassium than nitrogen (Figure 4). In addition to its essential role in overall plant growth, development and sustainable yield (Adnan, 2020; Bukhsh et al., 2012), potassium enhances stalk bending strength, which is vital for maintaining plant structural integrity and resistance to lodging Xu et al. (2018). Balanced nutrition is an imperative feature that plays a major part in producing high-quality maize. Exposure to stress can inhibit crop growth, leaving the plant unable to recover. According to Fageria and Baligar (2005), maize is particularly vulnerable to nutrient deficiencies, especially during its early growth stages. According to Görlach et al. (2021), decreased plant height, reduction in tillering, restricted seed formation, reduced leaf area, and premature senescence of leaves are among the main P limitation symptoms.
Moreover, calcium and magnesium were also accumulated in this particular phase, but in smaller quantities, playing essential roles in cell wall structure and enzyme function. Calcium was primarily absorbed by the leaves, playing a crucial role in stabilizing cell walls and membranes (Kirkby and Pilbeam, 1984), as well as supporting processes like cell division and elongation (Pathak et al., 2020), leaf development and plant vigor (Bromley, 2010). Magnesium, on the other hand, was mostly absorbed by the stalk, where it served as the core atom of chlorophyll, regulates ATP activity in the cytoplasm and organelles (Taiz and Zeiger, 2022), and supported enzyme functions essential for photosynthesis and protein biosynthesis (Senbayram et al., 2015). It was found that maize had absorbed sulfur in lower quantities also across the vegetative organs. During maize development, leaves accumulated higher S concentrations compared to stalk, since they are the primary site for photosynthesis and protein synthesis (methionine and cysteine) (Rahman et al., 2011), and antioxidant defense (glutathione) (Sutar et al., 2017; Li et al., 2020; Narayan et al., 2023). The uptake and accumulation of sulfur in this organ is driven by its high metabolic activity and the need for sulfur for energy and protein synthesis. On the other hand, micronutrients such as Fe, Mn, Zn, Cu and B were also accumulated in small amounts during active vegetative growth, and their concentrations typically increase as the plant progresses through the growing season. The highest concentrations of Fe, Cu, Mn and B were found in leaves unlike Zn was absorbed by the stalk. In order to maintain the function of enzymes in the photosystem and the electron transport chain, chloroplasts in leaves need Fe nutrient. Consequently, this explains the great demand for this nutrient as it is indispensable for maintaining overall plant energy metabolism. However, inadequate Fe availability can lead to a reduction in energy metabolism and overall plant health. Researchers reported that excess in Fe can be toxic to plants, resulting in a cellular damage and disturbance of cellular ionic homeostasis (Rout and Sahoo, 2015; Li et al., 2018; Farid et al., 2023). Similarly, Cu was needed in a minimal amount for the plant to assure healthy growth and reproduction success, that, at high concentrations, could become toxic as its mobility is relatively restricted. This can lead to leaf chlorosis and growth inhibition which ultimately results in reduced yield (Bouazizi et al., 2010). Maize leaves required higher amounts of Cu due to its involvement in photosynthesis and antioxidant defense (Barbosa et al., 2013). Similarly, it was found that high Mn concentrations were found in leaves owing to its essential role in metabolic activities (Millaleo et al., 2010). Contrary to the aforementioned micronutrients, higher zinc concentrations were accumulated in the stalk. During the vegetative phase, the stalk undergoes cell division and elongation to support the growth of the plant. Thus, significant zinc amounts are required for enzyme activation and cell wall synthesis. As maize growth progresses, the demand for boron increases, but in lower concentrations. Maize leaves were the organs that accumulated mostly this nutrient, as it is essential for the development of cell walls and meristematic growth (Bayar et al., 2024). Thus, exposure to boron deficiency affects plant health, leading to reduced root and stalk growth, chlorosis and leav malformation.
As maize transitions to the reproductive stages, nutrient allocation shifts to the ears and kernels development. During the reproductive and grain filling phases, the uptake of N and P gradually decreased, reflecting their remobilization to the growing kernels, with nitrogen being more readily remobilized owing to its high phloem mobility (Kosgey et al., 2013). By the time of silking, maize absorbed 57.4% of nitrogen content and higher concentrations in phosphorus with 71.74%, which is closer to the result (69%) obtained by Silva et al. (2018). While, potassium uptake was the most significant as the plant accumulated 79.2% at R1. At the end of the growing cycle, higher nitrogen percentage was observed in the kernels (60.8%). Similar studies indicated approximate values of 64% (Bender et al., 2013), 53% (Silva et al., 2018), and 74% (Ferreira et al., 2024). Silva et al. (2018) also stated that the maximum P accumulation was observed between R5 and R6 which is consistent with the findings of the investigations performed in this study. Owing to its vital role in grain development and filling, maize kernels stored large amount of P at the maturity stage, accounting for 31.8 kg*ha-1, which corresponds to 62% of the total P accumulated at the end of the cycle. The maximum K uptake and accumulation was observed at R4, with 100% of the total K, which is in accordance with the result of Ferreira et al. (2024). A hypothesis suggested that the source of the concentration of nutrients in grains is either coming from post-silking absorption or remobilization of nutrients accumulated prior to silking (Yuhui et al., 2019). In this paper, the stalk demonstrated that it was the organ that absorbed the greatest K nutrient throughout the growing season. This means that the extent of K remobilization was the highest in the stalk, indicating that K was mainly remobilized from the stalk and less from the leaves. Moreover, it can be noticed here that the potassium translocation from the stalk and leaves to the kernels (16.2% of the total K at the maturity phase) had a notably lower extent than for phosphorus and nitrogen. For this reason, the grain-filling period is apparently not critical considering potassium supply. Maize Ca uptake initially peaked at R1with 25.9 kg*ha-1 and then it reached its maximum value of 38.95 kg*ha-1 at R6. At the physiological maturity, the kernels stored only 2.80 kg*ha-1 (7%) of the total Ca, which is due to the low mobility of the nutrient which explains the limitation of its redistribution to the kernels. Whereas Mg accumulation reached its maximum value of 18.4 kg*ha-1 at R4 and then decreased as approaching the maturity stage with a final accumulation of 18.3 kg*ha-1 in which 49.9% of total Mg content was present in the kernels. This value exceeds the total Mg absorption of kernels by 30% as discovered by Silva et al. (2018). During the reproductive growth stages, S accumulation exhibited some fluctuation in both the leaves and the stalk, however, S concentrations in the ear components have an upward trend, where the kernels accumulated the highest concentrations of 9.8 kg*ha-1 (55.7%) of the total S accumulated at the end of the growing cycle. This reflects on the continuous contribution of sulfur to the formation of chlorophyll, flowering and seed formation. At R6, the greatest S accumulation was observed with 17.7 kg*ha-1, contrary to Ferreira et al. (2024), who found the greatest accumulation at R3 with 10.84 kg*ha-1.
Micronutrients such as B, Fe, Mn, Zn and Cu showed also increased accumulation during this phase. Perica et al. (2001) reported that boron is more important for reproductive development than for vegetative growth, suggesting that the reproductive organs accumulated more B concentrations than the vegetative organs. In contrast, this study demonstrated a higher demand for B in the vegetative organs than the reproductive organs, as shown by the higher B concentrations in leaves and stalks compared to those in the reproductive organs, particularly the kernels. Still, the demand for B was necessary for the plant during the grain-filling stage for grain formation due to its essential role in pollen tube formation and seed development (Devi et al., 2016; Kaur and Nelson, 2015). At R6, the maximum B accumulation was observed at 0.135 kg*ha-1, which is more in accordance with the findings of Ferreira et al. (2024). According to our findings, the leaves in particular and the stalk were the primary sites of Fe deposition absorbed by maize, while the grains did not represent a strong drain of this micronutrient. Corroborating with Ferreira et al. (2024) and Oliveira et al. (2019), iron was the most extracted micronutrient by the plant. The maximum estimated accumulation of Fe was observed in R6, with 2.6 kg*ha-1 which is superior to that obtained by Ferreira et al. (2024) and 7.12 kg less than that obtained by Oliveira et al. (2019). At the physiological maturity, 1.3 kg*ha-1 (51.9%) was found in the leaves, 0.9 kg*ha-1 (33.9%) in the stalk, 0.2 kg*ha-1 (8.9%) in the kernels, 0.09 kg*ha-1 (3.6%) in the husk and 0.04 kg*ha-1 (1.7%) in the cob. Regarding Mn accumulation, it was found that the maximum Mn uptake by the plant occurred at R4 with 0.88 kg*ha-1, where the leaves stored the most Mn concentrations (0.4 kg*ha-1). Ferreira et al. (2024) reported a similar result, stating that the maximum Mn accumulation was 0.434 kg*ha-1 at R3 but it was present in the kernels. At the maturity stage, the total nutrient accumulated by the plant was 0.61 kg*ha-1 which is comparable to the result that Oliveira et al. (2019) found at 0.578 kg*ha-1. Whereas Zn accumulation reached its maximum amount at R6 with 0.329 kg*ha-1. Ferreira et al. (2024) did, however, indicate that the total Zn accumulation at R6 was 0.377 kg*ha-1 which is close to the results of this study, and that the largest Zn accumulation occurred between R4 and R5, with 0.477 kg*ha-1. Nevertheless, compared to Oliveira et al. (2019), who reported a total Zn accumulation of 0.606 kg*ha-1, these results are smaller. Maize kernels accumulated the maximum Cu nutrient with 0.241 kg*ha-1 at R6, contrary to what Ferreira et al. (2024) found, according to which the maximum Cu accumulation in their study was 0.136 kg*ha-1 and obtained at R5. Similarly, Borges et al. (2009) reported that maximum Cu accumulations were obtained near physiological maturity with values of approximately 0.30 kg*ha-1. In comparison to the results obtained by Ferreira et al. (2024), the kernels accumulated 0.09 kg*ha-1 of the total Cu, which is 0.0512 kg*ha-1 greater.
During the growing season and at every phenological stage studied, it can be observed that, of the nutrients presented in the first cluster, N, S, B, and Cu were persistent. Mn appeared in the first cluster from V12 until R6. Zn was present in the first cluster only at V6 and V12. Ca was only absent from the first cluster at V12 and appeared lonely in the third cluster. P was present in the first cluster only at V6 and switched to the second cluster from V12 to R6. Fe appeared to be present in the first cluster only from V12 till R6, while at V6 it appeared to be in the third cluster. Mg, in contrast, was presented in the third cluster at V6. After that, it was moved to the second cluster at V12 and stayed until R1. Then, it was moved again to be among the nutrients in the first cluster at R2. At R4, Mg appeared to be present in the second cluster, and lastly, it moved back to the first cluster at R6. K and Zn were the only nutrients in the third cluster that appeared from R1 to R6.
5. Conclusions
Generally, nutrient dynamics throughout the growth cycle have a substantial impact on maize productivity, as the plant’s ability to effectively accumulate and then remobilize nutrients directly affects grain development and overall yield. From V6 up to R1, maize accumulated the majority of nutrients in significant amounts that, with the transition to the reproductive stages, were translocated into the reproductive organs supporting their development. Overall, only the remobilized N, P, Mg, S, and Zn contributed significantly to grain content (50% and above). The total macro- and micronutrients accumulated in this study are listed in decreasing order: K > N > P > Ca > Mg > S > Fe > Mn > Zn > Cu > B. Along with nutrient availability, plant genetics, environmental conditions, and management practices influence the process of accumulation and remobilization of nutrients. Therefore, as we strive to maximize the production potential of maize, improving the knowledge of plant nutritional needs with the right source and rate at the right time and place is crucial to further refine our strategy.
Acknowledgements
Project no. TKP2021-NKTA-32 has been implemented with the support provided by the Ministry of Culture and Innovation of Hungary from the National Research, Development and Innovation Fund, financed under the TKP2021-NKTA funding scheme and supported by the EKOP-24-4-II University Research Scholarship Program of the Ministry for Culture and Innovation from the source of the National Research, Development and Innovation Fund. This paper was supported by the János Bolyai Research Scholarship of the Hungarian Academy of Sciences (BO/00068/23/4).
References
-
ADNAN, M., 2020. Role of potassium in maize production: a review. Open Access Journal Biogeneric Science and Research, vol. 3, no. 5, pp. 1-4. http://doi.org/10.46718/JBGSR.2020.03.000083
» http://doi.org/10.46718/JBGSR.2020.03.000083 -
AHMAD, M., HUSSAIN, A., DAR, A., LUQMAN, M., DITTA, A., IQBAL, Z., AHMAD, H.T., NAZLI, F., SOUFAN, W., ALMUTAIRI, K. and SABAGH, A.E., 2023. Combating iron and zinc malnutrition through mineral biofortification in maize through plant growth promoting Bacillus and Paenibacillus species. Frontiers in Plant Science, vol. 13, pp. 1094551. http://doi.org/10.3389/fpls.2022.1094551 PMid:36816488.
» http://doi.org/10.3389/fpls.2022.1094551 -
ASARE, G., BHATT, P., AVORNYO, V.K. and GYAMFI, R.A., 2023. An overview of foliar application of macro and micronutrients on the yield of maize in Ghana. Archives of Agriculture and Environmental Science, vol. 8, no. 4, pp. 634-638. http://doi.org/10.26832/24566632.2023.0804026
» http://doi.org/10.26832/24566632.2023.0804026 -
BARBOSA, R.H., TABALDI, L.A., MIYAZAKI, F.R., PILECCO, M., KASSAB, S.O. and BIGATON, D., 2013. Foliar copper uptake by maize plants: effects on growth and yield. Ciência Rural, vol. 43, no. 9, pp. 1561-1568. http://doi.org/10.1590/S0103-84782013000900005
» http://doi.org/10.1590/S0103-84782013000900005 -
BAYAR, J., SHAH, S., KHAN, W., OKLA, M.K., ALWASEL, Y.A., SALEH, I.A., ABDELGAWAD, H., RAHIM, W., IQBAL, B. and JALAL, A., 2024. Boron foliar application improves growth, yield and grain quality of maize. Polish Journal of Environmental Studies, vol. 33, no. 3, pp. 1-11. http://doi.org/10.15244/pjoes/177183
» http://doi.org/10.15244/pjoes/177183 -
BENDER, R.R., HAEGELE, J.W., RUFFO, M.L. and BELOW, F.E., 2013. Nutrient uptake, partitioning, and remobilisation in modern, transgenic insect-protected maize hybrids. Agronomy Journal, vol. 105, no. 1, pp. 161-170. http://doi.org/10.2134/agronj2012.0352
» http://doi.org/10.2134/agronj2012.0352 -
BORGES, I.D., VON PINHO, R.G. and PEREIRA, J.L.A.R., 2009. Micronutrients accumulation at different maize development stages. Ciência e Agrotecnologia, vol. 33, no. 4, pp. 1018-1025. http://doi.org/10.1590/S1413-70542009000400011
» http://doi.org/10.1590/S1413-70542009000400011 -
BOUAZIZI, H., JOUILI, H., GEITMANN, A. and EL FERJANI, E., 2010. Copper toxicity in expanding leaves of Phaseolus vulgaris L.: antioxidant enzyme response and nutrient element uptake. Ecotoxicology and Environmental Safety, vol. 73, no. 6, pp. 1304-1308. http://doi.org/10.1016/j.ecoenv.2010.05.014 PMid:20561682.
» http://doi.org/10.1016/j.ecoenv.2010.05.014 - BROMLEY, B.J., 2010. Nutrient deficiency symptoms. New Jersey: Rutgers Master Gardeners of Mercer County.
-
BUKHSH, M.A., AHMAD, R., IQBAL, J., MAQBOOL, M.M., ALI, A., ISHAQUE, M. and HUSSAIN, S., 2012. Nutritional and physiological significance of potassium application in maize hybrid crop production. Pakistan Journal of Nutrition, vol. 11, pp. 187-202. http://doi.org/10.3923/pjn.2012.187.202
» http://doi.org/10.3923/pjn.2012.187.202 -
CAVALCANTE, T.J., CASTOLDI, G., RODRIGUES, C.R., NOGUEIRA, M.M. and ALBERT, A.M., 2018. Macro and micronutrients uptake in biomass sorghum. Pesquisa Agropecuária Tropical, vol. 48, no. 4, pp. 364-373. http://doi.org/10.1590/1983-40632018v4851874
» http://doi.org/10.1590/1983-40632018v4851874 -
CHAUDHARY, D.P., KUMAR, S. and YADAV, O.P., 2014. Nutritive value of maize: improvements, applications and constraints. In: D. CHAUDHARY, S. KUMAR and S. LANGYAN, eds. Maize: nutrition dynamics and novel uses New Delhi: Springer, pp. 3-17. http://doi.org/10.1007/978-81-322-1623-0_1
» http://doi.org/10.1007/978-81-322-1623-0_1 -
DEL BORGHI, A., TACCHINO, V., MORESCHI, L., MATARAZZO, A., GALLO, M. and ARELLANO VAZQUEZ, D., 2022. Environmental assessment of vegetable crops towards the water-energy-food nexus: a combination of precision agriculture and life cycle assessment. Ecological Indicators, vol. 140, pp. 1-15. http://doi.org/10.1016/j.ecolind.2022.109015
» http://doi.org/10.1016/j.ecolind.2022.109015 - DEVI, R., DEV, W., BABAR, S., KHANDHRO, M.N., MEMON, S., JATOI, G.H. and JOGI, Q., 2016. Boron application using optimizing dose and time through foliar application for enhancing yield of wheat. Science International, vol. 28, pp. 4039-4042.
-
ERENSTEIN, O., JALETA, M., SONDER, K., MOTTALEB, S.K. and PRASANNA, B.M., 2022. Global maize production, consumption and trade: trends and R&D implications. Food Security, vol. 14, no. 5, pp. 1295-1319. http://doi.org/10.1007/s12571-022-01288-7
» http://doi.org/10.1007/s12571-022-01288-7 -
FAGERIA, N. and BALIGAR, V., 2005. Enhancing nitrogen use efficiency in crop plants. Advances in Agronomy, vol. 88, pp. 97-185. http://doi.org/10.1016/S0065-2113(05)88004-6
» http://doi.org/10.1016/S0065-2113(05)88004-6 -
FARID, I.M., EL-HUSSIENY, O.H., EL-SHINAWY, R.S., ABBAS, H.H., ABBAS, M.H.H. and BASSOUNY, M.A., 2023. Phosphorus and micronutrient interactions in soil and their impacts on maize growth. Egyptian Journal of Soil Science, vol. 63, no. 3, pp. 405-416. http://doi.org/10.21608/ejss.2023.220182.1610
» http://doi.org/10.21608/ejss.2023.220182.1610 -
FERREIRA, A.C.M., SOUZA, H.A., SAGRILO, E., SILVA JÚNIOR, G.B., NATALE, W., SALES SOBRAL, A.H., SOUZA VERA, G. and SANTOS, S.F.C.B., 2024. Absorption, partitioning, and export of nutrients by phenological stage in maize cultivated in Eastern Maranhão, Brazil. Journal of Plant Nutrition, vol. 47, no. 2, pp. 240-256. http://doi.org/10.1080/01904167.2023.2275072
» http://doi.org/10.1080/01904167.2023.2275072 -
GODFRAY, H.C.J., BEDDINGTON, J.R., CRUTE, I.R., HADDAD, L., LAWRENCE, D., MUIR, J.F., PRETTY, J., ROBINSON, S., THOMAS, S.M. and TOULMIN, C., 2010. Food security: the challenge of feeding 9 billion people. Science, vol. 327, no. 5967, pp. 812-818. http://doi.org/10.1126/science.1185383 PMid:20110467.
» http://doi.org/10.1126/science.1185383 - GOMBOS, B. and NAGY, J., 2023. A 2022-es rendkívüli aszály agrometeorológiai jellemzői Debrecen-Látóképen. Növénytermelés, vol. 72, pp. 5-18.
-
GOMBOS, B., NAGY, Z., HAJDU, A. and NAGY, J., 2023. Climate change in the Debrecen area in the last 50 years and its impact on maize production. Idöjárás, vol. 127, no. 4, pp. 485-504. http://doi.org/10.28974/idojaras.2023.4.5
» http://doi.org/10.28974/idojaras.2023.4.5 -
GÖRLACH, B.M., HENNINGSEN, J.N., MACKENS, J.T. and MÜHLING, K.H., 2021. Evaluation of maize growth following early season foliar p supply of various fertiliser formulations and in relation to nutritional status. Agronomy, vol. 11, no. 4, pp. 1-17. http://doi.org/10.3390/agronomy11040727
» http://doi.org/10.3390/agronomy11040727 -
GRANT, C.A., FLATEN, D.N., TOMASIEWICZ, D.J. and SHEPPARD, S.C., 2001. The importance of early season phosphorus nutrition. Canadian Journal of Plant Science, vol. 81, no. 2, pp. 211-224. http://doi.org/10.4141/P00-093
» http://doi.org/10.4141/P00-093 -
HANWAY, J.J., 1963. Growth stages of corn (Zea mays L.). Agronomy Journal, vol. 55, no. 5, pp. 487-492. http://doi.org/10.2134/agronj1963.00021962005500050024x
» http://doi.org/10.2134/agronj1963.00021962005500050024x -
ISIDRA-ARELLANO, M.C., DELAUX, P.M. and VALDES-LOPEZ, O., 2021. The phosphate starvation response system: its role in the regulation of plant-microbe interactions. Plant & Cell Physiology, vol. 62, no. 3, pp. 392-400. http://doi.org/10.1093/pcp/pcab016 PMid:33515263.
» http://doi.org/10.1093/pcp/pcab016 -
KAUR, G. and NELSON, K.A., 2015. Effect of foliar boron fertilisation of fine textured soils on corn yields. Agronomy, vol. 5, no. 1, pp. 1-18. http://doi.org/10.3390/agronomy5010001
» http://doi.org/10.3390/agronomy5010001 -
KIRKBY, E.A. and PILBEAM, D.J., 1984. Calcium as a plant nutrient. Plant, Cell & Environment, vol. 7, no. 6, pp. 397-405. http://doi.org/10.1111/j.1365-3040.1984.tb01429.x
» http://doi.org/10.1111/j.1365-3040.1984.tb01429.x -
KOSGEY, J.R., MOOT, D.J., FLETCHER, A.L. and MCKENZIE, B.A., 2013. Dry matter accumulation and post-silking N economy of ‘stay-green’ maize (Zea mays L.) hybrids. European Journal of Agronomy, vol. 51, pp. 43-52. http://doi.org/10.1016/j.eja.2013.07.001
» http://doi.org/10.1016/j.eja.2013.07.001 -
LI, Q., GAO, Y. and YANG, A., 2020. Sulfur homeostasis in plants. International Journal of Molecular Sciences, vol. 21, no. 23, pp. 1-16. http://doi.org/10.3390/ijms21238926 PMid:33255536.
» http://doi.org/10.3390/ijms21238926 -
LI, S., ZHOU, X., CHEN, J. and CHEN, R., 2018. Is there a strategy I iron uptake mechanism in maize? Plant Signaling & Behavior, vol. 13, no. 4, e1161877. http://doi.org/10.1080/15592324.2016.1161877 PMid:27018765.
» http://doi.org/10.1080/15592324.2016.1161877 -
LIAQAT, W., AHMAD, H., JAN, M.F., REHAN, W. and AHMADZAI, M.D., 2018. Phenology and yield response of Zea mays L. to mineral phosphorous under semiarid climate. Agricultural Research & Technology: Open Access Journal, vol. 15, no. 1, pp. 1-3. http://doi.org/10.19080/ARTOAJ.2018.15.555942
» http://doi.org/10.19080/ARTOAJ.2018.15.555942 -
MAATHUIS, F.J., 2009. Physiological functions of mineral macronutrients. Current Opinion in Plant Biology, vol. 12, no. 3, pp. 250-258. http://doi.org/10.1016/j.pbi.2009.04.003 PMid:19473870.
» http://doi.org/10.1016/j.pbi.2009.04.003 - MASOOD, T., GUL, R., MUNSIF, F., JALAL, F., HUSSAIN, Z., NOREEN, N., KHAN, H., NASIRUDDIN and KHAN, H., 2011. Effect of different phosphorus levels on the yield and yield component of maize. Sarhad Journal of Agriculture, vol. 27, pp. 167-170.
-
MILLALEO, R., REYES-DÍAZ, M., IVANOV, A.G., MORA, M.L. and ALBERDI, M., 2010. Manganese as essential and toxic element for plants: transport, accumulation and resistance mechanisms. Journal of Soil Science and Plant Nutrition, vol. 10, no. 4, pp. 476-494. http://doi.org/10.4067/S0718-95162010000200008
» http://doi.org/10.4067/S0718-95162010000200008 - NAGY, J., 2006. Maize production Budapest: Akademiai Kiado, 395 p.
-
NARAYAN, O.P., KUMAR, P., YADAV, B., DUA, M. and JOHRI, A.K., 2023. Sulfur nutrition and its role in plant growth and development. Plant Signaling & Behavior, vol. 18, no. 1, pp. 2030082. http://doi.org/10.1080/15592324.2022.2030082 PMid:35129079.
» http://doi.org/10.1080/15592324.2022.2030082 -
OLIVEIRA, T.F., DA SILVA FONSECA, I.A., VIEIRA ANDRADE, G.A., BRAGA OLIVEIRA, V.J., PARAGUASSU SOARES, M.E. and AQUINO, L.A., 2019. Uptake and exportation of micronutrients in high productivity corn fields. Agroambiente On-Line, vol. 13, pp. 55-67. http://doi.org/10.18227/1982-8470ragro.v13i0.5335
» http://doi.org/10.18227/1982-8470ragro.v13i0.5335 -
PATHAK, J., AHMED, H., KUMARI, N., PANDEY, A., RAJNEESH and SINHA, R.P., 2020. Role of calcium and potassium in amelioration of environmental stress in plants. In: A. ROYCHOUDHURY and D.K. TRIPATHI, eds. Protective chemical agents in the amelioration of plant abiotic stress: biochemical and molecular perspectives. Newark: John Wiley & Sons, pp. 535-562. http://doi.org/10.1002/9781119552154.ch27
» http://doi.org/10.1002/9781119552154.ch27 -
PERICA, S., BROWN, P.H., CONNELL, J.H., NYOMORA, A.M.S., DORDAS, C., HU, H. and STANGOULIS, J., 2001. Foliar boron application improves flower fertility and fruit set of olive. HortScience, vol. 36, no. 4, pp. 714-716. http://doi.org/10.21273/HORTSCI.36.4.714
» http://doi.org/10.21273/HORTSCI.36.4.714 -
POTASH DEVELOPMENT ASSOCIATION – PDA, 2024 [viewed 15 January 2024]. Forage maize: fertiliser requirements [online]. Available from: https://www.pda.org.uk/pda_leaflets/17-forage-maize-fertiliser-requirements/nutrition-of-the-maize-crop/
» https://www.pda.org.uk/pda_leaflets/17-forage-maize-fertiliser-requirements/nutrition-of-the-maize-crop/ -
RAGHOTHAMA, K.G. and KARTHIKEYAN, A.S., 2005. Phosphate acquisition. Plant and Soil, vol. 274, no. 1-2, pp. 37-49. http://doi.org/10.1007/s11104-004-2005-6
» http://doi.org/10.1007/s11104-004-2005-6 -
RAHMAN, M.M., SOAUD, A.A. and DARWISH, A.L., 2011. Growth and nutrient uptake of maize plants as affected by elemental sulfur and nitrogen fertiliser in sandy calcareous soil. African Journal of Biotechnology, vol. 10, no. 60, pp. 12882-12889. http://doi.org/10.5897/AJB11.2075
» http://doi.org/10.5897/AJB11.2075 -
RANDIVE, K., RAUT, T. and JAWADAND, S., 2021. An overview of the global fertiliser trends and India’s position In 2020. Mineral Economics, vol. 34, no. 3, pp. 371-384. http://doi.org/10.1007/s13563-020-00246-z
» http://doi.org/10.1007/s13563-020-00246-z -
ROUT, G.R. and SAHOO, S., 2015. Role of iron in plant growth and metabolism. Reviews in Agricultural Science, vol. 3, no. 0, pp. 1-24. http://doi.org/10.7831/ras.3.1
» http://doi.org/10.7831/ras.3.1 -
SADIQ, G., KHAN, A.A., INAMULLAH, RAB, A., FAYYAZ, H., NAZ, G., NAWAZ, H., ALI, I., RAZA, H., AMIN, J., ALI, S., KHAN, H.A., KHAN, A.A. and KHATTAK, W.A., 2017. Impact of phosphorus and potassium levels on yield and yield components of maize. Pure and Applied Biology, vol. 6, pp. 1071-1078. http://doi.org/10.19045/bspab.2017.600114
» http://doi.org/10.19045/bspab.2017.600114 -
SCHACHTMAN, D.P., REID, R.J. and AYLING, S., 1998. Phosphorus uptake by plants: from soil to cell. Plant Physiology, vol. 116, no. 2, pp. 447-453. http://doi.org/10.1104/pp.116.2.447 PMid:9490752.
» http://doi.org/10.1104/pp.116.2.447 -
SEDELNIKOVA, O.V., HUGHES, T.E. and LANGDALE, J.A., 2018. Understanding the genetic basis of C4 kranz anatomy with a view to engineering C3 crops. Annual Review of Genetics, vol. 52, no. 1, pp. 249-270. http://doi.org/10.1146/annurev-genet-120417-031217 PMid:30208293.
» http://doi.org/10.1146/annurev-genet-120417-031217 -
SENBAYRAM, M., GRANSEE, A., WAHLE, V. and THIEL, H., 2015. Role of magnesium fertilisers in agriculture: plant–soil continuum. Crop & Pasture Science, vol. 66, no. 12, pp. 1219-1229. http://doi.org/10.1071/CP15104
» http://doi.org/10.1071/CP15104 -
SILVA, C.G.M., RESENDE, A.V., GUTIERREZ, A.M., MOREIRA, S.G., BORGHI, E. and ALMEIDA, G.O., 2018. Macronutrient uptake and export in transgenic corn under two levels of fertilisation. Pesquisa Agropecuária Brasileira, vol. 53, no. 12, pp. 1363-1372. http://doi.org/10.1590/s0100-204x2018001200009
» http://doi.org/10.1590/s0100-204x2018001200009 -
STEWART, Z.P., PAPAROZZI, E.T., WORTMANN, C.S., JHA, P.K. and SHAPIRO, C.A., 2021. Effect of foliar micronutrients (B, Mn, Fe, Zn) on maize grain yield, micronutrient recovery, uptake, and partitioning. Plants, vol. 10, no. 3, pp. 1-25. http://doi.org/10.3390/plants10030528 PMid:33799873.
» http://doi.org/10.3390/plants10030528 -
SUTAR, R.K., PUJAR, A.M., ARAVINDA KUMAR, B.N. and HEBSUR, N.S., 2017. Sulphur nutrition in maize: a critical review. International Journal of Pure and Applied Bioscience, vol. 5, no. 6, pp. 1582-1596. http://doi.org/10.18782/2320-7051.6092
» http://doi.org/10.18782/2320-7051.6092 - TAIZ, L. and ZEIGER, E., 2022. Plant physiology. 3rd ed. New York: Sinauer Associate, 623 p.
-
VÁGÓ, I., SIPOS, M., TOLNER, L., EICHLER-LÖBERMANN, B. and CZINKOTA, I., 2014. Dynamics of dry matter production and potassium uptake of maize in a long-term field experiment on chernozem soil. Agrokémia és Talajtan, vol. 63, no. 1, pp. 149-158. http://doi.org/10.1556/agrokem.63.2014.1.16
» http://doi.org/10.1556/agrokem.63.2014.1.16 -
XU, Z., LAI, T., LI, S., SI, D., ZHANG, C., CUI, Z. and CHEN, X., 2018. Promoting potassium allocation to stalk enhances stalk bending resistance of maize (Zea mays L.). Field Crops Research, vol. 215, pp. 200-206. http://doi.org/10.1016/j.fcr.2017.10.020
» http://doi.org/10.1016/j.fcr.2017.10.020 -
YUHUI, G., GUOJUN, C., LICHUN, W. and SHUHUA, W., 2019. Potassium accumulation, partitioning, and remobilisation in high-yield spring maize in Northeast China. Journal of Plant Nutrition, vol. 42, no. 11-12, pp. 1366-1377. http://doi.org/10.1080/01904167.2019.1609501
» http://doi.org/10.1080/01904167.2019.1609501 -
ZHAI, J., ZHANG, G., ZHANG, Y., XU, W., XIE, R., MING, B., HOU, P., WANG, K., XUE, J. and LI, S., 2022. Effect of the rate of nitrogen application on dry matter accumulation and yield formation of densely planted maize. Sustainability, vol. 14, no. 22, pp. 1-14. http://doi.org/10.3390/su142214940
» http://doi.org/10.3390/su142214940 -
ZHANG, M., GENG, Y., CAO, G., WANG, L., WANG, M. and STEPHANO, M.F., 2020. Magnesium accumulation, partitioning and remobilisation in spring maize (Zea mays L.) under magnesium supply with straw return in northeast China. Journal of the Science of Food and Agriculture, vol. 100, no. 6, pp. 2568-2578. http://doi.org/10.1002/jsfa.10282 PMid:31975501.
» http://doi.org/10.1002/jsfa.10282 -
ZHANG, M., HU, Y., HAN, W., CHEN, J., LAI, J. and WANG, Y., 2023a. Potassium nutrition of maize: uptake, transport, utilization, and role in stress tolerance. The Crop Journal, vol. 11, no. 4, pp. 1048-1058. http://doi.org/10.1016/j.cj.2023.02.009
» http://doi.org/10.1016/j.cj.2023.02.009 -
ZHANG, P., GU, S., WANG, Y., XU, C., ZHAO, Y., LIU, X., WANG, P. and HUANG, S., 2023b. The relationships between maize (Zea mays L.) lodging resistance and yield formation depend on dry matter allocation to ear and stem. The Crop Journal, vol. 11, no. 1, pp. 258-268. http://doi.org/10.1016/j.cj.2022.04.020
» http://doi.org/10.1016/j.cj.2022.04.020