
 Curcumin encapsulation through complex coacervation using
carboxymethylated tara gum and lysozyme: Methodology, characterization, and
incorporation in bread
Curcumin encapsulation through complex coacervation using
carboxymethylated tara gum and lysozyme: Methodology, characterization, and
incorporation in breadAbstract
Curcumin obtained from Curcuma longa is a polyphenol that has been used in traditional Indian and Chinese medicine for centuries. It was also incorporated into foods through encapsulation to include its health benefits in daily diet. The present study aimed to microencapsulate curcumin through complex coacervation using lysozyme (LSZ) and carboxymethylated tara gum (CMTG) and then incorporate it into bread. Curcumin encapsulation through complex coacervation was performed using different core/wall ratios and total biopolymer concentration. The complexes of LSZ and CMTG formed at pH 5.0 exhibited electrostatic attraction with high affinity and an excellent curcumin encapsulation efficiency of 74.86%. The microcapsules protected curcumin during the oral and gastric phases, with an average release of 77% to 94% in the intestinal phase. After gastrointestinal digestion, the bioaccessibility of the encapsulated curcumin was approximately 47%. The bread in which the curcumin was encapsulated exhibited antioxidant activity (FRAP and DPPH+), with 93.9% curcumin preservation after cooking and 31% bioaccessibility. Therefore, the microcapsules containing curcumin formed after the complex coacervation of lysozyme and carboxymethylated tara gum may be used for the enrichment of bakery products such as bread.
Index terms:
Antioxidant; polyphenol; galactomannans; carboxymethylation.
Resumo
A curcumina obtida apartir da Curcuma longa é um polifenol utilizado há séculos na medicina tradicional indiana e chinesa, que foram incorporados aos alimentos por meio de encapsulamento visando seus benefícios à saúde. O objetivo do presente estudo foi microencapsular a curcumina por coacervação complexa usando lisozima (LSZ) e goma tara carboximetilada (CMTG) e incorporá-las ao pão. A curcumina foi encapsulada por coacervação complexa usando diferentes proporções núcleo/parede e concentração total de biopolímero. Os complexos formados por LSZ e CMTG em pH 5,0 apresentaram atração eletrostática com alta afinidade e excelente eficiência de encapsulamento de curcumina (74,86%). As microcápsulas protegeram a curcumina durante a fase oral e gástrica com liberação média na fase intestinal de 77 a 94%. Após a digestão gastrointestinal, a bioacessibilidade da curcumina encapsulada foi de aproximadamente 47%. O pão contendo curcumina encapsulada apresentou atividade antioxidante (FRAP e DPPH+), com preservação de curcumina após cozimento de 93,9% e bioacessibilidade de 31%. Portanto, microcápsulas contendo curcumina formadas por coacervação complexa de lisozima e goma tara carboximetilada podem ser usadas para enriquecer produtos de panificação, como pão.
Termos de indexação:
Antioxidante; polifenol; galactomananas; carboximetilação.
Introduction
The fortification of one or more nutrients in a food item aims to incorporate nutritional value and prevent or correct any nutritional deficiencies observed in the general population or specific groups of individuals (Vellozo & Fisberg, 2010). Curcumin obtained from Curcuma longa is a polyphenol that has been used in traditional Indian and Chinese medicine for centuries (Ferguson et al., 2019; Chen et al., 2014). Curcumin is used mainly in food and chemical industries as a coloring, flavoring, and preservative agent (Chen et al., 2014). Owing to its bioactive properties, curcumin is used in the treatment of neurodegenerative, liver, lung, and gastrointestinal diseases (Ariyarathna & Karunaratne, 2016). The application and bioavailability of curcumin may be improved by encapsulating it using various methods and different wall materials (Shahgholian & Rajabzadeh, 2016; Chen Liu, & Tang, 2020). Recent studies have reported the use of complex coacervation to encapsulate curcumin (Nguyen, Thi, & Nguyen, 2021; Shahgholian & Rajabzadeh 2016; Li et al., 2015). Complex coacervation comprises the following three steps: emulsification, coacervation, and crosslinking (Zhang et al., 2012). When selecting the wall material, the isoelectric point of the protein, the pH range, and the molecular mass of the biopolymers have to be considered (McClements, 2014).
Carboxymethyl tara gum (CMTG) is synthesized from tara gum (TG) using the carboxymethylation reaction (Verma & Ahuja, 2020). In this reaction, an ionic charge is incorporated into CMTG, providing the molecule with a negative electrical charge across a wide range of pH (2.5 to 10), as demonstrated in previous studies (Santos, De Carvalho, & Garcia-Rojas, 2021; Da Silva, Constantino, & Garcia-Rojas, 2024). Lysozyme (LSZ) is a glycoprotein present in egg white. LSZ has various functional and enzymatic properties and a high isoelectric point (pI) of around 9.5. LSZ also has a positive charge across a wide range of pH (Huang et al., 2020; Santos, Da Costa, & Garcia-Rojas, 2018). Therefore, CMTG has a high potential for having a negative charge while LSZ has a high potential for having a positive charge across a wide range of pH. Consequently, the interaction between CMTG and LSZ is important when selecting biopolymers to be used as wall material. (Huang et al., 2020; Santos, Da Costa, & Garcia-Rojas, 2018; Da Silva, Constantino, & Garcia-Rojas, 2024). Moreover, lysozyme has a low molar mass of 14 kDa compared to other proteins and is, therefore, capable of forming a more compact internal structure with polysaccharides (Huang et al., 2020).
Recently, Ferguson et al. (2019) evaluated different combinations of phytosterols and curcumin in plain white flour bread for their effect on the plasma lipid profile of hypercholesterolemic individuals. The authors reported results evidencing bread as a safe and effective food format for lowering cholesterol and modulating the lipoprotein profile of hypercholesterolemic subjects.
In the above context, the present study aimed to fabricate, as well as characterize, curcumin microcapsules through complex coacervation using LSZ and CMTG for use as wall materials for fortification in wheat bread.
Material and Methods
LSZ, curcumin, ɑ-amylase (A3403), porcine pancreatin pancreatin (P7545), porcine pepsin (P6887), porcine bile extract (B3883), 2,4,6-tris 2-pyridyl-s-triazine (TPTZ), 2,2-Diphenyl-1-picrylhydrazyl (DPPH), monochloroacetic acid (MCA), and sodium chloride were purchased from Sigma-Aldrich® (St. Louis, USA). Tara gum (TG, purity ≥ 90%) was purchased from Vogler® ingredients (São Paulo, Brazil). Transglutaminase (TGase) (100 U/g) was purchased from Ajinomoto (São Paulo, Brazil). Wheat flour and dry biological yeast were obtained from the local market. Ultrapure water Master System R&D with 0.05 µS/cm (Gehaka, Brazil) and P.A. grade reagents were used in all assays.
Carboxymethylation of tara gum
TG carboxymethylation was conducted in an aqueous alkaline medium using monchloroacetic acid as the esterifying agent, as reported by Verma et al. (2020). Briefly, the TG dispersion was prepared by adding 1 g of TG in 70 mL of ice-cold aqueous sodium hydroxide solution (35% w/v) under vigorous stirring for 30 min. Subsequently, 20 mL of the aqueous monochloroacetic acid solution (75% w/v) was added gradually into the above dispersion, with appropriate stirring, followed by raising the temperature of the mixture to 80 ± 1 °C for 1 h. Next, TG was cooled and precipitated through the addition of 80% (v/v) methanol aqueous solution, followed by neutralization using glacial acetic acid (6 mL). After three washes with 90% (v/v) aqueous solution of methanol and then with pure methanol, the product was dried inside an air circulation oven (SSDcr, MY LABOR, Brazil) at 50 °C for 24 h to obtain the final product.
Determining the degree of substitution
The degree of substitution (DS) was estimated for each CMTG sample as described by Nattapulwat, Purkkao and Suwithayapan (2009) and Da Silva, Constantino and Garcia-Rojas (2024). CMTG (300 mg) was completely solubilized in the distilled water (30 mL) neutralized with HCL, followed by the addition of the NaOH solution (0.2 M, 20 mL). The resulting mixture was transferred to a volumetric flask (100 mL), and the volume was adjusted to the mark with distilled water. An aliquot of 25 mL from this solution was titrated with standard HCl solution (0.04 M) using phenolphthalein as an indicator. A blank sample was also titrated. DS values were then calculated using Equations (1) and (2) provided below:
where, n COOH denotes the number of carboxymethyl groups, V b (mL) and V (mL) denote the volumes of HCl used for the blank titration of the CMTG samples (M/L), and C HCL (M/L) denotes the concentration of the standard HCl solution. In Equation (2), 162 (g/M) is the molar mass of the glucose unit, and 58 (g/M) is the increment in the molar mass of the glucose unit due to the substitution by a carboxymethyl group; m (g) denotes the mass of the CMTG sample. DS determination was performed in triplicate.
The molecular weight of CMTG was determined using the viscosimetric method reported by Fernandes and Garcia-Rojas (2021) and Da Silva, Constantino and Garcia-Rojas (2024), who estimated the molecular weight using the Mark-Houwink Equation (3) provided below:
where, [η] denotes the intrinsic viscosity (dL/g), is the average viscosimetric molecular weight expressed in g/mol, and α is a constant related to the structure of galactomannan, determined using Equation (4) provided below:
where, (M/G) is the ratio of mannose and galactose within the polysaccharide structure.
Zeta potential
A Zetasizer Nano ZS90 (Malvern Instruments, UK) was employed to determine the zeta potential (ζ) of the CMTG and LSZ solutions. The optimal conditions for the formation of coacervate complexes were determined by calculating the electrostatic interaction strength (SEI) using Equation (5). The pH of each solution was adjusted to different values ranging from 2 to 12 (with increments of 0.5 ± 0.05 units) using 0.1 mol/L NaOH and 0.1 mol/L HCl.
In the above equation, ZP1 and ZP2 denote the ζ potential values determined at each pH value, for CMTG and LSZ solutions, respectively.
Phase diagram
Stock solutions of 2% (w/w) LSZ and 2% (w/w) CMTG were prepared in ultrapure water containing 0.02% (w/w) sodium azide. The behavior of the formed soluble and insoluble complexes was understood based on the phase diagram, which was constructed to evaluate the influence of the different concentrations of total biopolymers (TC) [0.1%, 0.5%, 1.0%, and 2% (w/w)] when using LSZ and CMTG in different ratios of 1:1; 2:1; 4:1; 6:1; 8:1, and 10:1 at pH 5.0, which is the previously determined pH at the zeta potential, after static rest at 7 °C for 24 h.
Isothermal titration calorimetry
Isothermal titration calorimetry (ITC) was performed using Nano-ITC equipment (TA Instruments, USA). LSZ (1 mM/L) and CMTG (0.001625 mM/L) solutions were prepared in citrate buffer (10 mM/L, pH 5.0) at 25 °C. After solubilization, these LSZ and CMTG solutions were dialyzed using 3.5 kDa membranes (Sigma Aldrich, Midi 3500, USA), followed by degassing. Afterward, 250 μL of LSZ was injected, in total, into the sample cell containing 1200 μL of CMTG. Ten microliters were injected into the sample cell every 150 s under stirring at 300 rpm. The thermodynamic parameters determined were reaction stoichiometry (N), binding constant (Ka), enthalpy change (ΔH), entropy change (ΔS), and Gibbs free energy change (ΔG), which were obtained using the TA Nano Analyze program®.
Preparation of the microcapsules of curcumin
The LSZ and CMTG solutions were dissolved individually, and the pH of each of the resulting solutions was neutralized to 7.0. Solutions at total biopolymer concentrations of 0.5%, 1.0%, and 2.0 (% w/w) and with wall/core material ratios of 1:1, 2:1, and 4:1 were obtained. Emulsions (O/W) were prepared by emulsifying soybean oil with curcumin (1%) and the LSZ solution using Ultraturrax for 5 min/12,000 rpm followed by ultrasound treatment (UP 100H, Hielschier, Germany) for 15 min (100% amplitude and 0.5 cycles/s). In order to promote coacervation, CMTG was mixed with the emulsion, followed by adjusting the pH to 5.0 using acetic acid (15%) and then stirring the system continuously for 30 min at 300 rpm. Next, an ice bath was used for rapid lowering of temperature by 5 °C within 30 min. Afterward, 5 mL of transglutaminase (TG, 30 U/g of protein) was added to the microcapsules, followed by shaking (60 rpm) in a shaker (TE-424, Tecnal, Brazil) at 25 °C for 3 h (Santos, De Carvalho, & Garcia-Rojas, 2021; Constantino & Garcia-Rojas, 2022). After allowing the system to stand undisturbed for 24 h at 4 °C, the resulting supernatant was removed, and the microcapsules were frozen in liquid nitrogen and then lyophilized (Enterprise I, Terroni, Brazil) for 48 h.
Encapsulation efficiency
The lyophilized microcapsules (10 mg) were dissolved in the 10 mL ethanol solution (95%) followed by vortexing for 5 min. Afterward, the solution was placed in an ultrasound bath for 20 min, followed by centrifugation (Digicen 21R, OrtoAlresa, Spain) at 8,000 rpm for 10 min. The curcumin released in the supernatant of the dried microcapsules was quantified using a UV-VIS spectrophotometer (Biomate 3S, Thermo Scientific, USA) at 425 nm and a calibration curve (Y = 0.1675X + 0.0104, R2 = 0.9994) constructed using the curcumin solutions dispersed in absolute ethanol at concentrations ranging from 0.1 to 10 mg/mL.
The theoretical percentage of curcumin (TO) was calculated using Equation (6). The percentage of loaded curcumin (LC) was determined using Equation (7). The percentage of EE was calculated using Equation 8, as reported by Da Silva, Carvalho and Garcia-Rojas (2021).
In the above equations, WId denotes the initial mass (g) of curcumin added to the system, and WIc denotes the total initial mass (g) of the weighted components (soybean oil containing curcumin, LSZ, and CMTG) at the time of microencapsulation. The curcumin content in the oil was determined using a spectrophotometer by weighing 0.01 g of the oil after its solubilization. In the above equations, WFd denotes the curcumin content (g) after encapsulation, and WFc denotes the final mass (0.01 g) of the curcumin microcapsules used in the analysis after lyophilization.
Fourier-Transform Infrared Spectroscopy (FTIR)
The spectra of the biopolymers LSZ and CMTG, soybean oil, curcumin, and the lyophilized microcapsules containing curcumin were obtained using Fourier-transform infrared spectrophotometry (FT-IR) (Bruker, Vertex 70, Germany). The spectra were recorded within the wavelength range of 4000 to 400 cm-1.
Microcapsule antioxidant analysis
The antioxidant activity of the microcapsules was studied using the radical scavenging method (DPPH) and by determining the antioxidant potential for iron reduction (FRAP). The extract for this analysis was obtained by mixing the microcapsules (200 mg) with 10 mL of 95% ethanol, followed by shaking at 100 rpm inside a shaker incubator (TE-424, Tecnal, Brazil) for 4 h at 30 °C. The resulting supernatant was collected and subjected to DPPH and FRAP analyses as described by Constantino and Garcia-Rojas (2022) and Chen, Liu and Tang (2020), respectively.
The in vitro digestion of the encapsulated curcumin
The in vitro digestion of the encapsulated curcumin was performed using the INFOGEST® method (Brodkorb et al., 2019), which involved the steps of oral, gastric, and intestinal simulation. The lyophilized sample (0.2 g) and water (0.5 g) were weighed on an analytical balance (B-TEC-210, Tecnal, Brazil) and then added to 0.56 mL of the pre-warmed simulated salivary fluid (FSS) (37 °C) containing 0.07 mL of the salivary ɑ-amylase (75 U/mL). The resulting mixture was then added to a mixture of 3.5 µL of 0.3 M CaCl2 and 0.067 mL of water in a 1:1 (w/w) ratio. The pH of this mixture was adjusted to 7.0 [measured using a pH meter (mPA210, Tecnopon, Brazil)], followed by shaking the mixture at 95 rpm for 2 min at 37 ºC using a shaker (TE-424, Tecnal, Brazil). The gastric solution was mixed with the oral digestion mixture, followed by the addition of 1.4 mL of the pre-warmed (37 °C) simulated gastric fluid (SGF) containing 0.07 mL of a pepsin solution (2000 U/mL). Next, 0.7 µL of 0.3 M CaCl2 and 0.039 µL of water were added to the mixture. The pH of the resulting mixture was adjusted to 3.0, followed by stirring the mixture at 95 rpm for 2 h at 37 °C using a shaker. After the gastric digestion, 2.8 mL of the pre-warmed (37 °C) simulated intestinal fluid (SIF) was added to the mixture, together with 0.7 mL of the pancreatin solution (final volume of the intestinal solution: 100 U/mL) and 0.35 mL of the bile extract. The mixture was then added to 5.6 µL of 0.3 M CaCl2 and 354 µL of water, followed by adjusting the pH to 7.0 [measured using a pH meter (mPA210, Tecnopon, Brazil)] and then shaking the mixture at 95 rpm for 2 h at 37 ºC using a shaker (TE-424, Tecnal, Brazil). Aliquots (200 µL) of each sample were collected at all phases (oral, gastric, and intestinal) at the intervals of 0, 15, 30, 60, and 120 min and used for determining the amount of curcumin released. After withdrawing each aliquot, 200 µL of the gastric juice or intestinal juice was added to continue the digestion process.
Bioaccessibility of curcumin
The bioaccessibility of curcumin (B*) was determined after the in vitro digestion to obtain C digeste , for which an aliquot of 200 µL was collected and mixed with ethanol (96%) followed by centrifugation at 4,000 rpm for 5 min at 4 °C and then measurements using a spectrophotometer. The C micelle (micellar phase) value was determined by centrifuging the digested sample (2 mL) at 4,000 rpm for 20 min at 4 °C, followed by collecting an aliquot of 200 µL between the supernatant and the precipitate and mixing it with ethanol (96%) followed by analysis. The B* value was determined using Equation (9) provided below:
where, C micelle denotes the curcumin concentration in the micelle and C digest denotes the curcumin concentration at the end (120 min) of the intestinal digestion.
Incorporation of the curcumin microcapsules in bread
Briefly, 20 g (100%) of wheat flour was mixed with 0.4 g (2%) yeast, 0.4 g (2%) NaCl, 11.6 g (58%) wáter, and 1320 g of the prepared microcapsules (lyophilized) containing 4.8 mg of curcumin (corresponding to 30%), as directed by the technical regulation of complementary nutritional information of ANVISA (Brasil). The dough was prepared manually for 10 min and then heated in a LAB 1,000 oven (Bravac, Brazil) at 200 °C for 30 min (Constantino & Garcia-Rojas, 2022).
Curcumin content after the cooking process
The curcumin content in the bread after the cooking process was determined based on the amount of curcumin preserved after the process, as described by Constantino and Garcia-Rojas (2022). The bread samples were ground in a blender, following which 5 g of each ground sample was mixed with 20 mL ethanol (96%). The mixture was stirred for 1 h and then centrifuged at 9,000 rpm for 10 min at 10 ℃. The resulting supernatant was collected and subjected to the determination of the curcumin content using the curcumin calibration curve, which was also employed for the encapsulation efficiency stage analysis.
Bioaccessibility of curcumin in bread
The bioaccessibility of curcumin (B*) in bread after the in vitro digestion was determined using the method of INFOGEST® (Brodkorb et al., 2019).
Reducing capacity and antioxidant activity of the bread
The process to obtain the extract to be used in the microcapsule antioxidant analysis began with adding 10 mL of 95% ethanol to a 200 mg sample of bread containing the microencapsulated curcumin and also to a 200 mg sample of free curcumin. The samples were then shaken (100 rpm) incubator for 4 h at 30 °C inside a shaker, and the resulting supernatant was collected and subjected to DPPH and FRAP analyses as described by Constantino and Garcia-Rojas (2022) and Chen, Liu and Tang (2020).
Statistical analysis
All experiments were performed in triplicate. The result data were expressed as mean and standard deviation (±) values. Statistical analysis was performed using the Origin® Pro 9.0 program (OriginLab, Northampton, USA). The level of significance for the differences was set at p < 0.05 according to Tukey’s test.
Results and Discussion
CMTG was synthesized from TG, and its DS was determined to be 0.49 and its molar mass was 1,190 x 106 Da. These values were consistent with those reported in previous studies (Da Silva, Constantino & Garcia-Rojas, 2024).
Influence of the pH and concentration of biopolymers on the formation of LSZ and CMTG complexes
Figure 1 presents the ζ potentials and SEI values of LSZ and CMTG at different pH values (range 2.0-12.0). As visible in the figure, LSZ had a positive electrical charge throughout the studied pH range, while CMTG had a negative electrical charge throughout the studied pH range. The highest SEI value of 202.83 ± 20.1 was recorded at pH 5.0, indicating a strong interaction of the two polyelectrolytes at this pH. Therefore, this value was considered the optimal pH value for the formation of a complex between LSZ and CMTG.

The phase diagram for the LSZ and CMTG mixtures as a function of ratios (1:1; 2:1; 4:1; 6:1; 8:1; 10:1) and total biopolymer (TC) concentrations (0.1; 0.5; 1.0; 2.0) at pH 5.0 is presented in Figure 2 (A). The appearance of the 2:1 ratio LSZ-CMTG mixtures at pH 5.0 is presented in Figure 2 (B). In the 1:1 ratio (of LSZ and CMTG), the solutions of all the CT biopolymers depicted in Figure 2 (A) were turbid, and no precipitation was noted (□), indicating that at pH 5 and in similar proportions of biopolymers (1:1), the complexes between LSZ and CMTG were soluble (Lan et al., 2020). In Figure 2 (B), an increase is visible in the amount of LSZ relative to CMTG (2:1), with a phase separation that was observed with an evident appearance of a precipitate (●). This appearance was maintained in the remaining ratios as well (4:1, 6:1; 8:1, and 10:1), at the same pH, indicating the co-solubility of LSZ and CMTG (Lan et al., 2020). Therefore, the LSZ:CMTG ratio of 2:1 was considered adequate for the formation of an insoluble coacervate complex between the biopolymers, and a ratio with a higher proportion of LSZ relative to CMTG was not required. Consequently, the LSZ:CMTG ratio of 2:1 was selected as the optimal one for LSZ-CMTG complex formation.

(A) Phase diagram of LSZ and CMTG mixtures as a function of ratios (1:1; 2:1; 4:1; 6:1; 8:1 and 10:1) and total biopolymer concentrations (0.1; 0.5; 1.0; 2.0) at pH 5. (B) The appearance of LSZ:CMTG mixtures in the 2:1 ratio at pH 5 at all concentrations studied observed after 24 h of static rest at 4 °C. Symbols □ and ● represent (□) turbid / milky solution without precipitates and (●) clear solution with precipitates.
Isothermal titration calorimetry
The time heat flux thermogram obtained after the titration of the LSZ solution in the CMTG solution at pH 5.0 and 25 °C is depicted in Figure 3. As visible in Figure 3 (A), the titration profile of LSZ and CMTG was exothermic, indicating an enthalpic contribution of the LSZ-CMTG interaction at 25 °C. Figure 3 (B) presents the binding isotherm of the LSZ and CMTG complex, revealing a decreasing trend of heat release from the thirteenth injection, which was attributed to a reduction in free protein molecules causing a reduction in the energy released (Bastos et al., 2020). Further, the independent model indicated that the binding of LSZ and CMTG into a complex occurred with a Ka value of 4.14 x 10⁷ M-1, indicating a high affinity between LSZ and CMTG. The reactions were enthalpically favorable (ΔH = -5.91 ± 0.14 kcal.M-1) and entropically unfavorable (ΔS = 15.01 kcal. M-1. K-1), which implied that the interactions between LSZ and CMTG were predominantly electrostatic. The reason for this was that at pH 5.0, the 𝜁 potential values of the polyelectrolytes were opposite. The negative value of ΔH might be associated with electrostatic interactions, while the positive ΔS value suggested a change in the order of the system and could be related to hydrophobic interactions (Gao et al., 2021). The negative ΔG variation value of -10.39 kcal.M-1 indicated that the reaction was spontaneous. The (N) value implied that 63.93 ± 0.42 moles of LSZ were required to saturate 1 mole of CMTG.
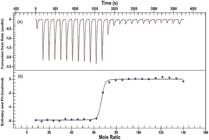
(A) Thermogram of heat flux (μcal/s) as a function of time (s), obtained during the titration of 1 mM of LSZ in 0.001625 of CMTG. 10 mM acetate (pH 5) at 25 °C. (B) Graphic representation of the integral of the areas of each peak (kcal/mol) as a function of the molar ratio of LSZ:CMTG (p < 0.05).
Encapsulation efficiency
According to the results presented in Table 1, the EE (%) of curcumin ranged from 57% to 75%. In the studied systems, a significant difference (p < 0.05) was observed between samples A6 and A9, with the wall/core material ratio of 4:1 and the TC values of 1% and 2%, respectively, compared to the other systems. The systems with a wall/core material ratio of 1:1 and 2:1 presented no significant difference (p < 0.05). In the samples with TC = 0.5%, a reduced EE% was observed in all the systems, which could be explained by the fact that biopolymer quantities were not sufficient to encapsulate all the oil in the system. In order to select the best system, two factors were considered - TC (%) and LC (%). Accordingly, sample A6 was selected as the best system, as it had a higher LC (%) of 0.26 ± 0.06 and a lower TC (%) of 1%, demonstrating that the wall material quantity was sufficient to trap the core, influencing the amount of encapsulated curcumin (Constantino & Garcia-Rojas, 2022). In other studies, on curcumin encapsulation through complex coacervation, EE% values ranging from 40% to 70% were obtained (Nguyen, Thi, & Nguyen, 2021).
Fourier-transform infrared spectroscopy
Figure 4 depicts the FTIR spectra of the microcapsule (A6), CMTG, LSZ, cucumin, and soybean oil. The characteristic regions of the protein structure were the amide I band at 1645 cm-1 corresponding to the elongation of the C=O group (free carboxyl), the amide II band at 1510 cm-1 corresponding to the elongation of the NH group, and the amide III band at 1386 cm-1 corresponding to the elongation of the CN and NH groups (Santos, Da Costa, & Garcia-Rojas, 2018). The elongation of the NH and OH groups in the free amino acids appears as bands at 3288 cm-1 (Santos, Da Costa, & Garcia-Rojas, 2018). In the present study, for CMTG, the 3386 cm-1 band corresponded to the O-H stretching vibration, the band at 2919 cm−1 corresponded to the CH symmetric stretching vibrations, and the band at 1016 cm−1 corresponded to H2C-O-CH2 bending. In addition, the band at 1587 cm-1 assigned to the COO− asymmetric stretching vibration and that at 1407 cm-1 assigned to the −COO symmetric stretching vibration corresponded to the carboxymethylation reaction (Santos, De Carvalho, & Garcia-Rojas, 2021). Similar results were reported by Santos, Da Costa and Garcia-Rojas, 2018 and Santos, De Carvalho and Garcia-Rojas (2021) in their respective studies. The spectrum obtained for the soybean oil sample presented the characteristic bands for edible oils and fats, such as those in the region from 3002 to 2854 cm-1, which corresponded to the axial deformation vibrations of the C-H bonds of methyl (CH3), methylene (CH2), and double bonds (=C-H). The band at 1745 cm-1 corresponded to the carbonyl group (C=O) in the constituent ester groups of triacylglycerides. The bands in the region from 1461 to 1159 cm-1 were attributed to the axial deformation vibrations referring to the axial deformation vibrations of the C-O bond of the constituent esters of triacylglycerides. The spectrum obtained for curcumin presented bands at 3500 cm−1 corresponding to the stretching vibrations of the O-H group in phenolics. The bands at 1625 cm−1 corresponded to the stretching of the C=O functional group. The band at 1427 cm−1 corresponded to the stretching of C=C in aromatic and aliphatic rings. The band at 1026 cm−1 appeared due to the stretching vibration of C-O. In addition, bands appeared at 960 cm−1 (out-of-plane strain vibration C-H), 808 cm−1 (CH2 rocking vibration), and 713 cm−1 (CH2 strain vibration) (Prasad, Salar, & Salar, 2022). In the spectra of the microcapsules (A6), the presence of curcumin and soybean oil was established through the appearance of bands at 3297 and 2850 cm-1, respectively. The presence of LSZ was confirmed through the appearance of bands at 1645 cm-1 and 1539 cm-1, while the presence of CMTG was established based on the appearance of the band at 1026 cm-1 (Santos, Da Costa, & Garcia-Rojas, 2018).

Fourier transform infrared spectroscopy (FTIR) spectra of CMTG, LSZ, curcumin, soybean oil and curcumin microcapsules (A6).
The in vitro digestion and bioaccessibility analysis
The release of curcumin from the microcapsules (A6) was evaluated in the oral, gastric, and intestinal phases during a period of 240 min (4 h). The results are depicted in Figure 5. Initially, at the end of the oral phase (2 min), a release of 10.85% curcumin was noted. Afterward, curcumin presented a release rate of 19.2% to 30.6% in the gastric phase. The stability and low release of curcumin in acidic pH and gastric phase (pepsin hydrolysis) may be explained by the presence of microcapsules that prevented the release of curcumin under these conditions. Moreover, as already known, curcumin is stable at acidic pH (3.0 to 6.5) and unstable at neutral or alkaline pH due to rapid hydrolytic degradation (Prasad, Salar, & Salar, 2022). A similar result was reported by Behbahani et al. (2019), who evaluated the release of curcumin in the gastric phase for 2 h. In the intestinal phase, a drastic increase in curcumin release was noted in their study, with a release range of around 77.49% to 92.73%. These results indicated that the selected wall material increased the stability of curcumin during digestion, thereby protecting the encapsulated curcumin against hydrolysis and biotransformation (Behbahani et al., 2019). Similar results were reported by Papillo et al. (2019), who highlighted the different ingredients rich in microencapsulated curcuminoids and achieved a greater release in the intestinal phase in all tested ingredients. Huang et al. (2020) used lysozyme and κ-carrageenan as wall materials for nano-complex formation and reported a lower release of curcumin in the gastric phase (17%) and higher curcumin release in the intestinal phase (67%), similar to the findings of the present study.

The bioaccessibility of curcumin was assessed through the in vitro simulation of the gastrointestinal digestion of the microcapsules. The determined bioaccessibility value for curcumin was around 47.41% ± 2.06%, suggesting that curcumin might have been released in the digestion medium due to the action of pancreatic lipases because the curcumin used was homogenized in soybean oil, as also described by Papillo et al. (2019). This result was consistent with that reported by Chen, Liu and Tang (2020), who reported a bioaccessibility of 36% to 51% for the curcumin nano-complexes formed with soy protein isolate.
Antioxidant activity of curcumin microcapsules
The FRAP test revealed that the curcumin microcapsules (A6) had a reducing antioxidant capacity of 46.51 ± 3.43 TEA µmol/L and a DPPH free radical scavenging activity of 27.40 ± 1.0 TEA µmol/g. These values are d compared to those obtained using other encapsulation techniques, such as spray drying. Chen, Liu and Tang (2020) reported obtaining antioxidant activity values of 10.7 (μmol Trolox equivalent/μmol curcumin) and 36.8 (μg/mL) using the ORAC and DPPH methods, respectively. The values obtained in the present study are also consistent with those reported in other previous studies that have evaluated the antioxidant activity of microcapsules containing curcumin (Meiguni et al., 2023; Tavano et al., 2014). According to Tavano et al. (2014), free curcumin exhibited a lower radical scavenging activity due to its low water solubility and low biological activity. Hamad et al. (2020) reported that the encapsulation process could increase the bioavailability of curcumin to donate the H atom, thereby demonstrating that this is how encapsulation preserved the bioactive compound and increased its biological activity.
Stability, antioxidant activity, and bioaccessibility of curcumin in baked bread
Figure 6 presents the images of bread samples without microcapsules (A) and with microcapsules (B) after baking. The control sample (A) was subjected to an antioxidant activity analysis, which revealed an irrelevant result. The loss of curcumin content was 6.11% in the bread containing curcumin microcapsules and 35.10% in the bread containing free curcumin, with the latter being a much greater loss of curcumin content. Therefore, it was inferred that the microcapsules protected curcumin by 93.89% and that the bread-baking process exerted a lower effect on the curcumin content present in the bread. Accordingly, it was inferred that bioactive compounds such as curcumin would remain preserved even after microencapsulation, allowing for the application of this process to food products (Rafiee et al., 2019). This advantageous application of curcumin microcapsules in the food industry is expected to replace the use of synthetic antioxidants and dyes with natural substances in this industry (Pathak, Kanwa, & Agrawa, 2015).

(A) Image of bread without microcapsule and (B) Image of bread with curcumin microcapsule after the baking process.
The antioxidant activities of the bread containing curcumin microcapsules and the bread containing free curcumin were also analyzed using the DPPH and FRAP assays. The free radical scavenging activities of the bread containing curcumin microcapsules and the bread containing free curcumin using the DPPH method were 2.58 ± 0.2 TEA µmol/g and 1.93 ± 0.1 TEA µmol/g, respectively. The antioxidant-reducing capacity (FRAP) values obtained for the bread containing curcumin microcapsules and the bread containing free curcumin were 3.41 ± 0.25 TEA µmol/g and 2.83 ± 0.19 TEA µmol/g, respectively. The antioxidant activity determined for the bread containing curcumin microcapsules indicated that the effectiveness of curcumin in donating its hydrogen atom to radicals and a high temperature (200 °C) during the bread-making process did not impair the antioxidant activity of bread curcumin. In a study reported by Liu et al. (2017), the microparticles dried at different temperatures exhibited quite similar DPPH radical scavenging activities, demonstrating that the drying temperature did not influence the antioxidant activity of curcumin.
The bioaccessibility of the bread containing curcumin microcapsules and that of the bread containing free curcumin were also analyzed. The bioaccessibility value determined was 31% for the bread containing curcumin microcapsules and 24.3% for the bread containing free curcumin. The bioaccessibility values determined for the bread containing curcumin microcapsules indicated that the presence of microcapsules prevented the complete degradation of curcumin through digestion.
Conclusions
The protective effect of LSZ and CMTG coacervates complexes on curcumin was verified based on the antioxidant activity analysis and determination of curcumin content after in vitro digestion. Protection was observed in the oral and gastric phases, with a greater release noted in the intestinal phase. When the microcapsules were added to the bread, a much greater preservation of curcumin was noted compared to the bread containing free curcumin. In addition, the bread containing curcumin microcapsules exhibited antioxidant activity and good bioaccessibility.
Acknowledgement
This work was supported by the Conselho Nacional de Desenvolvimento Científico e Tecnológico - CNPq (313928/2021-5); Coordenação de Aperfeiçoamento de Pessoal de Nível Superior - CAPES (Code 001), and Fundação Carlos Chagas Filho de Amparo à Pesquisa do Estado do Rio de Janeiro - FAPERJ (E-26/201.030/2021; E-26/210.052/2023). The authors are grateful for their financial support.
References
- Ariyarathna, I. R., & Karunaratne, D. N. (2016). Microencapsulation stabilizes curcumin for efficient delivery in food applications. Food Packaging and Shelf Life, 10:79-86.
- Bastos, L. P. H. et al. (2020). Complex coacervates of β-lactoglobulin/sodium alginate for the microencapsulation of black pepper (Piper nigrum L.) essential oil: Simulated gastrointestinal conditions and modeling release kinetics. International Journal of Biological Macromolecules, 160:861-870.
- Behbahani, E. S. et al. (2019). Curcumin loaded nanostructured lipid carriers: In vitro digestion and release studies.Polyhedron,164:113-122.
- Brodkorb, A. et al. (2019). Static in vitro simulation of gastrointestinal food digestion. Nature Protocols, 14(4): 991-1014.
- Chen, Z. et al. (2014). Thermal degradation kinetics study of curcumin with nonlinear methods. Food Chemistry, 155:81-86.
- Constantino, A. B. T., & Garcia-Rojas, E. E. (2022). Vitamin D3 microcapsules formed by heteroprotein complexes obtained from amaranth protein isolates and lactoferrin: Formation, characterization, and bread fortification.Food Hydrocolloids,129:107636.
- Chen, F. P., Liu, L. L., & Tang, C. H. (2020). Spray-drying microencapsulation of curcumin nanocomplexes with soy protein isolate: Encapsulation, water dispersion, bioaccessibility and bioactivities of curcumin. Food Hydrocolloids, 105:105821.
- Da Silva S. B., Carvalho C. W. P., & Garcia-Rojas E. E. (2021). Microencapsulation of sacha inchi oil by complex coacervates using ovalbumin-tannic acid and pectin as wall materials. Food and Bioprocess Technology, 14:817-830.
- Da Silva, S. B., Constantino, A. B. T., & Garcia-Rojas, E. E. (2024). Microencapsulation of curcumin by complex coacervation of lactoferrin and carboxymethyl tara gum for incorporation into edible films Food Hydrocolloids for Health, 5:100178.
- Ferguson, J. J. et al. (2019). Bread enriched with phytosterols with or without curcumin modulates lipoprotein profiles in hypercholesterolaemic individuals. A randomised controlled trial.Food & Function, 10(5):2515-2527.
- Fernandes, R. A., & Garcia-Rojas, E. E. (2021). Effect of cosolutes on the rheological and thermal properties of Tara gum aqueous solutions.Journal of Food Science and Technology,58(7):2773-2782.
- Gao, J. et al. (2020). The regulation of sodium alginate on the stability of ovalbumin-pectin complexes for VD3 encapsulation and in vitro simulated gastrointestinal digestion study. Food Research International, 140:110011.
- Hamad, A. et al. (2020). A novel approach to develop spray-dried encapsulated curcumin powder from oil-in-water emulsions stabilized by combined surfactants and chitosan. Journal of Food Science, 85(11):3874-3884.
- Huang, W. et al. (2020). Fabrication of lysozyme/κ-carrageenan complex nanoparticles as a novel carrier to enhance the stability and in vitro release of curcumin.International Journal of Biological Macromolecules,146:444-452.
- Lan, Y. et al. (2020). Phase behavior and complex coacervation of concentrated pea protein isolate-beet pectin solution. Food Chemistry, 307:125536.
- Li, Z. et al. (2015). Curcumin encapsulated in the complex of lysozyme/carboxymethylcellulose and implications for the antioxidant activity of curcumin. Food Research International, 75:98-105.
- Liu, Y. et al. (2017). Improved antioxidant activity and physicochemical properties of curcumin by adding ovalbumin and its structural characterization. Food Hydrocolloids, 72:304-311.
- Meiguni, M. S. M. et al. (2023). Fabrication and characterization of a succinyl mung bean protein and arabic gum complex coacervate for curcumin encapsulation. International Journal of Biological Macromolecules, 224:170-180.
- Mcclements, D. J. (2014). Nanoparticle- and microparticle-based delivery systems: Encapsulation, protection and release of active compounds Boca Raton, Florida, United States: CRC Press, 546p.
- Nattapulwat, N., Purkkao, N., & Suwithayapan, O. (2009). Preparation and application of carboxymethyl yam (Dioscorea esculenta) starch.AAPS PharmSciTech,10(1):193-198.
- Nguyen, L. M. L., Thi, H. N. L., & Nguyen, V.T. (2021). Hydrolyzed Karaya gum: Gelatin complex coacervates for microencapsulation of soybean oil and curcumin. Journal of Food Quality, 5593065, 10 pages.
- Papillo, V. A. et al. (2019). In vitro evaluation of gastro-intestinal digestion and colonic biotransformation of curcuminoids considering different formulations and food matrices.Journal of Functional Foods,59:156-163.
- Prasad, M., Salar, A., & Salar, R. K. (2022). In vitro anticancer activity of curcumin loaded chitosan nanoparticles (CLCNPs) against Vero cells. Pharmacological Research- Modern Chinese Medicine, 3:100116.
- Pathak, L., Kanwa, A., & Agrawa, Y. (2015). Curcumin loaded self assembled lipidbiopolymer nanoparticles for functional food applications. Journal of Food Science and Technology, 52(10):6143-6156.
- Rafiee, Z. et al. (2019). Application of different nanocarriers for encapsulation of curcumin.Critical Reviews in Food Science and Nutrition,59(21):3468-3497.
- Santos, M. B., De Carvalho, M. G., & Garcia-Rojas, E. E. (2021). Carboxymethyl tara gum-lactoferrin complex coacervates as carriers for vitamin D3: Encapsulation and controlledrelease.Food Hydrocolloids,112:106347.
- Santos, M. B., Da Costa, A. R., & Garcia-Rojas, E. E. (2018). Heteroprotein complex coacervates of ovalbumin and lysozyme: Formation and thermodynamic characterization.International Journal of Biological Macromolecules,106:1323-1329.
- Shahgholian, N., & Rajabzadeh, G. (2016). Fabrication and characterization of curcumin-loaded albumin/gum arabic coacervate. Food Hydrocolloids, 59:17-25.
- Tavano, L. et al. (2014). Co-encapsulation of antioxidants into niosomal carriers: Gastrointestinal release studies for nutraceutical applications.Colloids and Surfaces B: Biointerfaces,114:82-88.
- Vellozo E. P., & Fisberg M. A. (2010). Contribuição dos alimentos fortificados na prevenção da anemia ferropriva. Revista Brasileira de Hematologia e Hemoterapia, 32(2):140-147.
- Verma, S., & Ahuja, M. (2020). Carboxymethyl modification of Cassia obtusifolia galactomannan and its evaluation as sustained release carrier.International Journal of Biological Macromolecules,164:3823-3834.
- Zhang, K. et al. (2012). Synthesis and release studies of microalgal oil-containing microcapsules prepared by complex coacervation. Colloids and Surfaces B: Biointerfaces, 89:61-66.
-
Editor de seção:
Renato Paiva


