 Ischemic and hemorrhagic cerebrovascular disease in Brazil: mortality trends and correlation with socioeconomic index over 20 years
Abstract
The article analyzes mortality trends due to cerebrovascular disease (CBVD) in Brazil. regions and federation units. from 2000 to 2019. and its correlation with the municipal human development index (MHDI) and social vulnerability index (SVI). It has an ecological design and describes-time series of deaths. The codes for DCBV. according to ICD-10. were divided into three groups: ischemic (CBVDI). hemorrhagic (CBVDH) and unspecified (CBVDU). The Southeast had the highest total number of deaths. In the stratified analysis.-general decreasing trend was observed in Brazil for CBVDH and CBVDU with an increase in the North and Northeast in CBVDI and CBVDH. For the MHDI. there was-strong positive correlation between AAPC (annual percentage change of the total period) and mortality trends rate for CBVDH from 40 years of age and for CBVDI in those over 80 years of age. There was no correlation between the AAPC of the SVI and mortality trends rate between the disease groups. It is concluded that the trend towards an increase in deaths from CBVDI and CBVDH in the North and Northeast is possibly related to economic and social inequality in these regions. The decrease in CBVDU seems to reflect an increase in CBVDI. which could mean an improvement in mortality registrations.
Keywords:
Ischemic Stroke; Hemorrhagic Stroke; Death Certificates; Development Indicators
Resumo
O estudo analisa a tendência da mortalidade por doença cerebrovascular (DCBV) no Brasil, regiões e unidades da federação, de 2000 a 2019, e a correlação com índice desenvolvimento humano municipal (IDHM) e índice de vulnerabilidade social (IVS). Tem delineamento ecológico e descreve uma série temporal de óbitos. Os códigos para causas por DCBV, segundo CID-10, foram divididos em três grupos: isquêmica (DCBVI), hemorrágica (DCBVH) e não especificada (DCBVNE). O Sudeste apresentou o maior número total de óbitos. A análise estratificada mostrou tendência geral de decréscimo na mortalidade por DCBVH e DCBVNE, no Brasil, com aumento no Norte e Nordeste para DCBVI e DCBVH. Para o IDHM houve correlação positiva forte entre a variação percentual anual do período total (AAPC) e a tendência da taxa de mortalidade para DCBVH, a partir de 40 anos, e para DCBVI em maiores de 80 anos. Não houve correlação entre AAPC do IVS e a tendência da taxa de mortalidade entre os grupos de causas. Conclui-se que a tendência ao aumento de óbitos por DCBVI e DCBVH no Norte e Nordeste, possivelmente, está relacionada a desigualdade econômica e social nestas regiões. O decréscimo da DCBVNE parece refletir no aumento da DCBVI, que pode significar melhoria dos registros no Sistema de Informação de Mortalidade.
Palavras-chave:
Acidente vascular cerebral; Mortalidade; Indicadores de Desenvolvimento
Resumen
El estudio analiza la tendencia de la mortalidad por enfermedad cerebrovascular (ECBV) en Brasil, regiones y unidades de la federación, de 2000 a 2019, y su correlación con el índice de desarrollo humano municipal (IDHM) y el índice de vulnerabilidad social (IVS). Tiene un diseño ecológico y describe una serie temporal de muertes. Los códigos de causas de ECBV, según la CIE-10, se dividieron en tres grupos: isquémico (ECBVI), hemorrágico (ECBVH) y no especificado (ECBVNE). El sureste tuvo el mayor número total de muertes. El análisis estratificado mostró una tendencia general de disminución de la mortalidad por ECBVH y ECBVNE en Brasil, con aumento en el Norte y Nordeste para ECBVI y ECBVH. Para el IDH, hubo una fuerte correlación positiva entre la variación porcentual anual (VPCA) del periodo total y la tendencia de la tasa de mortalidad para ECBVH, a partir de los 40 años de edad, y para ECBVI en mayores de 80 años. No hubo correlación entre la VPCA del IVS y las tendencias de la tasa de mortalidad entre los grupos de causas. Se concluye que la tendencia al aumento de muertes por ECBVI y ECBVH en el Norte y Nordeste posiblemente esté relacionada con la desigualdad económica y social en estas regiones. La disminución de la ECBVNE parece reflejarse en el aumento de la ECBVI, lo que puede significar mejores registros en el Sistema de Información de Mortalidad.
Palabras clave:
Accidente cerebrovascular; Mortalidad; Indicadores de desarrollo
Introduction
Cerebrovascular disease is the second leading cause of death worldwide. accounting for 10.2% of all deaths in 2016. with 4.9% of deaths being attributed to ischemic stroke (IS) and 5.2% to hemorrhagic stroke (HS)1.
In 2019. more than 6 million people died from stroke worldwide and it is estimated that this number could reach 10 million-year by 20602. In middle-income countries such as Brazil it is estimated that the percentage of deaths from stroke will decrease from 15.2%. in 2016. to 12.8% in 2060. while in low-income countries forecasts suggest an increase over the same period from 5.2% to 10.0%3.
The stroke case fatality rate is around 15% within 1 month. 25% within 1 year and 50% within 5 years. and approximately 40% of stroke survivors become disabled between 1 month and 5 years after stroke4. Case fatality rates for HS are around 55% within 1 year and 70% within 5 years5.
Prevalence of stroke in Brazil varies from study to study and across states. from 1.3% to 6.8%6-8. This wide variation has been explained by the continental proportions of the country. socioeconomic inequality9 and differences in data analysis methods between studies.
Death certificates registered in the country’s mortality information system (SIM. acronym in Portuguese) provide-considerable amount of information for analysis and disease surveillance. enabling monitoring of deaths by disease and the calculation of projections for Brazil’s health system10.
Most studies in the literature on stroke include all the codes of the Tenth Revision of the International Statistical Classification of Diseases and Related Health Problems (ICD-10) inherent to the disease. Strokes that may cause brain damage result in increased morbidity and are therefore more likely to be involved in the underlying cause of death. However. some studies fail to separate IS and HS. which both affect different age groups differently and have different risk factors. thus hampering the interpretation of results11.
The Human Development Index (HDI) was introduced in 1990. when the United Nations Development Programme (UNDP) launched the first Human Development Report. In 2012. UNDP Brasil. together with the Institute of Applied Economic Research (IPEA) and the João Pinheiro Foundation. adapted the HDI method to create the municipal HDI (MHDI). used to assess the country’s 5.565 municipalities. The MHDI was calculated using data from the last three demographic censuses conducted by the Brazilian Institute of Geography and Statistics (IBGE) - 1991. 2000 and 2010 - and based on the municipal grid in 201012. The Social Vulnerability Index (SVI) creates-synthetic indicator of the absence or insufficiency of essential resources needed to ensure well-being and quality of life. The method used resembles that of the MHDI. The data available from 2017 include the same indicators used between 2000 and 2010.
The calculation of indicators. dimensions and indices is based on crude data produced by the National Household Sample Survey (PNAD) between 2011 and 201513.
These two indicators enable the monitoring of human development and trends in social vulnerability at municipal level. providing important inputs to shape public policies and evaluate their effectiveness.
Studies investigating the association between socioeconomic indicators and risk of stroke among adults have produced conflicting results. with both positive and negative correlations13.14. In Brazil. these indicators show the same discrepancies at national level and across regions15.
The objective of this study was therefore to analyze trends in deaths from IS and HS in Brazil at national. regional and state level and their correlation with the MHDI and SVI during the period 2000-2019.
Method
a) Study design. population and period
We conducted an ecological time series study of deaths during the period 2000-2019 where the underlying cause was stroke.
b) Data collection and sources
We collected data on causes of death due to stroke based on the ICD-10 codes from individual databases in the SIM and on other conditions and factors recorded on death certificates. For the purposes of this study. we included strokes that may cause brain damage which. in principle. are detectable by neuroimaging. The ICD-10 codes for these diseases include unspecified causes such as hemorrhage or ischemia. The causes were therefore categorized into three groups: a) ischemic stroke (IS) - I63 (cerebral infarction). I67.3 (progressive vascular leukoencephalopathy). I67.8 (other specified cerebrovascular diseases - acute cerebrovascular insufficiency and cerebral ischemia) and I69.3 (sequelae of cerebral infarction); b) hemorrhagic stroke (HS) - I60 (subarachnoid hemorrhage). I61(intracranial hemorrhage). I62 (other nontraumatic intracranial hemorrhage). I69.0 (sequelae of subarachnoid hemorrhage). I69.1 (sequelae of intracranial hemorrhage) and I69.2 (sequelae of other nontraumatic intracranial hemorrhage); and c) unspecified hemorrhagic ischemic or hemorrhagic stroke (US) - I64 (stroke not specified as hemorrhagic or ischemic). I67.9 (unspecified stroke). I69.4 (sequelae of stroke not specified as hemorrhagic or ischemic) and I69.8 (sequelae of other cerebrovascular diseases and unspecified sequelae).
While the database of the national health system’s Department of Informatics (DATASUS) considers stroke to be codes I60-I69. the pathophysiology and etiology of some of these causes are very particular and. in other cases. detectable brain damage does not occur. For this reason. the following codes were excluded: I65 (occlusion and stenosis of precerebral arteries not resulting in cerebral infarction). I66 (occlusion and stenosis of cerebral arteries not resulting in cerebral infarction). I67.0 (dissection of cerebral arteries. nonruptured). I67.1 (cerebral aneurysm. nonruptured). I67.2 (cerebral atherosclerosis). I67.4 (hypertensive encephalopathy). I67.5 (moyamoya disease). I67.6 (nonpyogenic thrombosis of intracranial venous system without cerebral infarction). and I67.7 (cerebral arteritis. not elsewhere classified). Code I68 (cerebrovascular disorders in diseases classified elsewhere) was also excluded because it refers to diseases with defined etiology without necessary identifiable brain damage.
The study population consisted of adults divided into the following age groups: 20-39 years; 40-59 years; 60-79 years; 80 years and over; and overall (all age groups).
Two social and economic development indicators were selected for correlation: i) the MHDI. which measures the same key dimensions of human development as the HDI: life expectancy. education and income. The MHDI tailors the HDI methodology to the Brazilian context and the availability of national indicators. The closer to 1 the better the MHDI; ii) the SVI consists of three dimensions - urban infrastructure. human capital. and income and employment - representing three sets of assets that determine well-being in contemporary societies. In contrast to the MHDI. the closer to 1 the worse the indicator.
The HDI data were obtained from the 2010 Atlas of Human Development12 and the SVI data were taken from the 2010 Atlas of Social Vulnerability16. The MHDI and SVI were calculated for the census years (2000 and 2010) and based on crude PNAD data (2011-2015).
c) Statistical analysis
We calculated standardized annual crude rates of mortality per 100.000 population17 using the direct method. based on the overall population during the period 2000-2019. regardless of sex. The population data was extracted from the DATASUS website18. National and regional mortality rates were standardized by age group and sex for each group of causes. The analyses were performed using R.
Temporal trend analysis was performed using the joinpoint regression model to identify statistically significant points of inflection and annual percent change in mortality rates between 2000 and 2019. This method allows the researcher to detect trends (stationary. upward or downward) in each indicator. joinpoints. and annual percent change (APC) and average annual percent change (AAPC). The number of joinpoints was calculated using the permutation test with Bonferroni correction. adopting-95% confidence interval (95% CI) and 5% significance level. These analyses were conducted using Joinpoint Regression 4.5.0.1 (National Cancer Institute. USA)19.
We calculated AAPC for the socioeconomic indicators and respective dimensions over the study period in each state. The correlation between the AAPC of the mortality rates was assessed across the groups of causes of death from stroke and AAPC for the socioeconomic indicators and their respective dimensions by age group.
Results
There were 1.924.715 deaths from the underlying causes studied. distributed as follows: IS - 361.072 (19%); HS - 442.434 (22%); US - 1.121.209 (59%). The Southest accounted for the largest share of overall deaths (44.13%). followed by the Northeast (26.10%). South (18.83%). Midwest (5.76%) and North (5.18%) (Table 1).
Women accounted for 50.29% of deaths. The 60-79 age group accounted for the largest proportion of deaths (44.92%). followed by the 80 years and over group (35.59%). 40-59 age group (16.93%) and 20-39 group (2.56%). When the data were stratified by sex. the only age group in which the proportion of women was higher than the proportion of men was the 80 years and over group. Mortality was higher in the Southeast. South and Midwest (Table 1).
The results of the stratified analysis of deaths by group of causes and region over the whole study period (AAPC) revealed-general downward national trend in HS and US and-stationary trend for IS. However. when the data were stratified by period (APC). there was an increase in mortality from 2015. This increase was more pronounced in the two oldest age groups. An upward trend in IS was observed across all regions except the Northeast. US showed-significant upward trend in the North and Northeast from 2000 to 2007 in the 80 and over age group. while HS increased between 2000 and 2017 in the North and over the whole period in the Northeast in this age group (Table 2).
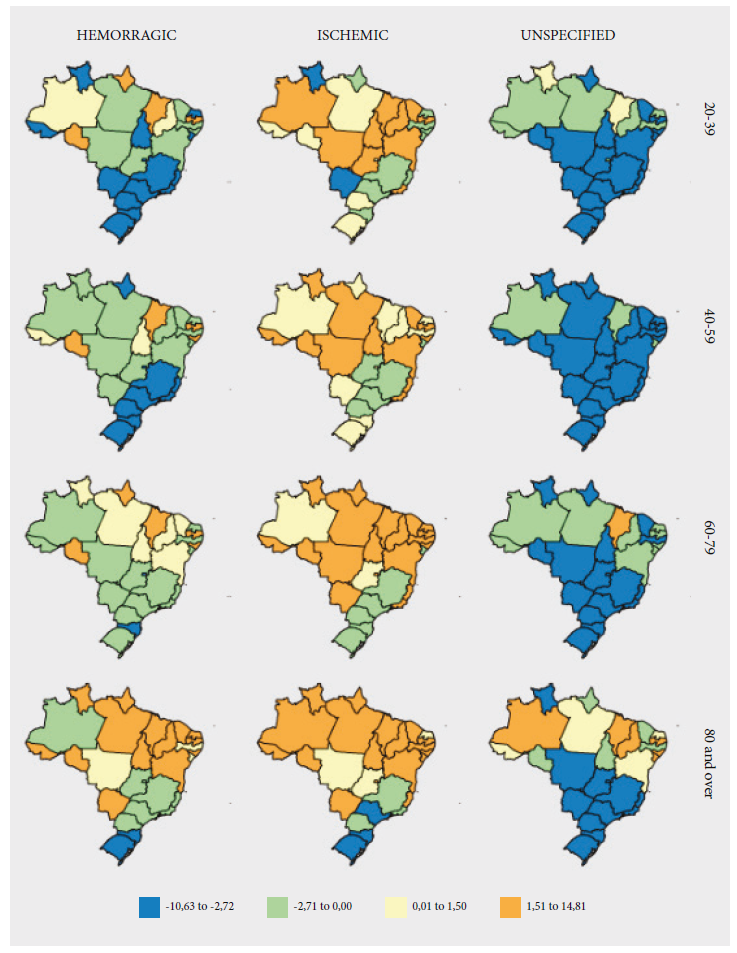
The largest reductions in IS and HS mortality were found in the below 60-year age group. In contrast. the oldest age group showed an increase in mortality rates in the North and Northeast.-stationary trend in the Midwest and downward trend in the South and Southeast. The US mortality rate showed-downward trend across all age groups in the Midwest. Southeast and South. In contrast. in the 80 and over age group there was-substantial increase in rates in the states of Amazonas. Maranhão. Piauí. Paraíba. Alagoas and Sergipe (Figure 1).

AAPC das rates de mortalidade padronizada por DCBV hemorrágica. isquêmica e não especificada. segundo faixa etária. nas UF. para o período de 2000-2019.
The results of the analysis of the socioeconomic development indicators showed that AAPC for MHDI represented an increase across all states. The largest increase occurred in the North and Northeast. The dimension with the largest AAPC was education. The state with the highest MHDI in 2019 was the Federal District (0.86) (Table 3).
AAPC for SVI represented-decrease across all regions. The largest negative AAPC was found in Rondônia (-4.59%). followed by Mato Grosso do Sul (-4.35%) and Santa Catarina (-3.99%). The lowest AAPC in 2019 were found in states in the Southeast. South and Midwest. The SVI dimension with the largest negative AAPC was urban infrastructure. with values of -12.25% in Amapá and -9.1% in Rondônia (Table 3).
The findings show-strong positive correlation between trends in MHDI over the study period (AAPC) and trends in HS mortality in the 40-59-year age group and above and trends in IS mortality in the 80 years and over age group. All the dimensions of the MHDI showed-similar positive correlation. except for income. which did not show any correlation with IS. US mortality showed-strong positive correlation with MHDI across all its dimensions (Table 4).
There was no correlation between trends in SVI (AAPC) and trends in mortality rates across all groups of disease and age groups. Infrastructure was the only SVI dimension to show-negative (moderately significant) correlation with HS and US mortality rates in the three oldest age groups. In contrast. income showed weak and moderately significant positive correlations with US and capital showed moderately significant positive correlations with HS and US in the 40-59 year age group and above (Table 4).
Discussion
In general. the findings show-stationary trend for IS and-reduction in HS mortality at national level over the study period. This is consistent with World Health Organization (WHO) projections3.
Brazil’s first stroke unit was created in Joinville. Santa Catarina in 1997. In 2008. the Ministry of Health issued Ministerial Order 665/2012 creating stroke referral services across the country20. Between 1998 and 2017. the country saw rapid expansion in the number of family health teams. Studies have shown an association between this expansion and reduced mortality from stroke21.
Despite the trends in IS and HS revealed by the present study. the number of deaths from stroke remain high across the country. with rates higher than those found in developed countries and some of the highest rates in Latin America22.23. According to the Global Burden of Disease study (GBD). the country with the highest mortality rate was Uruguay (102/100.000). followed by Brazil (60.47/100.000). Chile (57.95/100.000) and Argentina (57.78/100.000)24.
Our findings show that the only age group in which the proportion of deaths was higher among women than men was 80 years and over. De Souza et al. reported similar results in-study investigating stroke mortality between 1996 and 201525. These findings are also consistent with results found in North America and Europe26. Factors explaining higher mortality among women in this age group include increased susceptibility to systemic arterial hypertension (SAH) in postmenopausal women27 and atrial fibrillation. which is-risk factor that leads to-fourfold increase in the likelihood of IS in around 60% of women aged over 7528. The higher proportion of women in this age group can also be explained by the fact that women live longer than men29.
IS mortality rates were higher in older age groups while HS mortality was higher in the youngest age group. These findings are consistent with those reported by De Moraes et al.. who studied stroke mortality in young patients (10-49 years) in the South and Southeast of Brazil. finding that 76% of deaths were from HS30. Risk of death from stroke is substantially higher in the older population than in other age groups. This can be partially explained by accumulation of risk factors in this group. such as SAH. diabetes. alcoholism. smoking and unhealthy eating habits31.
IS and HS mortality was higher in the Southeast and South. although the findings show-significant downward trend in these regions. In contrast. the North and Northeast showed lower rates with-significant upward trend. The higher rates in more developed states may be explained by the greater influence of chronic conditions in the mortality profile in these more populous regions25. In contrast. stroke mortality may be lower in more socially vulnerable regions because of mortality from other poverty-related diseases. such as infectious and parasitic diseases32.
Higher AAPC for IS mortality rates in the North and Northeast is consistent with the findings of-study by Mansur and Guimarães. who analyzed cardiovascular mortality in Brazil also using SIM data. although over-different period33.34. According to the authors. these regions show lower consumption of fruit and vegetables and regular exercise rates. and higher rates of physical inactivity. self-reported poor health and SAH35. In addition. according to the 2019 National Health Survey. people living in the Northeast have poorer access to at least one blood pressure medication in popular pharmacies and-higher prevalence of stroke36. Furthermore. the regions in Brazil with the highest prevalence of obesity are the North. Northeast and Midwest37. The combination of these factors results in increased risk for stroke38 and may explain the results found for these regions by the present study.
Unlike the findings reported by Lotufo et al.. who found-50% reduction in the proportion of deaths due cerebrovascular disease below 70 years of age between 1990 and 201539. our results show that reductions in IS mortality were highest in the 80 years and over group. The opposite was the case for HS mortality rates. which only increased in the oldest age group among men. These findings are also inconsistent with the results of-study by Passos et al.40. who found-substantial progressive decline in stroke mortality across all age groups. This may be explained by method differences. especially the stroke cause inclusion criteria. Other studies included all ICD-10 codes for stroke11.41. while the present study included only strokes that may cause brain damage which. in principle. are detectable by neuroimaging (IS and HS).
During the period 2015-2019. there was-reduction in the pace of decline in four of the six targets proposed in 201142 and now monitored under the Strategic Action Plan to Combat Chronic Diseases and Non-Communicable Diseases in Brazil 2021-2030:-2% per year reduction in premature death (30-69 years) from noncommunicable diseases (NCDs); 30% decrease in smoking prevalence; stabilization of obesity among adults; and-10% rise in the recommended consumption of fruit and vegetables43. This may partially explain the increase in IS mortality across all regions from 2015 observed in the present study.
Our findings reveal-reduction in HS mortality at national level. which is consistent with the results of-study by Oliveira GMM et al.44 using data from the 2017 GBD. However. it is important to highlight that disadvantaged regions such as the Northeast and North showed-positive AAPC in the 80 years and over age group and that APC in the North between 2011 and 2017 reached + 9.0.
The downward national trend in US mortality may be explained by improvements in the completion of death certificates45; however. US still account for most deaths from stroke recorded on death certificates in the SIM databases. This downward trend was less pronounced in the North and Northeast in the three youngest age groups. and an upward trend was observed in the 80 year and over group. Garritano et al. also found-higher proportion of deaths from US when compared with deaths from IS and HS. with rates of over 15% in older adults in the North11. while Jorge et al. found rates over 20% in the North and Northeast46. Key problems in these regions include poor access to health care related to their huge geographic area and cultural factors influencing behavior of local communities47. The quality of SIM data is also poorer in these regions48.
Deaths from US remain-challenge for estimating stroke mortality. Rolim and Martins investigated the use of cranial computed tomography (CT scan) in patients admitted to hospital with suspected stroke using data from the country’s hospital information system. The authors reported that the scan was not performed in 73% of cases. despite half of the admissions being to hospitals with-scanning machine. Paradoxically. not performing the scan was not the main factor used for classifying the condition as US. rather TC scans were more common in the group classified as not specified49.
Based on the literature. it is likely that the leading cause of death from stroke nationally and across regions is IS. due to the higher prevalence of this type50. The downward trend in US. slight increase in HS and substantial increase in IS mortality found by this study in the North and Northeast corroborate this hypothesis. As mentioned above. improvement in the quality of SIM data in these regions may have contributed to the downward trend in deaths from US. with-consequent rise in IS mortality.
The positive correlations found between all dimensions of the MHDI and the three groups of causes studied may be explained by the fact that in 2000 the largest variations in the index occurred in areas where it was lowest. These improvements were therefore not sufficient to cause-positive impact on mortality when the causes of stroke are analyzed alone. Positive correlations have been observed in medium-to-high-income countries but not in high-income countries. where HDIs have been higher for longer and access to specialized care services is better51.
The positive correlations between HS and US and income and employment and human capital suggest that mortality increases with increasing social vulnerability. These dimensions are linked mainly to education. employment and income. which are factors associated with stroke52. In contrast. there was-negative correlation between HS and US and infrastructure. The infrastructure dimension reflects access to basic sanitation services and urban mobility. which is linked to place of residence and has-significant impact on well-being and access to health services. These findings may reflect poor utilization of services due to lack of information about available services.
The main limitation of this study is the quality data in the SIM databases. However. only 198 deaths from stroke in our sample had missing information. corresponding to-less than 1% loss. This is-reflection of the efforts made by the Ministry of Health through partnerships with state and municipal governments to improve data quality. such as the Regional Inequalities Reduction Project. Infant Mortality Reduction Project in the Northeast and Legal Amazon and Ill-Defined Cause Reduction Project in 200553. This study is the first of its kind in Brazil to consider only ICD-10 codes for stroke with brain damage that is detectable by neuroimaging. thus exclusively encompassing IS and HS and excluding codes that represent risk factors that do not necessarily cause brain damage. This fact and the methods used to analyze the variables. particularly joinpoint regression. may explain the differences between our results and those of other studies on death from stroke.
Conclusions
Although in general stroke mortality in Brazil showed-downward trend during the period 2000-2019. the results of the analysis by groups of causes. regions and age group reveal distinct realities in-country with continental proportions and deep inequalities. In disadvantaged regions (the North and Northeast). the findings show an upward trend in IS and HS mortality. with increases being more pronounced in individuals aged over 60. Progressive increases in the MHDI and decreases in the SVI across the country have yet to have an impact on mortality rates. especially in disadvantaged regions. In contrast to the stabilization of IS mortality. the downward trend in US appears to reflect improvements in SIM data quality.
References
- 1 World Health Organization (WHO). Global Health Estimates 2016: Deaths by Cause, Age, Sex, by Country and by Region, 2000-2016. Geneva, World Health Organization, 2018.[Internet]. Available from: em: https://www.who.int/healthinfo/global_burden_disease/en/
-
2 World Health Organization (WHO). Death, The top10 causes of. World Health Organization (WHO). 2017. [Internet]. [cited 2021 Mar. 08]. Available from: http://www.who.int/mediacentre/factsheets/fs310/ en/
» http://www.who.int/mediacentre/factsheets/fs310/ en -
3 World Health Organization (WHO). World Health Organization (2018). Projections of mortality and causes of death, 2017-2060. [Internet]. 2018. Available from: http://www.who.int/healthinfo/global_burden_ disease/projections/en/.
» http://www.who.int/healthinfo/global_burden_ disease/projections/en - 4 Luengo-Fernandez R, Paul NLM, Gray AM, Pendlebury ST, Bull LM, Welch SJV, Cuthbertson FC, Rothwell PM. Population-based study of disability and institutionalization after transient ischemic attack and stroke: 10-year results of the oxford vascular study. Stroke 2013; 44(10):2854-2861.
- 5 Poon MTC, Fonville AF, Salman RAS. Long-term prognosis after intracerebral haemorrhage: Systematic review and meta-analysis. J Neurol Neurosurg Psychiatry 2014; 85(6):660-667.
-
6 de Carvalho JJF, Alves MB, Viana GÁA, Machado CB, dos Santos BFC, Kanamura AH, Lottenberg CL, Neto MC, Silva GS. Stroke epidemiology, patterns of management, and outcomes in Fortaleza, Brazil: A hospital-based multicenter prospective study. Stroke PubMed. [Internet]. 2011 [cited 2021 April 17]; 42(12):3341-3346. Available from: https://pubmed.ncbi.nlm.nih.gov/22052521/
» https://pubmed.ncbi.nlm.nih.gov/22052521 - 7 Cabral NL, Gonçalves ARR, Longo AL, Moro CHC, Costa G, Amaral CH, Fonseca LAM, Eluf-Neto J. Incidence of stroke subtypes, prognosis and prevalence of risk factors in Joinville, Brazil: A 2 year community based study. J Neurol Neurosurg Psychiatry 2009; 80(7):755-761.
-
8 Schmidt MI, Duncan BB, Mill JG, Lotufo PA, Chor D, Barreto SM, Aquino EML, Passos VMA, Matos SMA, Molina MCB, Carvalho MS, Bensenor IM. Cohort profile: Longitudinal study of adult health (ELSA-Brasil). Int J Epidemiol [Internet]. 2015 [cited 2021 Apr .17 de 2021];44(1):68-75. Available from: https://pubmed.ncbi.nlm.nih.gov/24585730/
» https://pubmed.ncbi.nlm.nih.gov/24585730 - 9 Paim J, Travassos C, Almeida C, Bahia L, MacInko J. The Brazilian health system: History, advances, and challenges. The Lancet 2011; 377(9779):1778-1797.
- 10 Lucena L, Cagliari GHB, Tanaka J, Bonamigo EL. Declaração de óbito: preenchimento pelo corpo clínico de um hospital universitário. Revista Bioética 2014; 22(2):318-324.
- 11 Garritano CR, Luz PM, Pires MLE, Barbosa MTS, Batista KM. Análise da tendência da mortalidade por acidente vascular cerebral no Brasil no século XXI. Arq Bras Cardiol 2012; 98(6):519-527.
- 12 Programa das Nações Unidas para o Desenvolvimento (PNUD), Instituto de Pesquisa Aplicada(Ipea), Fundação João Pinheiro FJP. Atlas do desenvolvimento humano nas regiões Metropolitanas brasileiras. Rio de Janeiro: PNDU, IPEA, FJP; 2014.
- 13 Godoi BB, Galvão EL, Santos DF. Mortalidade por Acidente Vascular Cerebral no Vale do Jequitinhonha e correlação com o Índice de Desenvolvimento Humano: um estudo ecológico entre 1996 e 2016. Rev Saude Col. UEFS 2020; 10(1):23-30.
- 14 Steenland K, Hu S, Walker J. All-cause and cause-specific mortality by socioeconomic status among employed persons in 27 US states, 1984-1997. Am J Public Health 2004; 94(6):1037-1042.
-
15 Vincens N, Stafström M. Income inequality, economic growth and stroke mortality in Brazil: Longitudinal and regional analysis 2002-2009 [Internet]. 2015 [cited 2022 Sept 22]. e0137332. Available from: https:// journals.plos.org/plosone/article?id=10.1371/journal. pone.0137332
» https:// journals.plos.org/plosone/article?id=10.1371/journal. pone.0137332 -
16 Marguti BO, Rocha BN, Pinto CVS, Costa MA, Curi RLC. Métodos e Conceitos para o cálculo do índice de vulnerabilidade social com base nas PNADs e desagregações. [Internet]. 2018. Disponível em: https:// repositorio.ipea.gov.br/bitstream/11058/9451/1/Métodos_e_conceitos para o cálculo do Índice de Vulnerabilidade Social.pdf
» https:// repositorio.ipea.gov.br/bitstream/11058/9451/1/Métodos_e_conceitos para o cálculo do Índice de Vulnerabilidade Social.pdf - 17 Organização Pan-Americana da Saúde(OPAS). Indicadores Básicos Para a Saúde No Brasil: Conceitos e Aplicações. Brasília: OPAS; 2008.
- 18 Instituto Brasileiro da Geografia e Estatóstica (IBGE). População residente-estudo de estimativas populacionais para os municípios, desagregadas por sexo e idade, 2000-2020. Brasília; 2018.
- 19 Kim HJ, Fay MP, Feuer EJ, Midthune DN. Permutation tests for joinpoint regression with applications to cancer rates. Stat Med 2000; 19(3):335-351.
- 20 Feigin VL, Krishnamurthi RV, Theadom AM, Abajobir AA, Mishra SR, Ahmed MB, Aichour AN, I Aichour I, Aichour MTE, Alabed S, R Al-Raddadi R, Alvis-Guzman N, Amare AT, H Ansari H el at. Global, regional, and national burden of neurological disorders during 1990-2015: a systematic analysis for the Global Burden of Disease Study 2015. Lancet Neurol 2017; 16(11):877-897.
- 21 Malta DC, Morais Neto OL, Silva Junior JB. Apresentação do plano de ações estratégicas para o enfrentamento das doenças crônicas não transmissíveis no Brasil, 2011 a 2022. Epidemiol Serv Saude 2011; 20(4):425-438.
- 22 Lavados PM, Hennis AJ, Fernandes JG, Medina MT, Legetic B, Hoppe A, Sacks C, Jadue L, Salinas R. Stroke epidemiology, prevention, and management strategies at a regional level: Latin America and the Caribbean. Lancet Neurology 2007; 6(4):362-372.
- 23 Organização Pan-Americana de Saúde (OPAS/OMS). Saúde Américas. Resumo do panorama regional e perfil do Brasil. Edição de. Washington, D.C.: OPAS; 2017.
- 24 Ouriques Martins SC, Sacks C, Hacke W, Brainin M, de Assis Figueiredo F, Marques Pontes-Neto O, Germain PML, Marinho MF, Wiegering AH, McGhie DV, et al. Priorities to reduce the burden of stroke in Latin American countries. Lancet Neurol 2019; 18(7): 674-683.
- 25 De Souza CDF, De Oliveira DJ, Da Silva LF, Dos Santos CD, Pereira MC, Silva De Paiva JP, Leal TC, Mariano RS, de Araújo AKBF, Baggio JAO. Cerebrovascular disease mortality trend in Brazil (1996 to 2015) and association with human development index and social vulnerability. Arq Bras Cardiol 2021; 116(1):89-99.
- 26 Virani SS, Alonso A, Benjamin EJ, Bittencourt MS, Callaway CW, Carson AP, Chamberlain AM, Chang AR, Cheng S, Delling FN, Djousse L, et al. Heart disease and stroke statistics 2020 update: A report from the American Heart Association. Circulation 2020. 139-596 p.
- 27 Bushnell C, McCullough LD, Awad IA, Chireau MV, Fedder WN, Furie KL, Howard VJ, Lichtman JH, Lisabeth LD, Piña IL, Reeves MJ, Rexrode KM, et al. Guidelines for the prevention of stroke in women: A statement for healthcare professionals from the American heart association/American stroke association. Stroke 2014; 45(5):1545-88.
-
28 Fuster V, Rydén LE, Cannom DS, Crijns HJ, Curtis AB, Ellenbogen KA, Halperin JL, Heuzey JYL, Kay GN, JE Lowe JE, Olsson SB, Prystowsky EN, Tamargo JL et al. ACC/AHA/ESC 2006 Guidelines for the Management of Patients With Atrial Fibrillation. Circulation [Internet]. 2006; 14(7):257-354. [cited 2022 Oct. 4] Available from: www.escardio.org
» www.escardio.org - 29 Bushnell C, McCullough LD, Awad IA, Chireau M V., Fedder WN, Furie KL, VJ Howard, JH Lichtman, LD Lisabeth, IL Piña, MJ Reeves, KM Rexrode, G Saposnik, V Singh, A Towfighi, V Vaccarino, MR Walters. Guidelines for the prevention of stroke in women: A statement for healthcare professionals from the American heart association/American stroke association. Stroke 2014; 45(5):1545-88.
- 30 de Moraes Bernal H, de Abreu LC, Bezerra IMP, Adami F, Takasu JM, Suh JVJY, SL Ribeiro, EFS Santos. Incidence of hospitalization and mortality due to stroke in young adults, residents of developed regions in Brazil, 2008-2018. PLoS One [Internet]. 2020 [cited 2022 Oct. 4]; 15. Disponível em: https://pubmed.ncbi. nlm.nih.gov/33196650/
- 31 Pires SL, Gagliardi RJ, Gorzoni ML. Estudo das frequências dos principais fatores de risco para acidente vascular cerebral isquêmico em idosos. Arq Neuropsiquiatr 2004; 62(3b):844-51.
- 32 Araújo JD de. Polarização epidemiológica no Brasil. Epidemiologia e Serviços de Saúde 2012; 21(4): 533538.
- 33 Mansur A de P, Favarato D. Mortality due to cardiovascular diseases in women and men in the five Brazilian regions, 1980-2012. Arq Bras Cardiol 2016; 107(2):137-146.
- 34 Guimarães RM, de Araújo Andrade SSC, Machado EL, Bahia CA, de Oliveira MM, Jacques FVL. Regional differences in cardiovascular mortality transition in Brazil, 1980 to 2012. Rev Panam Salud Publica 2015; 37(2):83-89.
- 35 Brasil. Ministério da Saúde (MS). Secretaria de Vigilância em Saúde Departamento de Análise em Saúde e Vigilância de doenças e agravos não transmissíveis. In: Brasil. Ministério da Saúde (MS). Vigitel Brasil 2017. Vigilância de fatores de risco e proteção para doenças crônicas por inquérito telefônico. 1.ed. Brasília; 2018. p.1-128 p.
- 36 Instituto Brasileiro de Geografia e Estatística (IBGE). Pesquisa Nacional de Saúde. Percepção do estado de saúde, estilos de vida, doenças crônicas e saúde bucal. Rio de Janeiro: IBGE; 2019.
- 37 Malveira A da S, Santos RD dos, Mesquita JL da S, Rodrigues EL, Guedine CR de C. Prevalência de obesidade nas regiões Brasileiras / Prevalence of obesity in Brazilian regions. Brazilian Journal of Health Review 2021; 4(2):4164-73.
- 38 Caprio FZ, Sorond FA. Cerebrovascular Disease: Primary and Secondary Stroke Prevention. Medical Clinics of North America. W.B. Saunders 2019; 103:295-308.
- 39 Lotufo PA, Goulart AC, de Azeredo Passos VM, Satake FM, Souza MDFM, França EB, Ribeiro ALP, Bensenõr IJM. Cerebrovascular disease in Brazil from 1990 to 2015: Global Burden of Disease 2015. Rev Bras Epidemiol 2017; 20(Supl. 1):129-1941.
- 40 Passos VMA, Ishitani LH, Franco GC, Lana GC, Abreu DMX, de Fatima Marinho M, França EB. Consistent declining trends in stroke mortality in Brazil: Mission accomplished? Arq Neuropsiquiatr 2016; 74(5):376-381.
- 41 Villela PB, Klein CH, de Oliveira GMM. Trends in mortality from cerebrovascular and hypertensive diseases in Brazil between 1980 and 2012. Arq Bras Cardiol 2016; 107(1):26-32.
-
42 Brasil. Ministério da Saúde (MS). Plano de ações estratégicas para o enfrentamento das doenças crônicas não transmissíveis (DCNT) no Brasil 2011-2022. Ministério da Saúde. Secretaria de Vigilância em Saúde. Departamento de Análise de Situação de Saúde. Brasília: Ministério da Saúde 2011, organizador. Distrito Federal. [internet]. 2011 [acessado 2022 out. 20]. 160p. Disponível em: https://bvsms.saude.gov.br/bvs/publicacoes/plano_acoes_enfrent_dcnt_2011.pdf
» https://bvsms.saude.gov.br/bvs/publicacoes/plano_acoes_enfrent_dcnt_2011.pdf - 43 Brasil. Ministério da Saúde (MS). Plano de ações e estratégia para o enfrentamento das doenças crônicas e agravos, 2021-2030. Ministério da Saúde, Secretaria de Vigilância em Saúde, Departamento de Análise em Saúde e Vigilância de Doenças Não Transmissíveis. - Brasília: MS; 2021. Vol.
- 44 Oliveira GMM de, Brant LCC, Polanczyk CA, Biolo A, Nascimento BR, Malta DC, Souza MFM, Soares GP, Xavier Junior GF, Machline-Carrion MJ, Bittencourt MS, Pontes-neto OM, Silvestre OM, Teixeira RA, Sampaio RO, Gaziano TA, Roth GA, Ribeiro ALP. Estatística Cardiovascular - Brasil 2020. Arq Bras Cardiol 2020; 115(3):308-439.
- 45 Mello Jorge MHP, Laurenti R, Gotlieb SLD. Análise da qualidade das estatísticas vitais brasileiras: a experiência de implantação do SIM e do SINASC Cien Saude Colet 2007; 12(3):643-54.
-
46 Mello Jorge MHP, Laurenti R, Lima-Costa MF, Gotlieb SLD, Chiavegatto Filho ADP. A mortalidade de idosos no Brasil: a questão das causas mal defenidas TT - Brazilian Mortality of Elderly Person: The Question About ill-defined Uniderlying causes of Death. Epidemiol serv saude [Internet]. 2008 [acessado 2023 Fev. 19]; 17(4):271-281. Disponível em: http://scielo.iec.pa.gov.br/scielo.php
» http://scielo.iec.pa.gov.br/scielo.php - 47 Ando NM, Targa LV, Almeida A, Souza Silva DH, Barros EF de, Schwalm FD, Savassi LC, Breunig M, Lima MC., Filho RA., Horta TC. Declaração de Brasília "O Conceito de rural e o cuidado à saúde". Revista Brasileira de Medicina de Família e Comunidade 2011; 6(19):142-144.
- 48 de Almeida W da S, Szwarcwald CL. Adequação das informações de mortalidade e correção dos óbitos in formados a partir da Pesquisa de Busca Ativa. Ciên Saúde Colet 2017; 22(10):3193-203.
- 49 Rolim CLRC, Martins M. O uso de tomografia com putadorizada nas internações por Acidente Vascular Cerebral no Sistema Único de Saúde no Brasil. Revista Brasileira de Epidemiologia 2012; 15(1):179-187.
- 50 Mamed SN, Ramos AMDO, De Araújo VEM, De Jesus WS, Ishitani LH, França EB. Profile of deaths from unspecified stroke after investigation of garbage codes in 60 cities in Brazil, 2017. Rev Bras Epidemiol 2019; 22(Suppl. 3): e190013.
-
51 Wu SH, Woo J, Zhang XH. Worldwide socioeconomic status and stroke mortality: An ecological study. Int J Equity Health [Internet]. 2013; 12(1):1. [cited 2023 Fev. 19]; Available from: http://www.equityhealthj.com/content/12/1/42
» http://www.equityhealthj.com/content/12/1/42 - 52 Pan Y, Chen R, Li Z, Li H, Zhao X, Liu L, Wang C, Wang Y, Wang Y. Socioeconomic status and the quality of acute stroke care: The China national stroke registry. Stroke 2016; 47(11):2836-2842.
- 53 Brasil. Ministério da Saúde (MS). Saúde Brasil 2015/2016: uma análise da situação de saúde e da epidemia pelo vírus Zika e por outras doenças transmitidas pelo Aedes aegypti. Brasília: MS; 2017.