
 Banking competition in a context of regulatory transformation: a multi-product stochastic frontier approach
Abstract
This study revisits the issue of competition in the Brazilian banking industry, which has been impacted by the Central Bank of Brazil’s Agenda BC# initiatives since 2016. We apply stochastic frontier models to estimate the markup and Lerner index of financial institutions (FIs) using a novel multi-product approach. The outputs of FIs were grouped into four categories: (i) loans; (ii) other types of financial intermediation; (iii) service provision; and (iv) income from equity holdings. Overall, our results indicate a decline in the markup for loans. However, contrary to expectations, the average markup of credit unions was significantly higher than that of commercial banks. Despite the decline in credit markups, there was no corresponding reduction in the overall market power of FIs, which led to increased revenues from other outputs. Notably, we observe a rise in the market power of state-owned banks and a convergence toward a higher level of market power by the end of the period. Our findings also reveal the presence of cross-subsidization among banking products and suggest that market power may be underestimated when inefficiencies are present.
Keywords:
Banks; Competition; Credit market; Market power; Agenda BC#
Resumo
Este trabalho teve como objetivo revisitar o problema da competição na indústria bancária brasileira, impactada pelas iniciativas da Agenda BC# do Banco Central do Brasil, a partir de 2016. Utilizamos modelos de fronteira estocástica para estimar o markup e o índice de Lerner das instituições financeiras (IFs) de uma maneira inédita, empregando uma abordagem multiprodutos. Os produtos das IFs foram divididos em quatro grupos: i) operações de crédito; ii) outros tipos de intermediação financeira; iii) prestação de serviços; e iv) resultado de participações societárias. De maneira geral, nossos resultados indicam que houve redução do markup nas operações de crédito, entretanto, ao contrário do esperado, o markup médio das cooperativas foi significativamente maior do que o dos bancos comerciais. A queda do markup, entretanto, não refletiu na redução do poder de mercado das IFs que aumentaram suas receitas originadas dos demais produtos. Em especial, verificou-se um aumento de poder de mercado dos bancos públicos e a convergência para um nível mais elevado de poder de mercado ao final do período. Nossos resultados também revelam a prática de subsídios cruzados entre os produtos bancários e que o poder de mercado das IFs pode ser subestimado na presença de ineficiências.
Palavras-chave:
Bancos; Competição; Mercado de crédito; Poder de mercado; Agenda BC#
1. Introduction
Since 2016, the Central Bank of Brazil (BCB) has been implementing Agenda BC#, a comprehensive set of initiatives aimed at modernizing the National Financial System (SFN) and fostering competition. Its pillars - inclusion, competitiveness, transparency, and institutional excellence - materialized in measures such as the regulation of fintechs, the introduction of Open Finance, and the creation of Pix1. These actions significantly reshaped market organization by reducing transaction costs, expanding access, and facilitating the entry of new participants.
The transformations resulting from Agenda BC# stimulated the entry and expansion of new participants, such as fintechs and digital banks, which began to operate in segments traditionally dominated by incumbent institutions.
These new agents increased market contestability by introducing business models less dependent on physical infrastructure, with lower operating costs and a greater capacity to target specific consumer niches.
The implementation of Open Finance intensified this process by reducing information asymmetries and enabling the portability of data across institutions, thereby increasing customer mobility. In parallel, reforms in the collateral environment and the receivables market modernized financial infrastructure and increased competition in areas that had previously been less contestable. These developments reinforced the competitive reorganization of the banking industry.
Despite these transformations, the Brazilian banking system remains highly concentrated and continues to exhibit some of the highest interest rate spreads in the world. This situation is not new: it is a characteristic historically documented in the literature, which has motivated an extensive research agenda on banking concentration and competition in the country. (Nakane 2002; Belaisch 2003; Araújo and Jorge Neto 2007; Lucinda 2010; Coelho et al. 2013; Silva 2014; Barbosa et al. 2015; Tabak et al. 2015; Cardoso et al. 2016; Feld et al. 2021; Garcia and Gonzaga 2024).
These authors consistently document that the sector combines high concentration with monopolistic competition, with banks exercising market power and remaining relatively unaffected by competitive pressures, especially those originating from state-owned banks and credit unions. However, most of these studies do not incorporate the more recent period characterized by digitalization, fintech entry, and the regulatory advances of Agenda BC#.
In this context, the objective of this study is to revisit the issue of competition in the Brazilian banking sector in light of the structural and regulatory transformations that have occurred since the mid-2010s. Rather than evaluating an isolated measure, we seek to examine the evolution of competitive dynamics over a period marked by profound institutional changes, contributing to a literature that has yet to fully incorporate these recent developments. To this end, we employ a more recent approach to measuring market power based on stochastic frontier analysis (SFA) models, adapted by Kumbhakar et al. (2012). SFA models are more flexible and circumvent several limitations found in the literature.
In general, the existing literature relies on three classes of models: Bresnahan (1982), Panzar and Rosse (1987), and Boone (2008). Although widely used, these models face important limitations in empirical applications. Among these limitations are the assumptions of a single product, long-run competitive equilibrium, and the absence of inefficiency. These restrictions are critical because, as highlighted by Silva (2014) and Barbosa et al. (2015), banks have a multi-product nature, and competition behaves differently across these products. A further limitation is that Brazilian banks are known to be inefficient (Belaisch, 2003; Tecles and Tabak, 2010; Tabak et al., 2011b), which negatively affects market power estimates. Finally, in most cases, banks are treated as independent institutions, and coordinated behavior carried out through economic groups is disregarded (Cardoso et al. 2016).
In response to these limitations, we adopt the model proposed by Das and Kumbhakar (2016), which is a variation of the original model by Kumbhakar et al. (2012), designed to accommodate the existence of a multi-product structure and allow explicit incorporation of technical inefficiency. This model enables the measurement of markups and the Lerner index with greater precision and consistency with the operational characteristics of Brazilian financial institutions. The main innovation of this article lies in the disaggregation of four banking products: (i) loans; (ii) other types of financial intermediation; (iii) service provision; and (iv) income from equity holdings. This level of disaggregation is unprecedented in the Brazilian context; the separation of loans from other products becomes relevant because most new entrants, although not classified as banks, operate in the loans market.
To capture recent changes in the SFN’s market structure, we also use a sample significantly larger than those used in existing studies. Our sample includes 1,145 financial institutions of all types (commercial banks with and without a credit portfolio, development banks, credit unions, non-bank credit institutions, capital market institutions, and payment institutions), which together account for more than 99% of both the credit portfolio and the total assets of the SFN. We further adopt the concept of financial conglomerates to capture coordinated activity among institutions belonging to the same economic group.
Overall, our results indicate a reduction in markups on loans in the period following the implementation of Agenda BC#. We also find that specialized banks, i.e., those operating exclusively in granting credit, have higher markups, on average, than banks operating in all four product segments. A surprising result is that credit unions have higher markups than commercial banks, contrary to prior expectations. On the other hand, we do not observe a reduction in banks’ market power. While private banks maintained the same level of the Lerner index over time, state-owned banks increased.
This article is organized into five sections, including this introduction. The next section provides a description of the SFN, recent regulatory transformations, and a review of the related empirical literature. The empirical model and database are presented in Section 3, while Section 4 discusses the results. Finally, Section 5 presents the concluding remarks.
2. Literature Review
2.1. National Financial System
The National Financial System (SFN) is organized around financial institutions (FIs) that perform functions of financial intermediation, service provision, and resource management, and that also hold equity stakes in a variety of other enterprises. The institutional structure is composed of commercial banks, multiple banks, unions, finance companies, payment institutions, and other entities authorized to operate by the BCB. Although heterogeneous in size, scope, and legal nature, these FIs operate under a common set of prudential and competition-related rules that shape the competitive environment of the sector.
A central element of the organization of the SFN is its operation within financial and prudential conglomerates. The vast majority of relevant FIs are part of economic groups that consolidate banking, credit, investment, insurance, leasing, and other service activities. This multi-product structure generates economies of scope, capital, and technology sharing, and encourages coordinated offering strategies - factors directly influencing competitive behavior and the measurement of market power. For regulatory purposes, the BCB publishes data for both individual FIs and conglomerates, with the latter being the most appropriate unit for competition analyses.
The regulatory classification of FIs authorized by the BCB distinguishes eight main types, as shown in Table 1, grouping institutions by size, type of operation, and the nature of their portfolios. This classification is useful for understanding the dispersion of banking activity and the role of each group in the credit market, although the degree of substitutability among products varies substantially across categories.
The structure of the SFN remains concentrated but has undergone relevant changes over the past decade. Commercial banks (b1) still hold the majority share of assets and loan portfolio (81% and 82%, respectively), but their relative dominance has been decreasing with the expansion of credit unions and the emergence of new digital competitors. The growth of credit unions has been particularly significant, both in number of members and in participation in credit portfolios, increasing the diversity of the market structure2. Additionally, the expansion of digital banks and fintechs, stimulated by regulatory improvements and modernization of payment systems, introduced greater contestability, especially in the personal credit, credit card, and payment services markets3.
Another relevant structural aspect is the reorganization of FIs’ physical networks. A reduction in branches and service points has been observed in recent years. Except for Caixa Econômica Federal4, the five largest banks reduced the number of physical facilities. The closing of service points reflects the digitalization of financial services and the migration of consumers to mobile and internet banking channels. Although this transformation does not eliminate competitive asymmetries, it significantly alters supply strategies and marginal service costs, affecting both pricing structures and the expansion potential of new entrants.
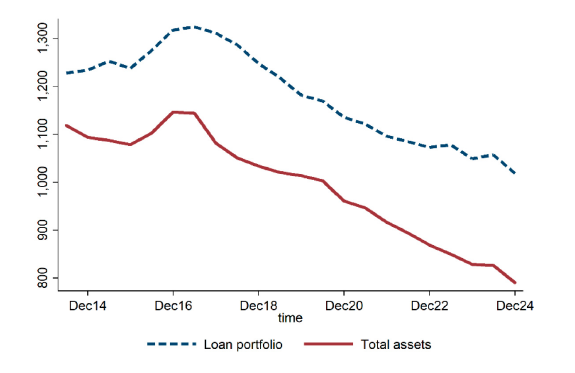
Beyond the reduction in service points, the total number of FIs in the SFN decreased from 1,592 in 2014 to 1,425 in 2024. Despite this reduction, market concentration did not increase. On the contrary, there has been a continuous decline in concentration indices for both loan portfolio and total assets (Figure 1). The decline became more pronounced from December 2017 onward and is related to the entry of fintechs and the implementation of Open Finance.

The entry of fintechs has increased market contestability by introducing new digital business models that are less dependent on physical infrastructure and have reduced operating costs, intensifying competitive pressure on traditional banks. Meanwhile, Open Finance, by enabling the portability of financial data between financial institutions, has reduced barriers to customer mobility and weakened the ability of incumbents to retain users through information asymmetries.
Two other important measures to increase competition in the sector were the introduction of Pix and the creation of the Instant Payments System (IPS) in 2020. The IPS standardized the payment settlement infrastructure, allowing FIs of different sizes, including fintechs and credit unions, to operate under conditions symmetric to those of large banks, thus reducing entry barriers. Pix, in turn, introduced a universal payment instrument, free for individuals and of low cost for firms. The combination of zero cost, speed, and continuous availability increased financial inclusion and market contestability by reducing the customer-retention power of large banks. Together, Pix and IPS helped democratize access to payment systems and strengthened the regulatory strategy of promoting competition in the SFN.
In summary, the current SFN combines three central characteristics for studying banking competition: (i) a concentrated structure still dominated by large conglomerates; (ii) a growing presence of alternative institutions, especially credit unions and digital entities; and (iii) strong product diversification, with integrated operations involving granting credit, services, and financial intermediation. This configuration reinforces the importance of methodologies capable of handling multi-product FIs and incorporating heterogeneity among regulatory groups to assess market power in the post-Agenda BC# environment.
2.2. Literature Review
The literature on Brazilian banking competition shows that the sector operates under monopolistic competition, marked by high concentration and the presence of market power, even in contexts of new entrants. Nakane (2002) was a landmark empirical study and found evidence that the banking industry is highly competitive. Conversely, Belaisch (2003) found evidence of a non-competitive market structure. The author highlighted those banks in Brazil were highly profitable yet less efficient than banks in the United States, Japan, and the Euro area, and that this structure could explain the low volume of credit and high spreads. Similarly, Lucinda (2010), Silva (2014), and Barbosa et al. (2015) also found evidence of imperfect competition.
Using a different approach, Coelho et al. (2013) investigated whether state-owned banks in Brazil exert competitive pressure on private banks in local markets and found that competition increased substantially only with the entry of another private bank, whereas the presence of a public bank did not significantly affect private banks’ profitability. In line with this, Garcia and Gonzaga (2024) evaluated the role of credit unions and found, contrary to expectations, that the presence of credit unions positively affects the profitability of commercial banks, indicating complementarity or market segmentation (credit unions serving specific niches, thereby freeing banks to focus on more profitable operations).
Another strand of literature focuses on the relationship between concentration, market power, and risk. Araújo and Jorge Neto (2007) found evidence that greater competition increases risk exposure; on the other hand, Tabak et al. (2012) found that this relationship is non-linear. According to the authors, banks facing high and low competition are more risk-averse than banks facing intermediate competition. These results are corroborated by Tabak et al. (2015), who demonstrate that banks with increasing market power expose themselves less to risk than banks with declining market power. Another interesting result is found in Tabak et al. (2011a), who show that Brazilian banks’ loan portfolios are more concentrated than those in developed countries. According to the authors, exposure to fewer sectors increases banks’ expertise and leads to more efficient monitoring, which avoids competition with other banks and allows for higher margins and profits.
Despite methodological diversity, previous studies share structural limitations. In general, they assume a single product, do not consider the existence of technical inefficiency, do not incorporate conglomerates, and use periods preceding the entry of fintechs, the modernization of the payments market, and the implementation of Open Finance. Regarding the multi-product nature of banks, the only exceptions found were Silva (2014) and Barbosa et al. (2015), although these authors did not explore the existence of cross-subsidies among products. Similarly, Cardoso et al. (2016) was the only study identified that considered coordinated action among banks belonging to the same economic group. According to the authors, disregarding coordination effects within economic groups leads to downward-biased estimates of market power.
The existence of technical inefficiency in the banking sector is widely reported in the literature (Belaisch 2003; Tecles and Tabak 2010; Tabak et al. 2011b) and has negative impacts on market power estimation. Considering the traditional Lerner Index, defined as the ratio between the difference of price (P) and marginal cost , inefficiency increases marginal cost and generates underestimated market power measures.
Regarding the structural changes brought by the implementation of Agenda BC#, the only study identified is Feld et al. (2021), which shows that the increased use of mobile and home banking channels and the entry of fintechs into the Brazilian banking sector are negatively correlated with bank fees. However, the study is restricted to the period between 2012 and 2019, covering only the initial phase of this period of change.
In recent years, approaches based on stochastic frontier analysis (SFA) models (Kumbhakar et al. 2012) have become increasingly common for measuring market power. SFA models allow for the estimation of markups from the composed error term and the inference of firms’ market power individually. They are highly flexible models, both in terms of assumptions (long-run equilibrium, functional forms, etc.) and data requirements. In this class of models, markups can be estimated using quantity data (primal form) or price data (dual form) through a single equation.
Coccorese (2014) was one of the first studies to apply this new class of models to the banking industry. Subsequently, Das and Kumbhakar (2016) adapted the model to incorporate the existence of multi-products, a hypothesis much more consistent with how banks operate. The model also allows market power to be estimated with or without inefficiency, which is particularly relevant to the Brazilian case. This class of models has already been applied to Brazil by Scalco et al. (2021), who investigated the impact of prudential regulation on banks’ market power.
3. Empirical Model and Database
Our empirical model is based on the framework proposed by Das and Kumbhakar (2016), in which the authors employ a stochastic frontier estimator to measure banks’ markup and market power. To estimate the SFA model, we utilize the data provided by the BCB in the IF.data system. Given the available data, we derive the primal version of the model by estimating an input distance function (IDF).
3.1. Lerner Index
The traditional measure used to quantify market power is the Lerner Index. In the single-product case, it can be defined as:
where is the product price, is the marginal cost, and . In a perfectly competitive market, and . Otherwise, L increases as market power rises, since .
For multi-product firms, the same definition of the Lerner Index in equation (1) applies, except that for , which represents the percentage increase in cost driven by a proportional increase in all m products.
Since , eq. (1) for the multi-product case becomes:
The higher the value of L, the greater the market power. For a firm with a single product, there will be a one-to-one relationship between markup (θ) and L, given by , where the markup is obtained by .
On the other hand, in the multi-product case the markup for each product can be represented by
and the possibility of cross-subsidies does not guarantee that for all products; consequently, L may be negative5. In the multi-product approach, for each product, we will have a measure of markup, but a single Lerner Index.
Although we have not identified previous research on cross-subsidies between credit lines offered by banks in Brazil, it is known that this is a recurring practice in the country, where banks offer reduced interest rates on certain loan segments (e.g. residential mortgage credit) if additional banking product lines such as credit cards, insurance, installment consortium, and others are contracted.
3.2. Primal Approach
The primal approach starts from the efficient production technology for a FI, represented by , where y is the output, x is a vector of inputs, T is the time variable and A represents the neutral shift parameter, both included to capture technological changes. The production function is finite, non-negative, assumes real values, is twice continuously differentiable, weakly monotonic, quasi-concave, and weakly essential. The input set is closed and non-empty.
For the multi-products case, Das and Kumbhakar (2016) assume the transformation function obtained from the normalization , in which now also represents a vector of outputs. The IDF can be derived from this function by imposing some normalization restrictions such as , with . In addition, it is assumed that the IDF will be represented by a translog function of the following form: . The normalization used also assumes that will be homogeneous of degree , which means that .
It is noteworthy that for the estimation of (2) it is necessary to obtain , however, both Kumbhakar et al. (2012) and Das and Kumbhakar (2016) demonstrate that under mild assumptions, , that is, it is possible to show that cost elasticity is identical to output elasticity. Therefore, the Lerner Index can be estimated from the IDF, and eq. (2) can be rewritten as:
3.3. Market Power in the Presence of Inefficiency
Eq. (4) assumes that banks are efficient; however, as highlighted by Belaisch (2003), Tecles and Tabak (2010) and Tabak et al. (2011b), inefficiency is a characteristic present in the Brazilian banking industry and may negatively affect (underestimate) the estimation of banks’ market power. Thus, to consider the impact of inefficiency, we consider a new representation of the cost function, given by , where is the minimum cost function and is inefficiency. This change also results in a new representation of the transformation function, which becomes , where is the technical inefficiency and it would be possible to reduce inputs by without reducing output. If we take , with , the normalization of the transformation function becomes: . Thus, we can estimate technical inefficiency from the IDF.
The inefficiency does not affect output, since it is given exogenously. In the presence of inefficiencies, will also not be affected, since it depends on inputs; consequently, will not be affected. The change occurs only in obtaining the cost function and, therefore, the Lerner Index can still be obtained from eq. (4), replacing the cost function with the minimum cost function , as follows:
3.4. Empirical Equation
To estimate the Lerner Index defined in (5), we assume that the IDF takes the form of a translog function, defined by:
where: .
It is assumed that banks supply four product categories : loans ; service provision revenue and banking fee revenue ; other operating revenue, non-operating revenue and equity participation results ; and financial intermediation revenue excluding loans . On the input side, we assume that banks use three inputs : labor , own capital , and third-party capital . An exogenous trend variable is also included to capture technological changes.
To estimate eq. (6) we assume that is a random error term with normal i.i.d. distribution, defined as , while the inefficiency term has a non-negative distribution and may be affected by a set of deterministic variables , as proposed by Battese and Coelli (1995).
From equation (6) we obtain the output elasticity:
which will be used to calculate the Lerner Index in (5). Furthermore, considering that , it is possible to write the markup equation for each product (3) as:
where
3.5. Database
To estimate (6) and obtain the markups and the Lerner Index, we used the data provided by the BCB, available on the IF.data page6. The BCB discloses quarterly information on FIs authorized to operate and, in December 2024, there were 1,424 financial conglomerates and independent institutions in the SFN.
The variables were obtained from the Income Statements (DRE), which contain information on revenue, expenses, taxation, and profit; from the statements about the Asset side, which contains cash, loan portfolio, leasing, and adjusted permanent assets; and from the Liability side, which contains information on funding, derivatives, current liabilities, and equity. The data were also obtained using the concept of financial conglomerates, given the coordinated action of FIs within the same economic group.
The four products considered in this study are: loans , which include the balance of loans; provision of services , including bank fee income, which refers to income from services provided and guarantees, such as technical advisory services, custody, collection services, as well as service packages for individuals and legal entities; equity income and other operating and non-operating revenue , such as income from investments in subsidiaries and affiliates and foreign investments; and other financial intermediation revenue - excluding loans , which include revenue from leasing operations, derivatives, foreign exchange, securities transactions (TVM) and reserve requirement revenue.
The literature generally treats financial intermediation revenue in an aggregated way; however, credit operation revenue was separated to enable the calculation of the markup exclusively for the credit market and independently of other intermediation activities such as leasing, securities transactions, foreign exchange, and reserve requirements.
We created the total cost variable () by summing financial intermediation expenses, personnel expenses, administrative expenses, and other operating expenses; and total revenue (R )by summing financial intermediation revenue, service revenue, banking fee revenue, equity income, other operating revenue, and non-operating results.
We excluded FIs that did not disclose personnel expenses, disclosed personnel expenses equal to zero, or personnel expenses with positive values. We also excluded those that did not disclose permanent assets, or disclosed values equal to zero. Similarly, FIs that did not present total cost values, total cost equal to zero, or positive values were excluded.
To eliminate the effects of outliers, we excluded FIs whose total assets were below the 10th percentile and those whose total cost to total revenue ratio was above the 99th percentile. Finally, we also excluded FIs that disclosed results in only three periods or fewer.
The final sample included 1,145 FIs over 22 observation periods, from Jun/2014 to Dec/2024, representing 99% of total credit and 99% of total assets in the last sample period. The data are organized as an unbalanced panel, with semiannual intervals, totaling 19,972 observations. To estimate eq. (6), the basic variables of the model were defined as in Table 2, and the natural logarithms of all variables were obtained, as well as their interactions.
4. Results
The estimation of the IDF (6) resulted in an equation containing 36 parameters, and the results are summarized in the Appendix table. Most coefficients were statistically significant at the 1% level. Based on these estimates, we computed the product elasticities for each financial institution and for each product, using equation (7).
Table 3 reports a summary of the product elasticities. Revenues from financial intermediation (excluding loans) exhibit the highest elasticity, with an average of 0.20. Service revenues and loans follow, with elasticities of 0.15 and 0.13, respectively. Meanwhile, equity income and other revenues exhibit an elasticity of 0.08. These elasticities display limited variation throughout the sample period, and the average sum of product elasticities equals 0.56.
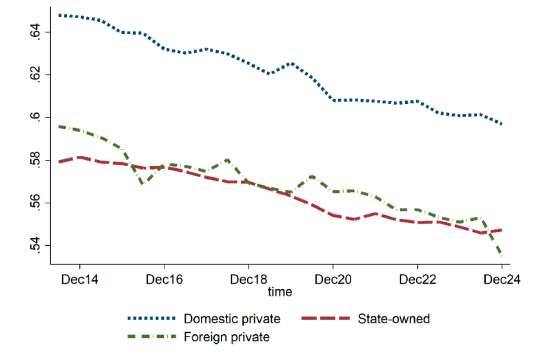
Figure 2 shows the average total product elasticity by controlling FI. State-owned banks display higher elasticities than their private and foreign counterparts, and all groups show a declining trend over time.

4.1. Markups
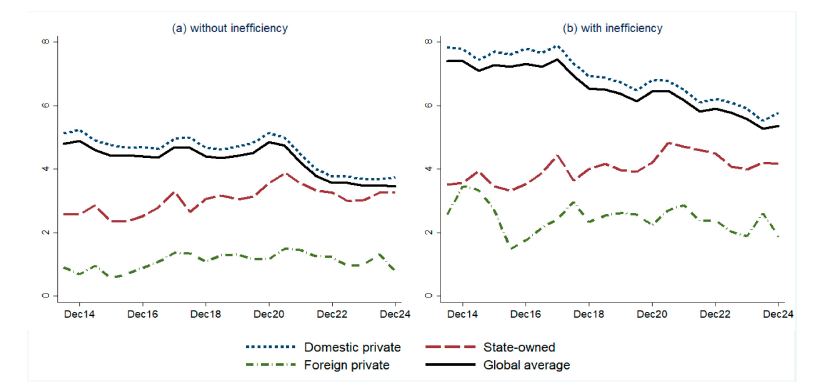
Markups were computed according to eq. (8) for loans only, as quantity data for the other products are unavailable. In the estimation of equation (6), revenues from other products were used as proxies for quantities . Therefore, using the same variables to compute markups would be inappropriate. The indicator was calculated for each FI, both including and excluding inefficiency, and the results are displayed in Figure 3.
The average markup that incorporates inefficiency equals 6.55, whereas the markup excluding inefficiency is 4.29. This difference (2.2 p.p.) is meaningful, as it confirms the theoretical concern raised in Subsection 2.2: the presence of inefficiency inflates marginal cost and leads to downward-biased estimates of market power. Domestic private FIs were the group with the largest discrepancy in the markup estimate with and without inefficiency, averaging 6.94 and 4.57, respectively.
Figure 3 reveals that domestic private FIs presented the highest markup throughout the period (6.94 with inefficiency on average), while state-owned banks and foreign FIs presented average markups of 4.03 and 2.44, respectively. Furthermore, a decreasing trend is observed in the markup of domestic private FIs, from 7.82 in June 2014 to 5.78 in December 2024. State-owned banks, on the other hand, increased their markup from 3.51 to 4.22 during the same period. The markup of foreign FIs, in turn, remained at the same level throughout the entire period.
Notably, the reduction in the markups of domestic private FIs began in the first half of 2018 and coincides with the decline in the concentration indices shown in Figure 1, but mainly coincides with the beginning of Agenda BC#. This evidence suggests a possible relationship between the measures adopted by the BCB to increase competitiveness in the credit market and the observed decline.

Table 4 shows considerable heterogeneity in markup levels across types of FIs. The lowest markups for credit operations were observed for non-bank capital market institutions (n2) and payment institutions (n4), both with an average value of -0.93 (with inefficiency). An average negative markup was also observed for central credit unions (b3C). What these three types of FIs have in common is that credit operations are not their main source of revenue.
In the case of payment institutions (n4), negative markups on credit operations were obtained throughout the entire period. However, the average net income of this group was positive, indicating the possible existence of cross-subsidies, given that their main line of business is the provision of services, such as issuing credit cards and other means of payment. The granting of credit is therefore a complementary product to the provision of payment services by these institutions, and negative markups may reflect a strategy of fostering customer loyalty in payment services. Similarly, the granting of credit is not the main product of non-bank capital-market institutions (n2), since they operate mainly in funding (resource raising), which reinforces the hypothesis of cross-subsidies in these FIs.
Central credit union (b3C), on the other hand, have financial intermediation as their main source of revenue, but they operate only by granting credit to other credit unions (singular). In this sense, the small average markup (even negative) may reflect the purpose of these institutions, which is to guide and coordinate the activities of their member credit unions.
In December 2024, there were 27 central credit unions, with an average markup of -0.45 (with inefficiency), indicating that they operate with rates below marginal cost.
Non-Banking type FIs (n1) presented the highest markup (8.23 considering inefficiency). These institutions do not receive demand deposits and operate with non-monetary assets, such as Bank Deposit Certificate (CDB), bonds, bills of exchange, and debentures, and this group includes fintechs, development agencies, savings associations, real estate credit companies, and leasing companies. In December 2024, there were 55 non-Banking FIs (n1), of which 39 were classified as credit companies - the fintechs - and 16 as development agencies.
Singular credit unions (b3S) presented the highest average markup (5.33) among all types of FIs when inefficiency is disregarded, and the second highest (7.87) with inefficiency. These results, to some extent, contradict what would be expected from this type of institution, namely, the existence of a non-maximizing agent (by law, credit unions are non-profit entities) would present lower markups. However, our results reinforce the findings of Garcia and Gonzaga (2024), who found no evidence of increased competition caused by the presence of credit unions in local markets.
It is important to consider, however, that credit unions also have a comparative advantage over commercial banks regarding prudential regulation. In line with Scalco et al. (2021), prudential regulation implies high costs to meet the requirements imposed by the BCB. These may be administrative costs (more complex accounting, report production, etc.) or opportunity costs (capital requirements). In this respect, credit unions face a much lighter regulatory framework than commercial banks, and this difference may be reflected in relatively lower costs and higher markups.
Furthermore, it is important to highlight a possible limitation of the empirical model regarding the coordinated activity of these institutions. As noted earlier, singular credit unions may act in a coordinated manner through a central credit union (b3C). Sicoob, for example, comprises 334 singular credit unions, while Sicredi has more than 1007. These institutions may also hold stakes in other types of FIs, such as Bancoob, a commercial bank (b1) created by several credit unions to ensure access to the interbank market, operational autonomy, and a diversified portfolio of products and services. Although the financial and accounting results are disclosed individually, and even though we use the BCB’s concept of financial conglomerate, the markup estimated for singular credit unions (b3S) may not fully reflect the institutional complexity of these FIs.
Lastly, commercial or multiple banks with a commercial portfolio (b1) showed a markup below the overall average of 4.29. Over the sample period, this group comprised 120 institutions and accounted for 82% of the entire SFN’s loan portfolio of SFN in December 2024. The four largest banks in the country are also classified in this category and together accounted for around 60% of the loan portfolio share in December 2024. On average, they operated with a markup of 1.49 (without inefficiency) and 2.69 (considering inefficiency).
We also tested the hypothesis that markups would be correlated with the size of FIs, measured using concentration ratios for total assets and the SFN’s loan portfolio; however, we did not find a significant relationship. These results are reinforced when we look at the table of daily interest rates published by BCB in December 2024, with the average rates charged by bank and loan’s segment. For example, in the non-payroll personal-loan segment, the average interest rate charged by the institutions was 6.25% per month, and in the loan segment for vehicles for individuals, the average rate was 2.13% per month. However, when we consider only the four largest banks, the average rates found were 3.49% and 2% per month, respectively.
Similarly, we did not find a significant relationship between markup and risk, along the lines argued by Tabak et al. (2011b) and Araújo and Jorge Neto (2007). We crossed the estimated markup results with the value of provisions for doubtful loans (PCLD), as well as with a risk exposure measure that we constructed based on the weighted average of each loan segment of the FIs8, and, as with the concentration ratios, we did not find a significant relationship between the variables.
4.2. Market Power - Lerner Index
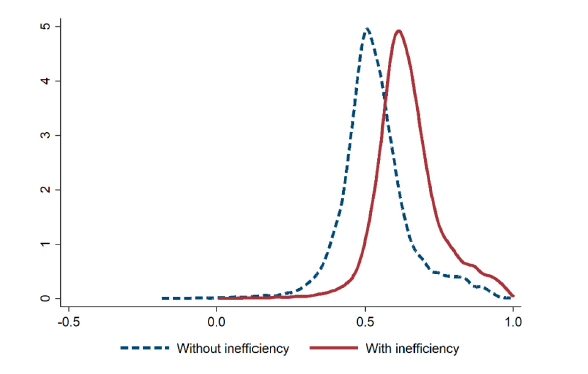
The Lerner index was also calculated with inefficiency (eq. 4) and without inefficiency (eq. 5). As expected, the indicator including inefficiencies proved to be higher than the one without inefficiency. The average value of the Lerner index with inefficiencies was 0.64, and without inefficiency it was 0.53, a difference of 0.11 p.p.. The distribution of the index shifts to the right in the graph when technical inefficiency is taken into account, as shown in Figure 4, and such differences are observed in all FIs classes, as shown in Table 5.
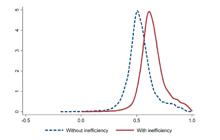
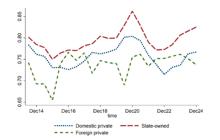
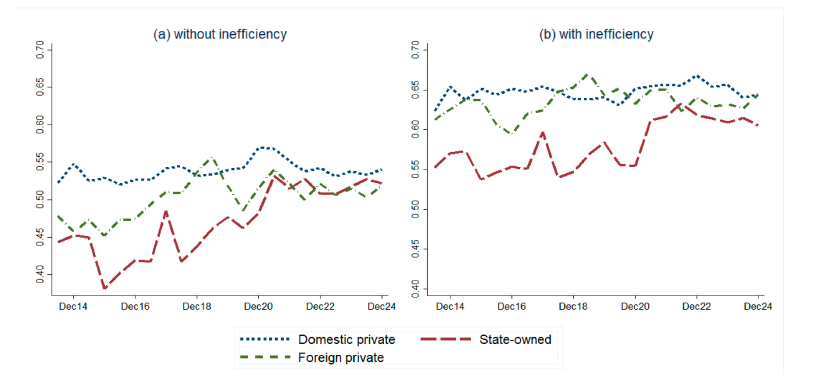
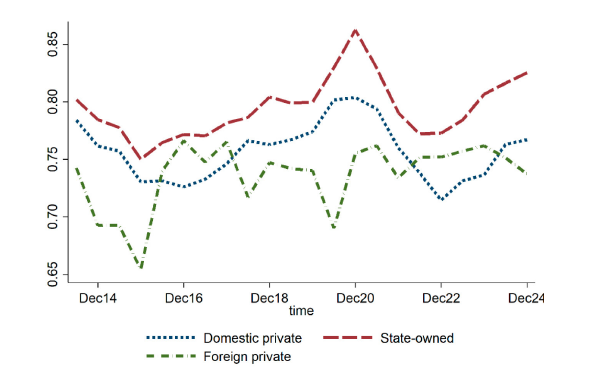
Figure 5 shows the evolution of the Lerner index with and without inefficiency, respectively, and by type of controlling entity. It can be seen that state-owned banks and foreign private FIs experienced an increase in market power, while domestic private FIs remained around the same level over the period studied. It is noteworthy that this evolution resulted in a convergence of market power among the three types of FIs at higher levels at the end of the sample period. An important finding is that, unlike the markup, the Lerner index did not fall over the period, and this may be related to the strategic behavior of FIs, such as the reduction in physical service points and the migration of products and services to digital channels.

FIs classified as commercial banks (b1), investment banks (b2), singular credit unions (b3S), and non-banking institutions (n1), whose main source of revenue comes from credit operations, showed a marked increase in these revenues after the Covid-19 pandemic in 2020. This result is largely due to the increase in the basic interest rate of the economy, which rose from 2% per year in September 2020 to 12.25% per year at the end of 2024.
Unlike what was observed for the markup, Table 5 reveals a more homogeneous distribution of the Lerner index across types of control. Non-bank capital-market institutions (n2) had the highest index, with an average of 0.72 (with inefficiency), while commercial banks (b1), central credit unions (b3C), and development banks (b4) had the lowest averages, all with a value of 0.58 (with inefficiency). Overall, the average Lerner index was 0.69.
Another relevant result is that multi-product FIs, that is, those that reported results for the four products studied, have lower market power than FIs that operate with three products or only with credit operations. FIs that operate exclusively with loans showed a market power of 0.85 (with inefficiency). The values are summarized in Table 6.
The results indicate that the greater the specialization of FIs in the loan market that is, those that operate exclusively with loans, the greater their market power tends to be. This finding diverges from that obtained by Barbosa et al. (2015) and may be related to the fact that more specialized banks operate with a higher level of expertise, as observed by Tabak et al. (2011b). Specialization, associated with operating in market niches, reduces competition and makes it possible to charge higher markups, resulting from more efficient operations, which involve better client selection, closer monitoring of operations, and the adoption of more effective collection procedures.
4.3. Technical Efficiency
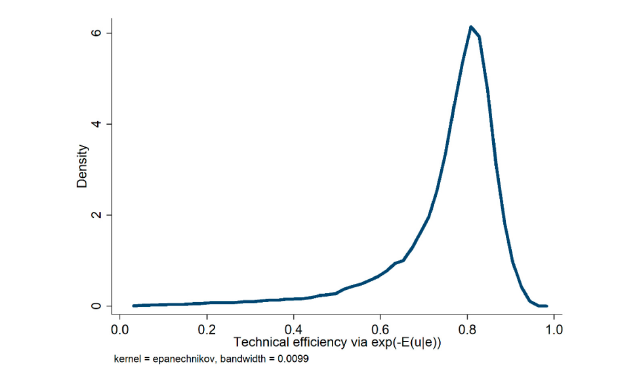
Figure 6 shows the distribution of the technical efficiency estimates. The average efficiency observed for state-owned banks over the period was 0.79; for domestic private FIs, 0.73; and for foreign FIs, 0.70.

As shown in Figure 7, there was a clear upward trend in the efficiency index for state-owned banks and domestic private FIs until July 2020. This trend was interrupted by the onset of the Covid-19 pandemic, when a significant reduction in efficiency was observed, which persisted until July 2022. Once again, the period of increasing efficiency coincides with the beginning of the Agenda BC# project. The consolidation of digital channels, together with the reduction in bank branches and physical service points, significantly increased the efficiency of Brazilian FIs. However, the pandemic scenario brought unexpected challenges, such as the extension of loan maturities, the creation of emergency credit products, and restrictions on mobility and in-person services, all of which directly affected efficiency.
Breaking down efficiency by type of institution, development banks (b4) are the most efficient (Table 7), followed by central credit union (b3C) and singular credit union (b3S). At the other end of the spectrum, non-bank capital-market institutions (n2) are the least efficient.
4.4. Returns to Scale
Returns to scale were obtained from the output elasticities derived from the IDF function (6), as follows: . For all types of FIs, returns to scale are increasing over the entire sample period, as shown in Figure 8. Domestic FIs, both states-owned and privates, have operated with higher efficiency and have taken better advantage of scale gains than foreign FIs.

5. Final Considerations
This study examined banking competition dynamics in Brazil in light of the regulatory and technological transformations that have taken place since 2016, with particular emphasis on the initiatives of the Agenda BC# and the intensification of the digitalization of financial services. By applying stochastic frontier models with a multi-product approach, it was possible, for the first time in the Brazilian context, to estimate the markup and the Lerner index of the financial institutions that make up the National Financial System.
The results indicate that, although there has been a reduction in the average markup on loans - suggesting greater competitive pressure in this market - this movement did not lead to a general decrease in the market power of financial institutions. On the contrary, an increase in market power was observed when measured by the Lerner index, especially among state-owned banks. This divergence between the metrics reveals revenue-portfolio adjustment strategies, with an expansion of income from other outputs and the use of cross-subsidies across business markets, a phenomenon that can mask the true degree of competition in the sector.
Additionally, the results show that singular credit unions, on average, displayed higher markups than commercial banks, contradicting the expectation of greater rivalry promoted by these institutions. This evidence reinforces the importance of taking institutional and regional heterogeneity into account when analyzing the structure of the banking market. Finally, it was found that the existence of inefficiencies negatively impacts and underestimates market power.
From a public policy perspective, the findings suggest that recent reforms, while relevant for increasing contestability and reducing barriers to entry, have not yet resulted in a fully competitive environment. The adaptation of incumbent financial institutions to this new regulatory landscape, coupled with the growth of market power, may limit the expected effects of financial inclusion, reduced spreads, and increased efficiency in credit allocation.
Finally, we emphasize that the nature of the Agenda BC# imposes important limitations on the causal interpretation of the results presented. It is a broad and ongoing set of regulatory and technological changes, implemented gradually and with heterogeneous impacts across the various segments of the National Financial System. This diffuse implementation over time prevents the definition of clear starting points or comparable treatment and control groups, making traditional causal inference approaches unfeasible. Thus, the relationships observed in this study should be understood as correlational evidence that is consistent with the recent reformist environment, but not as causally identified effects of the Agenda BC#.
References
-
Araújo, L.A.D., Jorge Neto, P.d.M., 2007. Risco e Competição Bancária No Brasil. Revista Brasileira de Economia 61: 175-200. https://doi.org/10.1590/S0034-71402007000200003
» https://doi.org/10.1590/S0034-71402007000200003 -
Barbosa, K., de Paula Rocha, B., Salazar, F., 2015. Assessing Competition in the Banking Industry: A Multi-Product Approach. Journal of Banking & Finance 50: 340-62. https://doi.org/10.1016/j.jbankfin.2014.05.003
» https://doi.org/10.1016/j.jbankfin.2014.05.003 -
Battese, G. E., and T. J. Coelli., 1995. A Model for Technical Inefficiency Effects in a Stochastic Frontier Production Function for Panel Data. Empirical Economics, 325-32. https://doi.org/10.1007/BF01205442
» https://doi.org/10.1007/BF01205442 -
Belaisch, A., 2003. Do Brazilian Banks Compete? SSRN Scholarly Paper ID 879189. Social Science Research Network. https://doi.org/10.5089/9781451853728.001
» https://doi.org/10.5089/9781451853728.001 -
Boone, J., 2008. A New Way to Measure Competition. The Economic Journal 118 (531): 1245-1261. https://doi.org/10.1111/j.1468-0297.2008.02168.x
» https://doi.org/10.1111/j.1468-0297.2008.02168.x -
Bresnahan, T.F., 1982. The Oligopoly Solution Concept Is Identified. Economics Letters 10 (1): 87-92. https://doi.org/10.1016/0165-1765(82)90121-5
» https://doi.org/10.1016/0165-1765(82)90121-5 -
Cardoso, M., Azevedo, P.F.d., Barbosa, K.d.S., 2016. Concorrência No Setor Bancário Brasileiro: Bancos Individuais Versus Conglomerados Bancários. Pesquisa e Planejamento Econômico (PPE) 46 (April): 113-46. https://repositorio.ipea.gov.br/handle/11058/6650
» https://repositorio.ipea.gov.br/handle/11058/6650 -
Chaffai, M., Coccorese, P., 2023. Banking Market Power and Its Determinants: New Insights from MENA Countries. Emerging Markets Review, February, 101004. https://doi.org/10.1016/j.ememar.2023.101004
» https://doi.org/10.1016/j.ememar.2023.101004 -
Coccorese, P., 2014. Estimating the Lerner Index for the Banking Industry: A Stochastic Frontier Approach. Applied Financial Economics 24 (January): 73-88. https://doi.org/10.1080/09603107.2013.866202
» https://doi.org/10.1080/09603107.2013.866202 -
Coelho, C.A., de Mello, J.M., Rezende, L., 2013. Do Public Banks Compete with Private Banks? Evidence from Concentrated Local Markets in Brazil. Journal of Money, Credit and Banking 45 (8): 1581-615. https://doi.org/10.1111/jmcb.12063
» https://doi.org/10.1111/jmcb.12063 -
Das, A., Kumbhakar, S.C., 2016. Markup and Efficiency of Indian Banks: An Input Distance Function Approach. Empirical Economics 51 (December): 1689-719. https://doi.org/10.1007/s00181-015-1062-4
» https://doi.org/10.1007/s00181-015-1062-4 -
Feld, M., de Barcellos Giacobbo, T.S.F., Schuster, W.E., 2021. Technological Progress and Finance: The Effects of Digitization on Brazilian Banking Fees. EconomiA 22 (August): 85-99. https://doi.org/10.1016/j.econ.2021.09.001
» https://doi.org/10.1016/j.econ.2021.09.001 -
Garcia, A.S., Gonzaga, A.L.M., 2024. How Credit Unions Affect the Profitability of Brazilian Commercial Banks? The Quarterly Review of Economics and Finance 93 (February): 190-209. https://doi.org/10.1016/j.qref.2023.12.006
» https://doi.org/10.1016/j.qref.2023.12.006 -
Kumbhakar, S.C., Baardsen, S., Lien, G., 2012. A New Method for Estimating Market Power with an Application to Norwegian Sawmilling. Review of Industrial Organization 40 (March): 109-29. https://doi.org/10.1007/s11151-012-9339-7
» https://doi.org/10.1007/s11151-012-9339-7 -
Lucinda, C.R., 2010. Competition in the Brazilian Loan Market: An Empirical Analysis. Estudos Econômicos (São Paulo) 40 (December): 831-58. https://doi.org/10.1590/S0101-41612010000400004
» https://doi.org/10.1590/S0101-41612010000400004 -
Nakane, M.I., 2002. A Test of Competition in Brazilian Banking. Estudos Econômicos (São Paulo) 32: 203-24. https://revistas.usp.br/ee/article/view/117799
» https://revistas.usp.br/ee/article/view/117799 -
Panzar, J.C., Rosse, J.N., 1987. Testing for “Monopoly” Equilibrium. The Journal of Industrial Economics 35 (June): 443. https://doi.org/10.2307/2098582
» https://doi.org/10.2307/2098582 -
Scalco, P.R., Tabak, B.M., Teixeira, A.M., 2021. Prudential Measures and Their Adverse Effects on Bank Competition: The Case of Brazil. Economic Modelling 100 (July). https://doi.org/10.1016/j.econmod.2021.03.014
» https://doi.org/10.1016/j.econmod.2021.03.014 -
Silva, M.S.d., 2014. Avaliação Do Processo de Concentração-Competição No Setor Bancário Brasileiro Trabalhos Para Discussão - Bacen No. 377. Banco Central do Brasil. https://www.bcb.gov.br/pec/wps/port/td377.pdf
» https://www.bcb.gov.br/pec/wps/port/td377.pdf -
Tabak, B.M., Fazio, D.M., Cajueiro, D.O., 2011a. The Effects of Loan Portfolio Concentration on Brazilian Banks’ Return and Risk. Journal of Banking & Finance 35 (11): 3065-76. https://doi.org/10.1016/j.jbankfin.2011.04.006
» https://doi.org/10.1016/j.jbankfin.2011.04.006 -
Tabak, B.M., Fazio, D.M., Cajueiro, D.O., 2011b. Profit, cost and scale eficiency for Latin American banks: concentration-performance relationship Working Paper Series Bacen 244. URL: https://www.bcb.gov.br/pec/wps/ingl/wps244.pdf
» https://www.bcb.gov.br/pec/wps/ingl/wps244.pdf -
Tabak, B.M., Fazio, D.M., Cajueiro, D.O., 2012. The Relationship Between Banking Market Competition and Risk-Taking: Do Size and Capitalization Matter? Journal of Banking & Finance 36 (12): 3366-81. https://doi.org/10.1016/j.jbankfin.2012.07.022
» https://doi.org/10.1016/j.jbankfin.2012.07.022 -
Tabak, B.M., Gomes, G.M., da Silva Medeiros, M., 2015. The Impact of Market Power at Bank Level in Risk-Taking: The Brazilian Case. International Review of Financial Analysis 40: 154-65. https://doi.org/https://doi.org/10.1016/j.irfa.2015.05.014
» https://doi.org/https://doi.org/10.1016/j.irfa.2015.05.014 -
Tecles, P.L., Tabak, B.M., 2010. Determinants of Bank Efficiency: The Case of Brazil. European Journal of Operational Research 207 (3): 1587-98. https://doi.org/10.1016/j.ejor.2010.06.007
» https://doi.org/10.1016/j.ejor.2010.06.007

 Source: Prepared by the author using data from IFData/BCB.
 Source: Prepared by the authors.
 Source: Prepared by the authors.
 Source: Prepared by the authors.
 Source: Prepared by the authors.
 Source: Prepared by the authors.
 Source: Prepared by the authors.
 Source: Prepared by the authors.