3D-Printed Liquid Handling Robot for the Development of Automated Analytical Methods
Abstract
Developing regions facing financial constraints often struggle to access new technological products; however, the affordability and adaptability of 3D printing technologies are transforming this reality. In this study, we propose the development of a versatile, user-friendly, compact, and robust liquid handling system, called NuPE-Robot, designed for automated analyses and built using affordable components, including standard parts commonly used in 3D printers and custom-designed elements fabricated via 3D printing, along with open-source Python software. Once activated, the compact robotic system can automatically prepare and analyze standard and sample solutions using 3D-printed batch injection analysis (BIA) cells (enabling automatic calibration), with either colorimetric detection or electrochemical detection (amperometric or potentiometric). To demonstrate its broad applicability, automatic calibration procedures were carried out for six model analytes: FeIII, phosphate, nitrite, and glucose using colorimetric detection; paracetamol using amperometric detection; and chloride using potentiometric detection. All analyses were successfully conducted using a single, fully integrated compact system. The only changes required were in the detection technique, highlighting the versatility and efficiency of the system in handling various analytical tasks. These findings underscore the potential of the proposed system to democratize access to automated analysis, offering a scalable, cost-effective solution for developing regions and laboratories.
Keywords:
automation; colorimetric detection; compact robotic system; electrochemical detection; open-source; Python
Introduction
Analytical chemistry has increasingly prioritized the reproducibility and repeatability of methods, driven by the understanding that the credibility and integrity of scientific findings depend significantly on the ability to replicate experimental results. However, achieving reproducible outcomes remains a persistent challenge.1,2 Scientific literature often describes procedures requiring extensive manual intervention, making them highly operator-dependent.1,3 Moreover, generating experimental data is often labor-intensive and time-consuming, which can limit the number of data points available to ensure precision and draw robust scientific conclusions.4
In this context, automation in analytical chemistry enhances precision, accuracy, and reproducibility by streamlining steps such as the preparation of sample and standard solutions, analysis, and data processing. It reduces human error, increases throughput, and enables real-time monitoring, thereby improving decision-making processes.3,5 However, developing regions with financial constraints often struggle to acquire these advanced tools. In response, the affordability and versatility of 3D printing technology-combined with open-source platforms such as Arduino and Raspberry Pi, and accessible programming languages that support rapid hardware-software integration have been transforming this scenario by enabling the development of low-cost, customizable analytical instruments.6-8 3D printing also simplify prototyping and system development directly within the lab, enabling researchers to design and construct tailored solutions that precisely meet their specific needs.
Automated or self-operating laboratories have been extensively applied across a wide range of fields, particularly in chemistry, where they are used to enhance experimental efficiency, precision, and reproducibility. These systems are now gaining increasing prominence in the development and optimization of continuous-flow liquid handling systems for high-throughput automated analysis.9-13 Given that 3D printing technology is an automated or semi-automated manufacturing process that has gained widespread recognition in recent years, components commonly used in this field have been incorporated into the development of automated liquid handling systems due to their low cost and robustness.8,14,15 For example, Barthels and co-workers14 proposed a liquid-handling robot manufactured using 3D printed technology, which has been successfully applied in various showcase applications across both the biology and chemistry fields. In another study, Kopyl et al.15 proposed an automated liquid handler by coupling manual pipettes to a commercial hobbyist 3D printer. According to the authors, the development of a low-cost, easily programmable automated liquid handling system proven to be an effective learning tool for students in the laboratory. Similarly, Almeida Jr. et al.8 described a fully automated 3D-printed robotic system for water analysis. In this case, devices produced through 3D printing-such as a robotic arm, syringe pump, temperature and conductivity sensors, a webcam serving as a colorimetric detector, and a 96-well microplate-were mounted on a 3D-printed platform and used to determine various parameters in water samples, including conductivity, pH, total alkalinity, total hardness, chloride, nitrite, total dissolved phosphorus, and total iron in potable water samples. The studies mentioned here8,14,15 demonstrate that 3D printing technology holds significant potential for contributing to the development of automated liquid handling systems.
Recently, a procedure known as batch injection analysis (BIA) has demonstrated significant potential as a detection method in a robotic system, where the injection process was carried out using a syringe pump.16 The BIA system was first introduced by Wang and Taha17 and involves injecting a sample plug - typically with an electronic pipette, which functions similarly to a syringe pump - directly onto the surface of a solid electrode detector immersed in a large-volume blank solution. Transient response peaks, similar to those in flow injection analysis (FIA), are generated as the sample plug moves across the detector. The procedure offers several advantages comparable to those of FIA systems, including high speed, low sample volume requirements, excellent sensitivity, and high reproducibility.18
In this study, we introduce an innovative approach to developing highly robust liquid handling systems, employing cost-effective components commonly used in 3D printers and developing open-source Python software for automated system control. In addition, electrochemical detection (amperometric and potentiometric) and colorimetric detection, utilizing a low-cost color sensor with eight different channels, were easily integrated into the robotic system using 3D-printed BIA cells.18 The standard configuration of BIA cells is ideal for injections using syringe pumps. To demonstrate the potential of the proposed 3D-printed robotic system, automated calibration curves were generated for six model analytes using a single compact setup: FeIII, phosphate, nitrite, and glucose using colorimetric detection; paracetamol via amperometric detection; and chloride by potentiometric detection.
Experimental
Reagents and solutions
All the reagents employed were of analytical grade and used as received. All aqueous solutions were prepared using deionized water with resistivity greater than 18 MΩ cm, obtained through a Milli-Q water purification system (Millipore, Bedford, MA, USA).
For the colorimetric detection of FeIII through complexation with thiocyanate (λ = 480 nm),19 a stock solution of ferric chloride (98% m/m, Êxodo Científica, Sumaré, SP, Brazil) was prepared at a concentration of 200 mg L-1. Hydrochloric acid (37% m/v, Synth, Diadema, SP, Brazil) was added to adjust the pH to below 3. The stock solution was standardized using a reagent prepared with 0.35 mol L-1 nitric acid (65%, m/v Vetec, Duque de Caxias, RJ, Brazil) and 0.5 mol L-1 ammonium thiocyanate (99% m/m, Synth, Diadema, SP, Brazil).
In the colorimetric detection of phosphate using the ascorbic acid method (Method 4500-P.E; λ = 630 nm),20 a stock solution was prepared using monobasic potassium phosphate (99% m/m, Cinética, Jandira, SP, Brazil) at a concentration of 50 mg L-1. The reagent for phosphate determination was prepared using 0.03 mol L-1 ascorbic acid (99% m/m, Synth, Diadema, SP, Brazil), 0.0002 mol L-1 potassium antimony tartrate (98.5%, Êxodo Científica, Sumaré, SP, Brazil), 0.0045 mol L-1 ammonium molybdate (99% m/m, Vetec, Duque de Caxias, RJ, Brazil), and 1.25 mol L-1 sulfuric acid (95% m/v, Êxodo Científica, Sumaré, SP, Brazil).
For the colorimetric detection of nitrite (Method 4500 - B, λ = 515 nm),20 a stock solution of sodium nitrite (99% m/m, Neon Comercial, Suzano, SP, Brazil) was prepared at a concentration of 54 mg L-1. The Griess-Saltzmann reagent was prepared using phosphoric acid (85% m/v, Chemiflex, Diadema, Brazil), 0.06 mol L-1 sulfanilamide (98% m/m, Vetec, Duque de Caxias, RJ, Brazil) and 0.004 mol L-1 N-(1-naphthyl)ethylenediamine dihydrochloride (98% m/m, Sigma-Aldrich, Darmstadt, Germany).
For the colorimetric detection of glucose (λ = 515 nm), an enzymatic colorimetric reagent (QuimiGli-OX - Ebram Produtos Laboratoriais Ltda, Belenzinho, São Paulo, SP, Brazil) was used. Its composition includes glucose oxidase (> 15,000 U L-1), peroxidase (> 1,000 U L-1), 4-aminoantipyrine (0.3 mmol L-1), phenol (0.5 mmol L-1), and a phosphate buffer at pH 7.3. Additionally, sodium azide (0.02%) is included as a preservative. A glucose stock solution (99% m/m, Synth, Diadema, SP, Brazil) was prepared in deionized water at a concentration of 400 mg L-1.
For the amperometric detection of paracetamol (98% m/m, Synth, Diadema, SP, Brazil), a stock solution at 0.5 mmol L-1 was used. An acetate buffer (0.1 mol L-1; pH 4.7) was employed as the supporting electrolyte. For the potentiometric determination of chloride, a sodium chloride stock solution at 100 mg L-1 (99.5% m/m, Synth, Diadema, SP, Brazil) was used. A solution composed of potassium nitrate (99% m/m, Química Moderna, São Paulo, SP, Brazil) at 0.1 mol L-1 and nitric acid (65% m/v, Vetec, Duque de Caxias, RJ, Brazil) at 0.002 mol L-1 was used as the supporting electrolyte.
Apparatus for electrochemical and colorimetric detection
Electrochemical detection (amperometry and potentiometry) was carried out using a Sensit Smart potentiostat (PalmSens BV, Houten, The Netherlands), operated via the PSTrace version 5.10 for Windows. For amperometric detection of paracetamol, the electrode setup included a boron-doped diamond (BDD) plate (1 × 1 cm) as the working electrode, a platinum wire as the counter electrode, and a lab-made Ag|AgCl|KCl(sat.) as the reference electrode. For the potentiometric detection of chloride, an Ag|AgCl plate (1.5 × 1.5 cm) and an Ag|AgCl|KCl(sat.) electrode were used as the indicator and reference electrodes, respectively.
For colorimetric detection, a digital color sensor (AS7341, Adafruit, New York, United States) was used and connected to an Arduino Uno microcontroller (Arduino®, Italy) for control and data acquisition. The sensor includes integrated optical filters positioned before the photodiode arrays, allowing the detection of specific wavelength bands (centered at 415, 445, 480, 515, 555, 590, 630, and 680 nm) within the visible spectrum. The sensor is equipped with a high-brightness white light emitting diode (LED) based on indium gallium nitride (InGaN), which emits light across the visible spectrum. The electrical connections and software libraries required for sensor operation were obtained from the manufacturer (Adafruit) and implemented according to the provided documentation. Signal processing was performed using a logarithmic transformation, revealing a linear relationship between analyte concentration and sensor response across the respective monitored channel. The analytical signal (reflectance) was defined as -log(I/I0), where I corresponds to the signal obtained from the sample and I0 refers to the baseline signal measured relative to deionized water inside the BIA cell.
Development of the liquid handling robot: integration of 3D-printed parts and electronic components
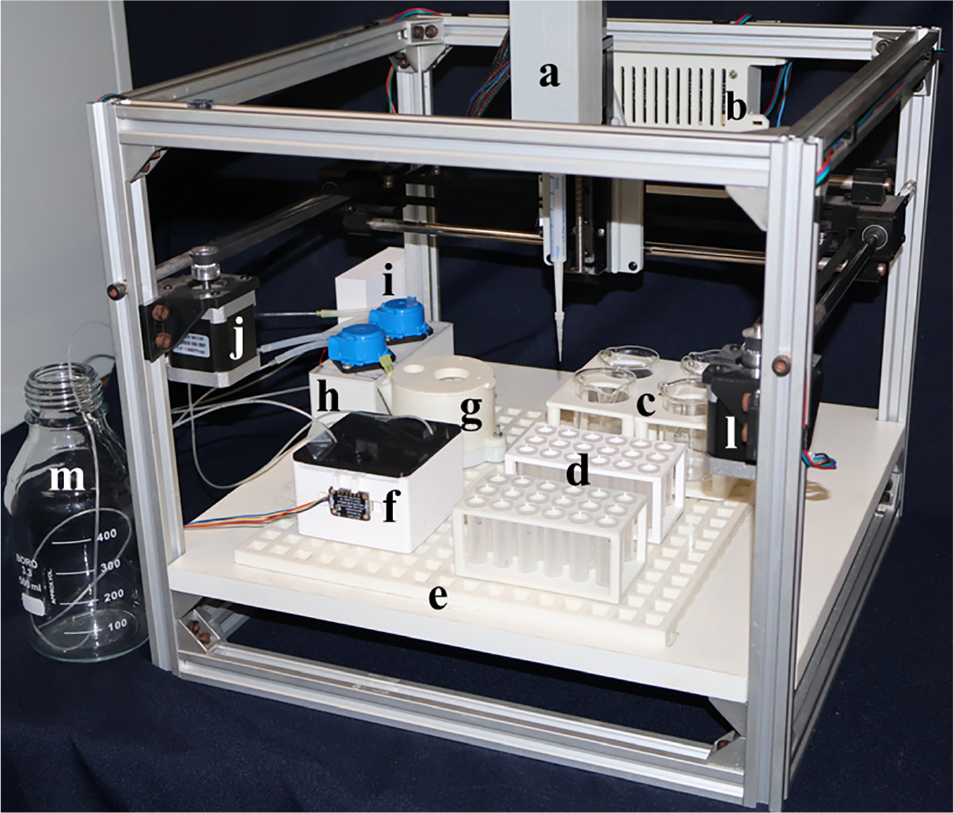
Figure 1 shows a photograph of the compact liquid-handling robot (NuPE-Robot), assembled from components commonly used in 3D printers and custom-designed 3D-printed parts.
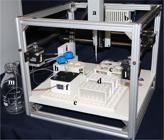
Photograph of the proposed compact 3D-printed liquid-handling robot. (a) 3D-printed syringe (Z-axis system); (b) protective housing for the BTT SKR v1.4 motherboard; (c) Beaker stands; (d) vial racks; (e) modular, reconfigurable, grid-shaped platform (allowing flexibility in positioning various devices); (f) 3D-printed BIA cell with colorimetric detection; (g) 3D-printed BIA cell with electrochemical detection; (h) support structure for mounting two mini-peristaltic aquarium pumps; (i) protective housing for the Arduino Uno board; (j and l) stepper motors (GT2-6mm belt); (m) reservoir for internal solution exchange in BIA cells.
A list of materials and components used in the assembly of the compact liquid-handling robot is provided in Table S1 (Supplementary Information (SI) section), along with the estimated cost of each item. The total system cost does not include labor, energy consumption, and control software development. More detailed images of each system component are provided in the SI section (Figures S1-S9).
A modular, reconfigurable, grid-shaped platform was mounted at the base of the 3D printer’s frame assembly (Figures S1b and S2). This platform is a solid 3D-printed structure that covers the entire usable area of the liquid-handling robot (200 × 200 mm). Square fittings, also 3D-printed, are affixed using adhesive to the base of individual objects or components. These fittings enable secure and flexible placement of various components (Figure 1), such as detection cells, sensors, vial racks, beaker holders, and pumps, at any position on the grid, ensuring flexibility and precision in component arrangement. Square fittings can be affixed to any object, making the system highly adaptable to different needs. Users can place objects in any square on the grid, allowing for personalized workspace organization. The fittings keep each object firmly in place and properly aligned, preventing positioning errors. The system is intuitive and easy to use - users simply affix the fitting to the base of the object and place it on the grid.
Several modifications were made to the electronics of a 3D printer to convert it into a liquid-handling robot. The extruder was replaced by a lab-made, 3D-printed syringe, and the firmware used was Marlin version 2.0. The heating functions of the bed and extruder were disabled and reconfigured in the firmware to control pumps and relays. Finally, the system was programmed to respond to G-code commands for operation.
The technical specifications of the proposed liquid-handling robot are as follows: a working area of 200 × 200 mm, a usable height of 50 mm, X- and Y-axis belt movements with a resolution of 0.13 mm, driven by NEMA 17 stepper motors; Z-axis movement with a resolution of 0.01 mm, also using a NEMA 17 stepper motor, enabled by a linear guide and spindle. The 3D-printed syringe is driven by a NEMA 14 stepper motor, providing a resolution of 0.002 mm.
The 3D-printed syringe (Figure S8) was designed to accommodate syringe-type tips, specifically Combitips® (Eppendorf, Hamburg, Germany). Nine Combitips® of varying volumes (0.1, 0.2, 0.5, 1.0, 2.5, 5.0, 10.0, 25.0, and 50.0 mL) are commercially available, all of which can be attached to the 3D-printed syringe proposed in this work. As a result, the system offers a wide dispensing volume range (0.1 µL to 50.0 mL), supporting up to 5,000 different volume settings with increments as small as 100 nanoliters (0.1 µL). When the syringe is replaced, the software must be updated with its volume, after which it automatically adjusts the plunger displacement to ensure accurate solution dosing.
3D-printed BIA cell with electrochemical detection
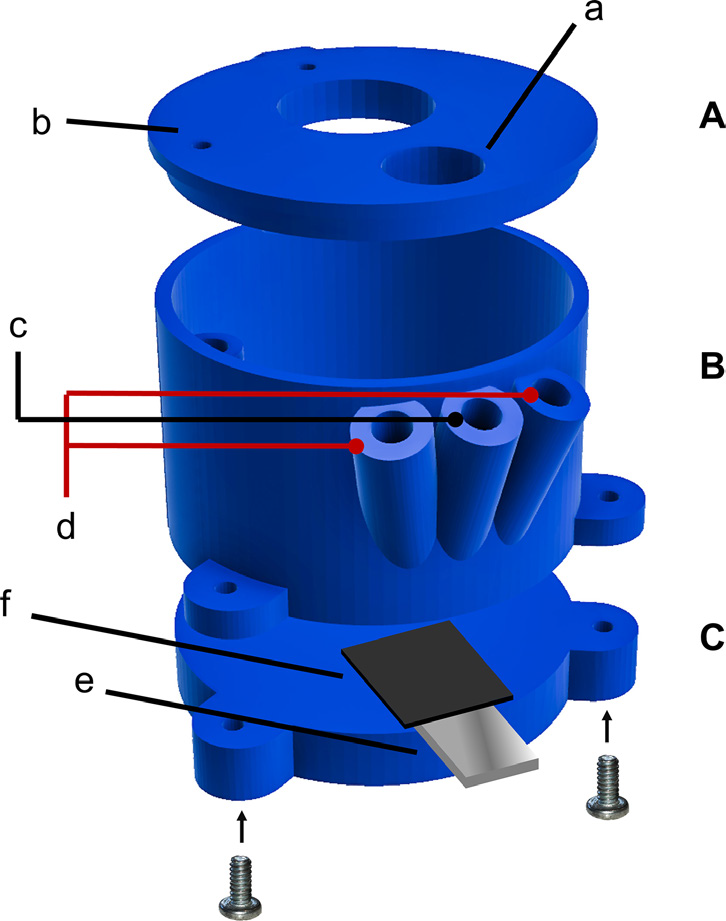
The 3D-printed BIA cell for electrochemical detection (Figure 2) was fabricated using acrylonitrile butadiene styrene (ABS) filament, based on a design similar to that reported in a previous publication.21 Consistent with the earlier design, either the working electrode (1 × 1 cm BDD plate) or the indicator electrode (1 × 1 cm Ag/AgCl plate) is affixed to the BIA cell using three metal screws. These electrodes are mounted onto a rubber O-ring secured at the base of the BIA cell, which serves both to prevent solution leakage and to define the geometric electrode area. In the previous version of the 3D-printed BIA cell, the working and reference electrodes were positioned in holes located in the top cover of the BIA cell. However, to allow unobstructed access for the syringe mounted on the automatic XYZ movement system, the auxiliary and reference electrodes were relocated to the side wall of the BIA cell (Figures 2c and 2d). A mini-peristaltic aquarium pump, automatically controlled via software (including on/off timing and flow-rate), was used to remove the solution from the sensor surface immediately after the injection procedure by recirculating the supporting electrolyte from inside the BIA cell directly onto the working electrode surface, thereby rapidly restoring the baseline signal. Figure S10 shows the position of the syringe tip (Combitip®) during the injection process, as well as the entry point of the solution introduced by the mini-peristaltic aquarium pump, which helps to quickly remove the injected solution from the vicinity of the sensor surface.
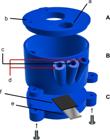
Schematic diagram of the components of the 3D-printed BIA cell with electrochemical detection: (A) Cell cover showing holes for the injection procedure via syringe tip (a) and for the placement of the tube (b) used to recirculate the internal solution of the cell with a mini-peristaltic aquarium pump; (B) cell body 6.7 cm in diameter and 5.2 cm in height), showing three holes in the cell wall: one for inserting the inlet tube (c) used to recirculate the internal solution with an mini-peristaltic aquarium pump, and two for positioning the reference and auxiliary electrodes (d); (C) cell base with a slot for positioning a steel plate (e), used as the electrical contact for either the working electrode (1 × 1 cm BDD plate) or the indicator electrode (1 × 1 cm Ag/AgCl plate) (f). The geometric area of the working or indicator electrode is defined by a rubber O-ring (0.5 cm in diameter; area ca. 0.2 cm2) fixed to the bottom of the cell body.
3D-printed BIA cell with colorimetric detection
The compatibility of BIA cells with spectrophotometry was first demonstrated by Wang and Angnes.22 In this approach, precisely controlled sample volumes are injected via electronic pipette into a modified compartment of a conventional spectrophotometer. Figure 3 shows a schematic diagram of a compact 3D-printed BIA cell designed for colorimetric detection. This configuration was rapidly prototyped by integrating a multi-channel color sensor23 into a glass window mounted on the side wall of the square-shaped BIA cell (Figure 3f). The compact BIA cell was positioned within the operational area of the liquid-handling robot, with test solutions introduced via an inlet channel aligned parallel to the sensor’s optical path within the cell. Three seconds after sample injection, a mini-peristaltic aquarium pump was activated in aspiration mode to efficiently remove the solution from the detection zone. A second mini-peristaltic pump was employed to restore the solution volume in the BIA cell by introducing deionized water. Both the injection procedure and the operation of the mini-peristaltic pumps were precisely controlled through software, allowing for accurate timing and fluid handling. The AS7341 color sensor used in this study simultaneously measures eight discrete visible light channels (415, 445, 480, 515, 555, 590, 630, and 680 nm) in real time. For optical measurement, the optimal channel was selected based on its proximity to the target analyte’s maximum reflectance wavelength, ensuring precise and reliable measurements.
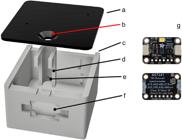
Schematic diagram of the components of the 3D-printed BIA cell with colorimetric detection. (a) Cell cover; (b) injection hole; (c) cell body; (d) internal channel; (e) pump connection port for solution removal near the color sensor; (f) optical glass window for precise alignment of the color sensor; (g) front and rear views of the AS7341 spectral color sensor.
Software
The software used for system control was developed in our research group using Python, an open-source programming language, with a graphical user interface that operates the machine using G-code commands. The software is not currently available for public distribution. The application enables direct communication with the machine via serial port command transmission and provides comprehensive tools to create, edit, and manage work routines, component maps, and system configurations (including syringe tips and machine parameters). This section outlines the main functionalities and key components of the current software implementation.
Graphical user interface
The graphical user interface was developed using the PySide library, which enables the creation of interactive elements such as windows, buttons, lists, charts, and dynamic widgets. The main window features multiple tabs and controls, allowing users to interact with the machine, load G-code files, design custom routines, and configure system parameters.
Serial connection
The application connects to the control board via a serial port. Users can select the desired port and configure the baud rate to establish the connection. G-code commands may be sent either manually or automatically via a loaded file.
Routine management
Users can create, edit, and delete work routines. Each routine may include a sequence of instructions such as application loops, sample collection, mixing, pauses, and custom G-code scripts. Routines are stored in a database (using the Pickle module) and can be linked to a specific component map.
Component maps
The application enables the creation and editing of component maps, which define the physical layout of components on the worktable of the machine. Each component has specific coordinates (X, Y, Z) and dimensions (width, height, etc.) that are used to generate corresponding G-code commands.
Tip configuration for variable volumes and parameters
Users can customize syringe-shaped tips (Combitips®) with operational parameters including volume range, calibration factors, safety margins, directional inversion, and waste disposal protocols. Additionally, general machine settings such as motion speeds for the X, Y, Z, and syringe axes are configurable.
G-code generation
The application translates routines and component maps into G-code commands that can be transmitted to the machine. These commands include axis movements, material extrusion, pauses, and the activation of auxiliary devices such as pumps and LEDs.
Manual control
The manual control module provides direct manipulation of machine axes (X, Y, Z, and A), position initialization, and peripheral device activation (e.g., pumps, sensors) via a dedicated graphical user interface panel.
Automatic cleaning of syringe tips
The system automates self-cleaning between solution changes, utilizing syringe-type dispensing tips. The software executes a cleaning protocol that aspirates a cleaning solution, discards waste, and aspirates air to eliminate residual bubbles or contaminants. This cycle can be repeated iteratively to ensure complete removal of residues and prevent cross-contamination between successive solutions.
Screenshots of the liquid-handling robot control software, along with usage information, are presented in Figures S11-S17 (SI section).
Results and Discussion
3D printed syringe performance
Initially, the performance of the laboratory-fabricated 3D-printed syringe was evaluated in comparison to that of a commercial electronic pipette (Eppendorf Multipette® E3). Table S2 (SI section) presents the results obtained for different dispensed volumes (50.0, 100.0, 150.0, 200.0, 500.0, and 1000.0 µL) using the same pipette tip (Combitip®, 2.5 mL total capacity) in both systems. As shown in Table S2, the proposed 3D-printed syringe exhibited performance comparable to that of the commercial electronic pipette, with errors below 1.7% across all evaluated volumes.
In addition to volume accuracy, positional accuracy along the X, Y, and Z axes was also evaluated within the operational workspace of the system-defined by the printing area of the 3D printer model used-where the target volume is dispensed. The excellent accuracy of the automated system is demonstrated in Video 1,24 in which 5.0 µL droplets are repeatedly dispensed using a 2.5 mL (2,500.0 µL) Combitip® to form the word “NuPE” through overlapping drops (first blue, then orange, resulting in a final volume of 10.0 µL). As can be observed, the visual pattern of droplet overlap is highly reproducible. The capability of the automated system to handle small solution volumes is further demonstrated in Figure S18 (SI section), in which 2.0 µL of a yellow dye solution was dispensed onto a sheet of paper using a 100.0 µL Combitip®. After drying, the relative standard deviation of the spot diameters was determined to be 2.8% (n = 25). This finding highlights the strong potential of the proposed liquid-handling robot for the fabrication of highly reproducible paper-based analytical devices.
Analytical performance of the liquid handling system (NuPE-Robot)
Subsequently, as a proof of concept and to demonstrate its broad applicability, the analytical performance of the proposed automated liquid handling system (NuPE Robot) was evaluated by constructing calibration curves for six model analytes using different detection methods (colorimetry, amperometry, and potentiometry) all integrated with 3D-printed BIA cells. FeIII, phosphate, nitrite, and glucose were quantified by colorimetric detection; paracetamol, by amperometry; and chloride, by potentiometry. 3D-printed BIA cells were selected as the detection platform due to their simplicity and compatibility with syringe-based injection procedures.
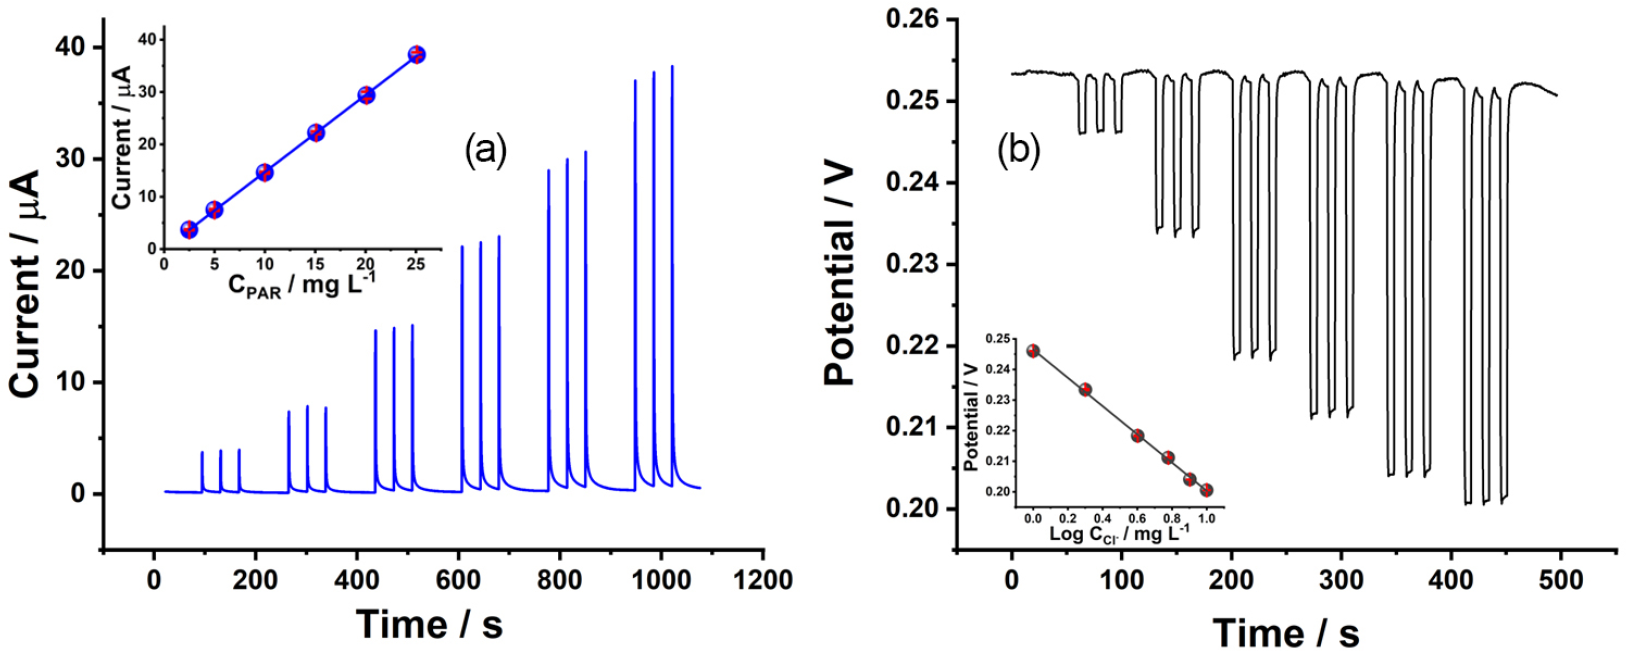
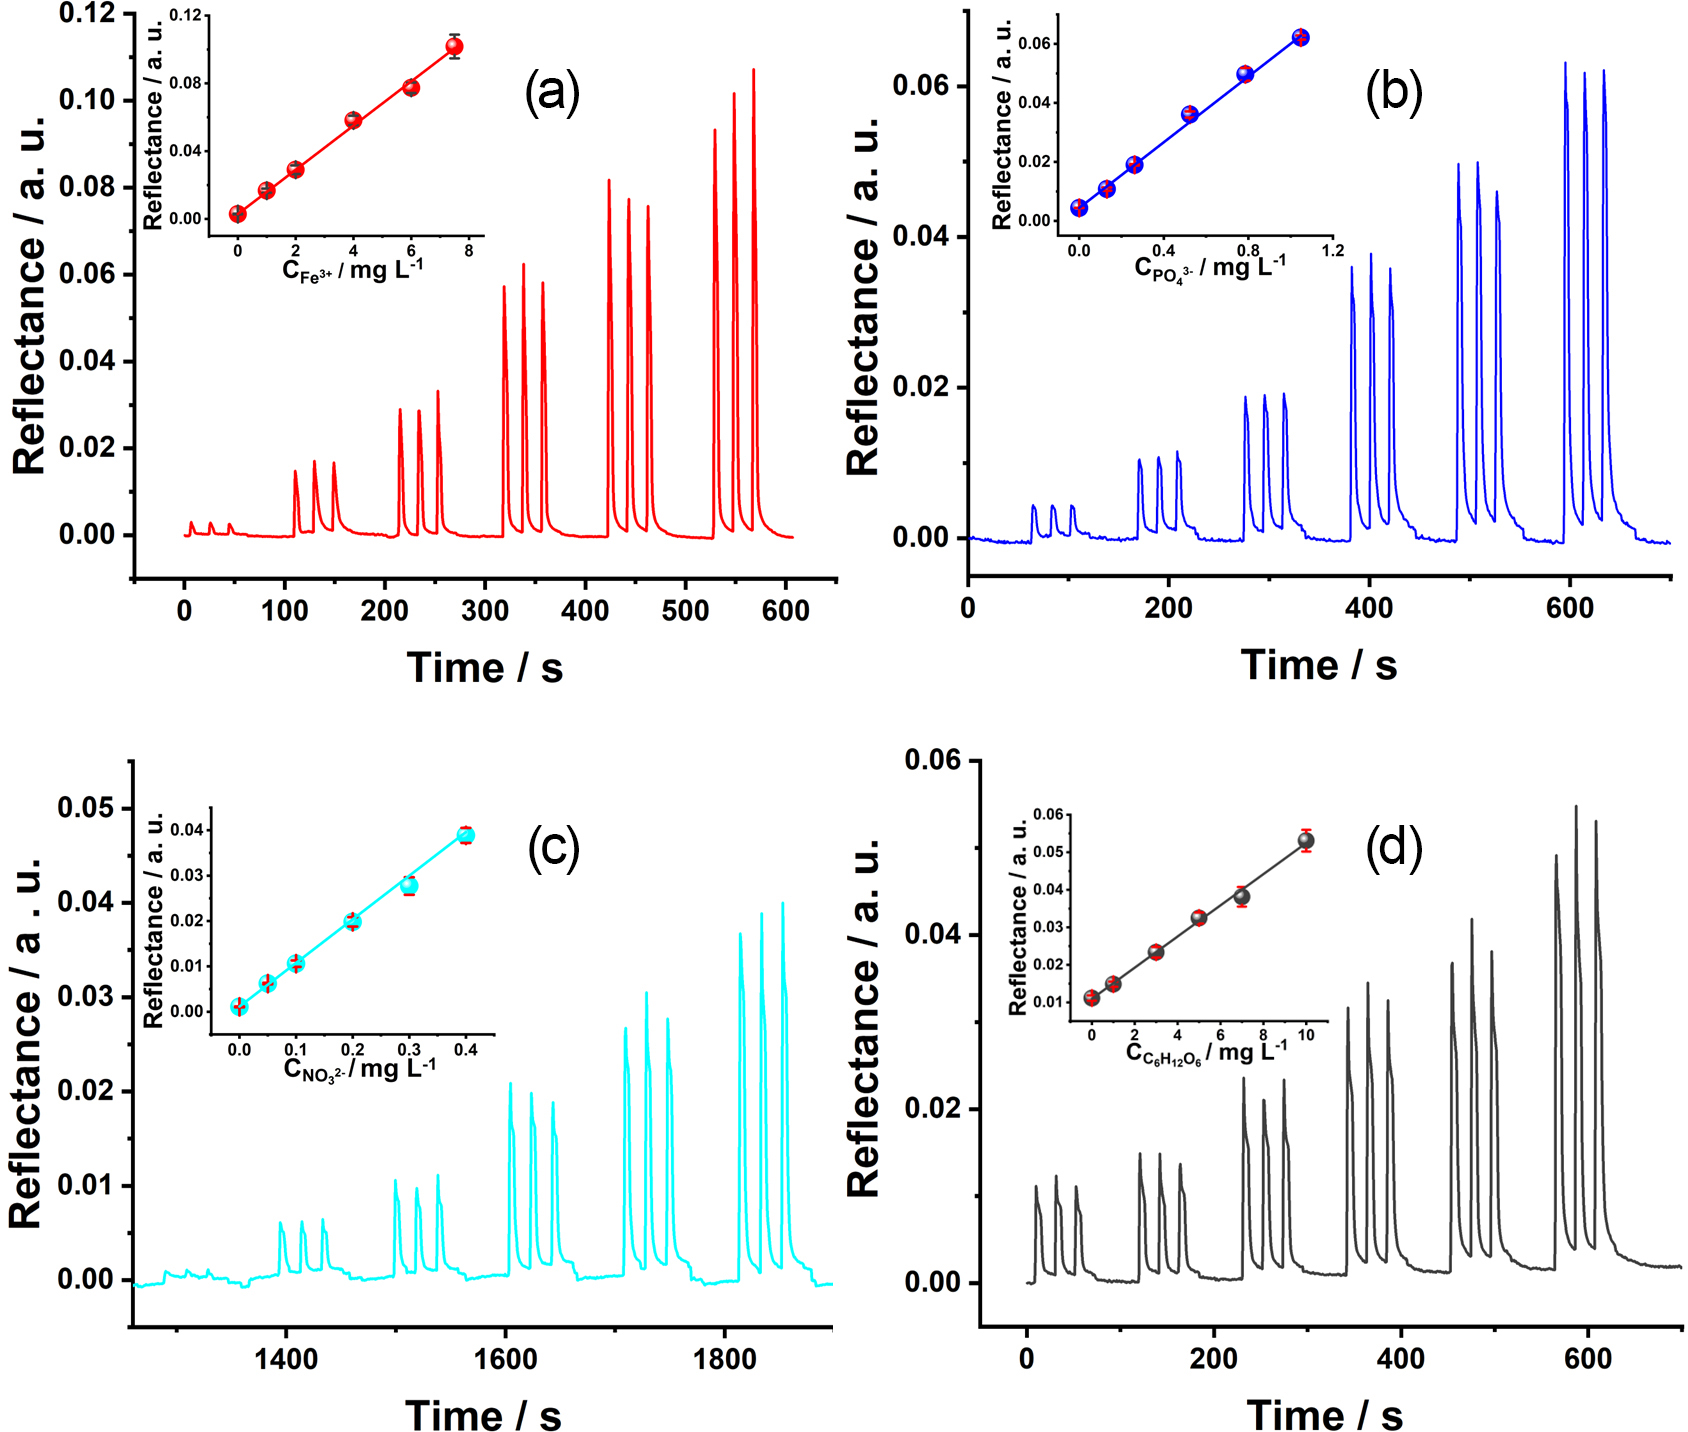
Figures 4 and 5 present the results (detector signal as a function of time using BIA cells) obtained from successive injections of solutions with increasing concentrations, using electrochemical and colorimetric detection, respectively. To evaluate the performance of the system, various analytical parameters were considered, including sensitivity (defined as the slope of the calibration curve), linear range, and limits of detection (LOD) and quantification (LOQ). The LOD and LOQ values were calculated according to International Union of Pure and Applied Chemistry (IUPAC) guidelines using the formula 3sd/s, where s is the slope of the calibration curve for each target analyte and sd is the standard deviation of the blank (n = 10).
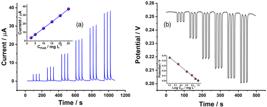
(a) BIA-amperogram recorded from successive injections of paracetamol solutions with increasing concentrations (2.5-25.2 mg L-1; n = 3), using boron-doped diamond as the working electrode. Injection volume: 200 µL; dispensing rate: 260 µL s-1; applied potential: +1.0 V vs. Ag|AgCl|KCl(sat.); supporting electrolyte: 0.1 mol L-1 acetate buffer (pH 4.7). (b) BIA-potentiogram recorded from successive injections of chloride solutions with increasing concentrations (1.0-10.0 mg L-1; n = 3) using Ag|AgCl as the indicator electrode and Ag|AgCl|KCl(sat.) as the reference electrode. Injection volume: 100 µL; dispensing rate: 75 µL s-1; supporting electrolyte: 0.1 mol L-1 KNO3 + 0.002 mol L-1 HNO3.
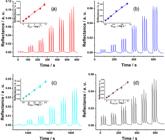
BIAgrams (reflectance vs. time) for triplicate injections using a BIA cell with colorimetric detection (AS7341, 8-channel sensor). (a) FeIII, λ = 480 nm, linear range: 1.0 to 7.5 mg L-1; (b) phosphate, λ = 630 nm, linear range: 0.13 to 1.05 mg L-1; (c) nitrite, λ = 515 nm, linear range = 0.05 to 0.40 mg L-1; (d) glucose; λ = 515 nm, linear range: 1.0 to 10.0 mg L-1. Injection volume: 150 µL; dispensing rate: 140 µL s-1.
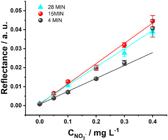
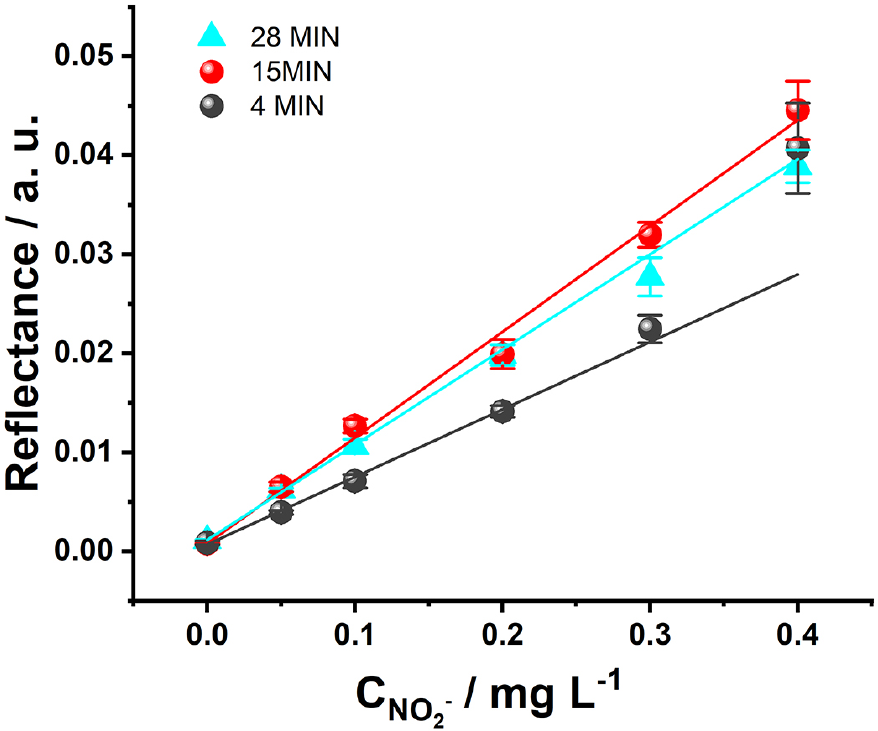
Calibration plots obtained for the colorimetric detection of nitrite (at 515 nm) at different reaction times (4, 15, and 28 min) using the proposed automated liquid handling system.
In the electrochemical analyses, the system exhibited high precision and reliable performance in the detection of paracetamol via amperometry (Figure 4a) and chloride detection via potentiometry (open-circuit potentiometry) (Figure 4b). Paracetamol, also known as acetaminophen, is the most widely used analgesic worldwide and is recommended by the World Health Organization (WHO) as a first-line therapy for pain relief and fever reduction.25,26 Consequently, routine analyses in the pharmaceutical industry are essential to ensure the correct dosage of paracetamol, thereby guaranteeing its efficacy and safety for consumers.
Paracetamol was detected using a boron-doped diamond as the working electrode, operating at an applied potential of +1.0 V vs. Ag|AgCl|KCl(sat.) reference electrode and a platinum wire as the counter electrode, in 0.1 mol L-1 acetate buffer (pH 4.7). The resulting response exhibited excellent linearity over the range of 2.5 to 25.0 mg L-1 (coefficient of determination (R2) = 0.999), a LOD of 0.22 mg L-1, and a LOQ of 0.73 mg L-1 (Figure 4a). Video 227 shows the operation of the liquid-handling robot during the triplicate injections of paracetamol solutions with increasing concentrations, along with the corresponding BIA-amperogram recorded as a function of time. In this video, a fixed 3D-printed platform for accommodating a 96-vial plate, four beaker stands, and a BIA cell serving as the detection system was employed.
Similarly, chloride ions are naturally present in various sources such as water, food, and soil.28,29 Although some natural water samples contain high chloride concentrations, human activities and industrial processes (e.g., the production of soap, salt, alkalis, and pickled foods) have significantly increased chloride levels in the environment in recent years, potentially affecting both fauna and flora.29,30 Therefore, the determination of chloride is essential for routine water quality monitoring as well as for assessing its potential environmental impacts.
In this way, the potentiometric determination of chloride ions using the proposed system was demonstrated, exhibiting a linear response in the range of 1.0 to 10.0 mg L-1 (R2 = 0.999), and appropriate LOD = 0.004 mg L-1, and LOQ = 0.012 mg L-1) (Figure 4b). Potentiometric measurements in flow systems present challenges, as they must be conducted under equilibrium conditions to ensure a linear relationship between the logarithm of the analyte concentration and the measured potential.31 This is especially relevant in the analysis of low concentrations, where longer contact time between the electrode surface and the solution is required to achieve the equilibrium condition. Using the automated hydrodynamic system, this condition was easily controlled, as the system remained relatively at rest for five seconds following each aliquot injection by the syringe pump (resulting in rectangular peaks, Figure 4b). After five seconds, a mini-peristaltic aquarium pump was activated by the software and the solution was removed from the electrode-solution interface. If a manual BIA system had been employed, achieving reproducible implementation of this procedure would be challenging. However, with the proposed automated system, it was readily executed using the interface board and software controlled through the Python programming language.
To further evaluate the robustness of the proposed liquid handling system with electrochemical detection, an additional experiment was conducted to simultaneously assess key operational parameters. These included solution preparation, injection volume, dispensing rate, and the repeatability of the syringe tip’s XYZ movement between the test solutions and the detector, particularly the reproducibility of the tip-to-electrode distance during each injection. Figure S19 (SI section) displays three independent and sequential BIA-amperograms obtained from successive injections of paracetamol solutions at increasing concentrations (2.5-25.2 mg L-1). From these data, three independent calibration curves were constructed, resulting in R2 = 0.9993 ± 0.0003, a slope of 1.453 ± 0.132 µA L mg-1, and relative standard deviations between 1.6 and 2.5% for nine replicates of each of the six standard solutions (2.5, 5.0, 10.0, 15.0, 20.0, and 25.0 mg L-1). Notably, the amperograms in Figure S19 also show high temporal precision of the injections, reflected in the consistent timing across all three records. These findings strongly support the high precision and reproducibility of the proposed liquid handling system.
Colorimetric methods are widely applied in the analysis of various analytes due to their simplicity, low cost, and adequate sensitivity, which make them suitable for use in environmental, industrial, and biomedical matrices.32 In the present study, colorimetric methods were successfully implemented in the automated system and demonstrated satisfactory analytical performance, as evidenced by the well-defined linear responses across the established concentration ranges for each target analyte.
The determination of iron in water is essential due to the environmental and health risks associated with elevated levels of this element. Excess iron can lead to gastrointestinal discomfort, organ damage, and an increased risk of chronic diseases. Additionally, iron-rich water can clog irrigation systems and impair plant growth.33 The determination of FeIII was carried out after complexation with thiocyanate ions under highly acidic conditions, with detection at a wavelength of 480 nm. The method exhibited excellent linearity across the range of 1.0 to 10.0 mg L-1 (R2 = 0.9991), with a LOD of 0.029 mg L-1 and a LOQ of 0.095 mg L-1 (Figure 5a).
Phosphorus, primarily found as phosphate, is an essential nutrient for aquatic ecosystems; however, excessive levels can lead to eutrophication-an overgrowth of algae and aquatic plants that results in oxygen depletion and shifts in biomass and species composition. This persistent environmental issue is mainly caused by runoff from industrial effluents, sewage, and agricultural and urban areas.34 Monitoring phosphate levels is crucial to prevent water quality degradation and the loss of aquatic biodiversity. Phosphate determination was carried out using the ascorbic acid method, in which phosphate reacts with ammonium molybdate under acidic conditions to form a phosphomolybdate complex, which is subsequently reduced to a blue-colored compound. The reflectance was measured at 630 nm. The method exhibited excellent linearity across the range of 0.13 to 1.05 mg L-1 (R2 = 0.999), with a LOD of 0.0005 mg L-1 and a LOQ of 0.0017 mg L-1 (Figure 5b).
Nitrite and nitrate are common anions found in water and soil. Nitrite originates from the biological oxidation of ammonium and can be further converted into nitrate. Elevated nitrite levels in soil, industrial effluents, and groundwater pose health risks, as nitrite can react with amines to form carcinogenic N-nitrosamines.35 Therefore, monitoring nitrite is essential, as excessive intake is associated with cardiovascular problems and an increased risk of cancer. Nitrite determination was performed using the Griess-Saltzman method, in which nitrite reacts under acidic conditions with sulfanilamide and N-(1-naphthyl)ethylenediamine to form a pink azo dye. Reflectance was measured at 515 nm. The method exhibited excellent linearity across the range of 0.05 to 0.40 mg L-1 (R2 = 0.997), with a LOD of 0.003 mg L-1 and a LOQ of 0.010 mg L-1 (Figure 5c).
Glucose is a key clinical biomarker, widely monitored for the diagnosis and management of diabetes mellitus. It is also an essential parameter in industrial fermentation processes and in the quality control of sugary foods and beverages.36,37 Its quantification is crucial for both glycemic control in diabetic patients and for ensuring the quality and safety of industrial food products. Glucose quantification was carried out at 515 nm, based on the formation of a reddish quinoneimine complex via an enzymatic colorimetric reaction. The method showed excellent linearity across the range of 1.0 to 10.0 mg L-1 (R2 = 0.998), with a LOD of 0.51 mg L-1 and a LOQ of 1.70 mg L-1 (Figure 5d).
Table 1 summarizes the analytical characteristics of the methods employed to evaluate the performance of the liquid handling robot.
Analytical characteristics of the colorimetric (FeIII, PO43-, NO2-, and C6H12O6) and electrochemical (PAR and Cl-) methods adapted for operation via liquid-handling robot
The precision of the liquid handling system with colorimetric detection was evaluated based on key operational parameters: solution preparation, injection volume, dispensing rate, and the reproducibility of the syringe tip’s movement (XYZ) between the sample vials and the injection site of the detector. Figure S20 (SI section) presents the results from fifteen consecutive injections of independently prepared FeIII solutions (4.0 mg L-1), showing a low relative standard deviation of 2.7%. This demonstrates the high reproducibility of the system under the tested conditions.
It is important to highlight that the color-forming reactions for phosphate, nitrite, and glucose are time-dependent, which presents challenges for manual analysis due to the need for precise reaction timing. This limitation, however, was effectively overcome by the automated system, as each solution was analyzed at an exact time point programmed into the control software. Calibration curves generated at different reaction times consistently exhibited a linear relationship between analyte concentration and reflectance for all evaluated compounds (phosphate, nitrite, and glucose), yielding results comparable to those typically achieved with FIA systems. To illustrate this capability, Figure 6 displays calibration curves for the colorimetric detection of nitrite at various reaction times. Corresponding correlation coefficients and linear equations are summarized in Table 2.
Data obtained from the calibration curves for nitrite (Figure 6) at different reaction times (4, 15, and 28 min)
It is important to emphasize that, for methods involving relatively long reaction times between the analyte and reagents (e.g., 15 min), reaction times does not represent a limiting factor for the proposed liquid handling robot. Multiple solutions can be prepared sequentially within approximately 14 min. Then, each solution can be analyzed precisely at its predefined reaction time, as programmed into the software. This process can be repeated as needed. The results for all analytes demonstrate that the system is a practical and low-cost option for automated analysis. Its versatility is also evident, as it can seamlessly switch between different detection methods without requiring major structural modifications.
Conclusions
This study successfully demonstrates the development and implementation of a cost-effective, compact, and fully automated 3D-printed liquid handling robot-NuPE-Robot-for the execution of various analytical procedures. By utilizing affordable components sourced from 3D printers or fabricated via 3D printing, along with open-source software, the system addresses a critical gap in access to laboratory automation in resource-limited environments. Its modular structure, combined with programmable precision and adaptability, allows for the seamless integration of multiple detection methods, including colorimetric, amperometric, and potentiometric techniques.
The analytical performance of the system has been extensively evaluated through the determination of six model analytes-FeIII, phosphate, nitrite, glucose, paracetamol, and chloride-using 3D-printed BIA cells, which are particularly well-suited for syringe-based injection systems. All analyses exhibited excellent linearity, low limits of detection, and strong reproducibility across the evaluated methods. The robot was capable of handling a wide range of volumes and executing precise, automated protocols with minimal user intervention, highlighting its robustness and versatility.
A notable advantage of the NuPE-Robot is its ability to manage time-sensitive reactions with high precision. This was achieved through G-code-based control and a user-friendly software interface that enabled real-time coordination of injection, mixing, and detection steps. This level of automation enhances both repeatability and accuracy, essential attributes for reliable analytical workflows.
In conclusion, the NuPE-Robot exemplifies the potential of open-source technologies and 3D printing to democratize access to automated analytical systems. Its low cost, modular design, and flexible software make it a scalable and customizable solution for various analytical tasks, particularly in laboratories facing financial or infrastructural limitations. Future developments will focus on integrating artificial intelligence (AI) algorithms to optimize experimental conditions in real time, enabling adaptive control of parameters such as reaction time, reagent volume, and detection wavelength. Additionally, strategies for automated sample treatment-such as filtration, dilution, pH adjustment, or derivatization-will be incorporated through the development of modular accessories and coordinated software protocols. These enhancements will further increase the autonomy and versatility of the NuPE-Robot, moving it toward the concept of self-operating analytical platforms.
Supplementary Information
Supplementary information (Figures S1-S20 and Tables S1-S2) and the videos is available free of charge at http://jbcs.sbq.org.br as PDF file.
Data Availability Statement
Data supporting the findings of this study are mostly presented in the article. Any further relevant data are available from the corresponding author upon reasonable request.
Acknowledgments
The authors thank the financial support provided by CNPq (grants 408462/2022-1, 308392/2022-1, 401977/2023-4, and 315838/2021 3), FAPEMIG (grants RED-00120-23, APQ-01395-2, and APQ 02067 23), and CAPES (001 and 88887.6580022/2021 00), as well as by the INCT-Bio-Lauro Kubota (CNPq/INCT 408338/2024 5) and INCT-SP (CNPq 406958/2022-0). We are grateful to Prof Roberto Mendes Finzi (Faculty of Mechanical Engineering, UFU) for his valuable contributions to the discussions throughout the system development.
References
-
1 Leins, D. A.; Haase, S. B.; Eslami, M.; Schrier, J.; Freeman, J. T.; Digital Discovery 2023, 2, 12. [Crossref]
» Crossref -
2 Bergman, R. G.; Danheiser, R. L.; Angew. Chem. 2016, 128, 12736. [Crossref]
» Crossref -
3 Medina, D. A. V.; Maciel, E. V. S.; Lanças, F. M.; TrAC, Trends Anal. Chem. 2023, 166, 117171. [Crossref]
» Crossref -
4 Duke, R.; Mahmoudi, S.; Kaur, A. P.; Bhat, V.; Dingle, I.; Stumme, N.; Shaw, S.; Eaton, D.; Vego, A.; Risko, C.; ChemRxiv, 2023. [Link] accessed in July 2025
» Link -
5 Thurow, K.; Anal. Bioanal. Chem. 2023, 415, 5057. [Crossref]
» Crossref -
6 Booeshaghi, A. S.; Kil, Y. A.; Min, K. H.; Gehring, J.; Pachter, L.; HardwareX 2021, 10, 00201. [Crossref]
» Crossref -
7 Intarakamhang, S.; Leson, C.; Schuhmann, W.; Schulte, A.; Anal. Chim. Acta 2011, 687, 1. [Crossref]
» Crossref -
8 de Almeida Jr., P. L.; Lima, L. M. A.; Almeida, L. F.; Anal. Chim. Acta 2021, 1169, 338491. [Crossref]
» Crossref -
9 Torres-Acosta, M. A.; Lye, G. J.; Dikicioglu, D.; Biochem. Eng. J. 2022, 188, 108713. [Crossref]
» Crossref -
10 Dong, Z.; Fang, Q.; TrAC, Trends Anal. Chem. 2020, 124, 115812. [Crossref]
» Crossref -
11 Miró, M.; Frenzel, W.; TrAC, Trends Anal. Chem. 2004, 23, 624. [Crossref]
» Crossref -
12 Ramshani, Z.; Fan, F.; Wei, A.; Romanello-Giroud-Joaquim, M.; Gil, C.-H.; George, M.; Yoder, M. C.; Hanjaya-Putra, D.; Senapati, S.; Chang, H.-C.; Talanta 2021, 225, 122021. [Crossref]
» Crossref -
13 Anderson, C. E.; Huynh, T.; Gasperino, D. J.; Alonzo, L. F.; Cantera, J. L.; Harston, S. P.; Hsieh, H. V.; Marzan, R.; McGuire, S. K.; Williford, J. R.; Oncina, C. I.; Glukhova, V. A.; Bishop, J. D.; Cate, D. M.; Grant, B. D.; Nichols, K. P.; Weigl, B. H.; Anal. Bioanal. Chem. 2022, 414, 2607. [Crossref]
» Crossref -
14 Barthels, F.; Barthels, U.; Schwickert, M.; Schirmeister, T.; SLAS Technol. 2020, 25, 190. [Crossref]
» Crossref -
15 Kopyl, A.; Yew, Y.; Ong, J. W.; Hiscox, T.; Young, C.; Muradoglu, M.; Ng, T. W.; J. Chem. Educ. 2024, 101, 640. [Crossref]
» Crossref -
16 Mendonça, D. M. H.; Rocha, D. P.; Dutra, G. S. V.; Cardoso, R. M.; Batista, A. D.; Richter, E. M.; Munoz, R. A. A.; Electroanalysis 2019, 31, 771. [Crossref]
» Crossref -
17 Wang, J.; Taha, Z.; Anal. Chem. 1991, 63, 1053. [Crossref]
» Crossref -
18 Rocha, D. P.; Cardoso, R. M.; Tormin, T. F.; de Araujo, W. R.; Munoz, R. A. A.; Richter, E. M.; Angnes, L.; Electroanalysis 2018, 30, 1386. [Crossref]
» Crossref -
19 Araujo, A. N.; Gracia, J.; Lima, J. L. F. C.; Poch, M.; Saraiva, M. L. M. F. S.; Fresenius J. Anal. Chem 1997, 357, 1153. [Crossref]
» Crossref - 20 Baird, R. B.; Eaton, A. D.; Rice, E. W. In Standard Methods for the Examination of Water and Wastewater, vol. 1, 23rd ed.; Bridgewater, L. L., ed.; American Public Health Association: Washington DC, USA, 2017.
-
21 Cardoso, R. M.; Mendonça, D. M. H.; Silva, W. P.; Silva, M. N. T.; Nossol, E.; Silva, R. A. B.; Richter, E. M.; Muñoz, R. A. A.; Anal. Chim. Acta 2018, 1033, 49. [Crossref]
» Crossref -
22 Wang, J.; Angnes, L.; Anal. Lett. 1993, 26, 2329. [Crossref]
» Crossref -
23 Machado, C. C. S.; Cadeado, A. N. S.; Mota, Y. S. N.; Petrucci, J. F. S.; Silva, S. G.; Anal. Methods 2024, 16, 8427. [Crossref]
» Crossref -
24 https://youtu.be/n22DLEuGK2c, accessed in July 2025.
» https://youtu.be/n22DLEuGK2c -
25 Ennis, Z. N.; Dideriksen, D.; Vægter, H. B.; Handberg, G.; Pottegård, A.; Basic Clin. Pharmacol. Toxicol. 2015, 118, 184. [Crossref]
» Crossref -
26 Vieira, Y.; Spode, J. E.; Dotto, G. L.; Georgin, J.; Franco, D. S. P.; Reis, G. S.; Lima, E. C.; Environ. Chem. Lett. 2024, 22, 2343. [Crossref]
» Crossref -
27 https://youtu.be/OIB-3ORhNIw, accessed in July 2025.
» https://youtu.be/OIB-3ORhNIw -
28 Wu, D.; Hu, Y.; Liu, Y.; Zhang, R.; Appl. Sci. 2021, 11, 11137. [Crossref]
» Crossref -
29 Szklarek, S.; Górecka, A.; Wojtal-Frankiewicz, A.; Sci. Total Environ. 2022, 805, 150289. [Crossref]
» Crossref -
30 Prosser, R. S.; Rochfort, Q.; McInnis, R.; Exall, K.; Gillis, P. L.; Environ. Pollut. 2017, 230, 589. [Crossref]
» Crossref -
31 da Silva, I.; Richter, E. M.; do Lago, C. L.; Gutz, I. G. R.; Tanaka, A. A.; Angnes, L.; Talanta 2005, 67, 651. [Crossref]
» Crossref -
32 Chen, Z.; Zhang, Z.; Qi, J.; You, J.; Ma, J.; Chen, L.; J. Hazard. Mater. 2023, 441, 129889. [Crossref]
» Crossref -
33 Abed, E. A. M.; Alaboudi, K. A. N.; Abbas, M. H. H.; Attia, T. M. S.; Abdelhafez, A. A.; Water 2024, 16, 1834. [Crossref]
» Crossref -
34 Ngatia, L.; Taylor, R. In Phosphorus - Recovery and Recycling, vol. 1, 1st ed.; Zhang, T., ed.; IntechOpen: China, 2019. [Link] accessed in July 2025
» Link -
35 Fraihat, S. M.; Green Process Synth. 2017, 6, 245. [Crossref]
» Crossref -
36 Evans, R. A.; Frese, M.; Romero, J.; Cunningham, J. H.; Mills, K. E.; Am. J. Clin. Nutr. 2017, 106, 519. [Crossref]
» Crossref -
37 Scheper, T.; Gebauer, A.; Sauerbrei, A.; Niehoff, A.; Schügerl, K.; Anal. Chim. Acta 1984, 163, 111. [Crossref]
» Crossref
-
Editor handled this article:
Cristiane Luísa Jost (Associate)