
 Discrimination of Stamp Impressions Produced by Different Formation Methods Based on Hyperspectral Imaging and a CARS-SVM Machine Learning Approach
Abstract
Reliable discrimination of stamp impressions formed by stamping versus printing is crucial for forensic document examination, as printed imitation of stamp patterns is a common forgery tactic. This study proposes a non-destructive classification approach, coupling visible-near-infrared hyperspectral imaging (HSI, 400-1000 nm) with competitive adaptive reweighted sampling (CARS) wavelength selection and a support vector machine (SVM) classifier (HSI-CARS-SVM). Hyperspectral data were collected from four sample types: atomic-ink, photosensitive-ink stamp impressions, laserand inkjet-printed stamp patterns. Four preprocessing strategies and five conventional classifiers were benchmarked under repeated random cross-validation and leave-one-stamp-out (LOSO) cross-validation, the latter simulating identification of unseen stamps. To prevent information leakage, the multiplicative scatter correction (MSC) reference spectrum, CARS selection, and classifier training were independently recalculated within each LOSO fold (fully nested evaluation). Multiplicative scatter correction proved essential, and CARS selected 34 characteristic wavelengths. The CARS-SVM model achieved the best performance: 0.9967 under random cross-validation and, under the stringent nested LOSO scheme, accuracy 0.9533, macro F1 0.9523, and Cohen’s kappa 0.9378, outperforming the best full-spectrum benchmark (0.9417) while reducing feature dimensionality by 71.9%. Misclassifications concentrated between the two red stamp-ink classes, consistent with their spectral similarity. Within the experimental limits (three items per class, one ink brand, one printer per printing class, and one paper type), the approach provides an accurate, compact tool for stamp impression discrimination, offering a controlled proof-of-concept for questioned document examination.
Keywords:
hyperspectral imaging; stamp impression; competitive adaptive reweighted sampling; support vector machine; leave-one-stamp-out cross-validation; forensic document examination
Introduction
Seals and stamps are widely used in China and many other countries as legally binding identifiers on contracts, certificates and official documents. Consequently, the examination of stamp impressions, determining whether an impression was produced by a genuine seal, by a copied seal, or by a printed imitation, has long been a central task of forensic document examination. Traditional examination relies mainly on the morphological comparison of impression features under microscopy, which is subjective and requires considerable expert experience, while physicochemical methods are often destructive to the original evidence. Hyperspectral imaging (HSI), which records the reflection spectrum of every pixel over tens to hundreds of contiguous bands, offers a non-contact, non-destructive and objective alternative for the analysis of inks and toners on documents. Silva et al.1 pioneered the use of near-infrared HSI for the forensic analysis of document forgery, and Khan et al.2 introduced deep learning into the automated detection of forgery in hyperspectral document images. HSI combined with machine learning has since been applied to the classification of writing inks in historical and modern documents.3
In the field of stamp impression analysis, Gao et al.4 predicted the age of stamp impressions from hyperspectral data using support vector machines (SVM), and Li et al.5 determined the line-crossing sequence between stamp ink and laser toner based on visible-near-infrared HSI. For the classification of stamp ink materials, Wang et al.6 collected hyperspectral images of 20 types of stamp-pad inks and proposed a classification model based on a one-dimensional convolutional neural network (1D-CNN). Xie et al.7 developed a convolutional attention network for multi-task classification of stamp inks from visible and near-infrared spectral information; and Lu et al.8 achieved rapid non-destructive identification of stamp-pad inks by combining HSI with an extreme learning machine, also applying machine learning to the chronological differentiation of printed text and stamps.9 Chinese researchers have likewise reported the discrimination of photosensitive stamp inks10 and atomic stamp inks11 based on HSI and machine learning, and the progress of HSI in document examination has been reviewed recently.12
A persistent challenge in spectral classification is the high dimensionality and collinearity of hyperspectral data relative to the limited number of available samples, which favors compact, well-regularized models. Wavelength-selection algorithms address this problem by retaining only the most informative bands. Among them, competitive adaptive reweighted sampling (CARS), proposed by Li et al.,13 selects variables according to the absolute regression coefficients of partial least-squares (PLS) models through exponentially decreasing retention and adaptive reweighted sampling, and has repeatedly been shown to improve the accuracy and robustness of spectral classifiers, for example in seed variety identification14 and Fourier-transform infrared spectroscopy (FTIR)-based quality discrimination.15 SVMs, with their maximum-margin principle and strong small-sample behavior, are a natural companion classifier for the selected low-dimensional feature sets.
Despite this progress, two gaps remain in stamp impression examination: (i) existing studies focus almost exclusively on discriminating different brands of the same kind of stamp ink; the discrimination of stamp impressions produced by different formation methods - stamped with atomic ink, stamped with photosensitive ink, laser-printed and inkjet-printed - which is essential for exposing forged documents in which a stamp pattern is reproduced by a printer, has rarely been systematically investigated; (ii) most studies adopt random cross-validation, in which spectra of the same physical stamp appear simultaneously in the training and test sets, potentially overestimating the generalization ability to stamps never seen before. To address these gaps, this study proposes the HSI CARS SVM approach and makes three contributions: (i) visible near infrared HSI data (400-1000 nm, 121 bands) were collected from four types of stamp-impression samples produced by different formation methods; (ii) four preprocessing strategies and five conventional classifiers were systematically benchmarked under two evaluation schemes - repeated random cross-validation and leave-one-stamp-out (LOSO) cross-validation; and (iii) CARS wavelength selection was integrated with SVM classification, yielding a compact model evaluated by a fully nested, leakage-free LOSO protocol.
Experimental
Samples
Four types of stamp-impression samples were prepared. Atomic ink stamp impressions and photosensitive (flash) ink stamp impressions were produced with commercial stamps and red stamp inks of the same brand (Deli Group Co. Ltd., Ningbo, China). Laser-printed stamp patterns were printed with a Hewlett-Packard (HP) laser printer, and inkjet-printed stamp patterns were printed with an Epson inkjet printer, using the same stamp pattern image. Three independent items were prepared for each type (labeled 1-1 to 1-3, 2-1 to 2-3, 3-1 to 3-3 and 4-1 to 4-3, respectively), and all impressions and printouts were made on standard white copy paper. Photographs of all twelve samples are shown in Figure 1. For each item, 50 regions of interest (ROIs) were manually delineated in ENVI 5.6 (Exelis Visual Information Solutions, Harris Corporation, USA) on homogeneously inked areas of the impression; pixels at stroke edges, paper background and pixels with low or saturated signal were excluded, and one mean spectrum per ROI was extracted after reflectance calibration, yielding 3 × 50 = 150 spectra per class and 600 spectra in total. It must be emphasized that these 600 spectra are nested within only 12 independent physical items (three per class): the items, rather than the individual spectra, constitute the independent experimental units. All items were prepared on the same batch of standard white A4 office copy paper (80 g m-2) within one day and were stored in the dark at room temperature until hyperspectral imaging.

Photographs of the twelve stamp-impression samples: three items (samples 1-3) for each of the four formation methods (atomic ink stamp impression, photosensitive ink stamp impression, laser-printed stamp pattern and inkjet-printed stamp pattern).
Hyperspectral imaging system and data acquisition
Spectral data were collected with a hyperspectral imaging system (Shenzhen Zhongda Ruihe Technology Co. Ltd., Shenzhen, China). The system consists of a hyperspectral imager based on liquid crystal tunable filter (LCTF) technology equipped with a 2048 × 2046-pixel complementary metal-oxide-semiconductor (CMOS) sensor and a 35 mm aperture optical system, an adjustable sample stage, and four sets of halogen broadband white-light source arrays (color temperature 3200 ± 100 K). The operating spectral range covers 400-1000 nm with a spectral resolution of 5 nm (121 bands) and a spatial resolution of 2048 × 2046 pixels; the exposure time was fixed at 40 ms. Before acquisition, the system was warmed up for 10 min to stabilize the light source. Radiometric calibration was then performed with a standard white reference board (Wλ) and a dark reference image (Dλ) acquired under complete light blocking in an enclosed environment, and the pixel-wise relative reflectance (rλ) was calculated as:
where Rλ is the raw image. Full-band data were acquired under fixed geometric conditions (sample stage height 50 ± 1 cm; light source incident angle 45 ± 2°). Image calibration, ROI selection and spectral extraction were carried out in ENVI 5.6.
Spectral preprocessing
Four preprocessing strategies were compared: (i) the raw relative reflectance (RAW); (ii) standard normal variate (SNV) transformation, which centers and scales each spectrum individually to remove multiplicative scatter effects; (iii) multiplicative scatter correction (MSC), which regresses each spectrum against a reference spectrum taken as the mean of the training spectra of each validation fold (see the “Evaluation schemes and metrics” sub-section) and corrects for additive and multiplicative offsets; and (iv) Savitzky-Golay first derivative (SG-1st; window 11, second-order polynomial), which emphasizes absorption-edge features while suppressing baseline drift.
The proposed HSI-CARS-SVM approach
The proposed approach integrates CARS wavelength selection with SVM classification. CARS13 works as follows: in each of N = 50 Monte Carlo iterations, 80% of the spectra were randomly drawn to calibrate a PLS model, and the absolute values of the PLS regression coefficients were used as wavelength-importance weights. The number of retained variables is first reduced by an exponentially decreasing function, after which adaptive reweighted sampling preferentially retains variables with large coefficients. In the present implementation, the bands surviving each Monte Carlo iteration were recorded, and the 34 bands with the highest retention frequency across the 50 iterations are retained (frequency-stabilized CARS); this avoids the selection instability of picking a single minimum-error subset. Critically, within every validation fold, CARS was applied only to the MSC-preprocessed training spectra (the best-performing preprocessing, see the “Effect of preprocessing and benchmark comparison” sub-section), so that no information from held-out items enters the wavelength selection. The selected wavelengths were then used to train an SVM classifier with a radial basis function kernel (C = 10, gamma = scale, i.e., γ = 1 / (n features × s2), where s2 is the variance of the standardized training spectra; numerically γ = 8.26 × 10⁻³ for the 121-band spectra and 2.94 × 10⁻² for the 34-band subsets). All classifier hyperparameters (SVM C = 10; k-nearest neighbors (kNN) k = 5; random forest (RF) 300 trees; partial least-squares discriminant analysis (PLS DA) 10 latent variables) were fixed a priori following common practice in forensic spectral classification and were not tuned on any test-fold data. The motivation for this design is twofold: wavelength selection removes noisy and collinear bands and thereby compresses the feature space, while the maximum-margin SVM exhibits strong generalization in the resulting low dimensional, small-sample regime.
Benchmark machine learning models
Five conventional classifiers were benchmarked on the full 121-band spectra under each preprocessing strategy: SVM with a radial basis function (RBF) kernel (SVM-RBF C = 10), linear discriminant analysis (LDA), kNN k = 5, RF 300 trees and PLS-DA (10 latent variables), yielding 20 preprocessing-classifier combinations. All models were implemented in Python 3.12 with scikit-learn 1.9.
Evaluation schemes and metrics
Two complementary evaluation schemes were designed. Scheme A (random cross-validation) evaluates the interpolation ability of the models through repeated stratified five-fold cross-validation (five folds × five repetitions, 25 runs), in which spectra of the same stamp item may appear in both the training and test sets. Scheme A metrics are reported as mean ± standard deviation (SD) over the 25 runs (fixed random seed 42), and the confusion matrices shown for Scheme A correspond to the first repetition (a single five-fold run, seed 42). Scheme B (LOSO) evaluates the generalization ability to stamps never seen during training: the 600 spectra are grouped by the 12 physical stamp items, and 12-fold group cross-validation is performed in which all 50 spectra of one item form the test set in each fold. When spectra nested within the same physical item are randomly split across folds, information leakage inflates performance estimates; group-preserving (blocked) resampling is the recommended remedy.16 To obtain an unbiased estimate, Scheme B was implemented as a fully nested, group-aware pipeline: in each of the 12 folds, the MSC reference spectrum, the CARS wavelength selection and the classifier training were recalculated using only the 550 spectra of the 11 training items, and the 50 spectra of the held-out item were used exclusively for testing.17,18 The Monte Carlo sampling and the internal five fold cross-validation inside CARS involve only training-fold spectra; a stricter variant in which these internal splits are also group-aware was evaluated as a sensitivity analysis (Table S1, Supplementary Information (SI) section). Given the fixed seeds, the nested LOSO results of CARS-SVM are deterministic. Because performance estimates based on few independent items carry substantial uncertainty,19,20 per-item LOSO results are additionally reported (Table 3). LOSO mimics the practical forensic scenario of examining a previously unseen stamp and is therefore regarded as the primary performance indicator in this study. Accuracy, macro-averaged F1 score (macro-F1) and Cohen’s kappa coefficient (κ) were used as evaluation metrics.
Performance of the proposed CARS-SVM model compared with the best benchmark under the two evaluation schemes
Results and Discussion
Spectral characteristics of the four classes
The mean spectra of the four classes are shown in Figures 2 and 3. All four exhibit the typical spectral signature of red colorants: a pronounced absorption trough in the 500 570 nm region (minimum mean reflectance 0.356 0.440 at 550-555 nm), a steep reflectance rise between 580 and 620 nm (the “red edge”), and a high-reflectance plateau beyond 630 nm (> 0.80). Inter-class differences are expressed mainly in: (i) the depth of the absorption trough, which is deepest for laser-printed patterns (0.3557 at 550 nm) and shallowest for inkjet-printed patterns (0.4398 at 555 nm); (ii) the slope and position of the red edge; and (iii) the near-infrared plateau level, which is highest for photosensitive ink impressions (mean 0.8153) and lowest for laser-printed patterns (0.7423).

Mean spectra of the four types of stamp impressions (shaded area: ±1 standard deviation; n = 150 per class).

Band-wise one-way analysis of variance (ANOVA, Figure 4) shows that the most discriminative bands concentrate in the 575-615 nm red-edge transition region - the ten bands with the highest F values are 590, 595, 600, 585, 605, 580, 610, 615, 575 and 880 nm - consistent with the absorption transition of red colorants. Principal component analysis (PCA, Figure 5) reveals that the first two principal components account for 85.9% of the total variance (top five: 98.3%); laser-printed and inkjet-printed patterns form relatively distinct clusters, whereas the atomic ink and photosensitive ink impressions overlap considerably, indicating that these two stamped classes constitute the principal classification difficulty.


Effect of preprocessing and benchmark comparison
The results of the 20 preprocessing-classifier combinations under both evaluation schemes are summarized in Table 1 (top 10 by LOSO accuracy plus RAW controls; the complete results of all 20 combinations are given in Table S2 (SI section); random-CV values are means ± SD of 25 runs). Scatter-correction preprocessing (MSC and SNV) clearly outperforms RAW and SG-1st derivative across nearly all classifiers, confirming that suppressing scatter variations caused by stamping pressure, paper background and illumination is essential. The best benchmark combination is MSC-RF (LOSO accuracy 0.9417, κ = 0.9222). Notably, all models achieve higher accuracy under random cross-validation than under LOSO, and the gap is largest for the RAW preprocessing (e.g., RF drops from 0.9610 to 0.8100), which demonstrates that random splitting systematically overestimates practical performance because spectra of the same stamp item leak across the training and test sets.
CARS wavelength selection and CARS-SVM performance
CARS selected 34 characteristic wavelengths out of the 121 bands (a 71.9% dimensionality reduction), as shown in Figure 6. The selected wavelengths cluster in the 490 530 nm absorption-trough region, the 635 880 nm red edge to near infrared transition region and the 945 1000 nm near-infrared plateau; the complete list is 420, 490, 500, 520, 525, 530, 635, 660, 685, 720, 730, 740, 750, 755, 765, 770, 775, 780, 785, 790, 800, 820, 825, 830, 850, 855, 860, 865, 870, 875, 880, 945, 970 and 1000 nm. It is noteworthy that the bands with the highest ANOVA F values (575 615 nm, see the “Spectral characteristics of the four classes” sub-section) are not directly selected by CARS. Bands within this steep red-edge interval are strongly collinear with one another, so their discriminative information is largely captured by the selected flanking bands, which themselves still show elevated F values (e.g., 211 at 635 nm and 262 at 880 nm, versus 286 657 within 575 615 nm). ANOVA measures marginal univariate separability, whereas CARS selects a compact multivariate subset; the two approaches therefore complement rather than replicate each other. Across the 12 nested LOSO folds, the NIR bands 860-880 nm were selected in 10-12 folds, confirming the stability of the selection (Table S3, SI section).
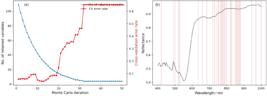
(a) CARS variable selection process and (b) the 34 selected characteristic wavelengths marked on the mean spectrum.
Built on these 34 wavelengths, and evaluated with the fully nested pipeline, the CARS-SVM model achieved an accuracy of 0.9967 ± 0.0062 (macro-F1 0.9967 ± 0.0062, κ 0.9956 ± 0.0083, 25 runs) under random cross-validation and, importantly, the highest LOSO performance among all 21 model configurations evaluated in this study: accuracy 0.9533, macro-F1 0.9523 and κ 0.9378 (Table 2). The per-class recalls under LOSO were 100% for atomic ink impressions, 82.7% for photosensitive ink impressions, 98.7% for laser-printed patterns and 100% for inkjet-printed patterns. Compared with the best full-spectrum benchmark (MSC-RF), CARS-SVM improves the LOSO accuracy by 1.2 percentage points (0.9533 vs. 0.9417) and the LOSO κ from 0.9222 to 0.9378, while using only 28.1% of the original features. The per-item analysis (Table 3) shows that this difference is within the item-to-item variability (SD across items 0.097 vs 0.090) and should be interpreted with appropriate caution.18,20 This confirms that wavelength selection acts as an effective regularizer in the small-sample, high-dimensional regime: by eliminating noisy and collinear bands, CARS reduces the risk of overfitting to item-specific spectral idiosyncrasies and yields the best LOSO performance within the present dataset.
Error analysis and overall comparison
The confusion matrices of the proposed CARS-SVM and the two best benchmarks (MSC-RF and SNV-RF, the two highest LOSO accuracies in Table 1) are shown in Figure 7. Under random cross-validation, CARS-SVM is essentially error-free (only one laser-printed spectrum misclassified as inkjet in the representative run, accuracy 0.9983, mean of 25 runs 0.9967 ± 0.0062). Under LOSO, the remaining errors concentrate almost exclusively on photosensitive ink impressions being misclassified as atomic ink impressions (18 spectra) and, to a lesser extent, as laser-printed patterns (8 spectra); two laser-printed spectra were misclassified as photosensitive. The atomic ink and inkjet-printed classes are recalled perfectly, and laser printing is recalled at 98.7%. The per-item results (Table 3) identify items 2-2 (accuracy 0.70) and 2-3 (0.78) as the dominant error sources of all top models: the mean spectrum of item 2-2 is nearly equidistant to the other photosensitive items (mean absolute difference 0.0130) and to the atomic-ink class (0.0151), indicating atypical ink deposition for this item. This pattern has a clear spectroscopic explanation: atomic and photosensitive stamp inks are both red oil-based colorant systems with nearly coincident absorption bands, differing only subtly in absorption depth and near-infrared reflectance; under LOSO, inter-item variations in ink formulation and stamping pressure enlarge the intra-class variance and blur the already narrow inter-class boundary.

Confusion matrices of the proposed CARS-SVM and the two best benchmarks (MSC-RF and SNV-RF) under the two evaluation schemes (colors: row-normalized proportions; numbers: spectrum counts; random-CV matrices: first repetition of the five-fold run, seed 42; LOSO matrices: pooled out-of-fold predictions of the nested evaluation).
Figure 8 compares all 21 model configurations. Three conclusions can be drawn: (i) a systematic gap of 2 15 percentage points exists between the two evaluation schemes, confirming that group-preserving validation gives the more honest and forensically relevant estimate for stamp impression discrimination. It is therefore recommended that validation protocols in this field preserve physical-sample groups, with LOSO being one suitable strategy for datasets organized as the present one;16,20 (ii) the proposed CARS-SVM ranks first under the nested LOSO evaluation (0.9533) while remaining among the best under random cross-validation (0.9967 ± 0.0062), demonstrating that its advantage does not stem from test set leakage; (iii) full-spectrum nonlinear ensembles (RF) form the second tier (0.9417), followed by kNN and LDA, whereas all RAW preprocessed models occupy the bottom, underlining the decisive role of scatter correction. Because the benchmark screening (Table 1) and the final evaluation (Tables 2 and 3) share the same 12 items, a mild model-selection bias cannot be fully excluded;18 the differences between the top models should therefore be read together with the per-item variability reported in Table 3.

Accuracy of the proposed CARS-SVM and all benchmark configurations under the two evaluation schemes (sorted by LOSO accuracy).
Conclusions
In this study, a non-destructive HSI-CARS-SVM approach was proposed for discriminating stamp impressions of four formation methods - atomic ink stamping, photosensitive ink stamping, laser printing and inkjet printing - from visible-near-infrared hyperspectral data (400-1000 nm, 600 spectra nested within 12 independent physical items, 121 bands). The main conclusions are as follows: (i) the spectral differences among the four classes are concentrated in the 500-570 nm absorption trough, the 575-615 nm red-edge region and the near-infrared plateau; ANOVA identifies the red-edge transition as the region of maximal univariate separability, while CARS selects a compact multivariate subset dominated by the flanking and near-infrared bands; (ii) scatter-correction preprocessing (MSC/SNV) is critical for model performance, and a systematic gap of 2-15 percentage points between random cross-validation and LOSO evaluation demonstrates that random splitting overestimates practical performance; validation protocols for forensic spectral classification should preserve physical-sample groups, and LOSO is one suitable strategy for the present dataset;16,17,20 (iii) CARS compressed the feature dimensionality by 71.9% (121 → 34 bands), and the resulting CARS-SVM model achieved the best LOSO performance within the present dataset of all 21 configurations (nested LOSO accuracy 0.9533, macro-F1 0.9523, κ 0.9378), outperforming the best full-spectrum benchmark (MSC-RF, 0.9417); (iv) classification errors concentrate between atomic and photosensitive stamp inks, in agreement with their spectral similarity, pointing to the direction for future improvement; (v) several limitations qualify the scope of these conclusions: the 600 spectra derive from only 12 independent physical items (three per class), and a single ink brand (Deli), one laser printer (HP), one inkjet printer (Epson) and one paper type were used. The present study should therefore be regarded as a controlled proof-of-concept demonstrating discrimination within this specific experimental domain; the reported performance cannot be assumed to transfer directly to other ink brands or lots, toner or cartridge types, printer models, substrates or acquisition sessions, and the models may partially encode ink-, toneror printer-specific characteristics rather than the formation method alone. Enlarging the number of independent stamp items, ink brands and lots, printer models and substrates is thus not only future work but a prerequisite for validating broader generalization.19,20 Within these limits, future work will also exploit the spatial texture information of impressions through spectral-spatial joint modeling and explore domain adaptation to further enhance cross-item generalization, with the ultimate goal of deploying the lightweight CARS-SVM model on portable hyperspectral devices for in-field questioned document examination.
Supplementary Information
Supplementary information is available free of charge at http://jbcs.sbq.org.br as PDF file.
Acknowledgments
The authors gratefully acknowledge the financial support provided by Research Fund Project of Yunnan Provincial Department of Education (2026J0799) and 230 Project of Yunnan Police College (202523001034ZR-003). During the preparation of this work, artificial intelligence (AI)-assisted tools (Kimi K3.0) were used to assist with language polishing. All outputs were reviewed, verified and edited by the authors, who take full responsibility for the integrity and content of this publication.
Data Availability Statement
The datasets and analysis codes supporting the findings of this study are available from the corresponding author upon reasonable request.
References
-
1 Silva, C. S.; Pimentel, M. F.; Honorato, R. S.; Pasquini, C.; Prats-Montalbán, J. M.; Ferrer, A.; Analyst 2014, 139, 5176. [Crossref]
» Crossref -
2 Khan, M. J.; Yousaf, A.; Abbas, A.; J. Electron. Imaging 2018, 27, 053001. [Crossref]
» Crossref -
3 López-Baldomero, A. B.; Buzzelli, M.; Moronta-Montero, F.; Martínez-Domingo, M. Á.; Valero, E. M.; Spectrochim. Acta, Part A 2025, 335, 125916. [Crossref]
» Crossref -
4 Gao, Z.; Li, X.; Zhang, J.; Li, F.; Lu, X.; Niu, Y.; Ye, Z.; Cheng, F.; Wang, X.; J. Braz. Chem. Soc. 2026, 37, e-20260082. [Crossref]
» Crossref -
5 Li, C.; Gao, S.; Microchem. J. 2025, 214, 114125. [Crossref]
» Crossref -
6 Wang, S.; He, H.; Lv, R.; He, W.; Li, C.; Cai, N.; J. Forensic Sci. 2022, 67, 550. [Crossref]
» Crossref -
7 Xie, Z.; Yu, Z.; Duan, X.; Han, X.; Qin, D.; Cui, W.; Yu, X.; Microchem. J. 2025, 209, 112689. [Crossref]
» Crossref -
8 Lu, X.; Zhang, J.; Wu, J.; Zhang, X.; Ren, H.; Chen, H.; Li, F.; Anal. Methods 2025, 17, 7722. [Crossref]
» Crossref -
9 Lu, X.; Zhang, J.; Li, F.; Wu, J.; Zhang, X.; Ren, H.; Ma, K.; Anal. Methods 2025, 17, 7519. [Crossref]
» Crossref -
10 Fu, P.; Cui, L.; Li, S.; Chin. J. Inorg. Anal. Chem. 2024, 14, 836. [Crossref]
» Crossref -
11 Lu, X.; Ma, K.; Li, F.; Zhang, J.; Zhang, X.; Wu, J.; Li, Z.; Zhang, J.; Ren, H.; Chen, H.; J. Instrum. Anal. 2025, 44, 2339. [Crossref]
» Crossref -
12 Zhou, Y.; Cui, L.; Zhang, C.; Li, S.; Fu, P.; Laser Optoelectron. Prog. 2025, 62, 1600001. [Crossref]
» Crossref -
13 Li, H.; Liang, Y.; Xu, Q.; Cao, D.; Anal. Chim. Acta 2009, 648, 77. [Crossref]
» Crossref -
14 Zhu, D.; Han, J.; Liu, C.; Zhang, J.; Qi, Y.; J. Food Compos. Anal. 2025, 137, 106880. [Crossref]
» Crossref -
15 Chandra, M. A.; Bedi, S. S.; Int. J. Inf. Technol. 2021, 13, 1. [Crossref]
» Crossref -
16 Roberts, D. R.; Bahn, V.; Ciuti, S.; Boyce, M. S.; Elith, J.; Guillera-Arroita, G.; Hauenstein, S.; Lahoz-Monfort, J. J.; Schröder, B.; Thuiller, W.; Warton, D. I.; Wintle, B. A.; Hartig, F.; Dormann, C. F.; Ecography 2017, 40, 913. [Crossref]
» Crossref -
17 Varma, S.; Simon, R.; BMC Bioinf. 2006, 7, 91. [Crossref]
» Crossref -
18 Cawley, G. C.; Talbot, N. L. C.; J. Mach. Learn. Res. 2010, 11, 2079. [Crossref]
» Crossref -
19 Ambroise, C.; McLachlan, G. J.; Proc. Natl. Acad. Sci. U. S. A. 2002, 99, 6562. [Crossref]
» Crossref -
20 Varoquaux, G.; NeuroImage 2018, 180, 68. [Crossref]
» Crossref


