Optimization of Psilocybin Extraction from Psilocybe cubensis Mushrooms and Characterization of the Fungal Extract
Abstract
Psilocybin is a molecule with significant potential for the treatment of mental disorders such as depression, anxiety, post-traumatic stress disorder, and substance abuse. In this study, it was explored the extraction of psilocybin from Psilocybe cubensis mushrooms using a factorial design approach, along with the physicochemical and phytochemical characterization of the extracted material, aiming to optimize the process. The results indicate that the optimal extraction conditions were achieved using an acidified ethanol solvent (without water addition) at pH 2 and at temperature of 25 °C. The maximum yield obtained was 50.03 mg of psilocybin g-1 of extract (ca. 1% psilocybin), which exceeds the values reported in the literature for similar studies, demonstrating the efficiency of the proposed method. Through liquid chromatography-mass spectrometry (LC-MS/MS) analysis, six compounds were annotated: the indole alkaloids psilocybin and psilocin, previously reported in the P. cubensis genus, and four additional compounds, sn-glycero-3-phosphocholine, norvaline, tetronomycin and N-(tetradecanoyl)-sphinganine, which have not previously been reported in the Psilocybe genus.
Keywords:
psilocybin; Psilocybe cubensis; extraction methods; optimization; factorial design
Introduction
In recent years, psilocybin has become the focus of numerous studies due to its promising results in the treatment of various mental disorders. In particular, it has shown potential for treating anxiety disorders, post-traumatic stress disorder, and depression, including treatment-resistant depression. Additionally, psilocybin has been explored for addressing addiction to various substances, such as alcohol, nicotine, opioids, and cocaine, as well as for migraine management.1,2
Psilocybin and its active metabolite, psilocin, share a close structural relationship with serotonin, enabling these alkaloids to bind to the same neurotransmitter receptors. Upon ingestion, psilocybin is metabolized into psilocin, which is capable of crossing the blood-brain barrier and interacting with serotonin receptors of the 5-hydroxytryptamine family (5-HT), with a higher affinity for 5-HT1A, 5-HT2A, and 5-HT2C receptors.3,4 Once in the brain, psilocin inhibits serotonin reuptake, a mechanism that underlies both its hallucinogenic effects and its antidepressant and anxiolytic potential.5
Currently, the only known natural sources of psilocybin are psychedelic mushrooms from the genera Psilocybe, Panaeolus, Gymnopilus, and Inocybe. Among these, the genus Psilocybe is the second-largest genus within the Hymenogastraceae family, encompassing approximately 350 species, and is considered the most promising for psilocybin production. Notably, Psilocybe cubensis is the most widely used species, as it ranks among the highest producers of psilocybin and psilocin, with psilocybin concentrations exceeding 1% of the dry mushroom mass.6 In addition to psilocybin and psilocin, P. cubensis produces four other indole alkaloids in minor quantities, classified as psiloid molecules: baeocystin, norpsilocin, aeruginascin, and norbaeocystin.7-10
Psilocin, the dephosphorylated form of psilocybin, is the pharmacologically active compound. However, P. cubensis produces psilocybin in quantities that are several times higher than its active form.11 Moreover, psilocin is highly unstable and readily degrades when exposed to environmental factors such as light, humidity, oxygen, and temperature. Consequently, psilocybin is considered the more suitable form for pharmaceutical applications.12
Given psilocybin’s vast medical and pharmaceutical potential, the development of efficient and scalable extraction methods has become a subject of great interest. While synthetic production of psilocybin has been known since the pioneering work of Swiss chemist Albert Hofmann in 1958,13 natural extraction from P. cubensis remains an attractive alternative due to lower production costs and the potential added benefits of the entourage effect, where multiple alkaloids present in fungal extracts may contribute synergistically to therapeutic effects.
A recent review work14 describes what are the most used and most efficient methods for psilocybin and psilocin extraction from Psilocybe cubensis mushrooms, among these methods, the ultrasound water bath with methanol as the extraction solvent is described as the best scenario to optimize the alkaloids extraction process. However, the use of this solvent can be a problem because of its toxicity. In this case, the use of more secure solvents, like ethanol and acetic acid, can be a solution to eliminate this problem.
In light of this, it is essential to devise optimized extraction conditions to maximize psilocybin yield. In this study, we experimentally investigated the extraction process using a factorial design approach and characterized the physicochemical and phytochemical properties of the resulting extract. Our goal was to establish a low-toxicity experimental procedure, using ethanol instead of methanol contrary to what is reported in the literature, capable of efficiently extracting and preserving psilocybin using simple extraction and drying techniques.
Experimental
Materials and reagents
In this study, dried P. cubensis mushrooms were used. The dried mushrooms were purchased by Laboratório de Avaliação e Desenvolvimento de Biomateriais do Nordeste (CERTBIO) from Rose Hill Life Sciences (Jamaica) under legal authorization granted by Brazilian Health Regulatory Agency (ANVISA), Special Authorization (Autorização Especial) AE No. 30/2024, for the importation and handling of this material. Psilocybin and psilocin standards (1 mg mL-1, Lipomed Document QC-CA-411L1 and QC-CA-410L1) were obtained from LAS do Brasil (Aparecida de Goiânia, Brazil). Additional reagents included 96% ethanol (Coalcool, Campina Grande, Paraíba, Brazil), formic acid P.A. (Neon, Suzano, São Paulo), acetic acid P.A. (Neon, Suzano, São Paulo), and high-performance liquid chromatography (HPLC)-grade acetonitrile (Sigma-Aldrich, Darmstadt, Germany).
Preparation of fungal material
The dried mushroom was frozen using liquid nitrogen (-196 °C) and subsequently ground with an agate mortar until a fine powder was obtained, with a predominant particle size of less than 170 mesh.
Ultrasound-assisted psilocybin extraction
For the extraction phase, each experiment utilized a mixture of 200 mg of mushroom powder and 8 mL of solvent in each composition. This mixture was subjected to an ultrasonic bath using a Q9.5/40a model device (Ultronique, Indaiatuba, São Paulo, Brazil) for 1 h, with bath temperatures ranging from 25 to 75 °C and solvent pH varying between 2 and 10.
After the extraction process, the resulting material was filtered, and the liquid phase was dried in an oven at 35 °C for approximately 12 h until a dry mass was obtained. The remaining mushroom powder was returned to the extraction vessel with an additional 8 mL of solvent. The process was repeated five more times, until a paste-like extract containing psilocybin was obtained.
Data collection and analysis
Chromatographic analyses were performed using a high-performance liquid chromatograph (HPLC) Flexar Series 200 (PerkinElmer Inc., Waltham, Massachusetts, USA) coupled with a Photo Diode Array (PDA) Flexar Detector (PerkinElmer Inc., Waltham, Massachusetts, USA). The software used for chromatographic data processing was Chromera 3.0 (PerkinElmer Inc., Waltham, Massachusetts, USA). Chromatographic separations were carried out on a Browlee Validated column (150 mm × 0.46 mm ID × 5 μm) with a pore size of 100 Å (PerkinElmer Inc., Waltham, Massachusetts, USA).
The chromatographic run was performed in gradient mode, with a mobile phase consisting of a mixture of two solvents (A and B). Solvent A was water acidified with 0.3% formic acid, while solvent B was acetonitrile acidified with 0.3% formic acid.
The mobile phase composition varied as follows: 5% phase B for 2.5 min, 5% to 30% phase B over 7.3 min, held at 30% phase B for 0.5 min, 30 to 98% phase B over 0.5 min, held at 98% phase B for 7 min and, finally, returned to the initial condition within 0.2 min, followed by re-equilibration for 5 min. The injection volume was 15 μL per sample, with a mobile phase flow rate of 0.8 mL min 1. The total runtime was 17.9 min, and the column oven temperature was maintained at 30 °C.
After fungal material extraction, the solvent-free extract was analyzed by HPLC at a concentration of 1 mg of extract per 1 mL of mobile phase, composed of 5% acetonitrile and 95% acidified water. The peak areas obtained from the chromatograms were quantified using a previously developed and validated quantification methodology,15 with a calibration curve covering a concentration range of 5-100 mg L-1, described by the following equation:
Experimental design
The 23 factorial design methodology, including three central point replicates, was selected based on the characteristics of the variables under analysis. The mathematical model was adjusted to a polynomial equation (equation 2). Mathematical and statistical data processing was performed using Statistica software (version 12.5, StatSoft Inc., Tulsa, OK, USA, 2014).
Two levels (-1 and +1) were used, along with central point replicates, to evaluate the effects of pH, temperature, and the water-to-ethanol ratio (in the composition of the extraction solvent) on the psilocybin concentration obtained from P. cubensis extracts. The values for each level of each variable are shown in Table 1. Additionally, certain parameters were kept constant throughout the process: the powder-to-liquid ratio was maintained at 1:40, and the ultrasonic bath extraction time was fixed at 1 h. After extraction, the liquid phase was filtered, and the solid residue was reprocessed under the same conditions five additional times.
The regression coefficients of the mathematical model, as well as the F and P values, were obtained through analysis of variance (ANOVA). Response surface plots were also generated, allowing the evaluation of interactions between the levels of two independent variables while keeping the third variable constant at its central level. This analysis aimed to determine which independent variables and their corresponding levels would result in the maximum psilocybin yields.
Determination of the pH of the optimized extract
The pH of the P. cubensis extract was measured using a bench-top pH-meter equipped with a ST2200-F microsensor (Ohaus, Parsippany, NJ, USA). For this analysis, 25 mg of the crude extract were weighed and dissolved in 1.5 mL of ultrapure water.
Thermogravimetric curve
The determination of volatile material content in the paste-like extract was performed using thermogravimetric analysis (TGA), which allowed the evaluation of the transient mass history of the mushroom extract as a function of the applied temperature. For this analysis, 6.387 mg of the extract were used, and a heating rate of 10 °C min-1 was applied, enabling a temperature variation from 30 to 1000 °C. The mass values measured by the equipment’s balance were used to construct the mass vs. temperature curve.
Determination of density
The density of the paste-like extract was determined using the following procedure. Initially, 100 mg of the extract were weighed and transferred into a 5 mL pycnometer, which was completely dry and had its mass determined beforehand using an analytical balance. Then, ultrapure water was added to fill the pycnometer completely. A thermometer was attached to the system, and the mass of the entire assembly was measured on the analytical balance, followed by the measurement of the mass of the pycnometer containing water and the extract. At the end of each experiment, the pycnometer was cleaned with ultrapure water until no residue of the extract remained. It was then refilled with water, and its mass was measured.16,17 Finally, the density of the mushroom extract was determined using the following mathematical relation:
where: mext is the mass of the sample, mpic+H2O is the mass of the pycnometer with the water used in the analysis, and mpic+H2O+ext is the mass of the system containing both water and the sample.
Liquid chromatography-mass spectrometry (LC-MS) and molecular network analysis of Psilocybe cubensis extract
The chromatographic analysis was made in a LC 40D X3 (Shimadzu, Kyoto) instrument composed by the modules of DGU-40S degasser (Shimadzu, Kyoto), LC 40D X3 pump (Shimadzu, Kyoto), SIL-40C X3 autosampler (Shimadzu, Kyoto), CTD-40S column oven (Shimadzu, Kyoto) and the detector was the LCMS-9050 (Shimadzu, Kyoto). The separations were carried out in the column C18 (Kromasil-250 mm × 4.6 mm × 5.0 µm), the injection volume was 20 μL, the sample concentration was 200 μg mL-1. To perform the analysis, was used a linear gradient of 0.1% formic acid in water (solvent A) and acetonitrile (solvent B) ranging from 5% of B to 100% of B in 60 min, the applied flow was 0.6 mL min-1 and the oven temperature was 40 °C.
The mass spectrometry analysis was carried in the positive mode with an electron spray ionization, the most suitable for alkaloids. Mass spectrometer parameters: capillary voltage: 4.0 kV, the nebulizer gas flow was 3.0 L min-1, the drying gas flow was 10 L min-1, the interface temperature was 300 °C. The analyzed mass range was 100 1200 m/z and the collision energy varied from 5 to 55 eV.
Mass spectrometry (MS) data processing and molecular networking analysis
Mass spectral data were imported to MZWizard, part of the MZMine software (version 4.7.29.0, mzio GmbH, Bremen, Germany, 2025), in LCD format.18 This process was used to construct the feature tables and metadata file that were uploaded to the Global Natural Products Social Molecular Networking (GNPS) data analysis portal in one group. The sample group was colored as a green button to mushroom extract. This dataset was used in the construction of a molecular networking dataset using the feature_based_molecular_networking_workflow (release version 2025.08.18).19 The precursor ion mass tolerance was set to 0.01 Da and a MS/MS fragment ion tolerance of 0.1 Da. A network was then created where edges were filtered to have a cosine score above 0.7 and greater than 6 matched peaks. Further, edges between two nodes were kept in the network if and only if each of the nodes appeared in each other’s respective top 10 most similar nodes.
These data were also submitted to SIRIUS software (version 6.3.3, Bright Giant GmbH, Jena, Germany, 2025) for molecular formula prediction based on exact mass and isotopic patterns. Structural annotation was performed using the CSI:FingerID module, with comparison to databases such as PubChem and bioDB. The annotations obtained were used in the dereplication process, allowing the putative identification of known compounds and the prioritization of relevant ions for subsequent structural analyses.
Determination of metals cations
The determination of cadmium and lead content in the ethanolic extract was performed using an inductively coupled plasma optical emission spectrometer (ICP-OES), model Optima™ 8000 (PerkinElmer Inc., Waltham, Massachusetts, USA), equipped with an axial torch and coupled with a Scott chamber nebulizer (PerkinElmer Inc., Waltham, Massachusetts, USA). The detection system was based on charge-coupled devices (CCD).
The analysis parameters included a plasma radiofrequency power of 1300 W, plasma gas flow of 8 L min-1, auxiliary gas flow of 0.2 L min-1, nebulizer gas flow of 0.7 L min-1, and peristaltic pump flow of 1 mL min 1. Besides that, the wavelengths for the elements were set as follows: for cadmium λ = 228.802 nm and for lead λ = 220.353 nm.
A total of 250 mg of the extract were used for sample digestion, performed with a Titan MPS™ microwave furnace (PerkinElmer Inc., Waltham, Massachusetts, USA) following the Titan MPS™ microwave digestion procedure. The digestion procedure involved adding 250 mg of the sample into a 100 mL vial along with 5 mL of HNO3 and 3 mL of H2O2, which was then placed in the microwave for 10 min. Finally, the resulting material was subjected to analysis, which was performed in triplicate.
Results and Discussion
Model fitting
The optimization experiment using the 23 factorial design aimed at maximizing the psilocybin content in the extract obtained from Psilocybe cubensis mushrooms. To achieve this, the effects of the ethanol/water ratio, pH, and temperature of the extracting solvent on the psilocybin yield in the mushroom extract were evaluated from the adjustment of the polynomial equation (equation 3). The psilocybin concentration data, it was demonstrated by analysis of the variance that the coefficients of the equation 4 related to the pH and ethanol percentage variables, as well as the linear interaction between these two variables, were significant at the p < 0.05 significance level. Furthermore, a coefficient of determination (R2) of 0.93432 was obtained for the model, and a p-value greater than 0.05 indicated a good prediction capacity and a strong fit of the model, described by the following equation:
The data from the analysis of variance can be observed in Table 2.
Analysis of variance (ANOVA) of the factorial design variables for the best experimental condition determination
Analysis of psilocybin content in the extracts from the factorial design experiments
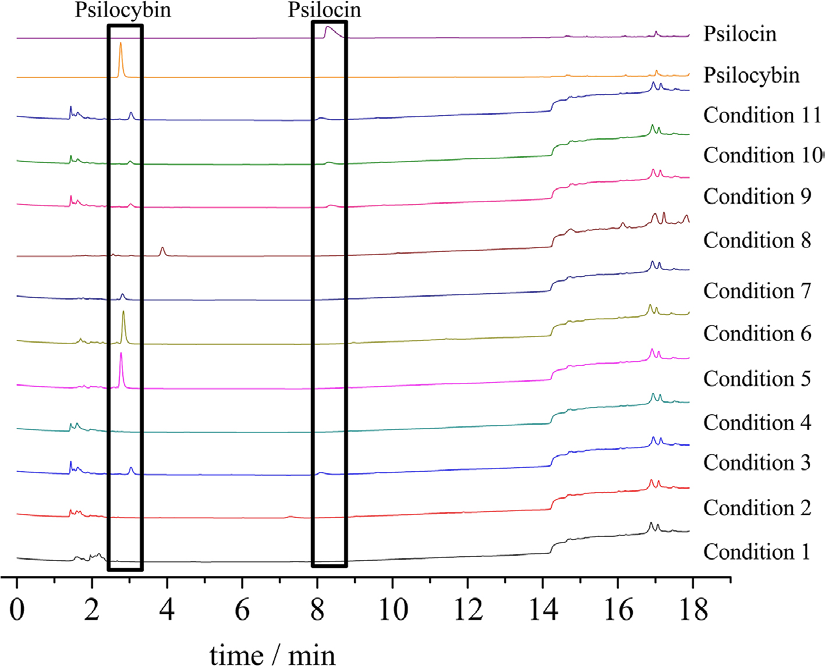
Psilocybin was identified by comparing the extract with its analytical standard, as shown in Figure 1. The variation in psilocybin concentrations found in this study, applying the factorial design, ranged from 5 to 50 mg of the desired compound per g of extract, which corresponds to a range of 0.1 to 1.0% psilocybin by dry mass of the mushroom powder, covering all combinations of variables applied in the extraction process (Table 3). When reviewing the literature for previously observed psilocybin levels in the biomass of the studied mushroom, the concentration range found varies from 0.01 to 1%, indicating that the results obtained are within the yield range reported in the literature for this species using methanol.7,20,21
Psilocybin concentration in each factorial design experiment conditions applied in the extraction process
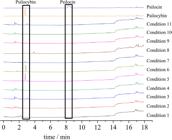
The maximum psilocybin concentration obtained in this study was 50.03 mg of psilocybin per g of extract, achieved using a combination of 25 °C temperature, pH = 2, and a 100% ethanol (EtOH) solution without any added water in the extraction solvent. Additionally, the solid-to-liquid ratio was 1:40, with a total extraction time of 6 h, divided into six consecutive 1-h extractions. This extraction duration aligns with values reported in the literature, which range from 30 min to over 10 h.22-24 In contrast, the lowest psilocybin concentration (5.01 mg g-1) was obtained under 75 °C, pH = 2, and an extraction solvent composed of 20% EtOH/H2O, while maintaining the same extraction time, number of extractions, and solid-to-liquid ratio as in the optimal condition.
The results obtained from the factorial design experiments indicate that increasing the proportion of ethanol in the extraction solvent and decreasing the pH leads to a higher yield of psilocybin extraction. This increase in concentration aligns with expectations for alkaloids, which are natural bases commonly extracted under acidic conditions.25 Conversely, when a high content of water was used in the extraction solvent, along with higher temperatures and the presence of alkaline agents, a decrease in the concentration of the target compound was observed (Table 3 and Figure 1). This is attributed to the reactivity of the molecule, which undergoes degradation when exposed to high humidity, elevated temperatures, and atmospheric oxygen, leading to the formation of blue-colored derivatives.8,12 Thus, the use of organic solvents and lower temperatures proves to be beneficial for the extraction process.
The chromatograms (Figure 1) also reveal the presence of psilocin under certain experimental conditions, suggesting that psilocybin hydrolysis may be occurring in these experiments.
Analysis of the effect of temperature, pH, and solvent composition on the yield of the psilocybin extraction process
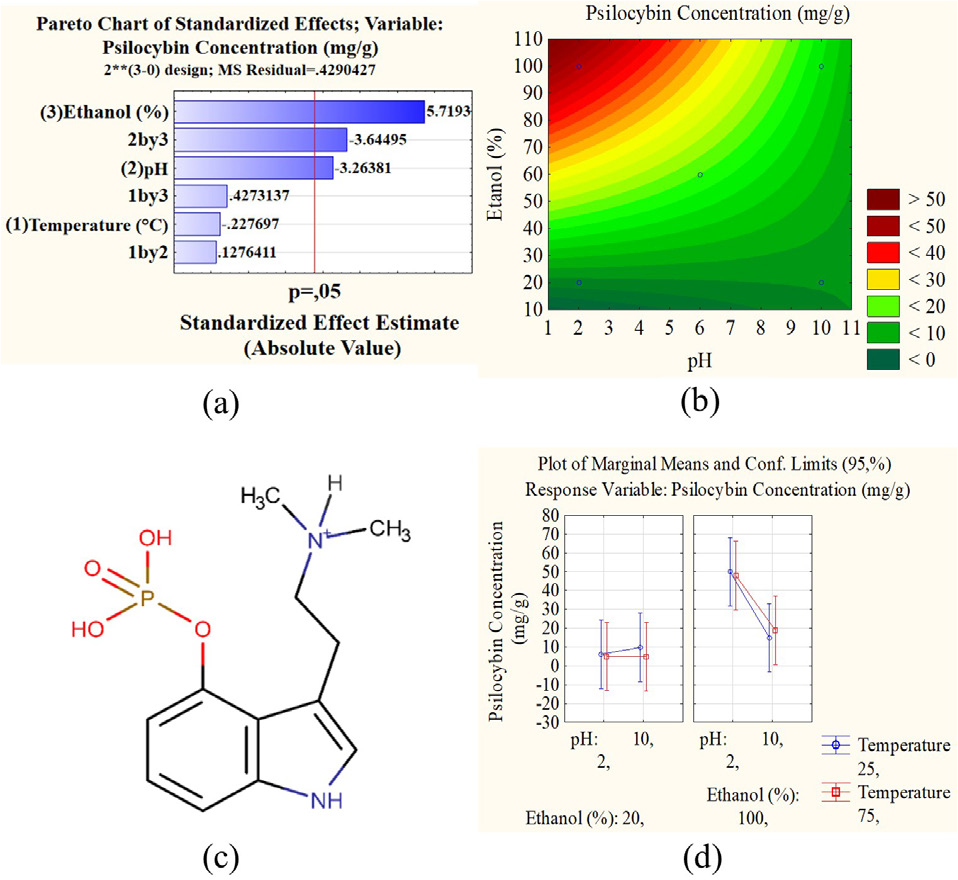
The results indicate that the use of polar organic solvents with low or no water content in the extraction process leads to better yields of psilocybin extraction. Evaluating the Pareto diagram (Figure 2a), it can be observed that only two linear variables have a significant effect on the result: pH and the composition of the extracting solvent. Furthermore, the interaction between these two variables also influenced the process.
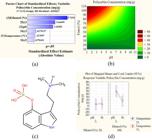
(a) Pareto diagram for the factorial design model; (b) water × pH interaction graphic; (c) psilocybin; (d) plot of marginal means for factorial design model.
It was observed that the most influential variable in the process is the proportion of ethanol in the extracting solvent, as the highest levels of psilocybin extraction occur when the solvent consists of 100% ethanol, without the addition of water. For this factor, the ANOVA shown in Table 2 indicates a p-value < 0.05, making this variable significant for increasing psilocybin concentration. Under this condition, a concentration of 50.03 mg of psilocybin per gram of extract was observed, similar to what is reported in the literature when compared to the use of pure methanol and its mixtures with water, where a reduction in recovered psilocybin levels is observed in the latter condition.26 The yield of 50.05 mg g-1 is equivalent to 1% psilocybin per gram of mushroom. Similar yields are found when the extraction process is performed for the same species using methanol, but this value is approximately ten times higher than what the literature reports for hydro-methanolic mixtures.26-28
Regarding pH, this parameter also influences the extraction process, where, through variance analysis, a p-value < 0.05 was obtained. An increase in psilocybin concentration is achieved in an acidic medium, whereas in a basic medium, lower psilocybin concentrations are predominant. This behavior is reported in the literature and is explained by the fact that, in an alkaline environment, psilocin loses the hydroxyl proton from the indole ring and undergoes oxidation due to the formation of a quinonoid intermediate in the presence of oxygen.12
In addition to variance analysis, a response surface graph was evaluated to determine the pH level that enhances the concentration of the desired compound. These analyses show that psilocybin concentration increases with medium acidification, with the highest value observed at pH = 2, where concentrations of 50.01 and 47.9 mg of psilocybin per gram of extract were found, respectively (Figure 2b).
The increase in concentration at this level of the variable may be related to the ionization state of the molecule, as at this pH, the molecule is protonated at the nitrogen of the lateral chain of the indole ring, promoting increased solubility of the compound in polar solvents (Figure 2c).
In continuation of the ANOVA analysis of the mathematical model already presented, it can be verified that temperature was not an influential factor in the psilocybin extraction process. This can be confirmed through the mean plot shown in Figure 2d, which not only demonstrates that this variable is not significant but also shows that both at 25 and 75 °C, the results obtained for the concentrations of the compound were statistically identical, indicating that the temperature at 25 °C can be used for the extractions without loss of yield. This is a positive factor, as the combination of water with temperature leads to the dephosphorylation of psilocybin into psilocin and subsequently its oxidation.29
Within the set of levels and factors evaluated, it can be observed that the best results are obtained with the combination of a temperature of 25 °C, a solvent extractor pH of 2, and an extractor solvent composed of anhydrous ethanol. Under these conditions, concentration levels superior to 50 mg of psilocybin per gram of mushroom extract were obtained, similar to those found for the Psilocybe genus.8,30
When comparing the result obtained with literature data, it is observed that the yield achieved through ultrasound-assisted extraction, as proposed in this research, is at least five times higher than the yields obtained under optimized conditions reported by Polo-Castellano et al.28 Furthermore, the proposed psilocybin extraction route uses ethanol as the extractor solvent, which does not present toxicological problems when compared to the use of methanol, which is more conventionally used as reported in the literature.8,28
Physicochemical analysis of the mushroom extract
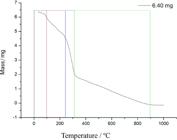
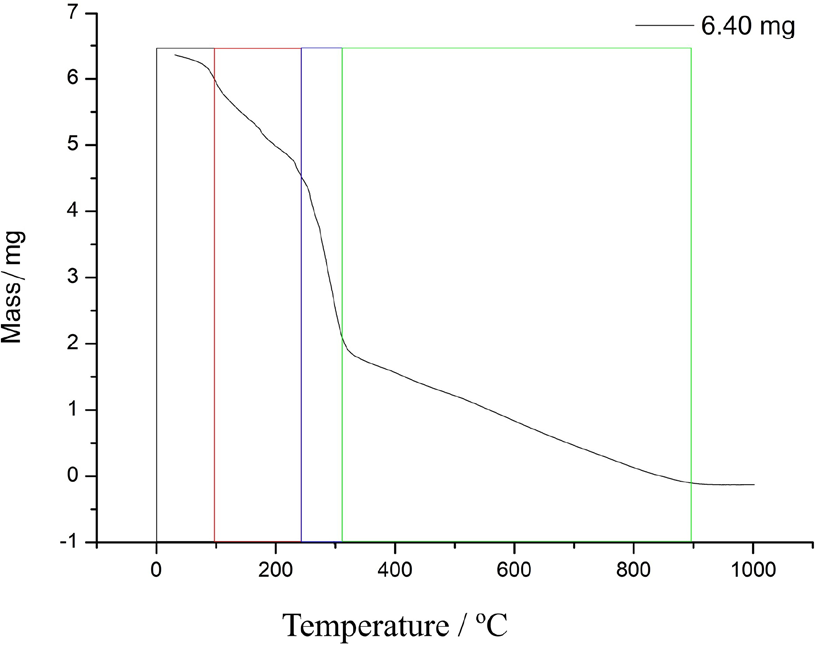
The mushroom extract, obtained under the best experimental condition, was subjected to physicochemical characterization using the Brazilian pharmacopoeia as the primary reference.16 The extract, dissolved in ultrapure water, exhibited an acidic character with a pH of 4.67 and a density of 3.9 g cm-3. The volatile material content was also determined through thermogravimetric analysis, where a mass loss of 2-3% was observed in the temperature range of 30 to 100 °C, which could be related to the loss of water and volatile metabolites present in the mushroom. Through this analysis, other regions of mass loss were observed, which may be related to the degradation of hemicellulose, cellulose, and lignin, as shown in Figure 3. Additionally, the analysis of cadmium and lead concentrations confirmed values of 0.043 ppm for cadmium and 0.000 ppm for lead, which are within the allowable daily exposure limits, as reported in the USP 232 standard.31
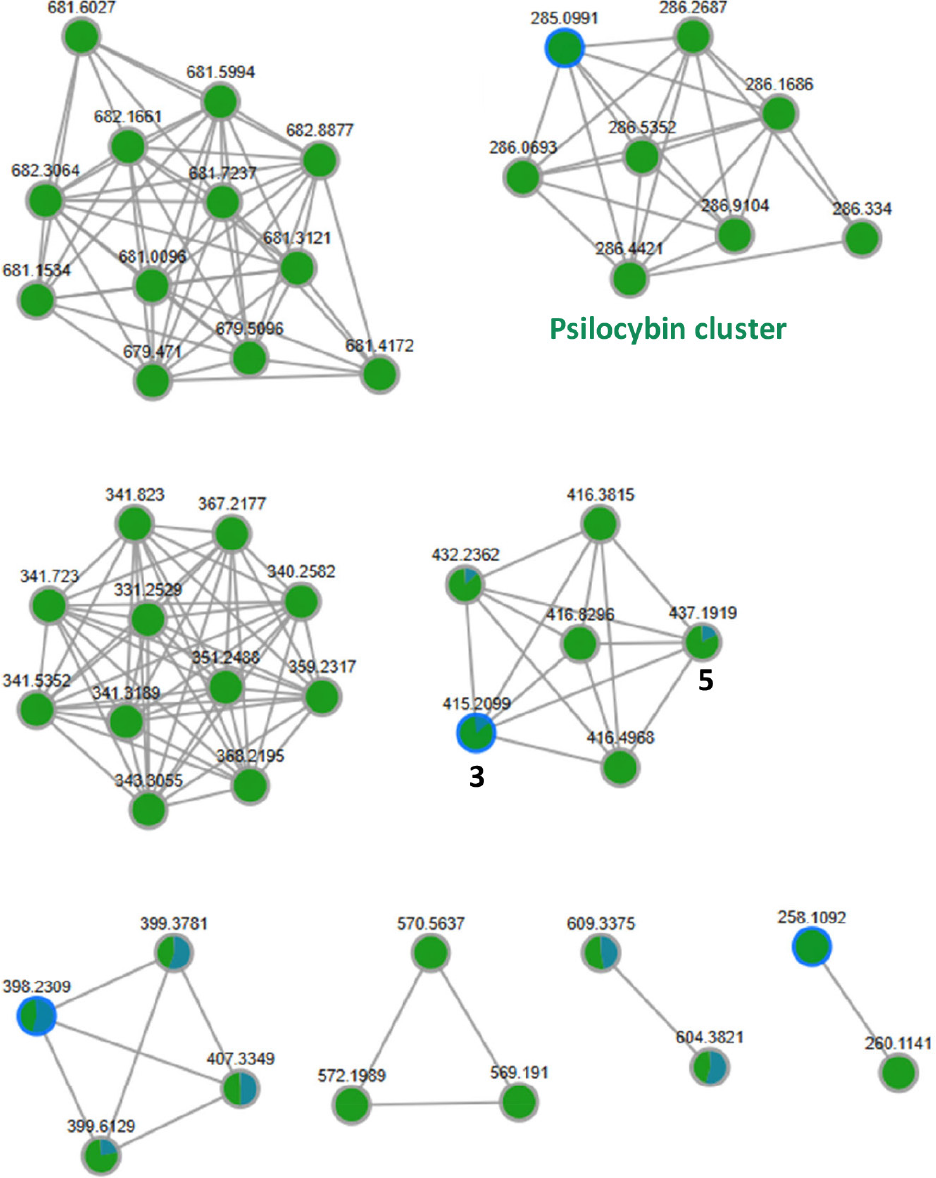
The mushroom extract was analyzed by LC-MS/MS and the resulting chromatogram (Figure S1, Supplementary Information (SI) section) and mass spectra were used to construct a molecular network and a dereplication table (Table 4) aiming to evaluate its chemical composition. Inside the GNPS2 webpage the molecular network was constructed (Figure 4) and revealed only two compounds previously reported in Psilocybe mushrooms: psilocybin (compound 1: m/z 285.0992), exhibiting an MS/MS spectrum (Figure S2, SI section) with a base peak at m/z 204 resulting from the characteristic loss of 81 amu, attributed to a phophoryl loss, other losses observed were of dimethylamino group (m/z 240 and the loss of 45 amu) and the two groups simultaneously (m/z 180 and the loss of 125 amu). The second compound annotated is psilocin (compound 2: m/z 205.1326), exhibiting an MS/MS spectrum (Figure S3, SI section) with a base peak at m/z 142 resulting from the characteristic loss of 63 amu, attributed to a dimethylamino and hydroxyl group loss. Another fragment was observed with m/z 115, attributed to a 27 amu HCN loss. Psilocybin was highlighted in blue within its cluster, while psilocin, due to its low signal and coelution with psilocybin, appeared only in the chromatogram (Figure S1, SI section).32 The annotation was made through the MS and MS/MS spectra (Figures S2 and S3) and comparison with literature data.
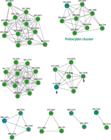
Two additional molecules were annotated through GNPS molecular network: sn-glycero-3-phosphocholine (compound 3: m/z 258.1092) exhibiting an MS/MS spectrum (Figure S4, SI section) with a base peak at m/z 184 resulting from the loss of 74 amu, attributed to a glyceryl group loss and a second loss with m/z 166 attributed to the dehydration of the last fragment, it needs to be highlighted that this compound is a phospholipid reported as a cell membrane component in the specie Beauveria bassiana.33-36 The second compound annotated through GNPS molecular network is tetronomycin (compound 5: [M + Na]+ m/z 609.33763) exhibiting an MS/MS spectrum (Figure S6, SI section) with a base peak at m/z 263 resulting from the loss of 346 amu, attributed to a partial polyketide loss, a second loss with m/z 207 attributed to two carbonyl, one hydroxyl and a CH2 groups of the last fragment, it needs to be highlighted that this compound is classified as a polyketide and some mushrooms can naturally produce this type of metabolites, but this specific compound has only be reported as a bacterial product and was not observed as a mushroom product before, this way this compound was annotated and for the first time related to a mushroom extract product.37,38
Other two compounds were annotated through SIRIUS software with the LC-MS/MS results and comparison with literature data, norvaline and N-(tetradecanoyl)-sphinganine. Norvaline (compound 4: [2M + H]+ m/z 235.16427 and [M + H]+ m/z 118.08551) is a non-proteinogenic amino acid that occurs in some edible mushroom species, like Pleueotus ostreatus, exhibiting an MS/MS spectrum (Figure S5, SI section) with a peak at m/z 58 resulting from the loss of 60 amu, attributed to a propyl loss and the carboxylic acid reduction to aldehyde with the loss of an oxygen atom.39 N-(Tetradecanoyl)-sphinganine (compound 6: [M + H]+ m/z 512.50154) is a dihydroceramide that is classified as a sphingolipids and has not been reported in the literature as a mushroom product, but this specific class is a common mushroom product and are essential lipids in species like Beauveria bassiana, the MS/MS spectrum of the compound’s peak (Figure S7, SI section) showed a signal at m/z 283 resulting from the loss of 229 amu, attributed to a tetradecanoyl group loss and a signal at m/z 256 attributed to a hydroxyl group loss from the last fragment.36
This observation aligns with recent literature reviews, which indicate that, up to 2025, only 37 compounds have been isolated and described to the entire Psilocybe genus. Among these, only compounds 1 and 2 (psilocybin and psilocin) are consistently reported, highlighting the limited chemical characterization of the genus.4 All compounds annotated are shown in the chromatogram (Figure S1), and their MS and MS/MS spectra are presented in Figures S2 S7. Even though other peaks of high intensities can be seen in chromatogram it is not possible to annotate them through molecular network, it was not identified any correspondence in GNPS library and other literature sources.
Conclusions
The extraction of psilocybin is of great scientific and industrial interest due to its antidepressant and anxiolytic properties, making it a valuable therapeutic molecule for the treatment of both conditions. This research focused on the extraction process of psilocybin from the Psilocybe cubensis mushroom using factorial design techniques. This allowed for the optimization of the psilocybin extraction process, achieving yields of up to 50.03 mg g-1 of psilocybin per gram of extract. This result was obtained using ethanol as the extraction solvent, acidified to pH = 2, at room temperature, with the extraction process conducted in an ultrasonic bath. Additionally, it was determined that the extract has an acidic pH, low moisture (ca. 3%), and that its metal cations concentrations are below the daily exposure limits. Thus, the proposed extraction method provides higher yields of psilocybin compared to methods indicated in other similar studies that use methanol as an extraction solvent, eliminating the toxicity problem associated with the solvent. Finally, through the use of molecular network technique it was possible to annotate four compounds that were not previously described to the Psilocybe mushroom genus, sn-glycero-3-phosphocholine, norvaline, tetronomycin and N-(tetradecanoyl)-sphinganine, thereby contributing to a better understanding of the chemical composition of these mushrooms.
Supplementary Information
Supplementary information, containing detailed data related to mass spectrometry and chromatographic analysis, including molecular formula, adduct, mass accuracy, retention time, is available free of charge at http://jbcs.sbq.org.br as PDF file.
Supplementary PDF
Acknowledgements
The authors are grateful to the CAPES-Brazil, Finep and CNPq-Brazil for financial support. We also extend our special thanks to Biocase Brasil, represented by Dr Cesar da Câmara Segre, for their valuable partnership.
Data Availability Statement
All data generated or analyzed during this study are available in the text of the article.
References
-
1 Lowe, H.; Toyang, N.; Steele, B.; Valentine, H.; Grant, J.; Ali, A.; Ngwa, W.; Gordon, L.; Molecules 2021, 26, 2948. [Crossref]
» Crossref -
2 Zhuk, O.; Jasicka-Misiak, I.; Poliwoda, A.; Kazakova, A.; Godovan, V. V.; Halama, M.; Wieczorek, P. P.; Toxins 2015, 7, 1018. [Crossref]
» Crossref -
3 Goodwin, G. M.; Croal, M.; Feifel, D.; Kelly, J. R.; Marwood, L.; Mistry, S.; O’Keane, V.; Peck, S. K.; Simmons, H.; Sisa, C.; Stansfield, S. C.; Tsai, J.; Williams, S.; Malievskaia, E.; Neuropsychopharmacology 2023, 48, 1492. [Crossref]
» Crossref -
4 Zhang, L.; Wei, J.; Huang, Y.; Wang, L.; Gao, H.; Yang, Y.; J. Colloid Interface Sci. 2025, 679, 1079. [Crossref]
» Crossref -
5 Tylš, F.; Vejmola, Č.; Koudelka, V.; Piorecká, V.; Kadeřábek, L.; Bochin, M.; Novák, T.; Kuchař, M.; Bendová, Z.; Brunovský, M.; Horáček, J.; Pálení ček, T.; Front. Neurosci. 2023, 17, 1152578. [Crossref]
» Crossref -
6 Catalogue of Life. [Link] accessed in April 2026
» Link -
7 Beug, M. W.; Bigwood, J.; J. Ethnopharmacol. 1982, 5, 271. [Crossref]
» Crossref -
8 Gotvaldová, K.; Hájková, K.; Borovička, J.; Jurok, R.; Cihlářová, P.; Kuchař, M.; Drug Test. Anal. 2021, 13, 439. [Crossref]
» Crossref -
9 Lenz, C.; Wick, J.; Hoffmeister, D.; J. Nat. Prod. 2017, 80, 2835. [Crossref]
» Crossref -
10 Tsujikawa, K.; Kanamori, T.; Iwata, Y.; Ohmae, Y.; Sugita, R.; Inoue, H.; Kishi, T.; Forensic Sci. Int. 2003, 138, 85. [Crossref]
» Crossref -
11 Laussmann, T.; Meier-Giebing, S.; Forensic Sci. Int. 2010, 195, 160. [Crossref]
» Crossref -
12 Lenz, C.; Dörner, S.; Sherwood, A.; Hoffmeister, D.; Chem. - Eur. J. 2021, 27, 12166. [Crossref]
» Crossref -
13 Hofmann, A.; Heim, R.; Brack, A.; Kobel, H. J. E.; Experientia 1958, 14, 107. [Crossref]
» Crossref -
14 Galdino, T. P.; Oliveira, L. C.; Luz, M. A.; Jesus, R. A.; Lima, E. P. N.; Torres, M. C. M.; Sivieri, K.; Afonso, V. I.; Delgado, J. M. P. Q.; Lima, A. G. B.; Silva, S. M. L.; Fook, M. V. L.; Pharmaceuticals 2025, 18, 380. [Crossref]
» Crossref -
15 Pereira Galdino, T.; Oliveira, L. C.; Luz, M. A.; Costa Barbosa, R.; Torres, M. C. M.; Sivieri, K.; Fernandes, P. A.; Santos, M. L.; Lima, A. G. B.; Silva, S. M. L.; Fook, M. V. L.; ACS Omega 2025, 10, 30695. [Crossref]
» Crossref - 16 Farmacopeia Brasileira, 6th ed., vol. 1; ANVISA: Brasília, Brazil, 2019.
-
17 Rabb, U. N.; GSC Biol. Pharm. Sci. 2024, 26, 006. [Crossref]
» Crossref -
18 Schmid, R.; Heuckeroth, S.; Korf, A.; Smirnov, A.; Myers, O.; Dyrlund, T. S.; Bushuiev, R.; Murray, K. J.; Hoffmann, N.; Lu, M.; Sarvepalli, A.; Zhang, Z.; Fleischauer, M.; Dührkop, K.; Wesner, M.; Hoogstra, S. J.; Rudt, E.; Mokshyna, O.; Brungs, C.; Ponomarov, K.; Mutabdžija, L.; Damiani, T.; Pudney, C. J.; Earll, M.; Helmer, P. O.; Fallon, T. R.; Schulze, T.; Rivas-Ubach, A.; Bilbao, A.; Richter, H.; Nothias, L.-F.; Wang, M.; Orešič, M.; Weng, J.-K.; Böcker, S.; Jeibmann, A.; Hayen, H.; Karst, U.; Dorrestein, P. C.; Petras, D.; Du, X.; Pluskal, T.; Nat. Biotechnol. 2023, 41, 447. [Crossref]
» Crossref -
19 Wang, M.; Carver, J. J.; Phelan, V. V.; Sanchez, L. M.; Garg, N.; Peng, Y.; Nguyen, D. D.; Watrous, J.; Kapono, C. A.; Luzzatto Knaan, T.; Porto, C.; Bouslimani, A.; Melnik, A. V.; Meehan, M. J.; Liu, W.-T.; Crüsemann, M.; Boudreau, P. D.; Esquenazi, E.; Sandoval-Calderón, M.; Kersten, R. D.; Pace, L. A.; Quinn, R. A.; Duncan, K. R.; Hsu, C.-C.; Floros, D. J.; Gavilan, R. G.; Kleigrewe, K.; Northen, T.; Dutton, R. J.; Parrot, D.; Carlson, E. E.; Aigle, B.; Michelsen, C. F.; Jelsbak, L.; Sohlenkamp, C.; Pevzner, P.; Edlund, A.; McLean, J.; Piel, J.; Murphy, B. T.; Gerwick, L.; Liaw, C.-C.; Yang, Y.-L.; Humpf, H.-U.; Maansson, M.; Keyzers, R. A.; Sims, A. C.; Johnson, A. R.; Sidebottom, A. M.; Sedio, B. E.; Klitgaard, A.; Larson, C. B.; Boya, P. C. A.; Torres-Mendoza, D.; Gonzalez, D. J.; Silva, D. B.; Marques, L. M.; Demarque, D. P.; Pociute, E.; O’Neill, E. C.; Briand, E.; Helfrich, E. J. N.; Granatosky, E. A.; Glukhov, E.; Ryffel, F.; Houson, H.; Mohimani, H.; Kharbush, J. J.; Zeng, Y.; Vorholt, J. A.; Kurita, K. L.; Charusanti, P.; McPhail, K. L.; Nielsen, K. F.; Vuong, L.; Elfeki, M.; Traxler, M. F.; Engene, N.; Koyama, N.; Vining, O. B.; Baric, R.; Silva, R. R.; Mascuch, S. J.; Tomasi, S.; Jenkins, S.; Macherla, V.; Hoffman, T.; Agarwal, V.; Williams, P. G.; Dai, J.; Neupane, R.; Gurr, J.; Rodríguez, A. M. C.; Lamsa, A.; Zhang, C.; Dorrestein, K.; Duggan, B. M.; Almaliti, J.; Allard, P.-M.; Phapale, P.; Nothias, L.-F.; Alexandrov, T.; Litaudon, M.; Wolfender, J.-L.; Kyle, J. E.; Metz, T. O.; Peryea, T.; Nguyen, D.-T.; VanLeer, D.; Shinn, P.; Jadhav, A.; Müller, R.; Waters, K. M.; Shi, W.; Liu, X.; Zhang, L.; Knight, R.; Jensen, P. R.; Palsson, B. Ø.; Pogliano, K.; Linington, R. G.; Gutiérrez, M.; Lopes, N. P.; Gerwick, W. H.; Moore, B. S.; Dorrestein, P. C.; Bandeira, N.; Nat. Biotechnol. 2016, 34, 828. [Crossref]
» Crossref -
20 Gambaro, V.; Roda, G.; Visconti, G. L.; Arnoldi, S.; Casagni, E.; Dell’Acqua, L.; Farè, F.; Paladino, E.; Rusconi, C.; Arioli, S.; Mora, D.; J. Pharm. Biomed. Anal. 2016, 125, 427. [Crossref]
» Crossref -
21 Musshoff, F.; Madea, B.; Beike, J.; Forensic Sci. Int. 2000, 113, 389. [Crossref]
» Crossref -
22 Kysilka, R.; Wurst, M.; Planta Med. 1990, 56, 327. [Crossref]
» Crossref -
23 Repke, D. B.; Leslie, D. T.; Guzmán, G.; Lloydia 1977, 40, 566. [Crossref]
» Crossref -
24 Saito, K.; Toyo’oka, T.; Kato, M.; Fukushima, T.; Shirota, O.; Goda, Y.; Talanta 2005, 66, 562. [Crossref]
» Crossref - 25 Matos, F. J.; Introdução à Fitoquímica Experimental, 2nd ed.; Edições UFC: Fortaleza, Brazil, 2009.
-
26 Kysilka, R.; Wurst, M.; J. Chromatogr. A 1991, 464, 434. [Crossref]
» Crossref -
27 Neal, J. M.; Benedict, R. G.; Brady, L. R.; J. Pharm. Sci. 1968, 57, 1661. [Crossref]
» Crossref -
28 Polo-Castellano, C.; Álvarez, J. Á.; Palma, M.; Barbero, G. F.; Ayuso, J.; Ferreiro-González, M.; J. Fungi 2022, 8, 598. [Crossref]
» Crossref -
29 Casale, J.; J. Forensic Sci. 1985, 30, 247. [Crossref]
» Crossref -
30 Keller, T.; Schneider, A.; Regenscheit, P.; Dirnhofer, R.; Rücker, T.; Jaspers, J.; Kisser, W.; Forensic Sci. Int. 1999, 99, 93. [Crossref]
» Crossref -
31 US Pharmacopeia; Elemental Impurities-Limits [Link] accessed in April 2026
» Link -
32 Pichini, S.; Marchei, E.; García-Algar, O.; Gomez, A.; Di Giovannandrea, R.; Pacifici, R.; J. Pharm. Biomed. Anal. 2014, 100, 284. [Crossref]
» Crossref -
33 Grundner, M.; Panevska, A.; Sepčić, K.; Skočaj, M.; Membranes 2021, 11, 264. [Crossref]
» Crossref -
34 Chopade, A. R.; Somade, P. M.; Somade, P. P.; Mali, S. N.; Nat. Prod. Bioprospect. 2021, 11, 223. [Crossref]
» Crossref -
35 Santos, A. J. M.; da Silva, J. C. G. E.; J. Contam. Hydrol. 2021, 236, 103740. [Crossref]
» Crossref -
36 Luo, F.; Wang, Q.; Yin, C.; Ge, Y.; Hu, F.; Huang, B.; Zhou, H.; Bao, G.; Wang, B.; Lu, R.; Li, Z.; J. Invertebr. Pathol. 2015, 130, 154. [Crossref]
» Crossref -
37 Little, R. F.; Samborskyy, M.; Leadlay, P. F.; PLos One 2020, 15, e0239054. [Crossref]
» Crossref -
38 Song, C.; Wu, M.; Zhang, Y.; Li, J.; Yang, J.; Wei, D.; Li, H.; Guo, L.; Qin, J.; J. Agric. Food Chem. 2022, 70, 804. [Crossref]
» Crossref -
39 Pellegrino, R. M.; Blasi, F.; Angelini, P.; Ianni, F.; Alabed, H. B. R.; Emiliani, C.; Venanzoni, R.; Cossignani, L.; J. Agric. Food Chem. 2022, 70, 10371. [Crossref]
» Crossref
Edited by
-
Editor handled this article:
João Henrique Ghilardi Lago (Associate)

 LC-MS analysis and GNPS molecular network of P. cubensis ethanolic extract