In silico and in vitro Studies of the (+)-2,3,9-Trimethoxypterocarpan and Vorinostat Association as an Epigenetic Strategy to Inhibit Human Cancer Cells
Abstract
Recent years have highlighted the potential of flavonoids to enhance the efficacy and/or sensitivity of chemotherapeutics. The combination of histone deacetylase (HDAC) inhibitors with natural compounds has shown positive results. Thus, this study evaluates the association of pterocarpan and vorinostat, a potential epigenetic strategy against cancer cells, using in silico and in vitro approaches. The methodology involved using computational tools to map molecular targets and construct protein-protein interaction networks, followed by in vitro assays to evaluate cytotoxicity in cancer cell lines. The antiproliferative effects of the combination ((+)-2,3,9-trimethoxypterocarpan ((+)-PTC) + vorinostat) were assessed using 3-(4,5-dimethylthiazol-2-yl)-2,5-diphenyltetrazolium bromide (MTT) assays. The combination index (CI) was calculated to determine synergistic effects between the compounds. Molecular target prediction followed by evaluation of up-or downregulated expression in PC-3 (prostate carcinoma), DU-145 (prostate carcinoma), KG-1 (acute myeloid leukemia), and MOLM-13 (acute myeloid leukemia) cell lines identified 36 targets, including interleukin 1 beta (IL1B), tumor necrosis factor (TNF), amyloid beta precursor protein (APP), MYC proto-oncogene, bHLH transcription factor (MYC) and Heat Shock Protein 90 (HSP90). Additionally, all vorinostat targets (HDACs 1-10) were evaluated. Docking experiments indicated stable complexes between (+)-PTC and HDAC1 (PDB: 4BKX), HDAC2 (PDB: 4LXZ), HDAC6 (PDB: 5B8D), and HDAC8 (PDB: 1T64). Minimum inhibitory concentrations varied among cell lines, with in vitro associations showing inhibitory concentrations ranging from 1.5 to 2.9 µM. The combination of (+)-PTC and vorinostat shows greater inhibition of cell proliferation than either compound alone.
Keywords:
vorinostat; (+)-2,3,9-trimethoxypterocarpan; IC50; combination index; inhibition of cell growth
Introduction
The integration of two or more anticancer approaches represents a fundamental aspect of combination cancer therapy treatment. Therapeutic advances can be achieved by combining multiple anticancer strategies. Over the past 25 years, innovation in oncology therapeutic approaches has steadily increased. Blagosklonny1 reported that combination therapy enhances the selectivity of cytotoxic agents by either preserving normal cells, amplifying toxicity in cancer cells, or both. The use of biomarkers in oncology indications has grown consistently since 2009, and combination therapies accounted for 34% of oncology approvals.2 This progress reinforces the trend of investigating the epigenetic effects of associations between natural compounds, such as the flavonoid apigenin, and clinically approved epigenetic drugs, such as suberoylanilide hydroxamic acid (SAHA) or vorinostat, within the context of new therapeutic strategies.3 The term epidrug highlights that the epigenetic markers are targeted as a therapy.4
Combination therapy was first conceptualized by Frei III et al.,5 who identified the most effective combinations of chemotherapeutic agents to improve complete remission rates in children with acute lymphoblastic leukemia (ALL). Although conventional monotherapeutic techniques are still commonly applied in cancer treatment, they often cause numerous side effects and act on both affected and unaffected cells due to their lack of selectivity.6 Thus, the use of combination therapy may lead to a better understanding of therapeutic response heterogeneity and reveal predictive biomarkers for a more precise application of existing drugs. This approach is more effective for at-risk prevention, enabling more accurate predictions of the benefits of new drug combinations.7
In the field of combination therapies, recent years have seen continued research highlighting the potential of flavonoids to enhance the efficacy and/or sensitivity of chemotherapeutic compounds. Quercetin has been shown to reverse docetaxel resistance in vitro in prostate cancer cell lines (androgen-independent LNCaP-derived prostate cancer cell line (LNCaP/R/R) and drug-resistant PC-3 prostate cancer cell line (PC-3/R)) and in an in vivo prostate patient-derived xenograft (PDX) model. Furthermore, the combined administration of quercetin and docetaxel effectively slowed tumor growth and significantly inhibited proliferation in vivo.8 In PC-3 prostate cancer cells, the therapeutic efficacy of paclitaxel was improved by quercetin through the production of reactive oxygen species (ROS). This combination also demonstrated positive effects in a murine model PC-3 cancer.9
The work of Nimal et al.3 also stands out, describing the synergistic effect of co-administering vorinostat and apigenin against triple-negative breast cancer (TNBC) cells. This combination induced adverse morphological alterations, inhibited cell migration, promoted cell cycle arrest and apoptosis, and modulated the expression of epigenetic regulators histone deacetylase (HDACs) and deoxyribonucleic (DNA) methyltransferases (DNMTs), as well as pro-apoptotic and anti-apoptotic markers in human triple-negative breast cancer cell line (MDA-MB-231). In the context of developing new therapies combining HDAC inhibitors (HDACi) with natural compounds, a study by Zhang et al.9 reported positive results for an epigenetic conjugate, apigenin-vorinostat conjugate (AVC). This conjugate inhibits HDAC activity and significantly suppresses leukemogenesis both in vitro and in vivo. Furthermore, it exhibits selectivity for normal human cells and tissues, demonstrating safety and therapeutic potential for the treatment of acute myeloid leukemia (AML).
The synergistic potential arising from the combination of natural compounds such as isoflavonoids and pterocarpans, for instance, (+)-2,3,9-trimethoxypterocarpan ((+)-PTC), with HDAC inhibitors like vorinostat in the treatment of hematologic and solid tumors represents a promising strategy and warrants further investigation as a potential therapeutic approach.
Experimental
Experimental design
The investigation of the therapeutic potential of (+)-2,3,9-trimethoxypterocarpan ((+)-PTC) against prostatic and leukemic cell lines began with in silico experiments, including the mapping of potential molecular targets, construction of protein-protein interaction networks, assessment of molecule-target interactions, and evaluation of possible synergistic effects with vorinostat.
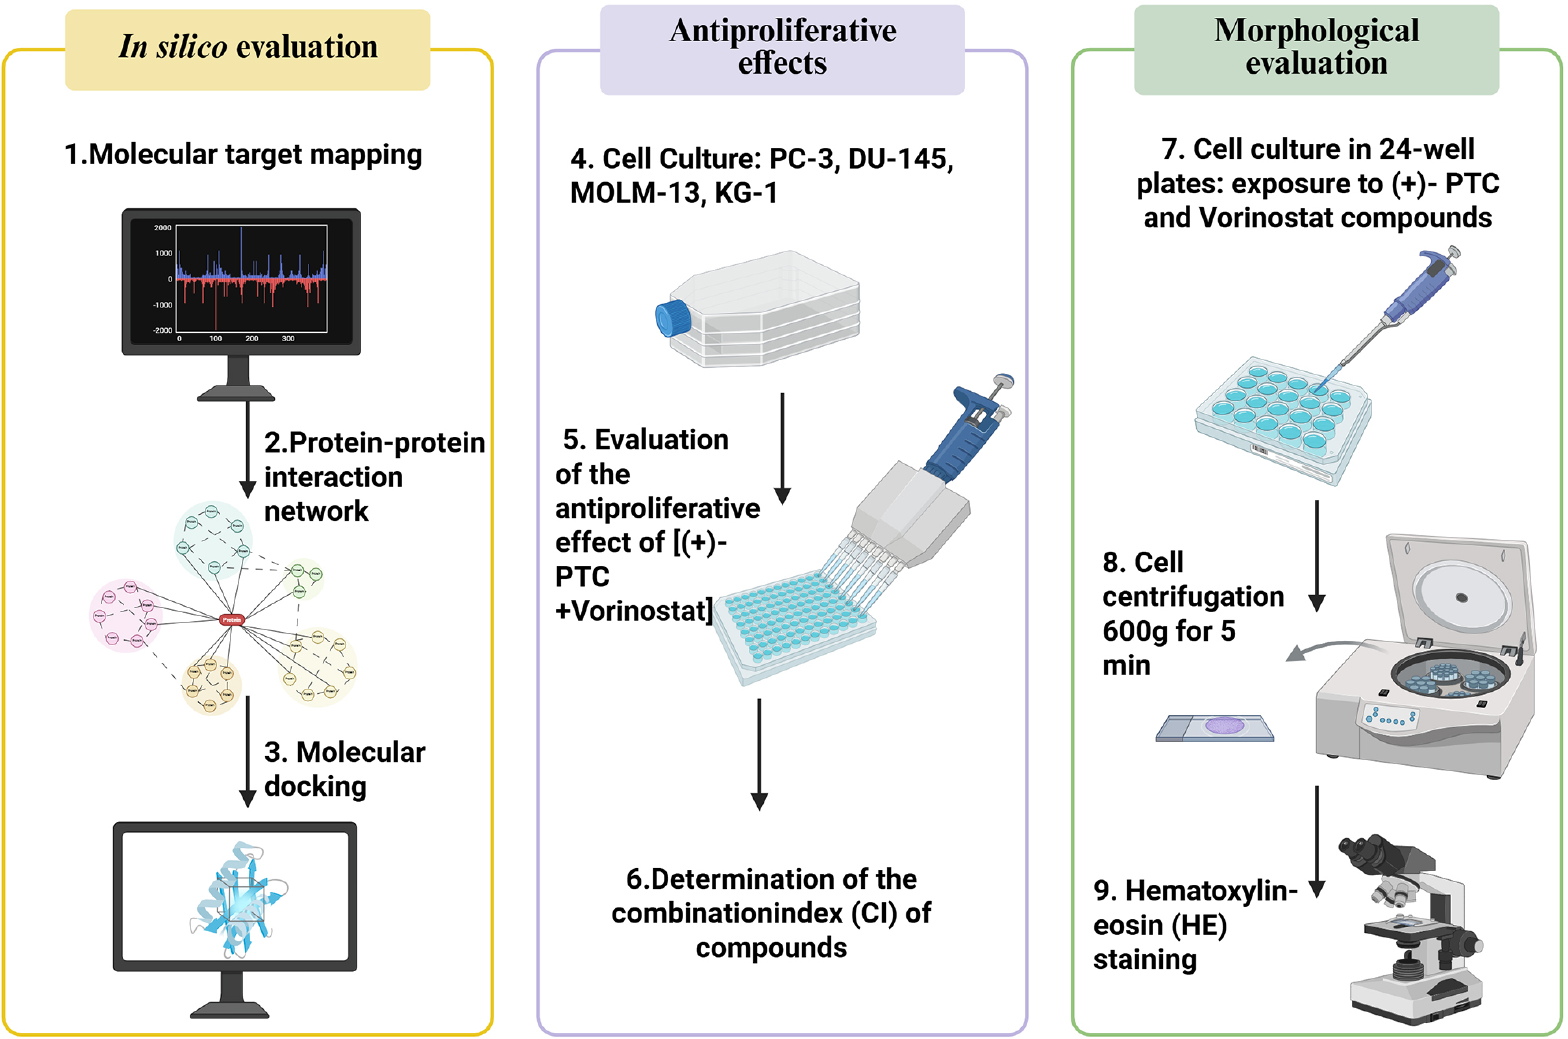
Subsequently, the PC-3 (prostate carcinoma), DU-145 (human prostate carcinoma cell line), KG-1 (human acute myelogenous leukemia cell line), and MOLM-13 (acute myeloid leukemia) cell lines were cultured for viability and cytotoxicity experiments. The cytotoxic activity of (+)-PTC against the MOLM-13 cell line was determined using the 24-h 3-(4,5-dimethylthiazol-2-yl)-2,5-diphenyltetrazolium bromide (MTT) assay.10 The impact of the combination ((+) PTC + vorinostat) was evaluated using a 72-h MTT assay in three cell lines: PC-3, DU-145, and KG-1. After observing a stronger antiproliferative response in the leukemic cell lines (KG-1 and MOLM-13), the mechanisms of cell death involved were characterized through: (i) morphological analysis using the hematoxylin-eosin staining protocol, (ii) assessment of membrane integrity, and (iii) cell cycle characterization by flow cytometry. Figure 1 summarizes the experimental planning steps, which are detailed below.
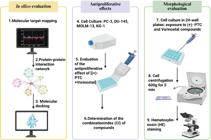
Protocol used to evaluate the association between (+)-2,3,9-trimethoxypterocarpan ((+)-PTC) and vorinostat as an epigenetic strategy for inhibiting the proliferation of cancer cells PC-3, DU-145, KG-1, and MOLM-13.
Target fishing
For in silico target fishing, the following exclusion criteria were applied: (i) “unique targets,” removing repetitions across databases; (ii) “non-human proteins,” retaining only proteins from Homo sapiens. Epigenetic activity of proteins was considered as an inclusion criterion. All targets were mapped by screening the “Biological Process” and “Molecular Function” columns, focusing on terms explicitly related to epigenetic processes (“chromatin”, “histone”, “methylation”, “acetylation”, and “epigenetic”).
It is noteworthy that mapping molecular targets with modulated expression represents a critical step in the development of targeted therapies, as it provides a predictive approach for identifying biomarkers and personalizing treatment based on each patient’s genetic profile.11 Therefore, following the predictions and data analysis in this study, a hypothesis was formulated that the (+)-PTC under investigation could act synergistically when combined with the epigenetic drug vorinostat.
Mapping of modulated targets in cancer cell lines
First, The Human Protein Atlas (THPA) database (HPA program) was consulted, providing detailed information on protein expression across different tissues and cell lines. A similar search was conducted in the Cortellis Drug Discovery Intelligence (CDDI) database (Clarivate), a powerful tool for researching drug development and biomarkers. This step included publications, patent data, and clinical studies highlighting modulated targets. Subsequently, targets with modulated expression were identified in the PC-3, DU-145, KG-1, and MOLM-13 cell lines.
Information was compiled to construct a protein-protein interaction (PPI) network. The analysis of protein interaction networks is crucial for understanding the biological functions of proteins and the underlying mechanisms of diseases or health conditions being studied. The STRING database (STRING Consortium)12 was used to evaluate interaction networks based on the modulated targets and predicted compound interactions. This approach allowed visualization of how targets interact within broader metabolic and signaling pathways, potentially revealing unknown mechanisms of action or suggesting new therapeutic strategies.
Molecular docking
A bounding box (Gridbox) was generated at the maximum allowable dimensions to encompass the active protein site fully and define the three-dimensional space where ligands were tested (Figure S1, Supplementary Information (SI) section). The assay was consistently performed using the same standard parameters for all proteins, within the maximum capacity of the platform, as illustrated in Table S1 (SI section).
After identifying modulated expression targets and evaluating protein-protein interactions in this context, the study proceeded to investigate possible binding interactions between the selected target proteins and the molecules under study. In this regard, Bär et al.13 demonstrated the relevance of in silico experiments, such as wide-range docking, for predicting interactions between targets lacking crystallized structures and HDAC inhibitors, thereby avoiding bias associated with restricting binding to the active site of the protein.
To avoid reinforcing ableist connotations, the term “wide-range docking” was adopted in this work to describe the procedure that might be referred to elsewhere as “blind docking.” Open-access tools such as DockThor (GMMSB) and OpenBabel (The Open Babel Team) were used14 to ensure reliable data generation without licensing requirements.
The UniProt database (UniProt Consortium) was used to obtain protein amino acid sequences and to identify the corresponding Protein Data Bank (PDB) entries. PDB files of non-monomeric structures were edited using PyMol Molecular Graphics System, version 3.0.3 (Schrodinger, LLC) to standardize all structures, which were then submitted to DockThor.
Ligand structures were standardized before docking. The (+)-PTC chemical structure was obtained from PubChem (National Institutes of Health (NIH) CID 71182772) and saved as a MOL 2 file. Vorinostat, inositol 1,4,5,6-tetrakisphosphate (I0P), N-(4-methyl-1,3-thiazol-2-yl) ethanamide (6T4), trichostatin A, and adenosine triphosphate (ATP) were also obtained from PubChem.MOL 2 format. All molecules were processed with OpenBabel, version 3.1.0, to convert and enrich.MOL 2 files and adjusted to pH 7.4 to simulate physiological conditions and prevent protonation bias.
Once prepared, the files were submitted to the Brazilian DockThor15 online platform, version 2.0. To identify potential structural changes due to docking, each protein was submitted to DockThor without ligands and compared to its native structure using the Discovery Studio Visualizer16 (Dassault Systèmes, version 21.1) module to assess conformational alterations induced by binding.
Ligand structures were visualized using Discovery Studio Visualizer, clustered, and the most probable pose was determined based on position variation within clusters and associations between total energy (lower values indicating more stable interactions), interaction energy (the sum of van der Waals and Coulomb energies), and binding free energy (∆G).
Drugs solutions
The (+)-PTC is a natural enantiomer isolated from Platymiscium floribundum Vogel17 and firstly synthesized in Australian National University (ANU) according to Paier et al,18 a synthetic route patent was conceived in 2013.19
Suberoylanilide hydroxamic acid (vorinostat) is a pan-HDAC inhibitor, a Food and Drug Administration (FDA)-approved medication that inhibits histone deacetylases (HDACs) and is used to treat cutaneous T-cell lymphoma.20 The compound was acquired from Sigma-Aldrich in 2024.
The stock solutions were prepared at 4 mM for (+) PTC and 12 mM for vorinostat, respectively. Subsequently, cells were treated with: (i) ((+)-PTC + vorinostat) at supra-optimal ((+)-PTC = 2 μM; vorinostat = 6 μM); (i) (+) PTC at optimal concentration (3 μM); (iii) vorinostat at optimal concentration (9 μM); (iv) (+)-PTC at suboptimal concentration (2 μM); (v) vorinostat at suboptimal concentration (6 μM). The negative control was treated with diluent (dimethyl sulfoxide (DMSO)).
Cell lineages and cultivation
The tumor cell lines used in this study (Table S2, SI section) to assess compound cytotoxicity were obtained from the United States National Cancer Institute (US-NCI) or the Cell Bank of Rio de Janeiro (BR-BCRJ).
Cells were cultured in plastic culture flasks (25 cm2, 50 mL or 75 cm2, 250 mL). The culture medium used was Roswell Park Memorial Institute (RPMI) supplemented with 10% fetal bovine serum (FBS) for MOLM-13 and PC-3 cell lines, Dulbecco’s Modified Eagle Medium (DMEM) with 10% FBS for the DU-145 cell line, and DMEM with 20% FBS for the KG-1 cell line. All averages were supplemented with 1% antibiotic (penicillin/streptomycin).
Cells were handled in a vertical laminar flow hood (VECO, Biosafe 12 Class II) and maintained in a humidified incubator at 37 °C with 5% CO2 (NUAIRE, TS Autoflow). Cell growth and morphology were monitored daily using an inverted optical microscope (ZEISS, Axiovert 40C). The culture medium was replaced as needed.
For adherent cell models, the medium was removed, and the flask was washed twice with sterile phosphate-buffered saline (PBS). Then, 0.5% trypsin-ethylenedinitrilotetraacetic acid (EDTA) (Gibco) was diluted 10× in PBS and added to detach the cells. Once detached, trypsin activity was inhibited by adding medium supplemented with FBS. A defined volume of cells was removed from the flask and resuspended in fresh medium. For suspension cells, only the medium was replaced.
Determination of the combination index (CI) of compounds
The combination index (CI) of compounds was determined using CompuSyn21 software (ComboSyn Incorporated, version 1.0), following the recommendations of Chou and Martin21 and Chou.22 The Michaelis-Menten equation, the Hill equation, the Henderson-Hasselbalch equation, and the Scatchard equation provide the theoretical basis for a quantitative determination of drug interactions, where CI < 1, CI = 1, and CI > 1 indicate synergistic, additive, and antagonistic effects, respectively.
To calculate a combination of two drugs, data on the dose and effect of every single compound (drug A, drug B), as well as the combined compounds (drugs A + B), must first be entered. The “dose” refers to the concentration range, and the “effect” refers to the transformed value of the corresponding inhibition. The IC50 (media inhibitory concentrations) for each drug is required to determine the constant or non-constant ratio used in the combination.
Cell viability assay
The MTT cell viability assay is an indirect, quantitative, colorimetric method that evaluates mitochondrial activity by reducing the yellow salt 3-(4,5-dimethylthiazol-2-yl)-2,5 diphenyltetrazolium bromide (MTT) to purple formazan crystals in metabolically active cells.10 Quantification in this study was performed by absorbance using a spectrophotometer. The cells were plated in 96-well plates with 100 μL of culture medium, and the appropriate seeding concentration for each well is described in Table S2 (SI section).
After 24 h of incubation at 37 °C and 5% CO2, 100 μL of the drug combination diluted in a complete medium were added to each well at concentrations ranging from 0.19 to 25 μM, while complete medium containing 0.1% dimethyl sulfoxide (DMSO, Merck Millipore, Brazil) was applied to one column as a control. Plates were incubated again for 24, 48, or 72 h. At the end of the incubation period, plates were centrifuged at 1,500 rpm for 5 min, and 100 μL or 20 μL of MTT solution (0.5 mg mL-1) was added to each well for adherent and suspension cell lines, respectively. Plates were then incubated for 3 h.
At the end of the defined incubation time, plates were centrifuged at 4,000 rpm for 10 min, and the supernatant was removed. Formazan crystals were solubilized by adding 100 μL of DMSO to each well. Absorbance was measured using a plate spectrophotometer (Beckman Coulter Inc., DTX-880) at a wavelength of 595 nm with the Multimode Detection software version Revision AA (Beckman Coulter Inc., 2004). Following the analysis, it was decided to continue the investigation only with the leukemic cell lines KG-1 and MOLM-13.
In vitro synergistic potential evaluation
The synergistic potential was evaluated based on the previous cytotoxicity assay results at 72 h. After that, the inhibitory concentration ratios for vorinostat and pterocarpan were calculated. The 1:2.9 ratio obtained in tests on the KG-1 cell was used to adjust the test concentration. Thus, the concentrations of vorinostat and pterocarpan were adjusted to 9 and 3 μM, respectively. Therefore, a new cytotoxic assay was performed at 24, 48, and 72 h, testing the ratio of vorinostat to pterocarpan at different concentrations and their respective non-associated concentrations. The MTT assay was performed; thus, the inhibitor values were entered into the CompuSyn platform, which considers these values and calculates the antagonistic, synergistic, or additive effect of the combination of different compounds. According to CompuSyn interpretation rules (CI = 1, additive effect; CI < 1, synergism; CI > 1, antagonism).23
Hematoxylin-eosin (HE) staining protocol
The hematoxylin-eosin (HE) staining protocol was performed according to the recommendations of Raphael,24 Renylab Química e Farmacêutica Ltda,25 and Lima et al.26 MOLM-13 cells were plated at a density of 0.1 × 10⁵ cells mL-1 in 24-well plates and then treated with: (i) (+)-PTC at optimal concentration (3 μM); (ii) vorinostat at optimal concentration (9 μM); (iii) (+) PTC at suboptimal concentration (2 μM); (iv) vorinostat at suboptimal concentration (6 μM). Cells were incubated for 6 and 12 h in a 5% CO2 incubator at 37 °C, and the negative control was treated with diluent (DMSO).
KG-1 cells were plated at a density of 0.3 × 10⁶ cells mL-1 in 24-well plates and then treated with: (i) ((+) PTC + vorinostat) at supra-optimal ((+)-PTC = 2 μM; vorinostat = 6 μM); (ii) (+)-PTC at optimal concentration (3 μM); (iii) vorinostat at optimal concentration (9 μM); (iv) (+)-PTC at suboptimal concentration (2 μM); (v) vorinostat at suboptimal concentration (6 μM). Cells were incubated for 24 and 48 h in a 5% CO2 incubator at 37 °C, and the negative control was treated with diluent (DMSO).
Results
Prediction of molecular targets using the target fishing strategy
Target fishing performed on the platforms TargetNet (Computational Biology & Drug Design Group), Swiss Target Prediction (Swiss Institute of Bioinformatics), and CDDI indicated more than 700 potential molecular targets for the compounds (+)-PTC (Table S3, SI section) and vorinostat (Table S4, SI section). After excluding non-human proteins, 530 possible targets corresponding to human proteins remained. After applying the inclusion criteria, we identified 54 molecular targets associated with epigenetic regulation, most of which were directly linked to the epigenetic effects of the compounds (+)-PTC and vorinostat, among the initially predicted targets (Table S5, SI section).
Prospecting for targets with modulated expression
The Human Protein Atlas (THPA) and Cortellis database, as well as Drug Discovery Intelligence (CDDI), identified 36 targets that could be upor downregulated in the investigated cell lines (PC-3, DU-145, KG-1, and MOLM-13). The targets classified by basal expression in each cell line, normalized to transcripts per million (nTPM), are shown in Figure S2 (SI section). In it, we observed targets with modulated basal expression, such as interleukin 1 beta (IL1B), tumor necrosis factor (TNF), gastric adenocarcinoma (GAA), amyloid beta precursor protein (APP), MYC proto-oncogene, bHLH transcription factor (MYC), DNA topoisomerase II, and Heat shock protein 90.
Protein-protein interaction network (STRING)
Vorinostat acts as a pan-HDAC inhibitor, with affinity for the isoforms HDAC1, HDAC2, HDAC3, HDAC6 and HDAC8, while the protein Heat Shock Protein 90 (HSP90AA1) presented a markedly discrepant basal expression pattern between the investigated cell lines (leukemia and prostate cell lines), thus the interaction profile of these proteins was analyzed using the STRING platform, to map the functional nodes shared between these proteins.
As expected, the evaluation of 12 nodes revealed significant PPI enrichment p-values (p < 0.05), indicating the reliability of the representation of a real functional module related to the molecular targets investigated. No gray nodes were observed, indicating the second layer of interaction, or indirect interaction between proteins (Table 1 and Figure S3, SI section).
It is observed that the interaction networks of HDAC2, HDAC3, and HDAC8 stand out for presenting higher average degrees of interaction (8.73, 9.27, and 6.18, respectively), high clustering coefficients (0.908, 0.941, 0.823, respectively), and lower enrichment values (5.32 × 10⁻¹², 1.77 × 10⁻¹³, 8.46 × 10⁻⁶, respectively). HDAC1 had the lowest average interaction degree (4.0) and the highest clustering coefficient (0.700), although this difference was significant (p = 0.00446). HDAC6 exhibited a non-significant enrichment (p = 0.0702).
The chaperone HSP90AA1 showed a consistent interaction network, with an average degree of 6.91, a clustering coefficient of 0.825, and an enrichment p-value of 0.00269.
Molecular docking
The collected results were compared with previously determined protein structures to assess the extent of structural modification induced by the test molecule in complex with the protein. The 10 most likely interactions were selected for further analysis to choose the most appropriate position to use as the experimental result.
The selection criteria for the structures 4BKX, 4LXZ, 4A69, 5B8D, 1T64, and 1BYQ were based on the availability of the crystallized structure with ligands in the PDB, the absence of mutations, and the best possible resolution in angstroms (Å) of the protein structure.
The data in Table 2 allow us to evaluate the potential interaction between the ligands ((+)-PTC, vorinostat, I0P, 6T4, trichostatin A, and ATP) and the targets (HDAC1, HDAC2, HDAC3, HDAC6, HDAC8, and HSP90).
Targets and ligands were tested using the DockThor online platform for the broad search docking procedure
Prioritizing total energy (TE) as the primary evaluation criterion is an advantageous approach because it better aligns with the flexibility of the ligand in the molecular modeling tool.27 Both TE and binding energy (BE) are related to the interaction strengths and the stability of the binding. Negative values indicate a thermodynamically favorable interaction.
Electrostatic (Coulomb) and van der Waals (vdW) forces are types of interactions between ligands and their binding sites.28 Both parameters presented negative values for all tested ligands, indicating a tendency towards stability. These parameters are also related to the binding free energy (∆G), which has a negative value indicating a greater likelihood of spontaneous binding.
In this regard, it was observed that (+)-PTC had a lower total energy than the control molecules in almost all targets. The ligands I0P (HDAC3) and ATP (HSP90) stand out, whose total energy (respectively -203.694 and -143.488 kcal mol-1) were considerably more favorable to binding than those of (+)-PTC (35.418 kcal mol-1 for HDAC3 and 25.907 kcal mol-1 for HSP90). In HDAC8, the total energy was quite similar. However, when verifying the binding energy values, the control trichostatin. A presented greater stability than (+)-PTC, following the pattern observed for the other ligands in this parameter.
Docking experiments indicate that, in the most stable conformation of the complex between the (+) PTC molecule and the crystallographic structure of HDAC1 (PDB: 4BKX), HDAC2 (PDB: 4LXZ), HDAC6 (PDB: 5B8D), and HDAC8 (PDB: 1T64) (Figure S4, SI section) the ligand is attracted to the active site of the enzyme, in the most thermodynamically favorable conformation.
In HDAC3 (PDB: 4A69), although the ligand preferentially accommodates itself in the active site (ACT site) of the enzyme, it is essential to highlight the possibility of acting on other functional sites of the receptor protein. For this reason, we chose to evaluate a potential interaction between the (+)-PTC molecule and the binding site where the I0P molecule binds (Figure S4, SI section), while acting as a corepressor of HDAC3.
Predictions suggest that the monomethoxylated end may be attracted to positively charged amino acid residues, leading to a hydrogen bond between the methoxy group and Arg264 (Figure S4). Polar interactions also occur involving Asp92 and His134 residues and the pyran and cyclohexane rings at the other end of the ligand. These interactions, combined, partially anchor the molecule, stabilizing the central portion of the ligand by fitting into a small hydrophobic pocket created by Leu265 of the receptor. The portions of the ligand near the dimethoxylated end contact another hydrophobic pocket formed by residues Gly142, Phe143, Phe198, and Phe199 (Figure S4), contributing to greater stability of the interaction.
However, although the interaction values of the (+) PTC molecule are slightly favorable to the I0P binding region, it is essential to highlight that the values obtained when redocking I0P show that the interaction is much more favorable to it than to (+)-PTC, which implies that there is an extremely low chance of it competing with and inhibiting the I0P binding site; therefore, it is more likely that (+) PTC will be attracted to the active site of the protein than to the I0P site.
The central portion of the ligand is stabilized by fitting into a small hydrophobic pocket created by the receptor’s Leu265 residue. The portions of the ligand near the dimethoxylated end come into contact with another hydrophobic pocket formed by residues Gly142, Phe143, Phe198, and Phe199, contributing to greater stability of the interaction (Figure S4). However, although the interaction values of the (+)-PTC molecule are slightly favorable to the I0P binding region, it is essential to emphasize that the values obtained by redocking I0P show that the interaction is much more favorable to I0P than to (+)-PTC. This suggests that the latter has a very low likelihood of competing with the I0P binding site. Therefore, it is more probable that (+)-PTC will be drawn to the active site of the protein rather than the I0P site.
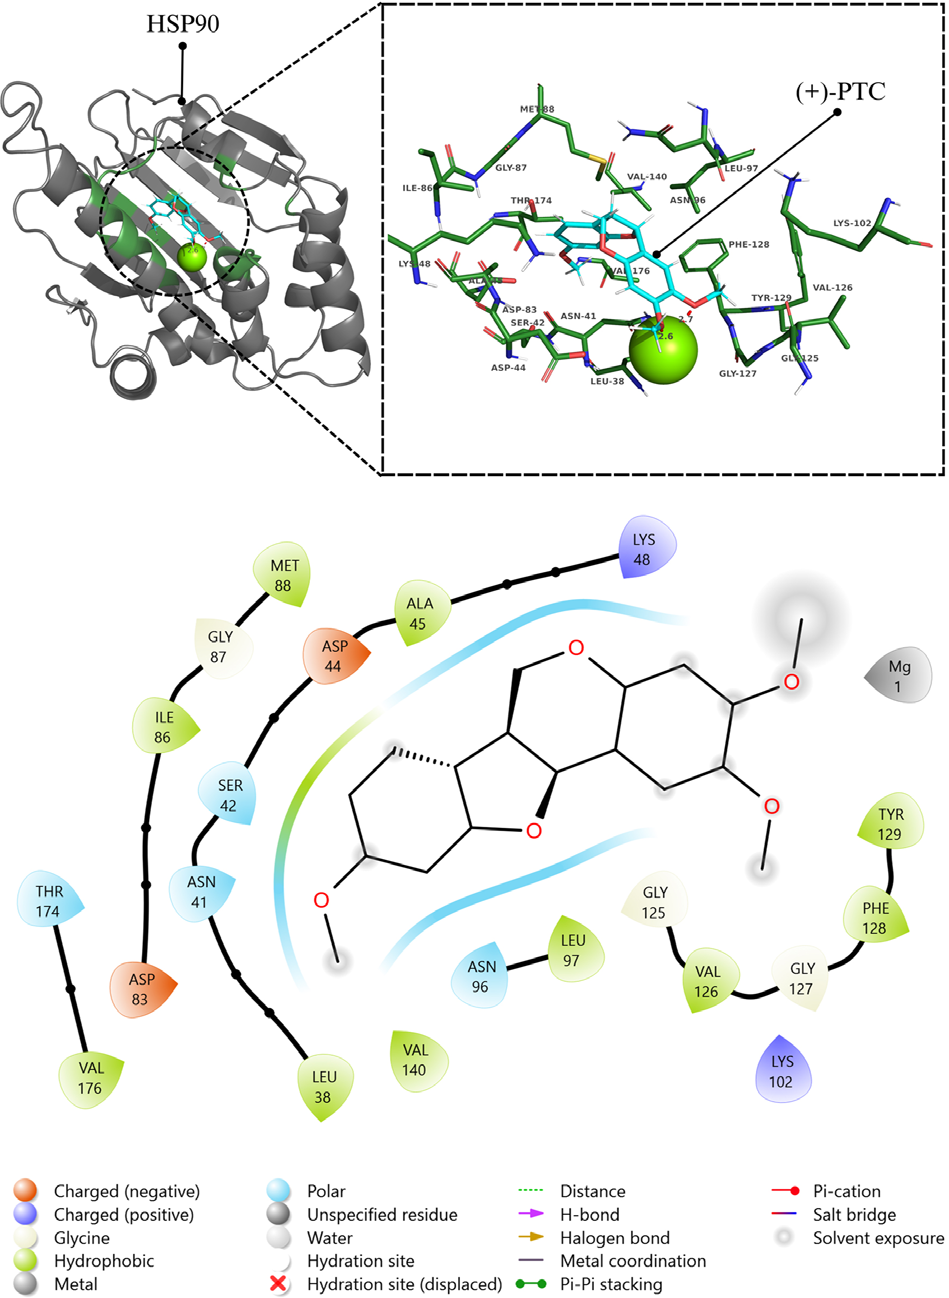
Contrary to the predicted interactions in HDACs, the interactions for the HSP90 protein (PDB: 1BYQ) (Figure 2) indicate that the complex formed is characterized by extensive polar interactions involving the entire (+)-PTC molecule. The ligand is attracted to the active site of the receptor protein, and the oxygens at its dimethoxylated end form polar interactions with the Mg2+ ion, which tends to anchor the ligand to the receptor cavity.
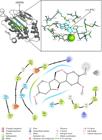
The (+)-PTC molecule enters the complex laterally, allowing the oxygens at the dimethoxylated end to interact with the cation, while simultaneously exposing the two CH3 groups to the solvent. This may also draw the ligand toward the active site, further stabilizing the binding. In parallel with the interactions mentioned above, the other end of the molecule is more involved in polar interactions with the receptor cavity, which, through residues Leu38, Asn41, Ser42, Asp44, Ala45, Lys48, Asn96, and Leu97, creates a polar pocket that interacts with the methoxyl radical, cyclohexane, the pyran ring, and the tetrahydrofuran ring. Finally, residues Asp83, Ile86, Gly87, and Met88 form a small hydrophobic pocket that, upon interaction with the ligand’s cyclohexane ring, enhances the stability of the interaction.
Effect in vitro of the combination of (+)-PTC with vorinostat on cancer cell proliferation
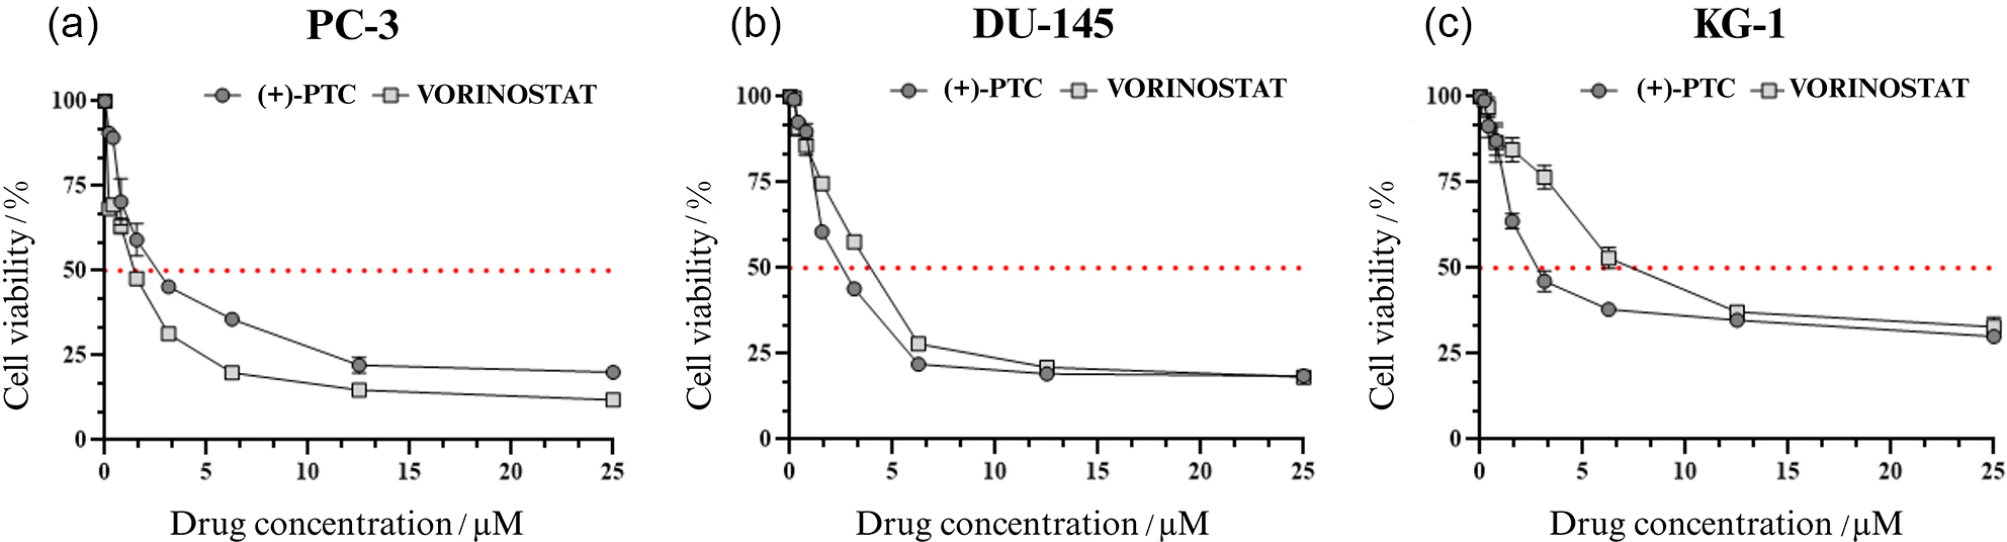
The in vitro antiproliferative effect of the combination of the compounds (+)-2,3,9-trimethoxypterocarpane ((+) PTC) and vorinostat was first verified by determining the minimum inhibitory concentrations of (+)-PTC and vorinostat separately. For both prostate cell lines, the media inhibitory concentrations (IC50) values of (+)-PTC were higher than those of vorinostat.
The IC50 of (+)-PTC in the PC-3 cell line was 3.12 µM (95% CI: 2.95-3.30; R2 = 0.99) while the IC50 of vorinostat was 1.93 µM (95% CI: 1.75-2.14; R2 = 0.97). In the other prostate cell line DU-145, the IC50 of (+)-PTC was 3.49 µM (95% CI: 3.09-3.96; R2 = 0.94) while the IC50 of vorinostat was 2.70 µM (95% CI: 2.48-2.94; R2 = 0.97). In leukemic cell lines, such as KG-1, (+)-PTC (3.45 µM, 95% CI: 2.99 3.99; R2 = 0.95) exhibited a lower IC50 than vorinostat (9.88 µM, 95% CI: 9.07-10.80; R2 = 0.97). The IC50 values at 72 h for each cell line are detailed in Table 3.
Media inhibitory concentrations (IC50) and combination index (CI) data were determined for PC-3, DU-45, and KG-1 cell lines after 72 h of treatment with (+)-2,3,9-trimethoxypterocarpan and vorinostat
These results showed that the minimum inhibitory concentrations varied in proportion between the cell lines (Figure 3). In the PC-3 and DU-145 cell lines, the ratios remained around 1.5 µM; in the leukemic cell line KG-1, a higher value (2.9 µM) was observed, which may confer a benefit in the combined treatment. Thus, the experiments to characterize the cellular effects continued in the leukemic cell lines, using a 1:3 ratio of (+)-PTC to vorinostat.
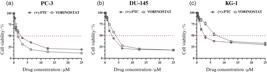
Mean inhibitory concentrations presented by (+)-PTC and vorinostat for the cell lines (a) PC-3, (b) DU-145, and (c) KG-1 in the 72 h MTT test.
The results for the 24, 48, and 72 h time points showed that, despite the discrete synergistic effect of the ((+) PTC + vorinostat) combination, the compounds achieve CI values lower than 1, considered a synergistic effect. By observing the concentration required to reach the CI values, it is possible to see a reduction in the required concentration of each compound tested, when separated, to obtain proportion of the biological system that has been inhibited by 50% compared to the untreated control Fa = 0.5 compared to when tested together (Table 4).
In vitro synergistic potential of the combination ((+)-PTC + vorinostat) investigated at 24, 48, and 72 h for the KG-1 leukemic cell line
Morphological changes identified by HE staining
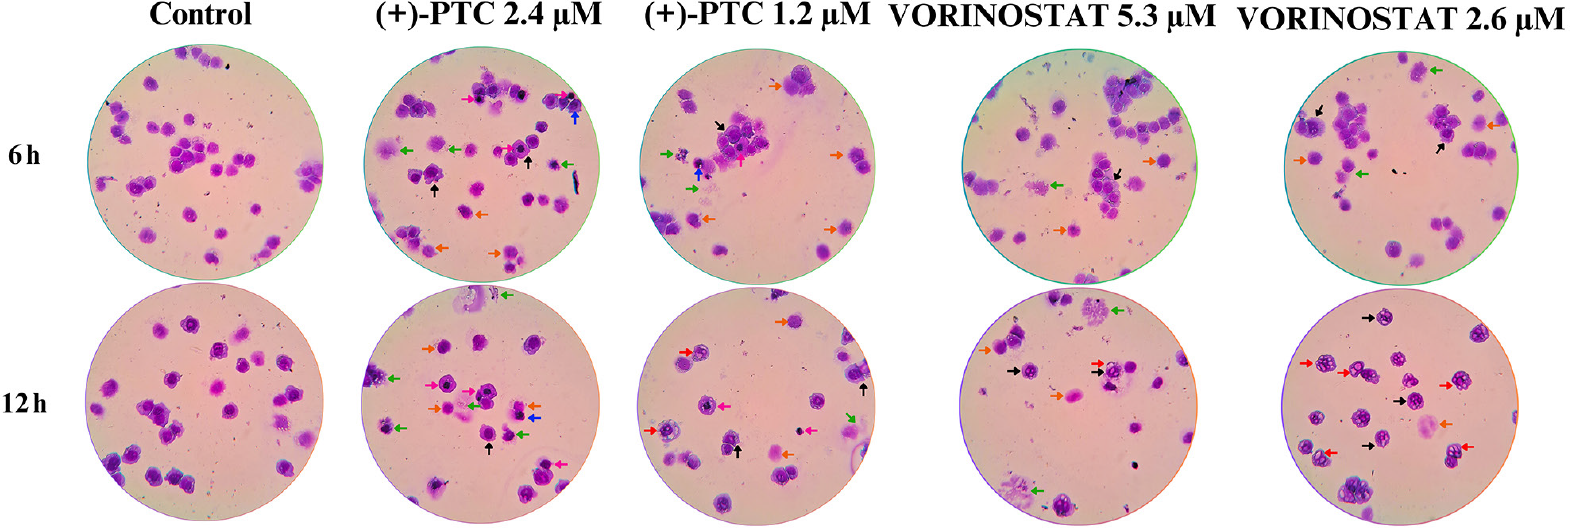
The main morphological changes observed in MOLM 13 cell lines subjected to 6- and 12-h treatment are shown in Figure 4. In the group treated with (+)-PTC, morphological changes characteristic of apoptosis and necrosis were observed, including plasma membrane invaginations (blebs), plasma membrane disruption, pyknosis, karyolysis, karyorrhexis, and cytoplasmic vacuole formation. On the other hand, in the experimental groups treated with vorinostat, morphological changes included cytoplasmic blebs, membrane disruption, karyolysis, and the presence of vacuoles, which were more noticeably observed.
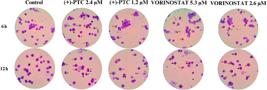
Microscopic image of MOLM-13 cells stained with hematoxylin and eosin (HE) treatment with (+)-2,3,9-trimethoxypterocarpan and vorinostat or suberoylanilide hydroxamic acid (Vorinostat) after 6 and 12 h of treatment. Control cells were untreated. Arrows of different colors indicate multiple morphological changes observed: black arrows refer to cytoplasmic blebs, green arrows indicate plasma membrane disruption, orange arrows designate pyknosis, pink arrows identify karyolysis, blue arrows signal karyorrhexis, and red arrows indicate the appearance of cytoplasmic vacuoles.
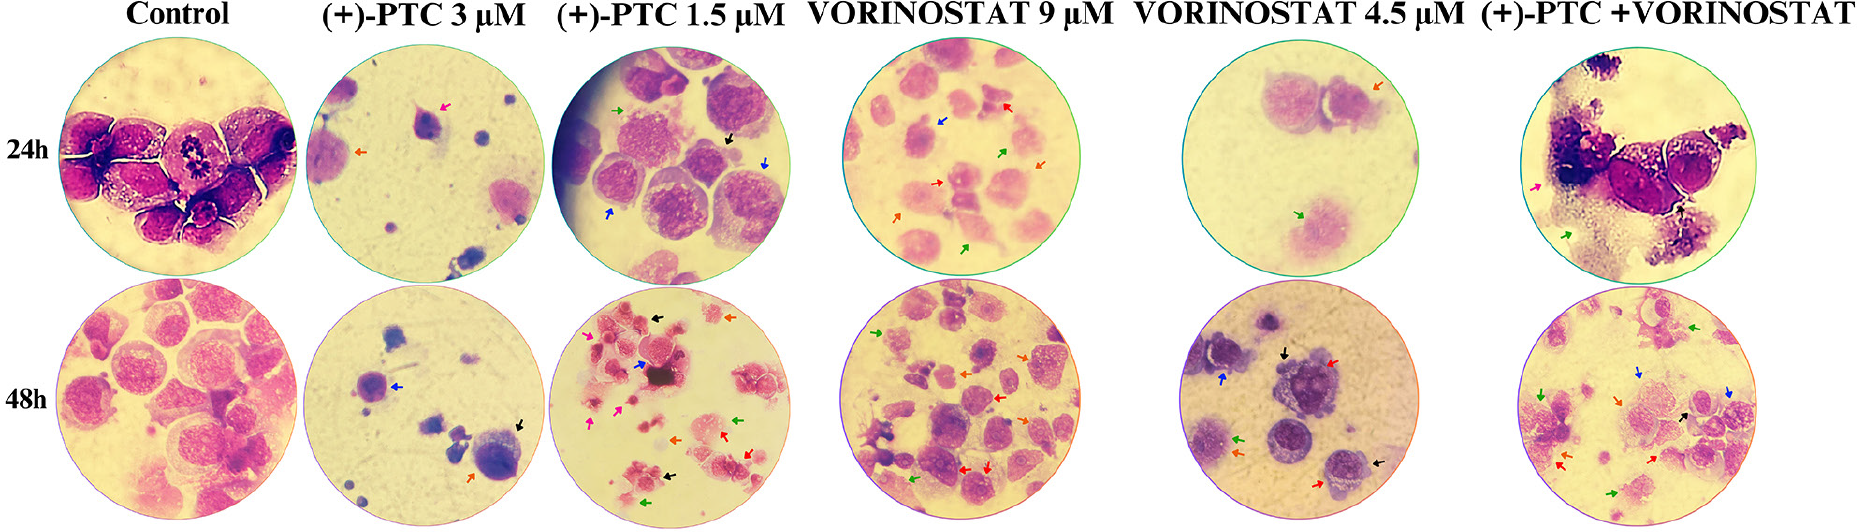
The visible morphological changes in KG-1 cell lines subjected to 24- and 48-h treatment are presented in Figure 5. In the groups treated only with (+)-PTC, morphological changes, including blebs, plasma membrane disruption, pyknosis, and karyolysis, were observed. In the groups treated only with vorinostat, plasma membrane disruption, karyolysis, and vacuole formation were identified in greater proportions. This assay included the ((+)-PTC + vorinostat) group, which exhibited more pronounced morphological changes indicative of apoptosis, such as vacuolization, pyknosis, and karyolysis.
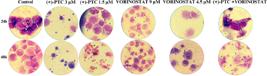
Microscopical images of KG-1 cells stained with hematoxylin and eosin (HE) after 24 and 48 h of treatment with (+)-2,3,9-trimethoxypterocarpan and vorinostat. Control cells were untreated. Arrows of different colors indicate multiple morphological changes observed. Black arrows refer to cytoplasmic blebs, green arrows indicate plasma membrane disruption, orange arrows designate pyknosis, pink arrows identify karyolysis, blue arrows indicate karyorrhexis, and red arrows indicate the appearance of cytoplasmic vacuoles.
Discussion
In the mapping of molecular targets, the data obtained helped guide experimental in vitro approaches in the human cancer cell lines PC-3, DU-145, KG-1, and MOLM-13 (Figure S2, SI section), indicating relevant gene expression profiles to understanding the epigenetic action of (+)-PTC and its association with vorinostat. During this process, several genes exhibited modulated basal expressions, notably IL1B, TNF, GAA, APP, MYC, DNA topoisomerase II, and Heat shock protein 90 (HSP90AA1). The latter showed overexpression in all four evaluation cell lines.
The overexpression of HSP90AA1 (Figure S2), a molecular chaperone strongly associated with cancer that stabilizes multiple oncoproteins essential for proliferation, apoptosis evasion, and tumor progression,29 reinforces its potential relevance as a therapeutic target, particularly in combination with epigenetic compounds. Therefore, investigating the interaction profile of (+)-PTC with vorinostat’s molecular targets contributes to elucidating the mechanism of action of (+)-PTC and excluding potential target competition, thereby opening up perspectives for more targeted therapeutic strategies, especially for hematologic and prostate tumors.
In a complementary analysis to the basal expression mapping of molecular targets, a protein-protein interaction (PPI) survey was performed using the STRING platform, focusing on HDAC1, HDAC2, HDAC3, HDAC6, and HDAC8 (Figure S4) - the primary targets of vorinostat - as well as HSP90AA1 (Figure 2). The resulting network map (Figure S3) revealed that HDAC1 exhibited pre-established cohesive interactions with epigenetic modulators, such as CHD4 and EP300, as well as tumor-regulating proteins.30
The networks of HDAC2 and HDAC3 were more robust (clustering coefficient > 0.9; p < 10-12), suggesting central roles in multiprotein epigenetic complexes.31 Conversely, HDAC6 showed the lowest statistical significance (p = 0.0702), possibly due to less specific interactions related to its cytoplasmic localization.32 The HDAC8 network exhibited a highly significant p-value (8.46 × 10⁻⁶), indicating more extensive connections than expected by chance. Its interactions with sirtuins (SIRT1/2) and transcriptional corepressors (SIN3A) suggest a role in epigenetic silencing.33,34 The connections of HSP90AA1 were primarily directed toward other chaperone proteins and tumor regulators, corroborating its activity within aggressive tumor microenvironments. Visualizing these interactions supports hypotheses on molecular synergism between (+)-PTC and vorinostat and provides insight into signaling pathways that this therapeutic combination may modulate.
Although previous studies have reported the antiproliferative potential of (+)-PTC,35,36 vorinostat is a pan-HDAC inhibitor available for oral administration and approved by the FDA in 2006 for the treatment of cutaneous T-cell lymphoma.20 Combining these compounds may enhance the observed antiproliferative effects while minimizing limitations inherent to their isolated use. Thus, the present study fundamentally contributes to broadening the antitumor response and reducing adverse effects when these agents are used individually, while encouraging further investigation of novel therapeutic applications for (+)-PTC in combination regimes.
The molecular docking analysis with HDACs (Figure S4) aimed to identify additional potential epigenetic targets of (+)-PTC and to assess its competitiveness with vorinostat as an epigenetic compound. The results from the molecular docking assays indicate that, although favorable interactions may occur with HDACs, (+)-PTC showed a greater propensity to form more stable complexes with HSP90 (Figure 2). However, when focusing exclusively on HDACs, the 4LXZ structure (HDAC2) exhibited the strongest interaction strength and stability.
It was also observed that under specific thermodynamic conditions, (+)-PTC and vorinostat can compete for the HDAC active site; however, vorinostat showed superior performance. This is justified by the fact that, despite binding with a slightly lower force compared to (+) PTC, vorinostat is energetically more stable. As a well-established HDAC inhibitor,20 the performance of vorinostat supports the notion that (+)-PTC, due to its competitive affinity toward HDACs, could act as an HDAC inhibitor. Notably, similar competition was observed between the flavonoid apigenin and vorinostat for HDAC1 and HDAC3, with comparable root mean square deviation (RMSD) values for the molecular docking complexes, corroborating a conformational competition at the same active site.3
Previous studies have shown that flavonoids such as luteolin37 and apigenin9 can interact with HDAC1 and HDAC2, with binding energies similar to or greater than those of vorinostat.38 In the present study, competition for the HDAC active site could generate an antagonistic effect rather than the intended synergistic effect, as both molecules may compete for the same binding region. However, such antagonism was not observed in the cytotoxicity assays performed.
The MTT assay after 72 h of treatment (Figure 3 and Table 3) aimed to evaluate the antiproliferative potential of the combination ((+)-PTC + vorinostat) in the PC-3, DU 145, and KG-1 cell lines, with the KG-1 lineage selected for time-dependent analysis at 24 and 48 h of exposure. The synergism analysis performed using the CompuSyn software revealed that, at reduced concentrations ((+) PTC 1.098 µM + vorinostat 3.295 µM), the combination resulted in a 50% inhibition of cell viability. This result demonstrates a synergistic profile, with potentiation of antiproliferative effects superior to that observed at higher concentrations of each compound individually.
The ability to reduce the administered concentrations, decrease adverse effects, and expand the therapeutic window39,40 underscores the potential therapeutic relevance of this association. This synergistic effect may be related to the capacity of (+)-PTC to modulate epigenetic pathways, which, when combined with the inhibitory action of vorinostat on HDACs, result in more effective suppression of cell viability in these tumor lines.
In consonance with CompuSyn interpretation rules,23 the 72-h treatment evaluation yielded a combination index (CI) of 0.901 to achieve 50% inhibition (Fa = 0.5), thus suggesting a moderate synergism between the compounds (Table 4).
The dose reduction index (DRI) data corroborate the therapeutic gain, indicating that the same biological response can be achieved with doses up to 15-fold lower for (+)-PTC and 12-fold lower for vorinostat. Thus, the results obtained only further support the hypothesis of synergism between the pterocarpan compound and the HDAC inhibitor vorinostat in the KG-1 cell line.
Morphological alterations in treated cells were evaluated at different exposure times. Cells from the MOLM-13 (Figure 4) and KG-1 lineages (Figure 5) were subjected to hematoxylin and eosin (HE) staining. It was observed that both (+)-PTC and vorinostat induced morphological changes in each lineage according to the exposure time (6 to 12 h for MOLM-13 and 24 to 48 h for KG-1). In the MOLM-13 lineage, after 6 h of exposure, cytoplasmic blebbing, plasma membrane rupture, pyknosis, and karyolysis were observed, particularly at the highest (+)-PTC concentration. Cells treated with vorinostat also exhibited karyolysis and membrane rupture. After 12 h, morphological alterations increased in both number and diversity, with pyknosis and karyorrhexis observed in cells treated with (+)-PTC, and a prominent appearance of cytoplasmic vacuoles in vorinostat-treated cells at all concentrations.
For the KG-1 lineage (Figure 5), after 24 h of exposure to (+)-PTC, nuclear alterations such as karyorrhexis and pyknosis were identified. Under the same exposure period to vorinostat, membrane rupture, cytoplasmic vacuolization, and karyolysis were evident, more prominently at the highest concentration. The combined treatment ((+) PTC + vorinostat) caused membrane rupture and pyknosis at lower proportions.
After 48 h of exposure to (+)-PTC, more pronounced morphological impacts were observed, including the presence of blebs, membrane rupture, karyolysis, and vacuolization. Vorinostat treatment also resulted in membrane rupture and bleb formation, in addition to intense cytoplasmic vacuolization. The combined treatment produced the same alterations observed in the individual treatments.
Overall, morphological changes were identified in MOLM-13 and KG-1 lineages following exposure to (+) PTC and vorinostat, either individually or in combination. These alterations are characteristic of distinct modes of cell death, including apoptosis, autophagy, and necrosis, which may be identified in variable proportions over time depending on compound exposure.
Apoptotic cell death is characterized by membrane blebbing, chromatin condensation or nuclear shrinkage (pyknosis), nuclear fragmentation (karyorrhexis), and apoptotic body formation,41 all of which were observed in (+)-PTC-treated cells. Autophagy, in turn, is characterized by intense cytoplasmic vacuolization, as observed in vorinostat-treated cells, in which autophagosomes fuse with lysosomes, leading to the degradation of damaged cellular components within vacuoles.42
Morphological alterations induced by the compound (+)-PTC in tumor cell lines have been investigated for at least two decades. Falcão et al.17 reported that exposure of HL-60 cells to pterocarpan caused chromatin condensation, pyknosis, reduced cell volume, and the formation of cytoplasmic and apoptotic vacuoles.17 Farias et al.35 reported that (+)-PTC induced morphological changes such as chromatin condensation and the formation of apoptotic bodies in OVCAR-8 cells.
Although apoptosis and autophagy have distinct characteristics, these mechanisms can be functionally interconnected, acting cooperatively or alternately. Depending on the stimulus, autophagy may contribute to apoptosis activation, and common signaling pathways can trigger both, or the cell may be induced to follow one mechanism exclusively.42
On the other hand, necrosis is traditionally considered a process characterized by pyknosis, organelle swelling, rupture of the plasma membrane, and the release of intracellular contents, such as cytokines and DNA fragments, leading to inflammation and the death of surrounding cells.43 These features were observed in cells from both lineages exposed to both compounds.
The interpretation of environmental stimuli or the self-assessment of accumulated cellular damage determines whether the cell undergoes apoptosis.42 Therefore, it can be inferred that the administration of vorinostat and especially (+)-PTC causes cellular damage and/or environmental stress intense enough to drive MOLM-13 and KG-1 cells into the apoptotic process, as characterized by the morphological alterations identified through the HE staining protocol.
It is noteworthy that, despite the growing interest in combining natural compounds with epigenetic agents as a therapeutic strategy in cancer treatment, the present experimental design provides an opportunity to build knowledge by directly comparing combinatorial approaches and conventional therapies.
Recent studies indicate that natural compounds such as epigallocatechin gallate (EGCG),44 apigenin,9 quercetin,45 baicalein,46 genistein,47 irigenin,48 and medicarpin49 exhibit inhibitory effects on epigenetic targets and show promising properties as epidrugs, suggesting their potential in the prevention and treatment of various types of cancer. However, only the studies by Sacko et al.47 and Zhang et al.9 address the combinatorial effects of natural compounds with other therapeutic strategies. The remaining studies focus on the isolated action of each compound, without comparisons to their performance in combined therapies or associations with epigenetic drugs. This opens avenues for future research to identify new synergistic molecular interactions between flavonoids, isoflavonoids, and pterocarpans with clinically established epidrugs. These observations highlight the importance of conducting more detailed studies on the efficacy and safety of these associations to improve epigenetic-based therapeutic strategies.
Furthermore, despite the relevance of the in vitro findings, it is essential to consider their potential translational applications. These results may serve as a foundation for in vivo investigations, expanding the understanding of the therapeutic potential. Another aspect worth highlighting concerns the inherent challenges of research on the bioavailability and pharmacokinetics of the compounds studied, as well as the risk of tumor resistance development, which should be carefully considered and discussed. The use of natural compounds as a supplementary strategy to conventional chemotherapy has been demonstrated across diverse studies.50-52 Their wide range of targets and mechanisms of action encourages the exploration of therapies addressing resistance to other compounds.53
Finally, hypotheses can be proposed to justify the observed synergism between (+)-PTC and vorinostat. One possibility is that the combination acts through complementary signaling pathways. Considering that studies from the Experimental Oncology Laboratory (LOE) research group indicate that (+)-PTC affects the mitotic spindle, promoting monopolar spindle formation and centrosome disorganization,36 and recent literature confirms that vorinostat is a well-established HDAC inhibitor,54,55 the complementarity of these actions could enhance apoptotic response or other cell death processes. Another hypothesis is that the modulation of epigenetic effects and proteins such as HDACs and HSP90 could be more effectively elucidated if the activity of the combination ((+)-PTC + vorinostat) is further investigated through complementary studies, evaluating different treatment concentrations, systemic toxicity, and additional gene/protein expression analyses.
Molecular docking analyses suggest potential interactions of (+)-PTC with targets such as HDACs and HSP90; however, docking alone is insufficient to confirm functional interactions or establish direct biological activity. Consequently, the findings should be interpreted as exploratory, supporting the hypothesis that pterocarpan may act as an adjuvant and providing a rationale for further in vitro and in vivo investigations. In this context, the absence of mechanistic experimental assays-particularly those assessing epigenetic modulation and HDAC activity-represents an important limitation and underscores a key direction for future studies aimed at validating the mechanisms underlying the observed synergistic effects.
Conclusions
The combination of (+)-PTC and vorinostat (SAHA) demonstrated a more pronounced effect on hematologic tumors. In the KG-1 cell line, reducing the administered concentration had a more pronounced effect, supporting consideration of this combination as a strategy to reduce adverse effects associated with monotherapeutic treatments. The obtained results demonstrate the potential of the (+) PTC and vorinostat combination as a therapeutic approach to enhance antitumor response while mitigating the limitations of using each compound individually.
Among the limitations of the study are the exclusive use of cell viability assays to evaluate single and combined effects of the compounds, the lack of confirmatory molecular analyses, and the use of a limited number of cell lines. These points are noteworthy as they highlight avenues for future investigations and complementary studies.
The findings, although methodologically constrained, suggest critical applications and directions, either by encouraging research focusing on the epigenetic action of (+)-PTC or by proposing integrations between in silico strategies and established in vitro approaches. Methodological challenges related to non-specific behaviors arising from typical cellular “drift” in in vitro cultures were addressed through methodological adjustments, refinements of culture techniques, and reorganization of the experimental design, thereby ensuring the scientific rigor of the study. Therefore, for future research in this area, it may be important to complement the analyses with gene and/or protein expression studies, to evaluate systemic toxicity, to perform in vivo experiments, and to develop formulations that enhance the stability and bioavailability of the ((+)-PTC + vorinostat) combination.
Supplementary Information
Supplementary data is available free of charge at http://jbcs.sbq.org.br as a file.
Acknowledgments
This study was supported by CNPq (through Research Productivity Fellowship Level 1A for C. Ó. P. (305509/2023-3)); and C. L. M. F. (CNPq 2 - process 306289/2022-9). National Program for Oncological Care (PRONON/ NUP: 25000.019172/2021-11); Brazilian Studies and Projects Funding Agency (FINEP)/MCTI/FNDCT (through the Research Project linked to the FINEP - More Innovation Brazil-Health-ICTs-Research, Development, and Innovation to Reduce SUS Vulnerabilities and Expand Access to Healthcare program (0361/24)); and INCT (through the INCT T-Bio2-Translational Biodiscovery and Biomodels calling (408566/2024-8)). AI tools were used only to improve language clarity and grammar. All scientific content and interpretations are the sole responsibility of the authors.
Data Availability Statement
All datasets generated and analyzed during this study are available in the article and SI section. Additional raw data, including in silico outputs, docking files, protein-protein interaction analyses, and full-resolution microscopy images, can be provided by the corresponding author upon reasonable request.
References
-
1 Blagosklonny, M. V.; Cell Cycle 2004, 3, 1035. [Crossref]
» Crossref -
2 Scott, E. C.; Baines, A, C.; Gong, Y.; Moore Jr., R.; Pamuk, G. E.; Saber, H.; Subedee, A.; Thompson, M. D.; Xiao, W.; Pazdur, R.; Rao, V. A.; Shneider, J.; Beaver, J. A.; Nat. Rev. Drug Discovery 2023, 22, 625. [Crossref]
» Crossref -
3 Nimal, S.; Kumbhar, N.; Saruchi; Rathore, S.; Naik, N.; Paymal, S.; Gacche, R. N.; Sci. Rep 2024, 14, 9540. [Crossref]
» Crossref -
4 Furtado C. L. M.; Luciano, M. C. S.; Santos, R. D. S.; Furtado, G. P.; Moraes, M. O.; Pessoa, C.; Epigenetics 2019, 14, 1164. [Crossref]
» Crossref -
5 Frei III, E.; Karon, M.; Levin, R. H.; Freireich, E. J.; Taylor, R. J.; Hananian, J.; Selawry, O.; Holland, J. F.; Hoogstraten, B.; Wolman, I. J.; Abir, E.; Sawitsky, A.; Lee, T.; Mills, S. D.; Burgert Jr, E. O.; Spurr, C. L.; Patterson, R. B.; Ebaugh, F. G.; James III, G. W.; Moon, J. H.; Blood 1965, 26, 642. [Crossref]
» Crossref -
6 Mokhtari, R. B.; Homayouni, T. S.; Baluch, N.; Morgatskaya, E.; Kumar, S.; Das, B.; Yeger, H.; Oncotarget 2017, 8, 38022. [Crossref]
» Crossref -
7 Plana, D.; Palmer, A. C.; Sorger, P. K.; Cancer Discovery 2022, 12, 606. [Crossref]
» Crossref -
8 Lu, X.; Yang, F.; Chen, D.; Zhao, Q.; Chen, D.; Ping, H.; Xing, N.; Int. J. Biol. Sci 2020, 16, 1121. [Crossref]
» Crossref -
9 Zhang, J.; Gao, X.; Wei, M.; Li, Y.; Yang, G.; Yang, C.; Yu, L.; Clin. Sci. 2021, 135, 1751. [Crossref]
» Crossref -
10 Mossman, T.; J. Immunol. Methods 1983, 65, 55. [Crossref]
» Crossref -
11 Do Prado, E. M.; Maia, M. M.; Silva, A. P. F.; Miranda, C. C.; Gonçalves, L. A.; Rev. Iberoam. Humanid. Cienc. Educ 2024, 10, 6050. [Crossref]
» Crossref -
12 Szklarczyk, D.; Kirsch, R.; Koutrouli, M.; Nastou, K.; Mehryary, F.; Hachilif, R.; Gable, A. L.; Fang, T.; Doncheva, N. T.; Pyysalo, S.; Bork, P.; Jensen, L. J.; von Mering, C.; Nucleic Acids Res 2023, 51, 638. [Crossref]
» Crossref -
13 Bär, S. I.; Pradhan, R.; Biersack, B.; Nitzsche, B.; Höpfner, M.; Schobert, R.; Arch. Pharm 2023, 356, e2200422. [Crossref]
» Crossref -
14 Vaidergorn, M. M.; Purificação, A. D.; Leite, P. I. P.; Silva Mendonça, S.; Silva, W. J. L.; Santos, T.; Silva, D. G.; Godoi, B. F.; Sacramento, C. Q.; Mattos, M.; Fintelman Rodrigues, N.; Freitas, C. S.; Damasceno, L. E. A.; Shishikura, Y.; Brown, A.; Wrobel, K.; Riley, J.; Souza, T. M. L.; Read, K. D.; Alves-Filho, J. C.; Andrade, C. H.; Nonato, M. C.; Emery, F. S.; Eur. J. Med. Chem 2025, 297, 117876. [Crossref]
» Crossref -
15 Grupo de Modelagem Molecular de Sistemas Biológicos (GMMSB), LNCC, 2019. [Link] accessed in January 2026
» Link -
16 Dassault Systèmes, 2020. [Link] accessed in January 2026
» Link -
17 Falcão, M. J. C.; Pouliquem, Y. B. M.; Lima, M. A. S.; Gramosa, N. V.; Costa-Lotufo, L. V.; Militão, G. C. G.; Silveira, E. R. J.; Nat. Prod 2005, 68, 423. [Crossref]
» Crossref -
18 Paier, C. R. K.; Maranhão, S. S. A.; Carneiro, T. R.; Lima, L. M.; Rocha, D. D.; Santos, R. S.; Farias, K. M.; de Moraes-Filho, M. O.; Pessoa, C.; Clinics 2018, 73, e813s. [Crossref]
» Crossref - 19 Pessoa, C.; Nepomuceno, W. A. B.; Rocha, D. D.; Cavalcanti, B. C.; Meira, A. S.; Diniz Filho, J.; Costa, P. M.; Banwell, M. G.; Guest, E. P.; Di Fiore, S.; Fischer, R.; WO2013000054 (A1) 2013.
-
20 Bondarev, A. D.; Attwood, M. M.; Jonsson, J.; Chubarev, V. N.; Tarasov, V. V.; Schiöth, H. B.; Br. J. Clin. Pharmacol 2021, 87, 4577. [Crossref]
» Crossref -
21 Chou, T.; Martin, N.; ComboSyn Incorporated; Paramus, NJ, 2005. [Link] accessed in January 2026
» Link -
22 Chou, T. C.; Pharmacol. Rev 2006, 58, 621. [Crossref]
» Crossref -
23 Chou, T. C.; Martin, N.; CompuSynFor Drug Combinations User’s Guide; ComboSyn, Inc: Paramus, NJ, 2005. [Crossref]
» Crossref - 24 Raphael, S. S.; Lynch: Técnicas de Laboratório, 4th ed.; Manole: São Paulo, Brazil, 1986.
-
25 Renylab Química e Farmacêutica Ltda. Kit Corante Rápido [Link] accessed in January 2026
» Link - 26 Lima, A. O.; Soares, J. B.; Greco, J. B.; Galizzi, J.; Cançado, J. R.; Métodos de Laboratório Aplicados à Clínica: Técnica e Interpretação, 7th ed.; Guanabara Koogan: Rio de Janeiro, Brazil, 1992.
-
27 Agarwal, S.; Mehrotra, R.; JSM Chem 2016, 4, 1024. [Crossref]
» Crossref -
28 Meng, X. Y.; Zhang, H. X.; Mezei, M.; Cui, M.; Curr. Comput.-Aided Drug Des 2011, 7, 146. [Crossref]
» Crossref -
29 Aswad, A.; Liu, T.; Adv. Cancer Res. 2021, 152, 179. [Crossref]
» Crossref -
30 Akerberg, B. N.; Pu, W. T.; Cold Spring Harbor Perspect. Biol. 2020, 12, a036756. [Crossref]
» Crossref -
31 Drew, K.; Wallingford, J. B.; Marcotte, E. M.; Mol. Syst. Biol 2021, 17, e10016. [Crossref]
» Crossref -
32 Kaur, S.; Rajoria, P.; Chopra, M.; Cell. Oncol 2022, 45, 779. [Crossref]
» Crossref -
33 Li, T.; Garcia-Gomez, A.; Morante-Palacios, O.; Ciudad, L.; Özkaramehmet, S.; Van Dijck, E.; Rodríguez-Ubreva, J.; Vaquero, A.; Ballestar, E.; Nucleic Acids Res 2020, 48, 665. [Crossref]
» Crossref -
34 Cao, M.; Wang, L.; Xu, D.; Bi, X.; Guo, S.; Xu, Z.; Chen, L.; Zheng, D.; Li, P.; Xu, J.; Zheng, S.; Wang, H.; Wang, B.; Lu, J.; Li, K.; Comput. Struct. Biotechnol. J 2022, 20, 5028. [Crossref]
» Crossref -
35 Farias, K.; da Costa, R. F.; Meira, A. S.; Diniz-Filho, J.; Bezerra, E. M.; Freire, V. N.; Guest, P.; Nikahd, M.; Ma, X.; Gardiner, M. G.; Banwell, M. G.; de Oliveira, M. D. C. F.; de Moraes, M. O.; do Ó Pessoa, C.; ACS Med. Chem. Lett. 2020, 11, 1274. [Crossref]
» Crossref -
36 de Farias, K.; Rosa-Ribeiro, R.; Souza, E. E.; Kobarg, J.; Banwell, M. G.; Vieira Neto, J. B.; Sales, S. L. A.; Costa, P. R. R.; Santos, R. C.; Gaspar, F. V.; Barreto Jr., A. G.; Oliveira, M. C. F.; Moraes, M. O.; Furtado C. L. M.; Carvalho, H. F.; Pessoa, C.; Chem. Biodiversity 2022, 19, e202200102. [Crossref]
» Crossref -
37 Ganai, S. A.; Sheikh, F. A.; Baba, Z. A.; Mir, M. A.; Mantoo, M. A.; Yatoo, M. A.; Phytotherapy Res 2021, 35, 3509. [Crossref]
» Crossref -
38 Scafuri, B.; Bontempo, P.; Altucci, L.; Masi, L.; Facchiano, A.; Biomedicines 2020, 8, 568. [Crossref]
» Crossref -
39 Boik, J. C.; Newman, R. A.; BMC Pharmacol 2008, 8, 13. [Crossref]
» Crossref -
40 Lopez, J. S.; Banerji, U.; Nat. Rev. Clin. Oncol 2017, 14, 57. [Crossref]
» Crossref -
41 Ozyerli-Goknar, E.; Bagci-Onder, T.; Cancers 2021, 13, 3210. [Crossref]
» Crossref -
42 Sharma, P.; Kaushal, N.; Saleth, L. R.; Ghavami, S.; Dhingra, S.; Kaur, P.; Biochim. Biophys. Acta Mol. Basis Dis 2023, 1869, 166742. [Crossref]
» Crossref -
43 Liu, L.; Gong, F.; Jiang, F.; Epigenetics in Organ Specific Disorders. 2023, 34, 51. [Crossref]
» Crossref -
44 Wu, M.; Jiang, M.; Xue, M.; Li, Q.; Cheng, B.; Huang, M.; Xu, L.; Zhang, Y.; J. South. Med. Univ 2020, 40, 1230. [Crossref]
» Crossref -
45 Zhu, J.; Cheng, X.; Naumovski, N.; Hu, L.; Wang, K.; Crit. Rev. Food Sci. Nutr 2023, 65, 627. [Crossref]
» Crossref -
46 Xu, X.; Ji, S.; Chen, Y.; Xia, S.; Li, Y.; Chen, L.; Li, Y.; Zhang, F.; Zhang, Z.; Zheng, S.; Cell Commun. Signal. 2023, 21, 47. [Crossref]
» Crossref -
47 Sacko, K.; Thangavel, K.; Shoyele, S. A.; Nanomaterials 2019, 9, 1052. [Crossref]
» Crossref -
48 Guo, L.; Zheng, X.; Wang, E.; Jia, X.; Wang, G. Wen, J.; Biomed. Pharmacother 2020, 125, 109784. [Crossref]
» Crossref -
49 Imran, K. M.; Yoon, D.; Lee, T. J. Kim, Y. S.; BMB Rep 2018, 51, 249. [Crossref]
» Crossref -
50 Su, P.; Yang, Y.; Wang, G.; Chen, X.; Ju, Y.; Int. J. Oncol 2018, 53, 1343. [Crossref]
» Crossref -
51 Pal, D.; Raj, K.; Nandi, S. S.; Sinha, S.; Mishra, A.; Mondal, A.; Lagoa, R.; Burcher, J. T.; Bishayee, A.; Cancers 2023, 15, 2808. [Crossref]
» Crossref -
52 Balaji, S.; Anbarasu, S.; Ramaiah, S.; Anbarasu, A.; Discovery Oncol 2025, 16, 1389. [Crossref]
» Crossref -
53 Talib, W. H.; Alsayed, A. R.; Barakat, M.; Abu-Taha, M. I.; Mahmod, A. I.; Biomedicines 2021, 9, 1353. [Crossref]
» Crossref -
54 Nepali, K.; Chang, T. Y.; Lai, M. J.; Hsu, K. C.; Yen, Y.; Lin, T. E.; Lee, S. B.; Liou, J. P.; Eur. J. Med. Chem 2020, 196, 112291. [Crossref]
» Crossref -
55 Waitman, K. B.; Almeida, L. C.; Primi, M. C.; Carlos, J. A. E. G.; Ruiz, C.; Kronenberger, T.; Laufer, S.; Goettert, M. I.; Poso, A.; Vassiliades, S. V.; Souza, V. A. M.; Toledo, M. F. Z. J.; Hassimotto, N. M. A.; Cameron, M. D.; Bannister, T. D.; Costa-Lotufo, L. V.; Machado-Neto, J. A.; Tavares, M. T.; Parise-Filho, R.; Eur. J. Med. Chem 2024, 263, 115935. [Crossref]
» Crossref
Edited by
-
Editor handled this article:
Paulo Augusto Netz (Associate)