Effects of Silicon Addition on the Solidification Parameters, As-cast Microstructure, Microhardness and 3D Porous Formation in Aluminum Alloys Obtained under Slow Cooling Process
Abstract
In this experimental study, we present and discuss the effects of 3, 5, and 7 wt.% Si additions on the thermal parameters, phase transformations, microstructural patterns, microhardness, and 3D porous formation in binary Al - 2 wt.% Cu alloy. Through the phase diagram and Thermo-Calc Scheil simulation, one can determine the growth sequence of the phases during the cooling process. With slow cooling curves and its second derivatives, liquidus temperatures can be found. An approach based on the second derivative curve was adopted to determine the onset of solidification and subsequent phase transformations. The experimental results determined with the slow cooling curves are corroborated by those calculated by Thermo-Calc software. A data acquisition system was used to record the experimental slow cooling curves for subsequent thermal analysis. Higher silicon concentrations, shorter solidification range and refined microstructures were key factors acting during solidification, which served to conditions changes in the microhardness and 3D porous formation. The relationships between porosity content with silicon concentration (PC = 1.46%Si0.7813 with R2 = 0.97) and secondary dendritic arm spacing (PC = 1692.7λ2-1.44 with R2 = 0.99) are presented and discussed from experimental equations. This result indicates that porous formation during solidification process is closely connected to the silicon concentrations and dendrite arm spacings.
Keywords:
Ternary aluminum alloy; solidification parameters; thermal analysis; microhardness; 3D porous
1. Introduction
Cast Al-Si-Cu alloys are widely adopted in various engineering applications, especially in automotive and aerospace industries, due to light weight, high strength and good castability. For automotive industry, vehicles built with aluminum parts are lighter and therefore consume less energy. These aluminum alloys have been used for automotive parts, for the transmission cases, converter housing and cylinder blocks. These parts, previously made of the cast iron, have been gradually replaced by cast aluminum alloys, because of their contribution to a higher energy efficiency and lower levels of gas emission. Ternary Al-Si-Cu alloys are cast aluminum alloys widely considered because its excellent properties, such as high cast-ability, low density and relatively high strength. On the other hand, cast aluminum alloys have not been always suitable for automotive industries. This is because cast defects are included in these cast components. Applications of cast aluminum alloys to the manufacture of critical safety parts, has been considerably restricted, Farina et al.1. In previous papers found in the literature, it was reported various kinds cast defects in these materials, e.g., cracks, abnormal microstructures and porosities. In continuous casting process, molten metal is solidified into a cooled mould before subsequent rolling in the finishing mills. Under this condition, dendrite growth occurs from mould wall, resulting in contraction voids in the middle of the cast ingot. The mechanical properties, such as strength and elongation of these aluminum alloys decreases almost linearly with increase defect size. The reduction of the tensile properties is also affected by the type of cast defect. The said reduction is favored by the abnormal structure and contraction voids, which are included in the cast component, Li et al.2.
Since the solidification process is the main mechanism that occurs during casting, the understanding of thermal conditions, as well as structures, can lead to betters of the as-cast parts. Analysis of slow cooling curve (temperature versus time), allows metallurgists and physicists to monitor the progress of phases transformation during solidification process. Specifically, temperature-time curve provides an accurate assessment of the potential nucleation and modification states of the melt prior to casting. Thermal analysis has become very important to study of slow cooling curve characteristics due to it helps realize the desired properties in as-cast aluminum alloys. In addition, the derivative of the slow cooling curves allows the determination of the kinetics and dynamics of the thermal process that occur during the alloys crystallization3-5.
Aluminum alloys are susceptible to porosity formation during solidification. The melt in the aluminum melt process may absorb hydrogen in the atmosphere and decompose the water that has accumulated on crucible furnace. If the melt absorbs excess hydrogen, it may affect the porosity of the final product. Metal degassing is an intermediate step in aluminum alloys production between the melting and casting. Due to the reaction with water vapor, hydrogen is mainly dissolved in liquid aluminum. In order to prevent the formation of holes during the casting, hydrogen is removed from liquid metal through degassed. Metal degassing is achieved by injecting an inert gas (argon), which is combined with hydrogen bubbles6-9. An experimental study on the directional solidification of hypoeutectic aluminum-silicon alloys, with a focus on the influence of solidification parameters and silicon content on structural and mechanical properties was conducted by Ibañez et al.10. According to the authors, among conclusions regarding the effect of thermal parameters on the columnar-to-equiaxed transition (CET) and conditions governing its formation, it can be highlighted: CET is observed under low or negative thermal gradients. Variations in cooling rate have a strong impact on the CET, while silicon content influence is only significant at lower cooling rates. As expected, as cooling rate and silicon content increased, an improvement in microhardness and tensile strength was observed.
Ferreira et al.11 investigated the macrosegregation and microporosity in a ternary Al – 6 wt.%Cu – 1 wt.%Si alloy, considering phases formation, composition and density. According to the authors, the 1 wt% Si addition to the binary Al-Cu alloy increases the volumetric fraction of pores as compared with the porosity found in Al - 6 wt.% Cu alloy. It is also observed that the use of a carbon steel chill mold induced an abnormal surface which was caused by a high Fe concentration provoked by the diffusive flux of iron from the chill.
From this general framework that the present work is elaborated, highlighting the phase formation, as-cast microstructures, microhardness and porosity analysis in 3D images for ternary Al – Si – Cu alloys obtained under slow cooling process. The reason we considered copper in our solidification experiments, it is due to the fact that adding 2 wt.% Cu to aluminum alloy increases tensile strength, hardness, and wear resistance, primarily through precipitation hardening (Al2Cu phases). On the other hand, adding silicon to aluminum in the range from 3 to 7 wt. % acts to improve castability, fluidity, and hardness while increase strength. These silicon concentrations are widely considered in automotive industry due to their improved structural, wear, and thermal properties9. The sequence of phase formation during the cooling process, it was calculated according to the Thermo-Calc Scheil simulation. The computer-aided cooling curve analysis (CA-CCA), with its second derivative, has been used to experimental validation of liquidus temperature. A microcomputed tomography was used in order to characterize the porosity formation with 3D images. Series of X-ray projection images was computed into cross-section images through the reconstruction computational process. Thus, these slices could be analyzed, further processed into 3D images. It stands out among results the effects of the silicon concentration and secondary dendritic arm spacings (λ2) on the Vickers microhardness (HV) and 3D porosity formation during solidification experiments. High silicon content, shorter solidification range with more refined microstructures were key factors acting during the solidification experiments under slow cooling condition, which served to conditions changes both in the microhardness and 3D porosity formation.
2. Experimental Procedure
It is worth mentioning that Scheil model assumes no diffusion in the solid region, (i.e., zero back-diffusion); complete mixing in the liquid region, and local equilibrium at the solid/liquid interface. Scheil model adopted in this work, it was used with the objective of phase formation during solidification of the ternary aluminum alloys. Therefore, phase diagram and Scheil model revealing of phases precipitation were calculated by Thermo-Calc software using the aluminum-based alloys databases v.4.0, Ref12.
Ingots of the ternary aluminum alloy were prepared in electrical resistance furnace at 700 oC. The materials were obtained from commercial purity metals, i.e. 99.9 wt.% aluminum, 99.8 wt.% silicon and 99.9 wt.% copper. Its chemical composition was measured using a fluorescence X-ray spectrometry. During the melting, a steel rod with a 1 mm thick layer of insulating alumina was used to ensure homogeneity of the melt.
The experimental rig for slow cooling was developed by using a wooden chamber with a tick insulating blanket to achieve a very slow cooling rate. The molten aluminum alloys then were placed into this rig and allowed to solidify. The cooling rate was achieved by allowing the molten to cool naturally at room temperature. The temperature profile of the molten was determined by using one k-type thermocouple immersed about half into the molten metal height in the graphite crucible. The thermocouple was connected to a data-logger hardware which linked to a notebook; the data logger was set at 0.001 s intervals to allow for an accurate determination of the thermal parameters. The methodology adopted for slow cooling curve was previously described in greater detail in Refs13,14. For solidification experiment with slow cooling, its cooling rate was around 0.09 oC/s. The cooling curve was plotted, and its second derivative was determined using Tecplot Visualization and Analysis software (TECPLOT 360) to analyze the characteristic data. With cooling curve and its derivative, the liquidus temperature (TL) was determined during solidification process.
After the solidification experiments, cylindrical ingots were sectioned along its vertical axis, mechanically polished with abrasive paper, and subsequently etched with an acid solution (25 ml H2O, 2.5 ml HF, 25 ml HNO3, 60 ml HCl) in order to reveal its macrostructure. After the macrostructural analysis, samples were taken from the middle of the solidified ingot, were polished and etched with a solution 0.5% HF for micrograph examination. It is worth mentioning that samples were taken from regions very close to the thermocouples, and the thermocouples maintained their positions even after the solidification experiments.
From temperature data collected during experiments, was possible to determine the thermal parameters, such as solidification range (ΔT = TL - TS) and cooling rate (Ṫ). The cooling rates (Ṫ) have been determined considering the temperature (T) versus time (t) data immediately after the passage of TL for the thermocouple position. So, cooling rate is determined, for thermocouple position, as Ṫ = DT/dt, consistent with Ferreira et al.9.
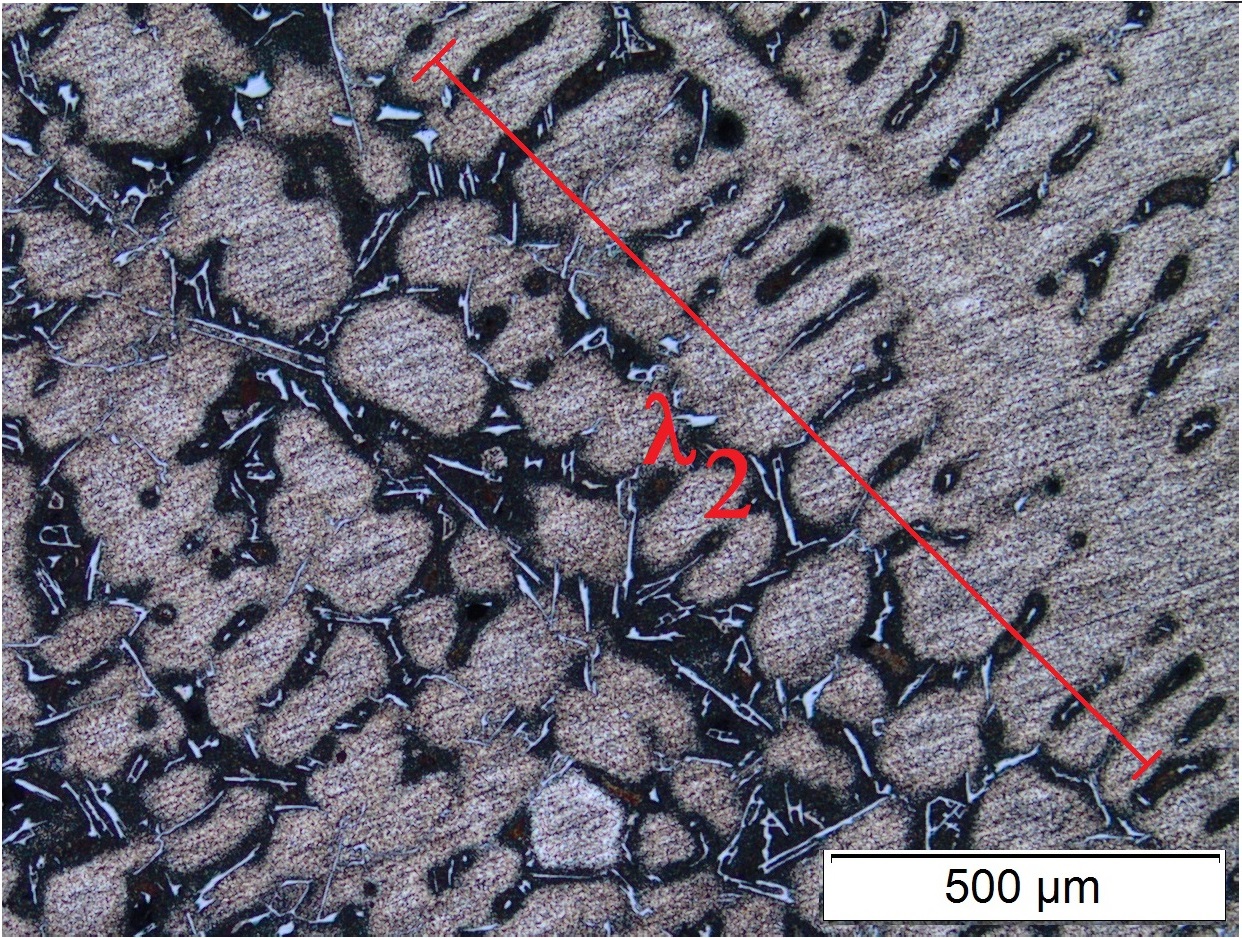
An Olympus Optical Microscope (Olympus Corporation, Japan) was used to produce digital images that were analyzed using the Goitaca (https://sourceforge.net/projects/goitacaeq) image processing software in order to measure secondary dendritic arm spacings (λ2). Dendrite spacing usually refers to the distance between primary arms (λ1) of the dendrite. However, if secondary (λ2) or tertiary arms (λ3) are present, the spacing will be determined by that smaller dimension. It is well known that smaller dimensions of dendrite arm spacings become more significant for the mechanical properties of the as-cast materials, Ferreira et al.9. Figure 1 is a representative micrograph of a transverse section from which dendrite spacing (λ2) measurements were made. Its spacings were determined by averaging the distance between adjacent side branches. A usual expression for the spacing values of dendrites, as indicated by Ferreira et al.9, is
where L is the total spacing from the first to the last secondary arm, and n represents the number of the existing well-developed and parallel dendrite arms in this measuring length L. The average dendritic arm spacing was determined from about 40 to 45 measurements for each examined position along the entire die-casting.
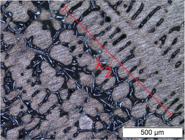
Micrograph of ternary Al – 7 wt.% Si – 2 wt.% Cu alloy, which illustrates measuring the secondary dendrite-arm spacings (λ2).
To determine resistance to deformation of the ternary aluminum alloys, microhardness test was carried out at room temperature using Leitz Wetzlar Microhardness Tester. Microhardness tests were measured at least in 25 different regions, using a Vickers pyramidal indenter with a load and loading time of 100 g and 15 s, respectively.
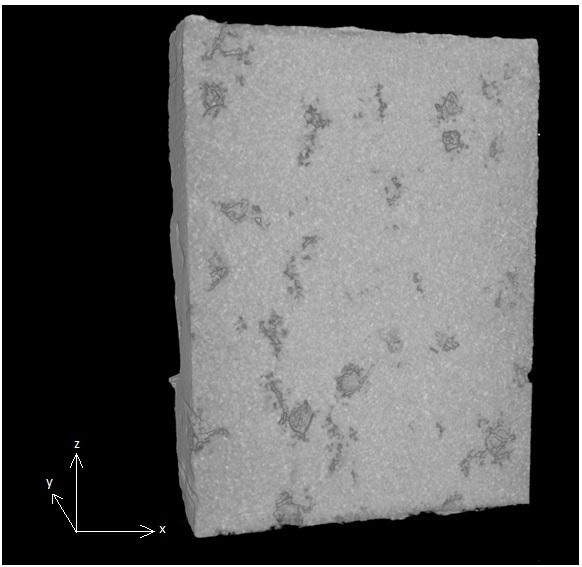
In order to characterize the pores, all samples were cut in the transverse directional plane, mounted in conducting Bakelite, and polished to a 0.05 mm finish. Microcomputed tomography also called Micro-CT is a 3D imaging technique, which was performed in present work, using a Phoenix Vtomex GE equipment. Phoenix Vtomex m GE microtomograph is equipped with two X-ray tubes and operated at 100 kV. X-rays were transmitted through the as-cast samples, with a 360º rotation at a step of 0.24º and recorded by the X-ray detector as a 2D projection image. The detection system consists of a Flat-Panel DXR type sensor and reconstruction was performed using Datos/x 2 Reconstruction software, version 2.5.0. The series of X-ray projection images was then computed into cross-sectional images through the computational process called “reconstruction”, Figure 2.
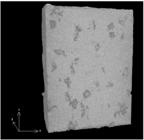
Microcomputed tomography using Phoenix Vtomex GE for as-cast sample of ternary Al – 7 wt.% Si – 2 wt.% Cu alloy.
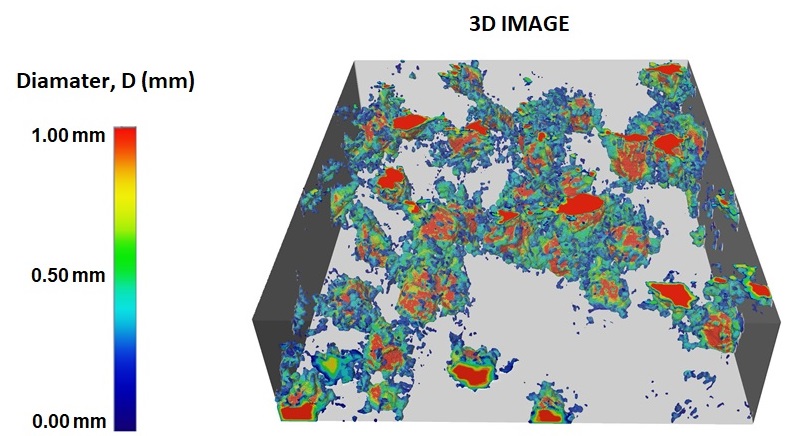
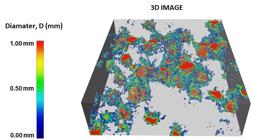
These slices can be analyzed, further processed into 3D images. These slices, which constitute the interest volume, were joined using the FDK (Feldkamp-Davis-Kress) algorithm to generate the 3D image, Figure 3.
3. Results and Discussion
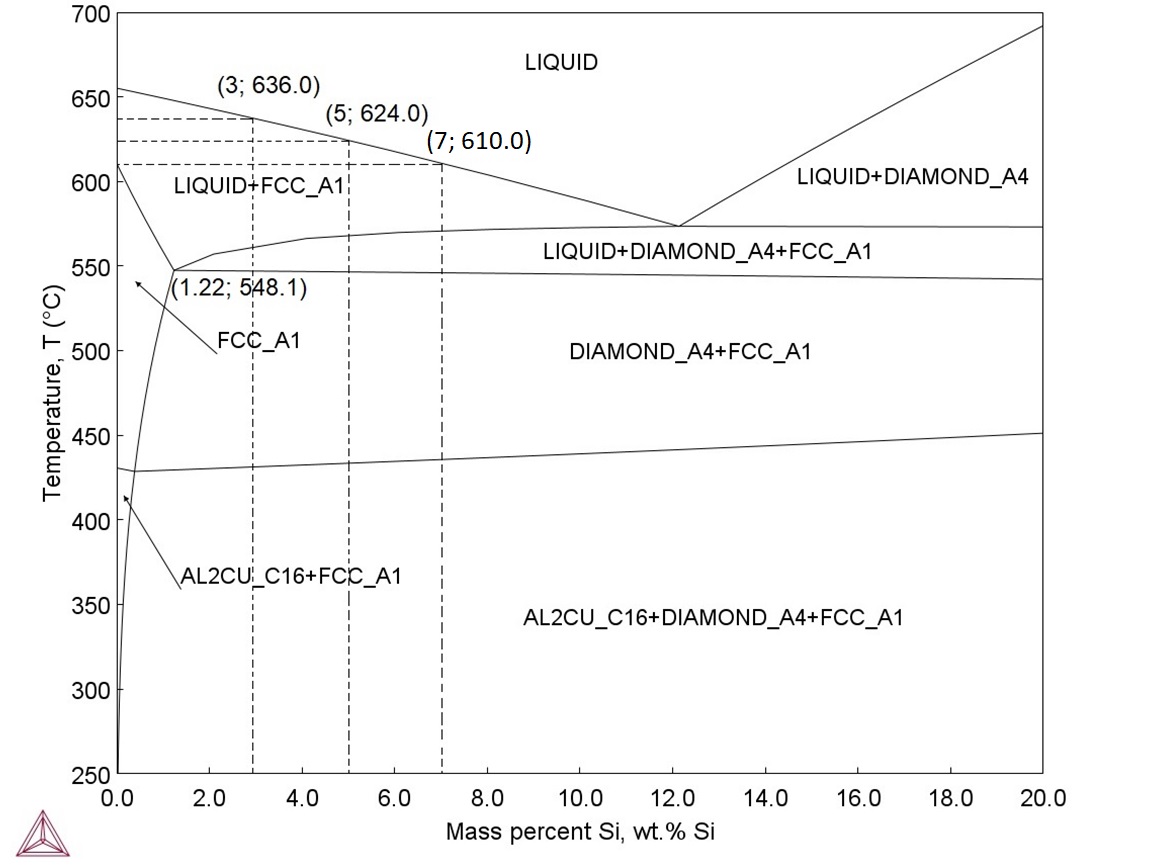
Figure 4 shows the phase diagram of the ternary Al – X wt.% Si – 2 wt.% Cu alloy calculated by Thermo-Calc software using the aluminum-based alloys databases v.4.0, Ref12.
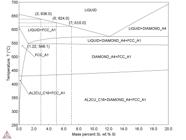
Phase diagram of Al – X wt.% Si – 2 wt.% Cu alloy calculated by Thermo-Calc software using the aluminum-based alloys databases v.4.0, Ref12.
For Al - 3 wt.% Si - 2 wt.% Cu, Al - 5 wt.% Si - 2 wt.% Cu and Al - 7 wt.% Si - 2 wt.% Cu alloy, during the cooling process, solidification begins at temperatures of 636.0, 624.0 and 610.0 oC, respectively. For any ternary alloy analyzed, the solidification ends when the temperature reaches their solidus temperature of 548.1oC, as indicated in Figure 4, which highlights the liquid-solid transformation region. For the ternary alloy system, the limit of silicon solubility in the solid phase (FCC_A1) can be found at 1.22 wt.% Si, with temperature of 548.1 oC. The solidification range is determined by the difference between liquidus and solidus temperatures (ΔT = TL–TS). It is worth mentioning that as-cast alloys with wide solidification intervals are susceptible to segregation during the solidification experiment. We can see that in the ternary Al - 3 wt.% Si - 2 wt.% Cu alloy case, solidification occurs in a range of temperatures wider when compared to those determined for ternary Al - 5 wt.% Si - 2 wt.% Cu and Al - 7 wt.% Si - 2 wt.% Cu alloys. For ternary Al - 3 wt.% Si - 2 wt.% Cu alloy, solidification range is equal to 87.9 oC, while for Al - 5 wt.% Si - 2 wt.% Cu alloy, its solidification range is around 75.9 oC and Al - 7 wt.% Si - 2 wt.% Cu alloy has a shorter solidification range of 61.9 oC. It is important to note that shorter solidification range result in better mechanical and physical properties by reducing the width of the mushy zone9.
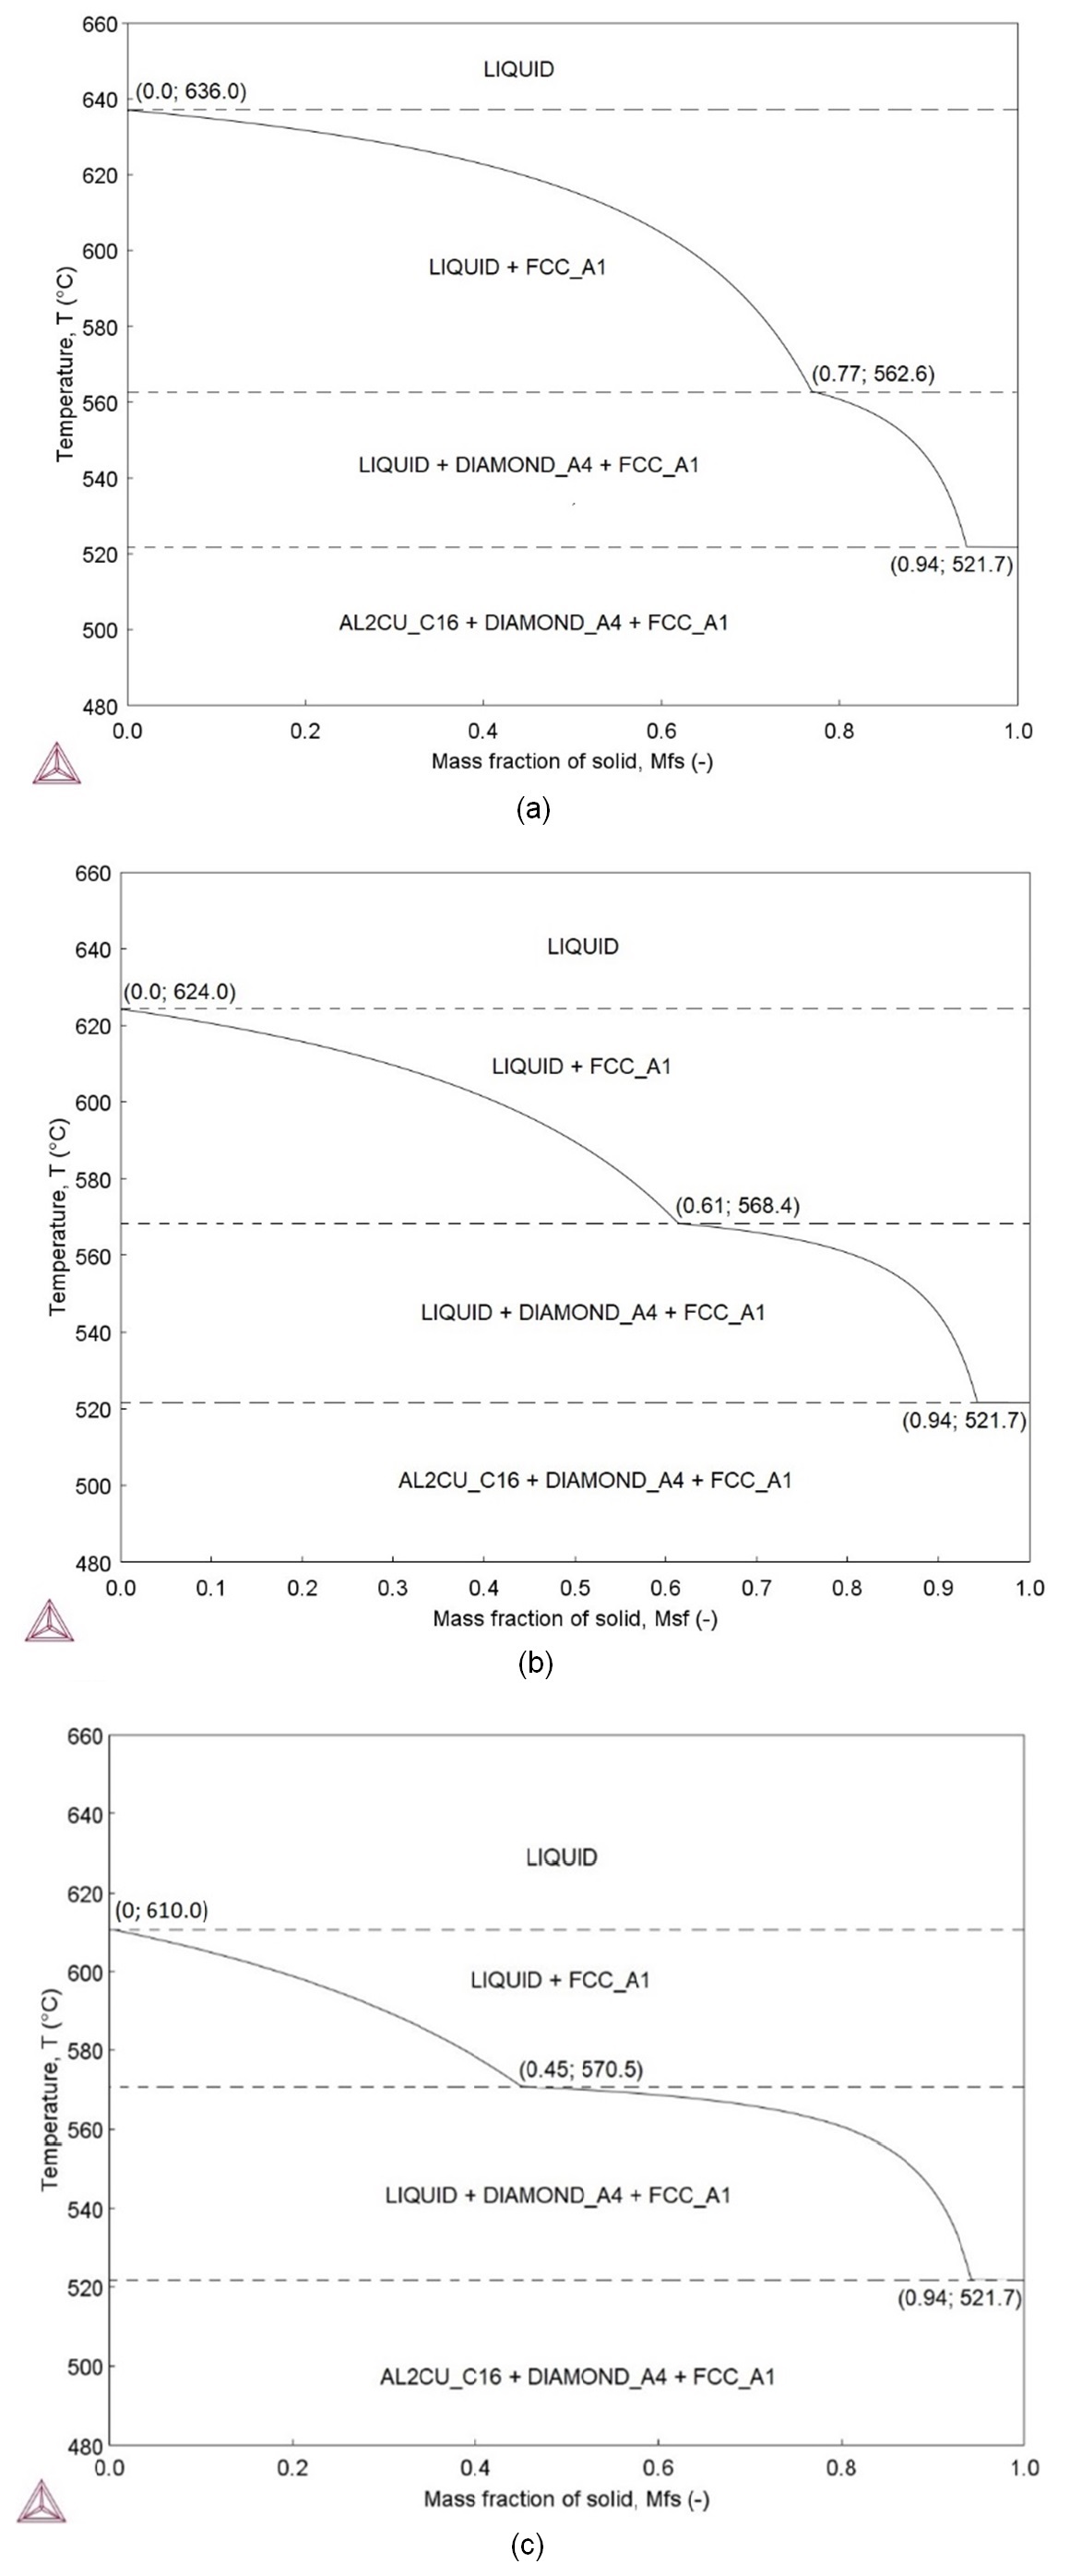
Figure 5ac shows Thermo-Calc Scheil simulation for the ternary aluminum alloys. Through the graphs of temperature versus solid fraction, one can predict the growth sequence of each solid phase during cooling process. From the liquidus temperature (636.0, 624.0 and 610.0 oC), the FCC_Al solid phase starts to grow as a primary solid, and at 521.7 oC all the solutes-enriched liquid will give rise to a 6% eutectic fraction, for all aluminum alloys analyzed. Calculations by Scheil model, revealed precipitation of solid phases during cooling. For Al – 3 wt.% Si – 2 wt.% Cu alloy, between 636.0 and 562.6 oC, one can see liquid and solid (LIQUID + FCC_A1) and, from 562.6 to 521.7 oC were observed liquid and two solids (LIQUID + DIAMOND_A4 + FCC_A1), Figure 5a. For Al – 5 wt.% Si – 2 wt.% Cu alloy, liquid and solid (LIQUID + FCC_A1) were observed between 624.0 and 568.4 oC, one can see liquid and solid (LIQUID + FCC_A1) and, from 568.4 to 521.7 oC were observed liquid and two solids (LIQUID + DIAMOND_A4 + FCC_A1), Figure 5b. While, for aluminum alloy with highest silicon concentration (Al – 7 wt.% Si – 2 wt.% Cu), liquid and primary solid (FCC_A1) were found from 610.0 to 570.5 oC and, between 570.5 and 521.7 oC were observed liquid and two solids (LIQUID + DIAMOND_A4 + FCC_A1), Figure 5c.
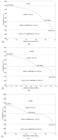
Equilibrium Scheil model revealing precipitation of phases during cooling: (a) Al – 3 wt.% Si – 2 wt.% Cu; (b) Al – 5 wt.% Si – 2 wt.% Cu; and (c) Al – 7 wt.% Si – 2 wt.% Cu.
The results suggest that silicon additions in the aluminum alloy were responsible for changes in the solidification path, as presented in Table 1.
Solidification thermal parameters of the ternary aluminum alloys with different silicon concentrations.
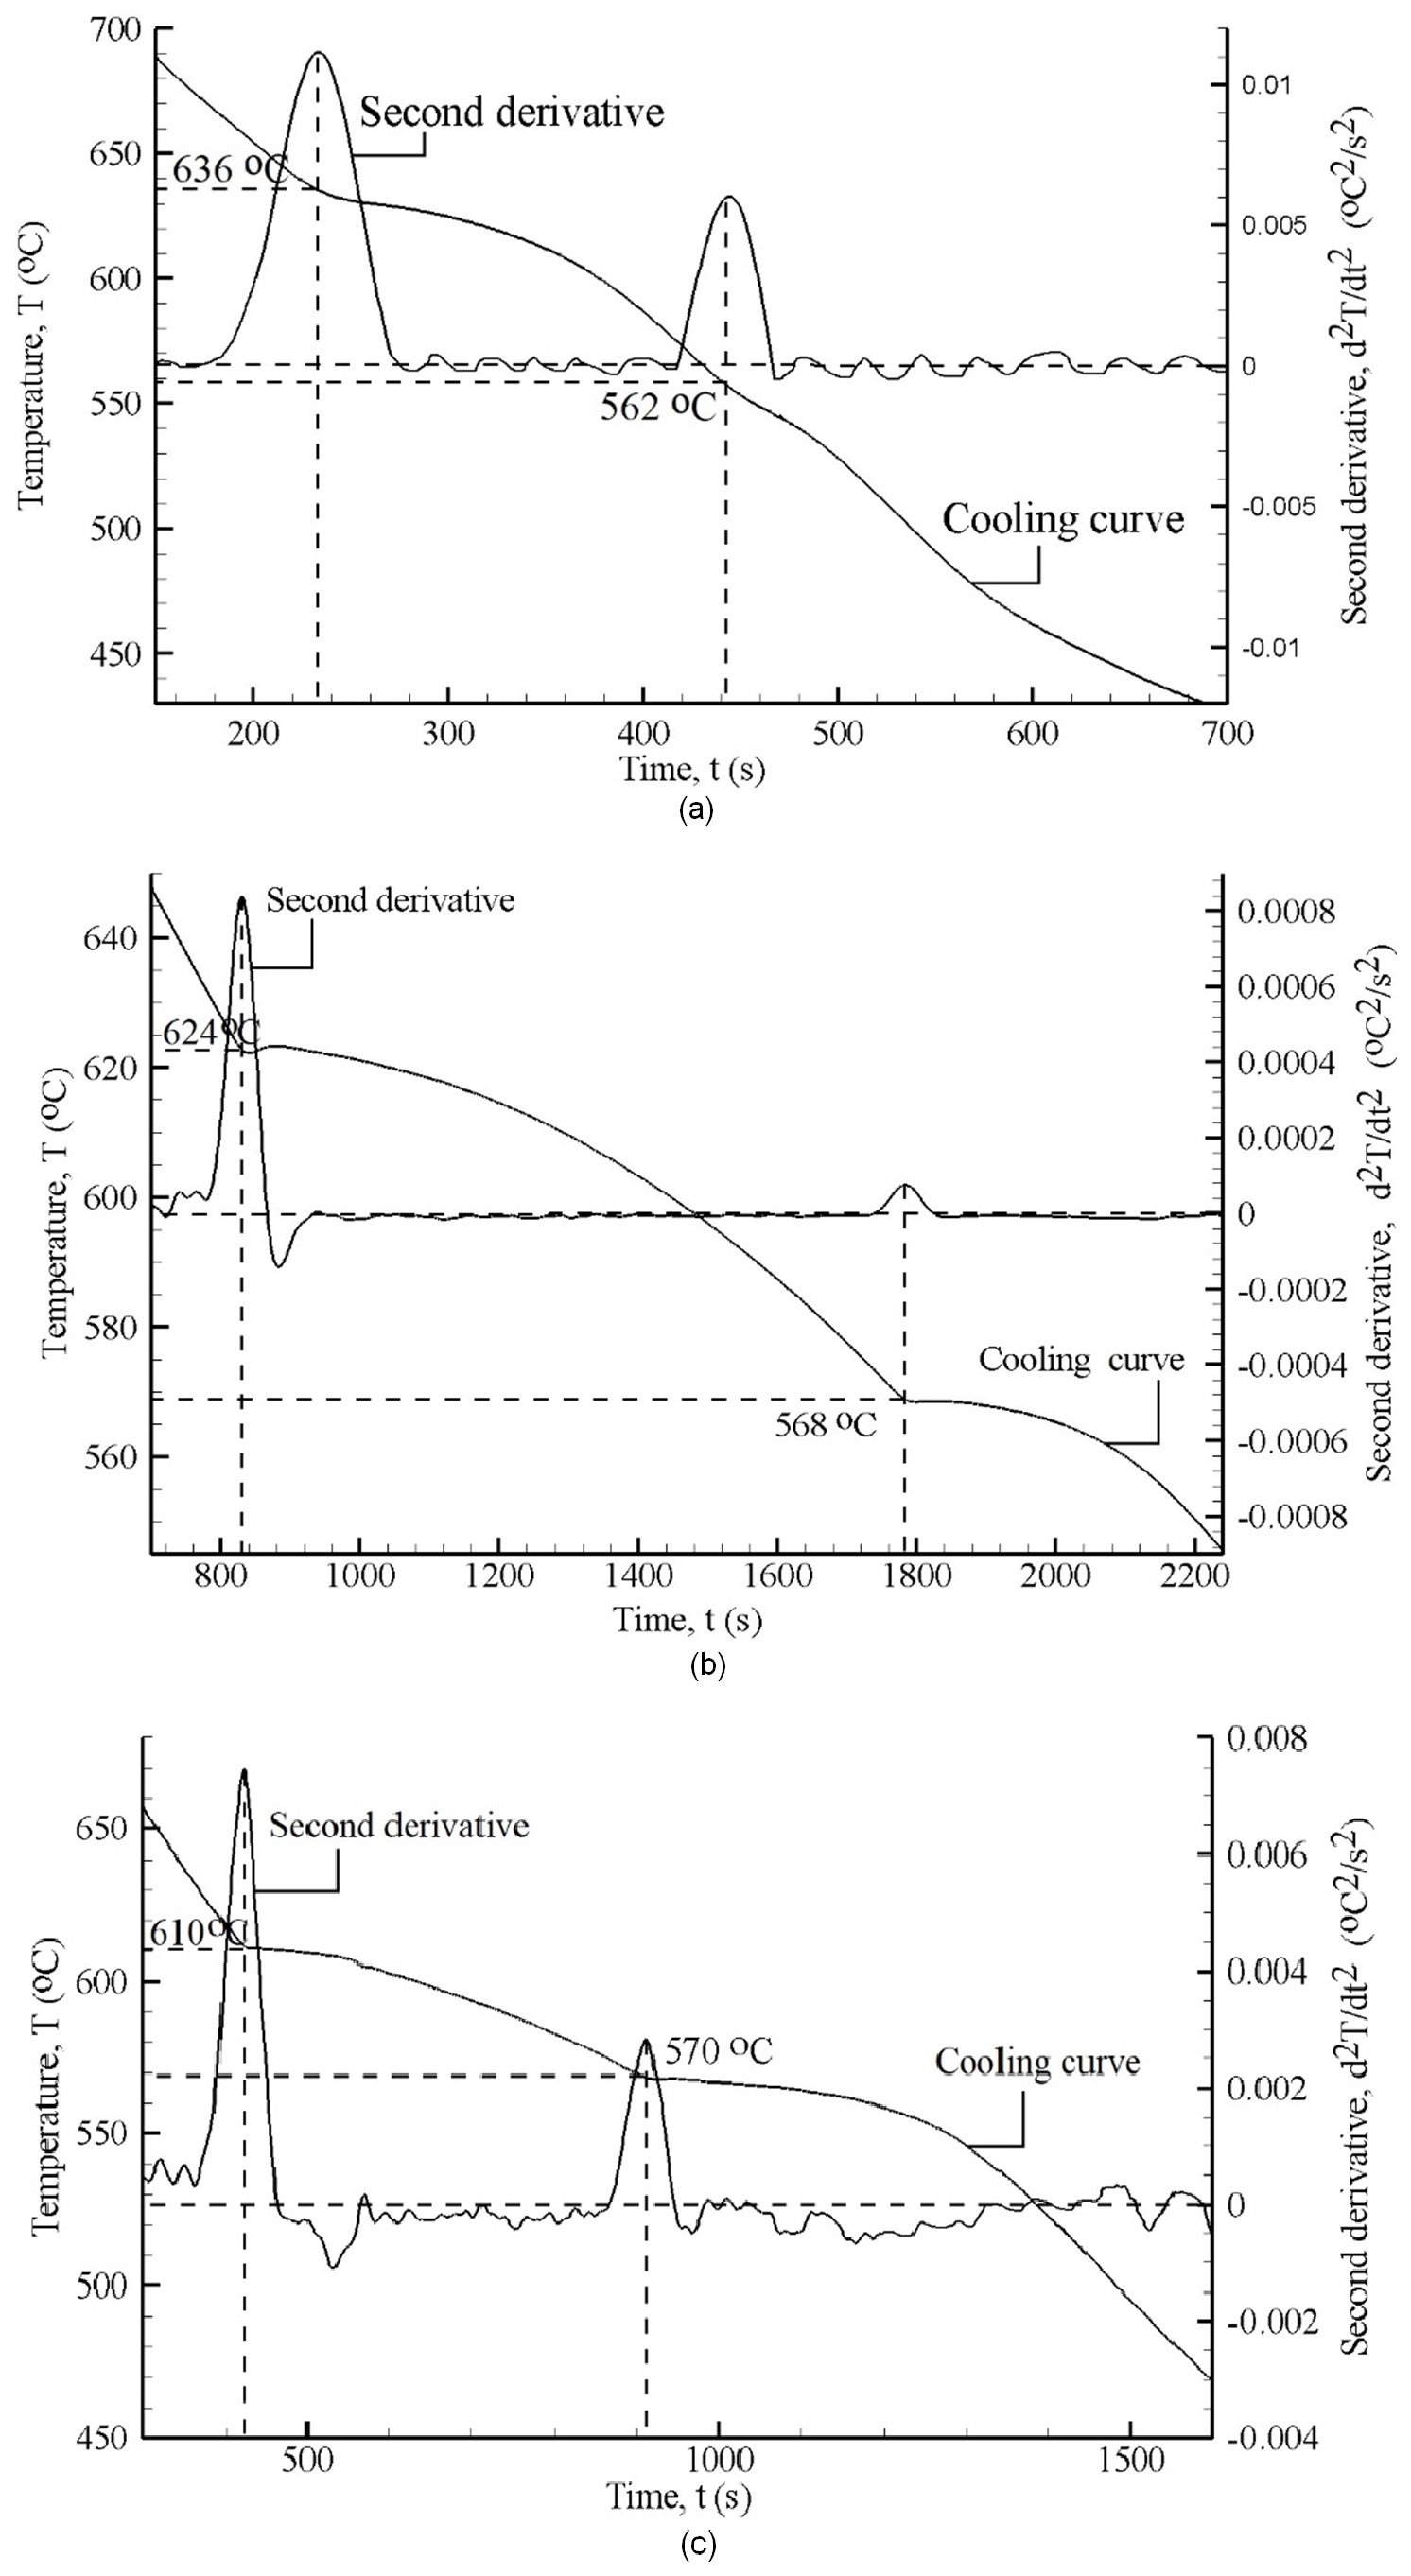
Figure 6ac shows corresponding experimental validations of phase change temperatures for ternary aluminum alloys. In addition to the cooling curves, its second derivative is plotted in these graphs. It is worth mentioning that the cooling curve is obtained from slow solidification conditions, i.e., without any water-cooled solidification system. The slow solidification experiments were performed with a cooling rate at around 0.09 oC/s. The cooling rates (Ṫ) were calculated from the slope of the cooling curve in the liquid region, Refs4,14-16. Figure 6ac demonstrates that solidification process begins at about 636.0, 624.0 and 610.0 oC as indicated by the change in the cooling curve caused by the release of latent heat. The cooling curves were plotted, and the second derivatives of the cooling curves were produced using the Tecplot 360 software to analyze the data. At the temperatures of 562.0, 568.0 and 570.0 oC the slope of cooling curves is again altered. These slope changes in cooling curve provoke an abrupt increase in second derivative values, indicating the beginning and end of solid phase precipitation during solidification experiments. In this work, approach based on the second derivative curve was adopted to determine the beginning of solidification process and subsequent phase transformation.
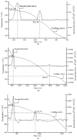
Slow cooling curve and its second derivative with corresponding phase transformations: a) Al – 3 wt.% Si – 2 wt.% Cu; b) Al – 5 wt.% Si – 2 wt.% Cu; and c) Al – 7 wt.% Si– 2 wt.% Cu.
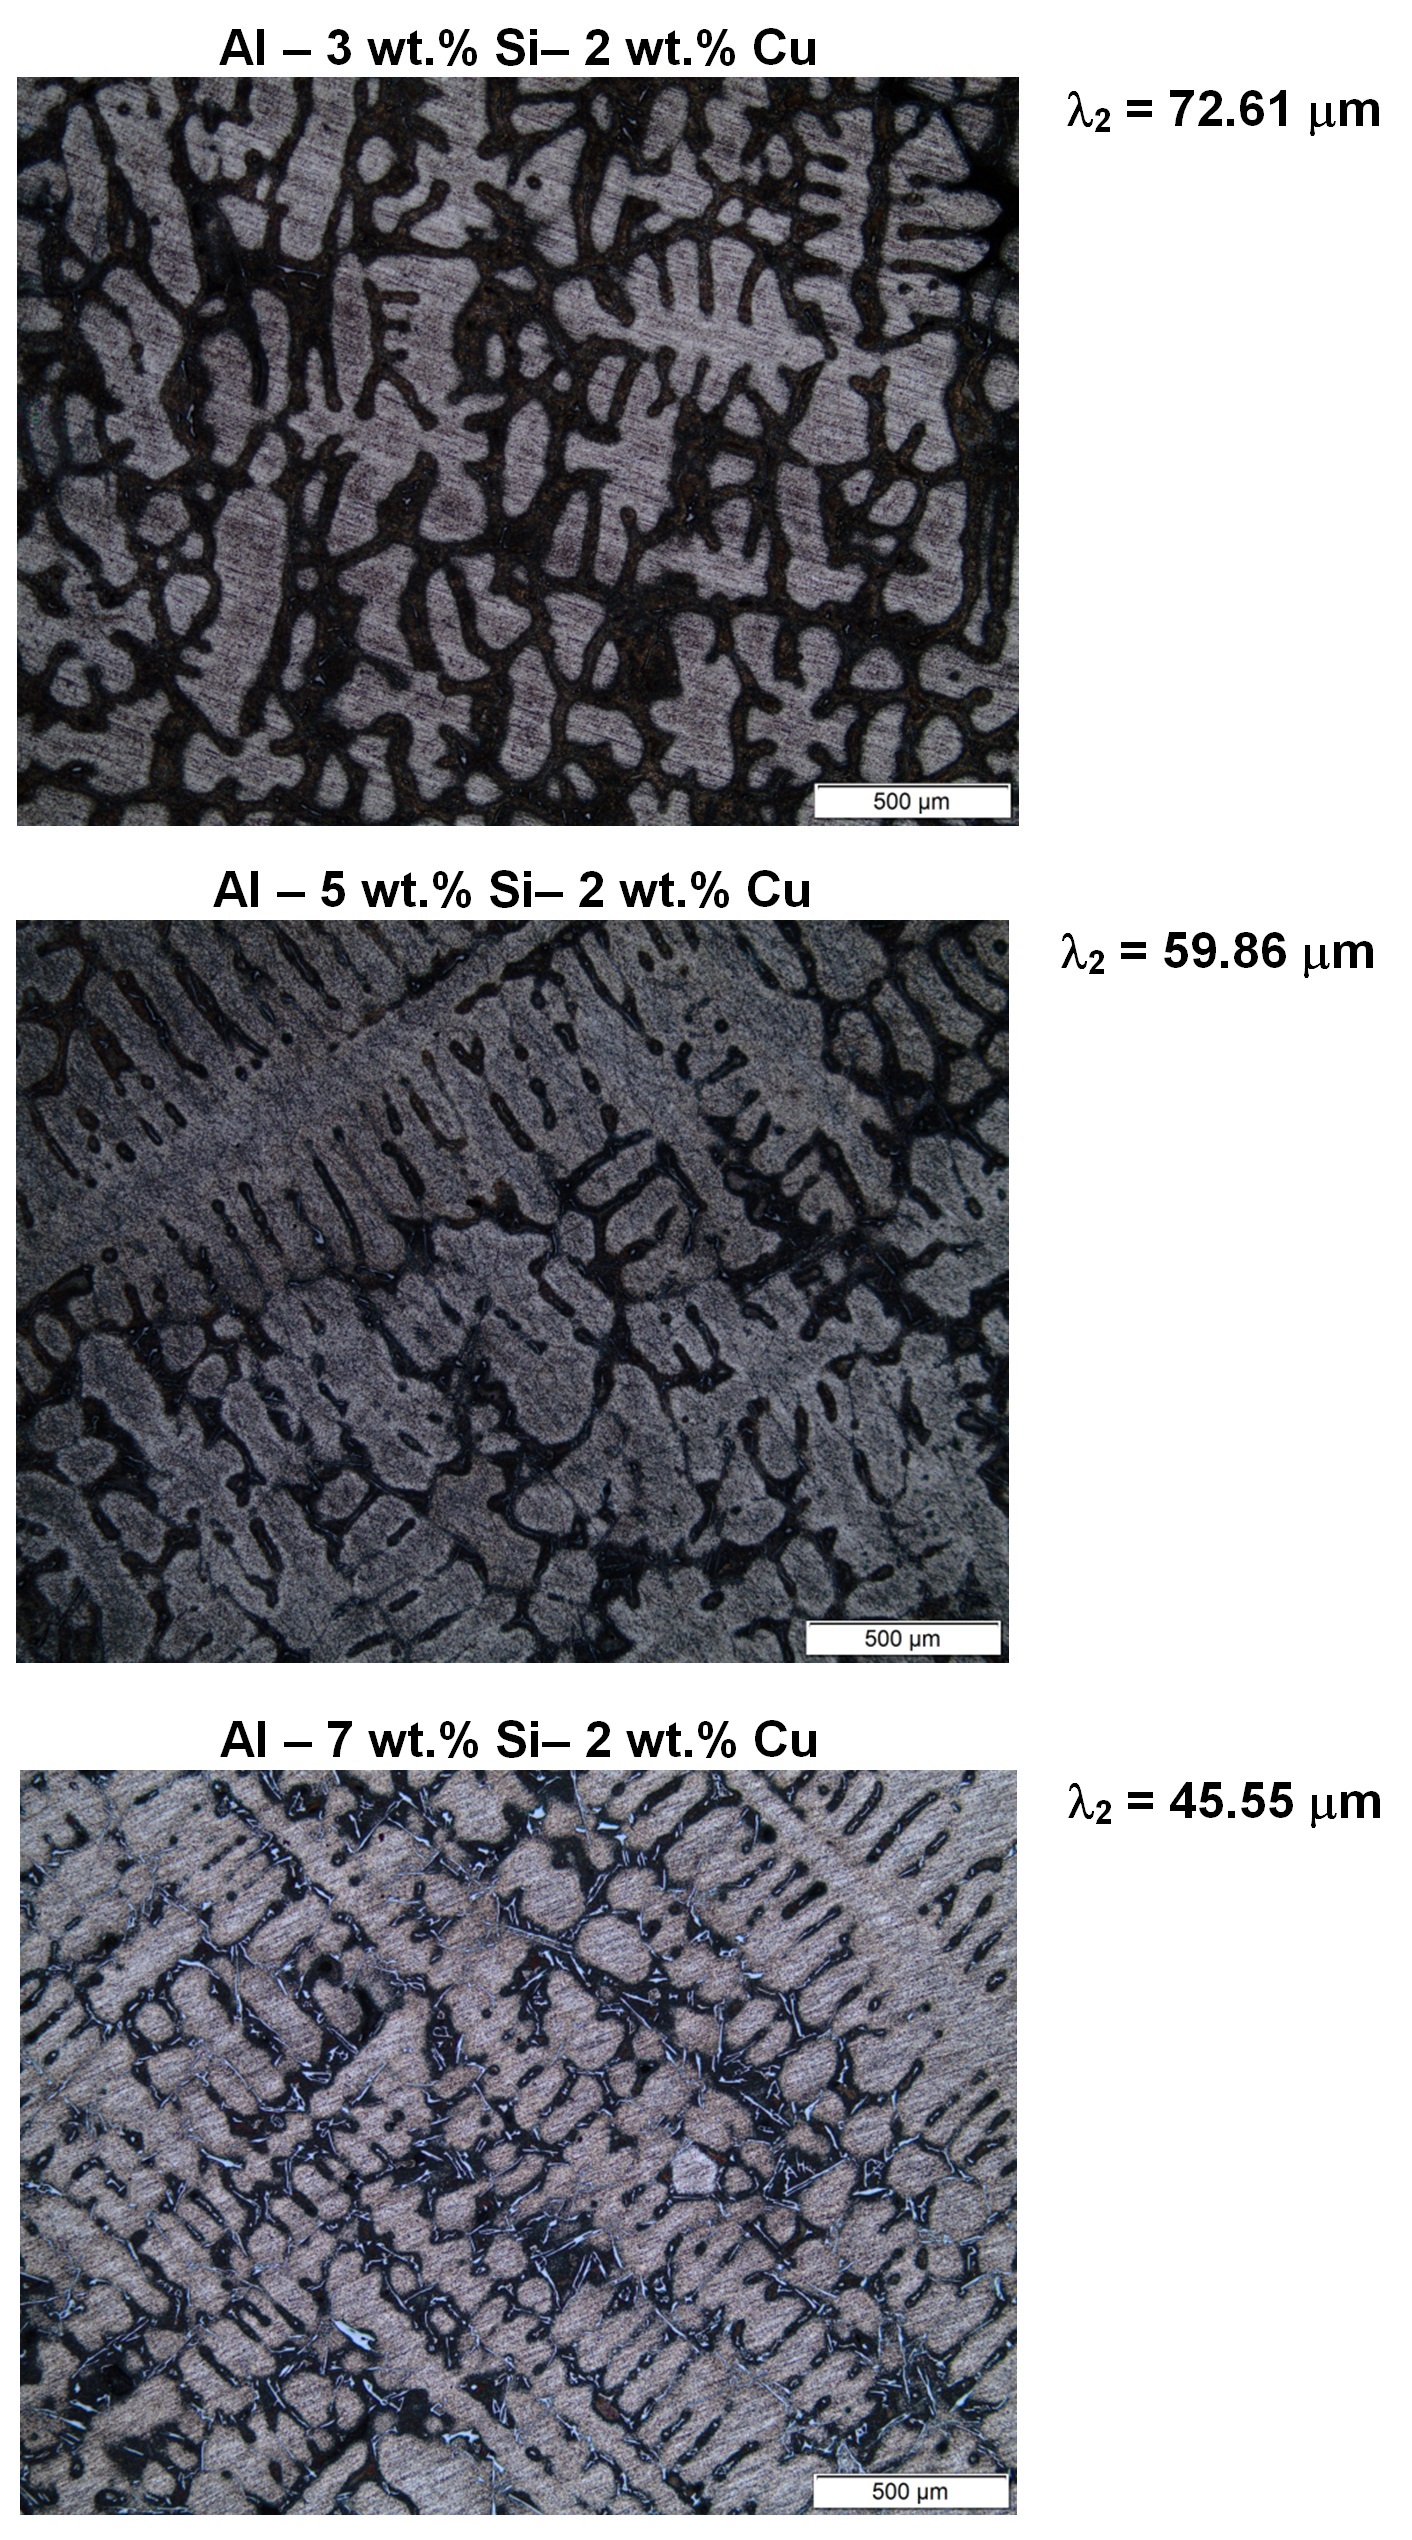
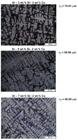
Figure 7 shows the microstructures taken for each as-cast sample of the ternary aluminum alloys. To the right of each photomicrograph, one can see information on the secondary dendritic arm spacing (λ2). Due to the high silicon concentration used during solidification experiments, the microstructure known as dendrite prevailed for all samples. One can see in Figure 7, from large to fine dendrites, the changes found in the size of the as-cast microstructures are due to a wide range of silicon concentration adopted during solidification experiments. The pictures presented in Figure 7 show how dendritic arm spacings and the size dendrites are refined as the silicon solute concentration is increased.
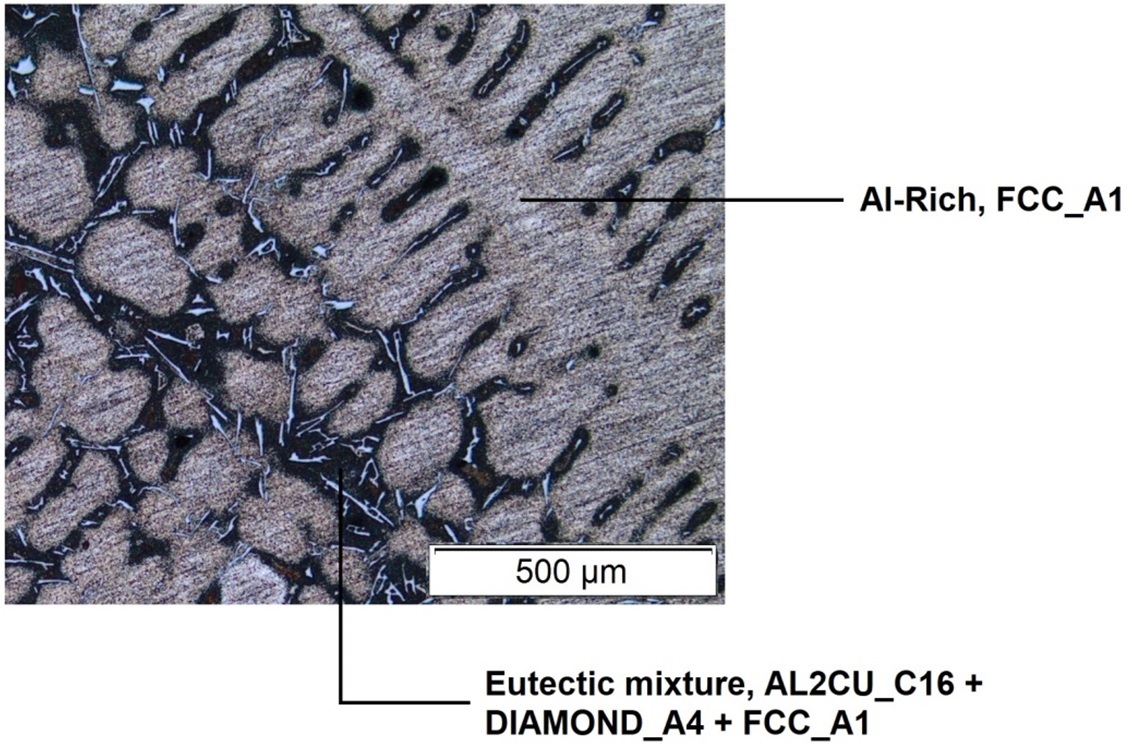
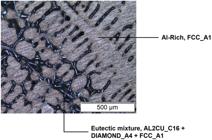
At room temperature, the as-cast microstructure consist of primary dendrites (Al-rich, FCC_A1) surrounded by a finely divided eutectic mixture of three solids (AL2CU_C16 + DIAMOND_A4 + FCC_A1), Figure 8. The dendrite (FCC_A1) is represented by a surface with a whitish appearance, while the eutectic mixture (AL2CU_C16 + DIAMOND_A4 + FCC_A1) is represented by a stained surface with a darkened appearance.
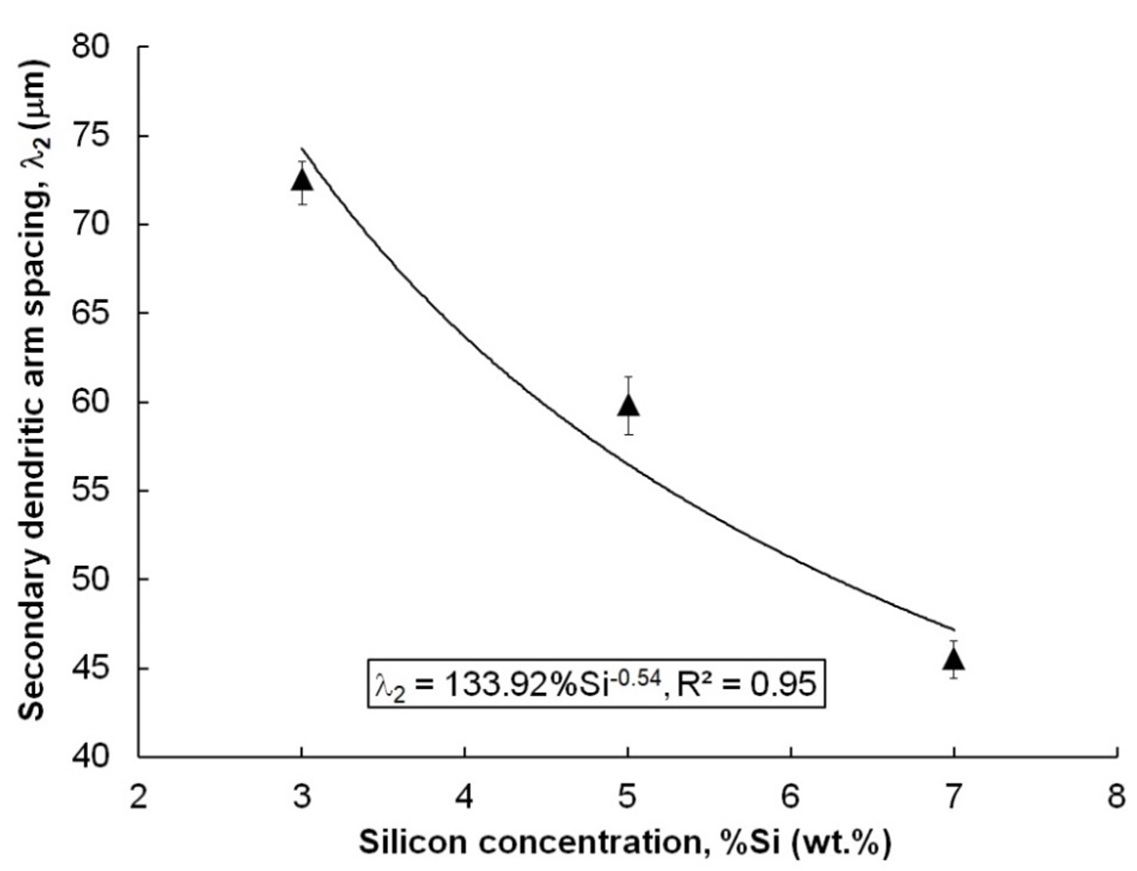
Secondary dendrite arm spacing (λ2) versus silicon concentration (%Si) is shown in Figure 9. It can be observed that the secondary dendritic spacing decreases with the silicon concentration, which is evidenced by experimental equation, λ2 = 133.92%Si-0.54, R2 = 0.95.
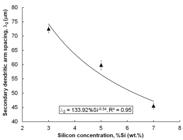
This profile presented in Figure 9 corresponds to an experimental equation obtained from experimental data for ternary aluminum alloys considered in our solidification experiment. The profile is in agreement with the published literature, Meza et al.17 and Dantas et al.18, and shows the silicon concentration effect on the microstructural patterns. This effect translates to the as-cast microstructure growth, i.e., higher silicon concentration in aluminum alloy contribute effectively to yield a refined dendrite. Higher silicon concentration with a short solidification range can induce the finely dispersed intermetallic phases and most refined dendrite, as consequence, the mechanical properties, such as microhardness are correspondingly increased.
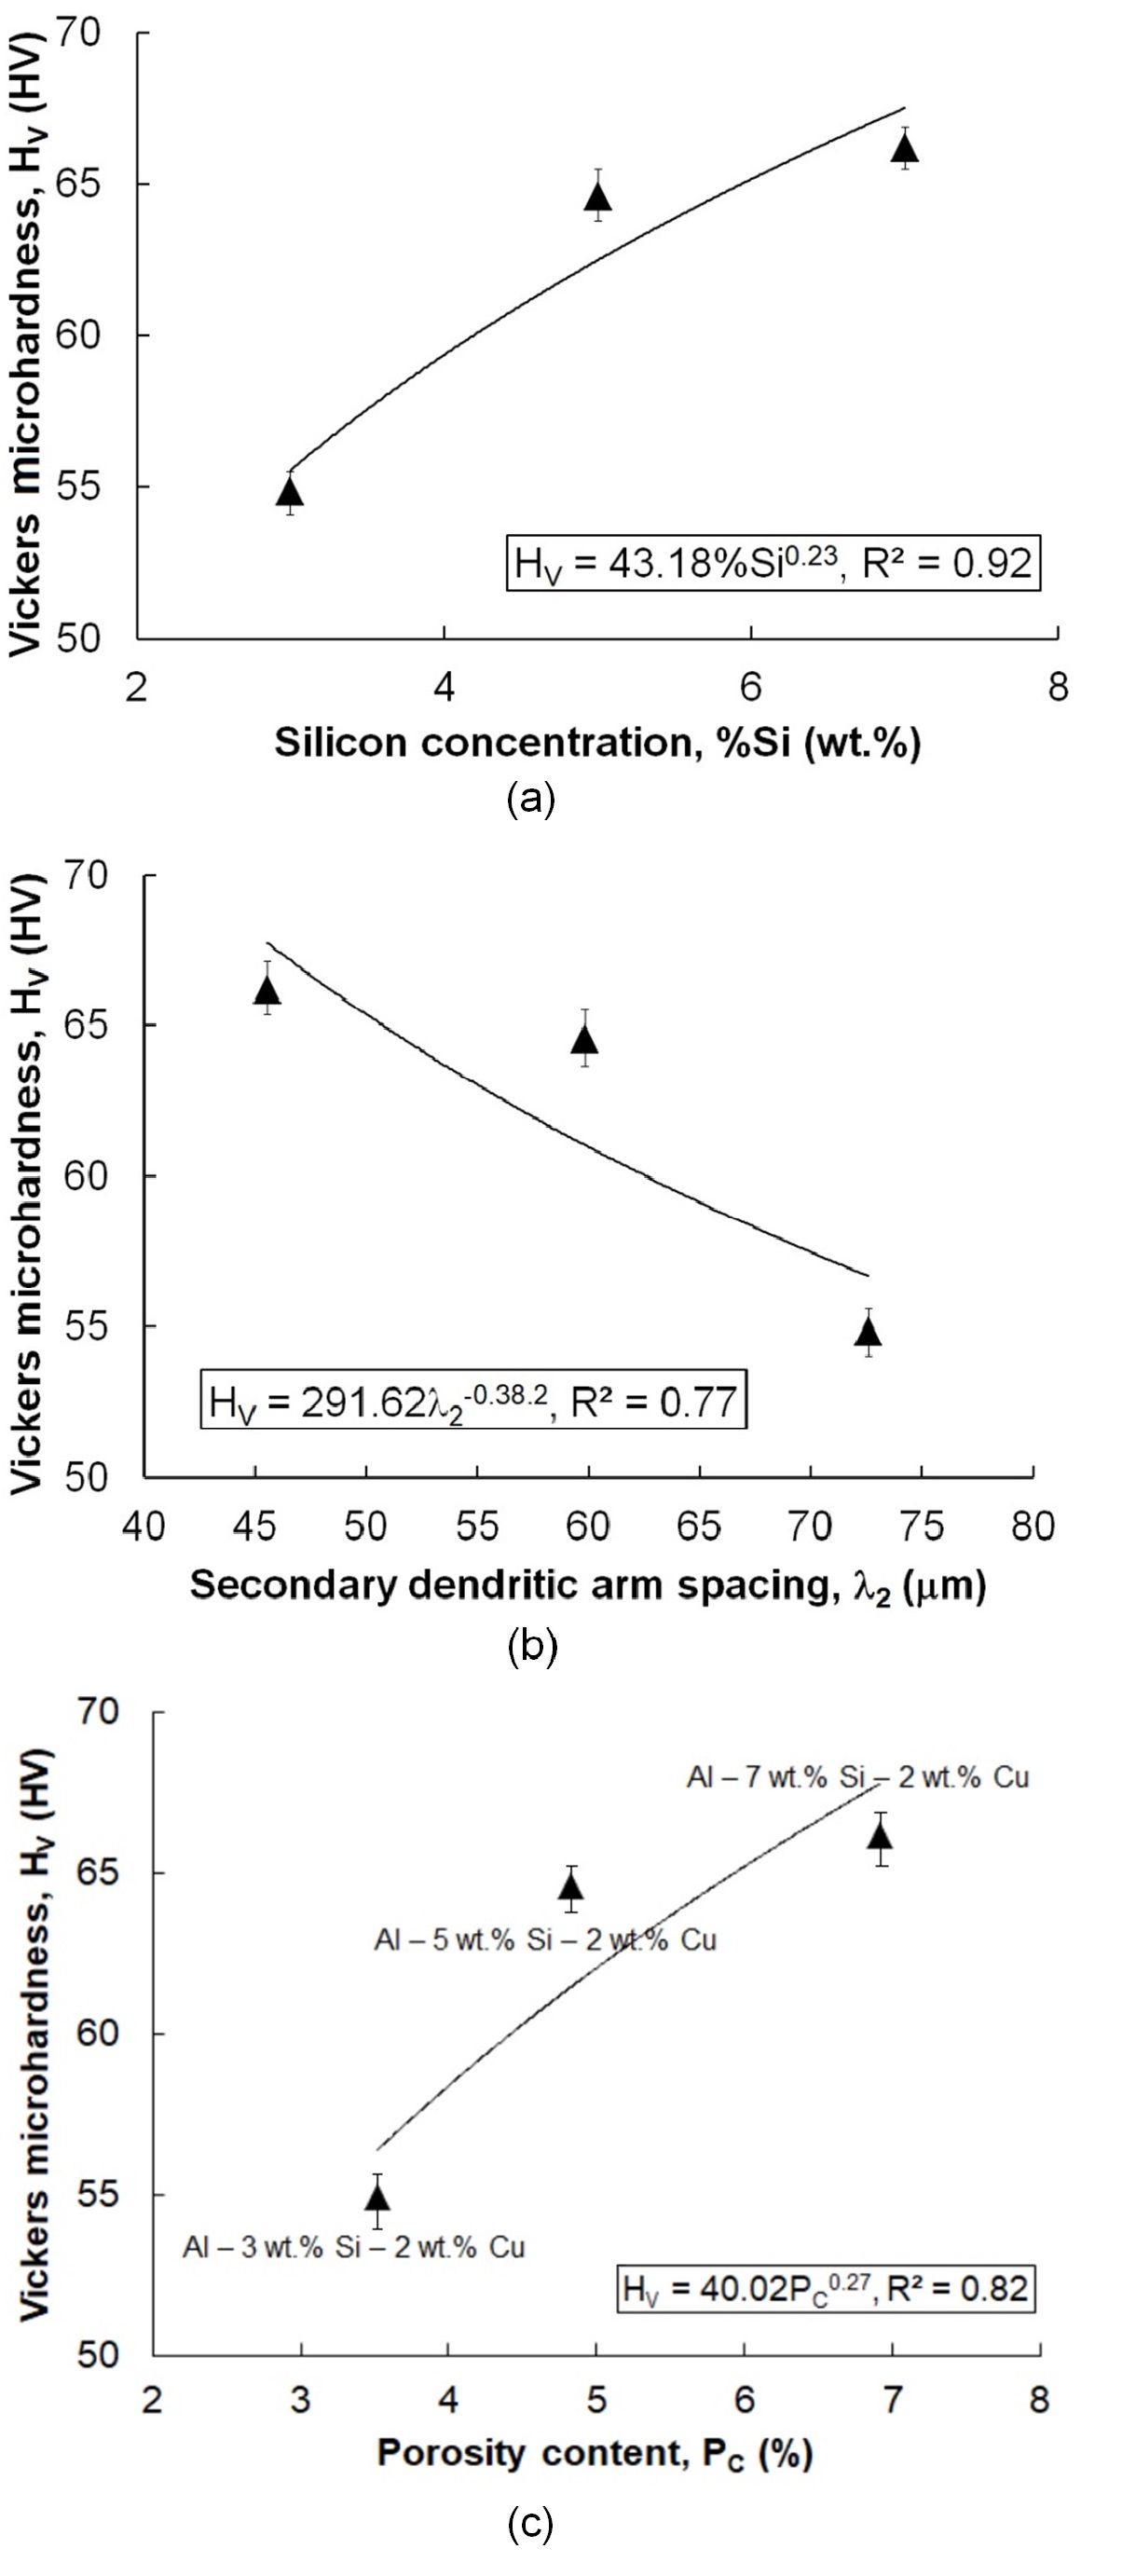
As-cast samples were cut from positions very close to the each thermocouple tip, with the purpose of determining a relationship between silicon concentration (%Si), secondary dendritic arm spacing (λ2), porosity content (PC) and Vickers microhardness (HV), as shown in Figure 10ac.
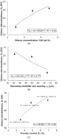
Vickers microhardness (HV) versus: a) Silicon concentration (%Si); b) secondary dendritic arm spacing (λ2); and c) porosity content (PC).
The Hv versus %Si is shown in Figure 10a, where a variation of this mechanical property can be observed. For higher silicon concentration, an improvement in microhardness is found. In contrast, we can see an inverse trend in Figure 10b, where microhardness (HV) starts a gradual decrease with higher secondary dendritic arm spacing (λ2). The %Si and λ2 are key factors acting interactively during the solidification experiments, which servers to condition the changes in the Vickers microhardness, affecting strongly the quality of the final product. We can see an increase in the Vickers microhardness (HV) with increasing in the porosity content (PC), Figure 10c. However, it is well known in the literature that porosity formation has a negative effect on the microhardness (void spaces), where increasing porosity content leads to a decrease in the surface microhardness. Porosity reduces the effective cross-section area that supports mechanical stress, provoking the material to collapse under indentation load9. It is worth highlighting that in the present experimental work, we also considered the silicon addition in binary Al - 2 wt.% Cu alloy, and this solute significantly increases the microhardness, wear resistance, and castability of aluminum alloys. This happens because forming hard, primary silicon particles and eutectic structures within the aluminum matrix18.
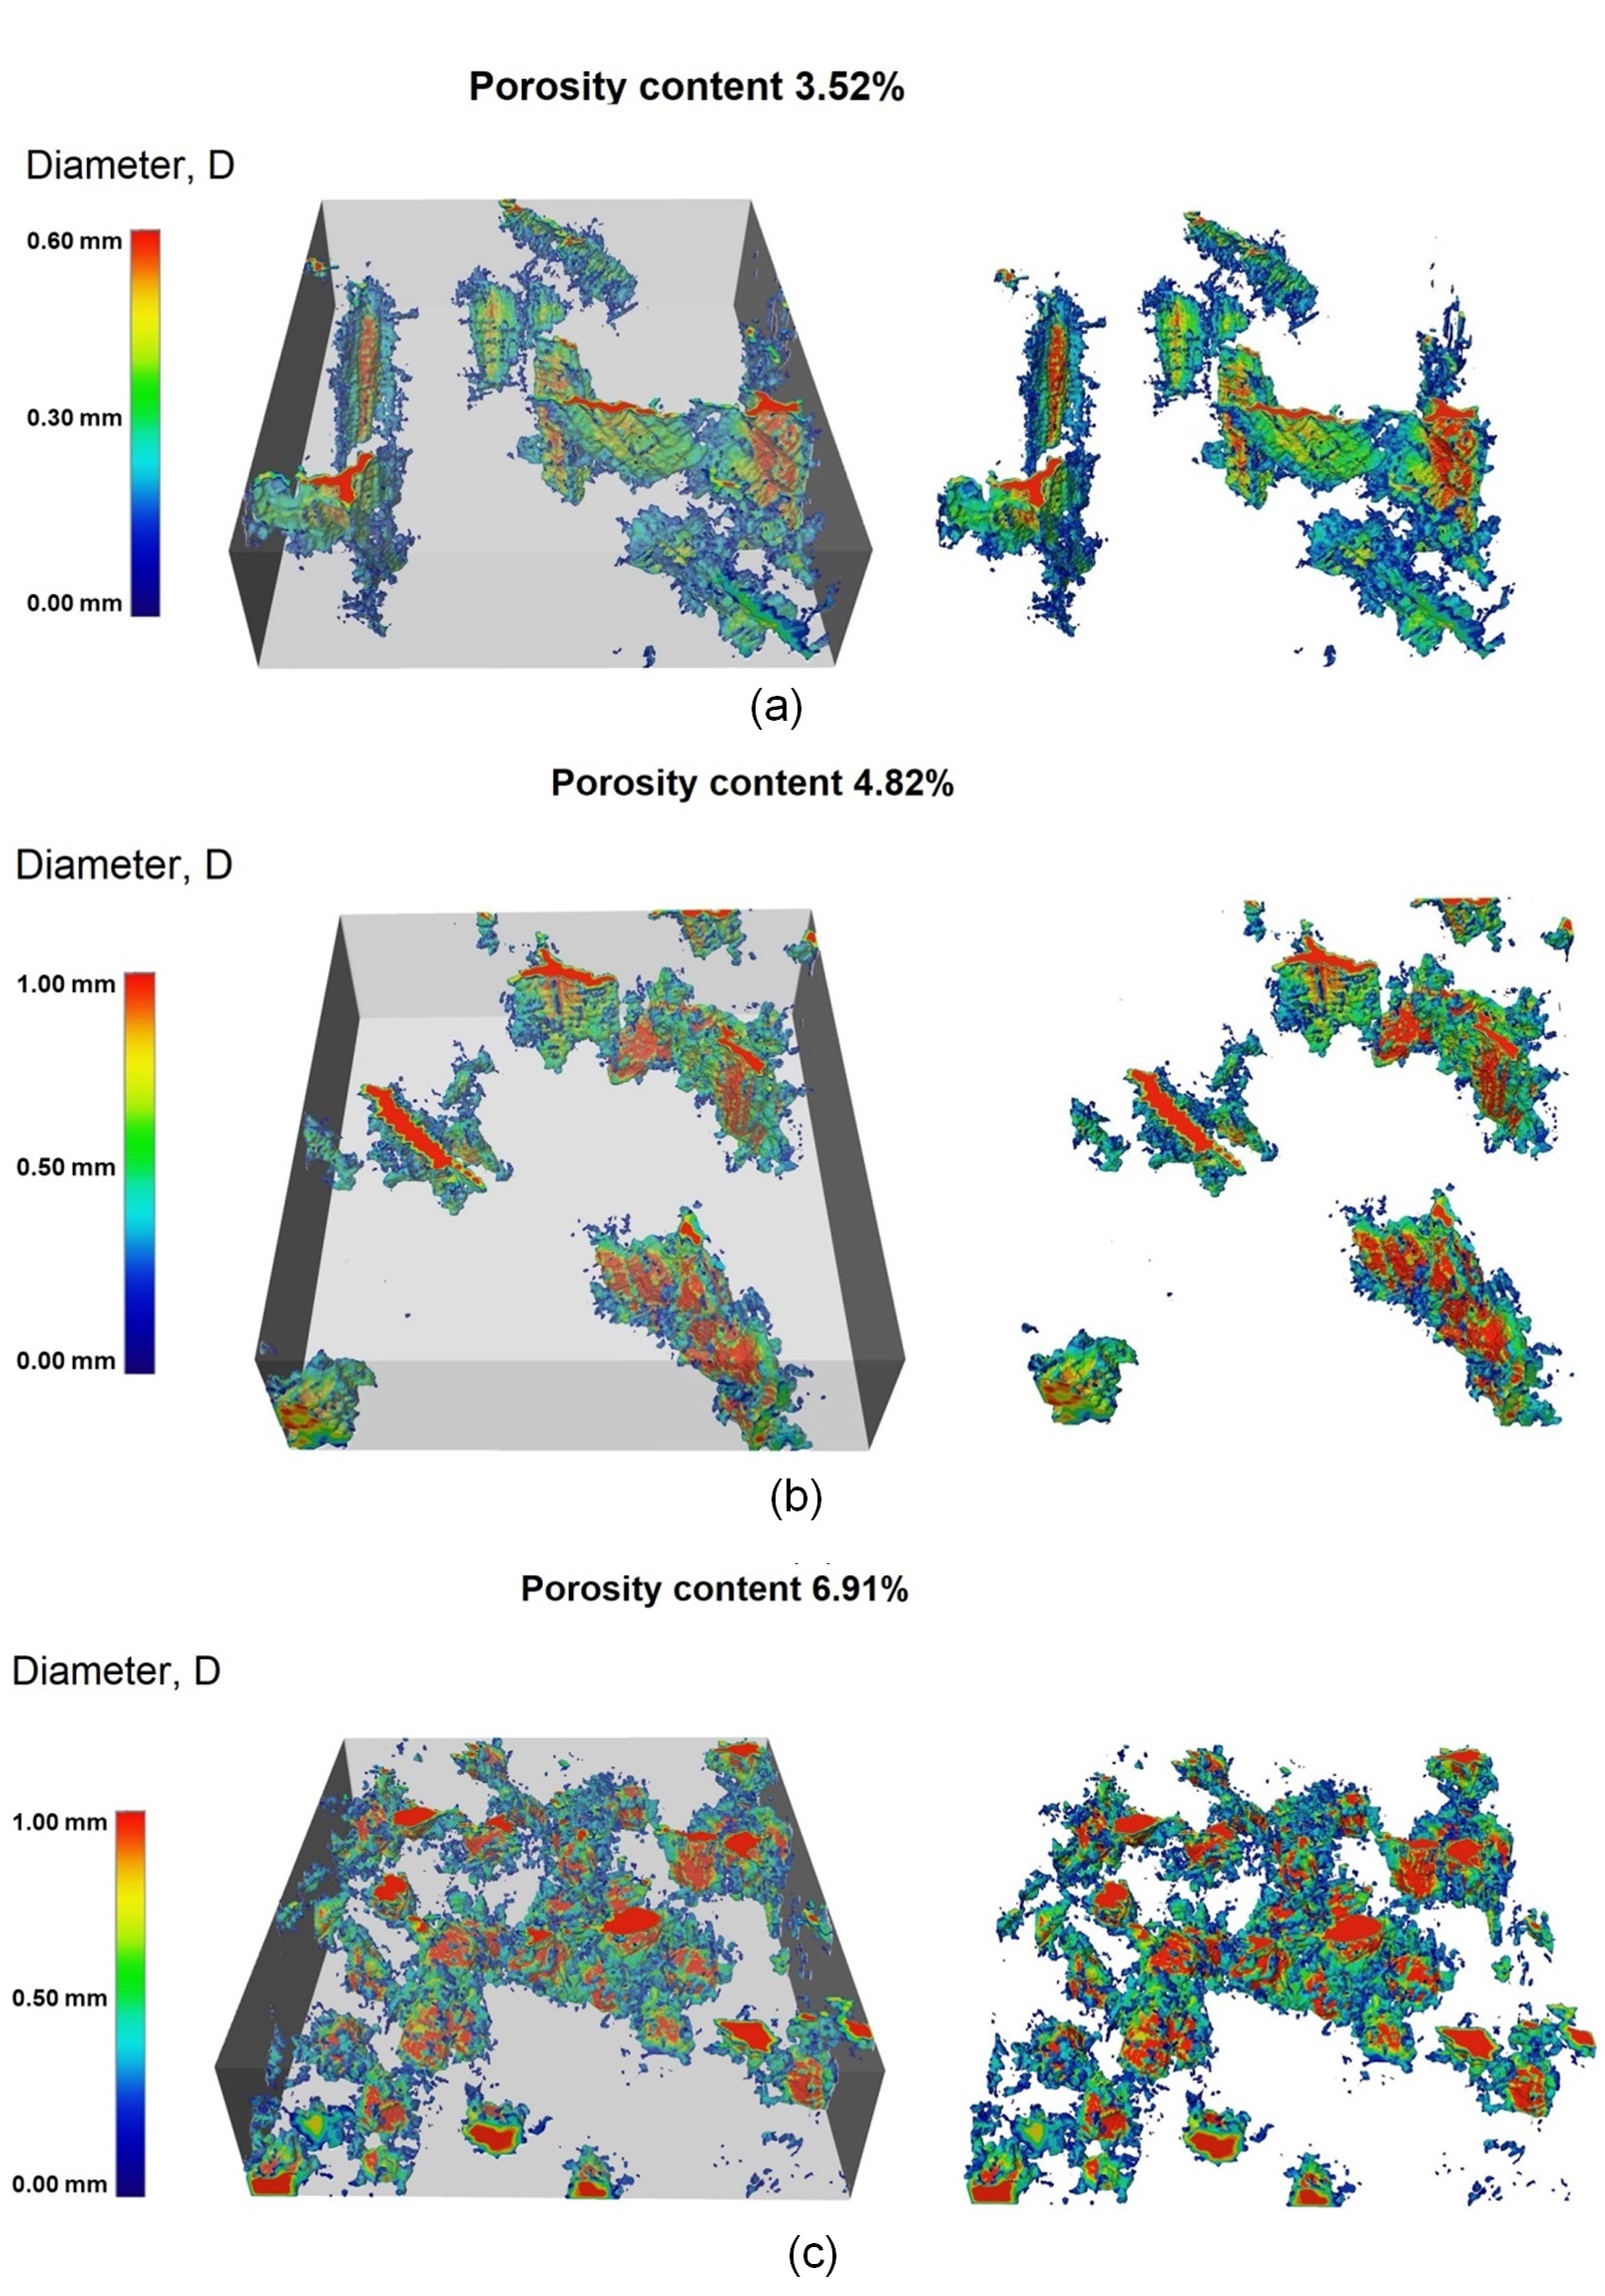
Slow cooling process, also was used to investigate the effects of silicon concentration, secondary dendritic arm spacing on the 3D porosity formation in as-cast samples of the ternary aluminum alloys. Figure 11ac presents the evolution of 3D porosity, obtained using the Phoenix Vtomex m GE microtomograph, for samples taken from the three ternary aluminum alloys considered in present work. By considering the 3D porosity evolution presented in Figure 11ac, we can see an increase in the porosity content values with increasing silicon concentration, these results are consistent with those found by Cao et al.19 and Okayasua et al.20. This porosity dependence with silicon concentration in aluminum alloys can be related to silicon interactions with other factors like hydrogen. While the silicon solute itself is beneficial for aluminum alloys, its interaction with casting variables can be lead to gas porosity formation during the solidification process. Hydrogen is a gas that significantly dissolves in liquid aluminum alloys. Its solubility decreases when the aluminum alloys solidifies. During the solidification, this dissolved hydrogen is rejected into the remaining liquid in the interdendritic regions. When the local hydrogen concentration exceeds the solubility limit, microbubbles nucleate and grow, forming gas porosity. The complex solidification structure of Al-Si alloys with high silicon concentration provides many sites for these microbubbles to form and become trapped. One of the most severe types of defects found in castings is porosity, and aluminum alloys are known for their susceptibility to porosity formation during solidification. These porosities manifest themselves in different ways during casting. They form in the mushy zone, and their morphologies and size are distinct, Bhagavath et al.21. Porosity is among the most common casting defects, occurs when a pocket forms due to air or gas trapped in the metal during solidification, this is known as gas porosity. Porosity is also caused by the metal shrinking, leaving contraction voids in the metal during the casting, and this is called microshrinkage. Morphology of gas porosity, resemble a spherical shape with smaller sizes. On the other hand, morphology of contraction voids (microshrinkage) is always irregular with higher sizes and elongated, Bhagavath et al.21. For ternary Al – 3 wt.% Si – 2 wt.% Cu alloy, it can be observed that the porosity has smaller sizes, with a maximum diameter of 0.60 mm, Figure 11a. However, for higher silicon concentration (5 wt.% and 7 wt.%Si), were found higher sizes pores, with maximum diameter of 1.0 mm.
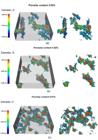
Porosity content (%PC) for three ternary aluminum alloys: a) Al – 3 wt.% Si – 2 wt.% Cu; b) Al – 5 wt.% Si – 2 wt.% Cu; and c) Al – 7 wt.% Si – 2 wt.% Cu.
These experimental data depicted in Figure 11ac, pointed out that the porosity formation in ternary aluminum alloys are mainly due to the higher silicon concentration, which favors porosity formation with higher sizes. High silicon concentrations can lead to larger size pore due to the formation of coarse intermetallic compounds during solidification, which act as nucleation sites and physical barriers that obstruct the flow of liquid metal, Samuel et al.22. On the other hand, silicon addition reduces the liquidus temperature (solidification start) and increasing the solidus temperature (solidification end), resulting in a narrower solidification range (ΔT = TL – TS). A shorter solidification range promotes the formation of larger, more isolated pores, because gas bubbles have less time to move through the pasty zone and coalesce into larger cavities, Pataric et al.23.
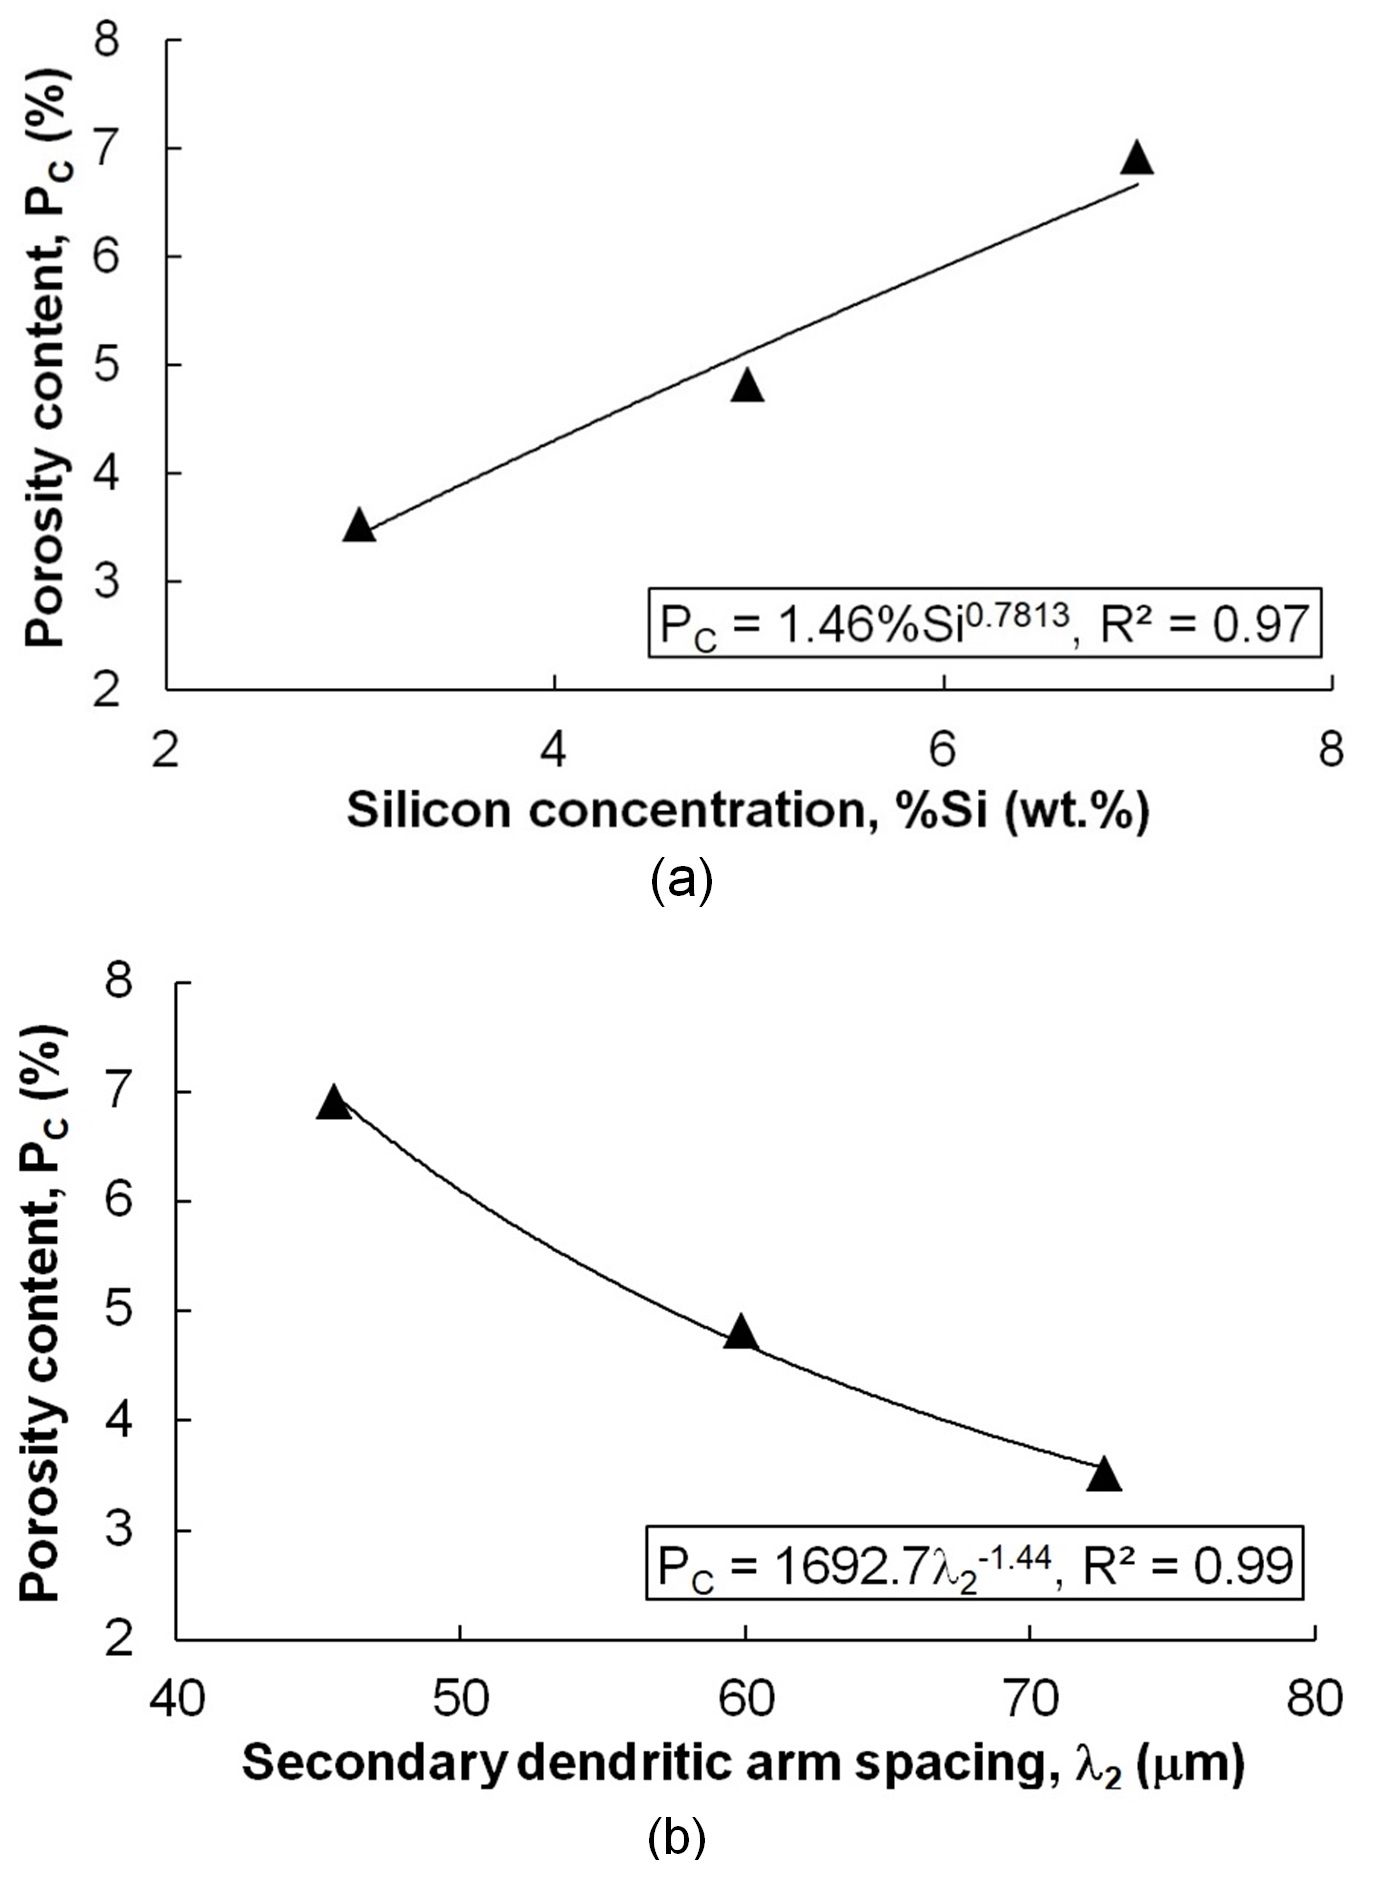
The relationships between secondary dendritic arm spacing (λ2), silicon concentration (%Si) and porosity content (PC) are depicted in Figure 12.
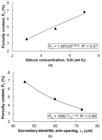
Porosity content versus: a) Silicon concentration (%Si); and b) secondary dendritic arm spacing (λ2).
By considering the experimental results presented in Figure 12ab, we can to conclude that both silicon concentration and dendritic arm spacing are important factors affecting the porosity formation during solidification process of the aluminum alloys. High silicon concentration, especially when near the eutectic composition, leads to the formation of coarse primary silicon particles. These particles create a complex, rigid network early in the solidification experiments, physically blocking the channels through which the remaining liquid metal needs to flow, favoring the pores formation, Nascimento et al.24 and Mahomed et al.25. The key issues with high Si concentration and dendritic arm spacing are often the morphology and distribution of these secondary phases and inclusions, which dictate where and how large pores form during solidification experiments. These experimental equations presented in Figure 12ac, PC = 1.46%Si0.7813 with R2 = 0.97, and PC = 1692.7λ2-1.44 with R2 = 0.99, indicate that porosity formation is closely connected to the silicon concentration (%Si) and secondary dendritic arm spacing (λ2).
4. Conclusions
This experimental work investigated the silicon additions effects on the solidification parameters, dendritic arm spacing, microhardness and 3D porous formation in ternary aluminum alloys obtained under slow cooling process. The conclusions are presented below:
-
The results calculated from Thermo-Calc software and equilibrium Scheil model pointed out that silicon additions (3, 5 and 7 wt.% Si) were responsible for the changes in the both solidification path and thermal parameters, such as liquidus/solidus temperature (TL and TS) and solidification range (ΔT = TL - TS);
-
The Scheil model predicted that the formation of the FCC_Al solid phase starts to grow as a primary solid at 636.0, 624.0 and 610.0 oC with 3.0, 5.0 and 7.0 wt. % Si, respectively. At the 521.7 oC all the solutes-enriched liquid will raise to a 6% eutectic fraction for ternary aluminum alloys considered in present work;
-
Corresponding experimental validation of liquidus temperature and phase formation sequence, it was obtained with slow cooling curve and its second derivative. For liquidus temperature and phase formation sequence obtained by slow cooling methodology, the calculations results show an excellent agreement with those equilibrium Scheil model;
-
A dendritic microstructure prevailed for all ternary aluminum alloys considered in this work, it happens because high silicon concentration adopted during solidification experiments. The microstructure consist of primary dendrites (Al-rich) surrounded by eutectic mixture of three solids (AL2CU_C16 + DIAMOND_A4 + FCC_A1);
-
Experimental equation associating secondary dendritic arm spacing with the silicon concentration was determined, showing that the increase in the concentration have induced a decrease in the dendritic arm spacing, λ2 = 133.92%Si-0.54, R2 = 0.95;
-
Higher silicon concentrations with refined microstructures were key factors acting during the solidification experiments, which served to conditions the changes in the Vickers microhardness. These factors contributed to the increase in the said mechanical property;
-
By considering the 3D images of pores formation, we can see an increase in the porosity content with silicon concentration. This silicon concentration effect on the porosity content can be related to silicon interaction with hydrogen, which leads to gas porosity formation. The solidification structure of aluminum alloys with high silicon concentrations proves sites for microbubbles to form and become trapped, which favors porosity formation during solidification; and
-
This present paper provides an introduction to the application possibilities of the slow cooling process, which is a versatile and useful technique for studying solutes addition effects in aluminum alloys, during solidification process.
5. Acknowledgments
The authors are grateful to National Council for Scientific and Technological Development (CNPq, no 302847/2022-7, PQ - 2022) for financial support.
-
Data Availability
The entire dataset supporting the results of this study was published in the article itself.
6. References
-
1 Farina ME, Bell P, Ferreira CRF, Dedavid BA. Effects of solidification rate in the microstructure of Al-Si5Cu3 aluminum cast alloy. Mater Res. 2017;20(Suppl 2):273-8. https://doi.org/10.1590/1980-5373-mr-2017-0083
» https://doi.org/10.1590/1980-5373-mr-2017-0083 -
2 Li JH, Ludwig TH, Oberdorfer B, Schumacher P. Solidification behavior of Al–Si based alloys with controlled additions of Eu and P. Int J Cast Met Res. 2018;31(6):319-31. https://doi.org/10.1080/13640461.2018.1480891
» https://doi.org/10.1080/13640461.2018.1480891 -
3 Canales A, Talamantes SJ, Gloria D, Valtierra S, Cola R. Thermal analysis during solidification of cast Al-Si alloys. Thermochim Acta. 2010;510(1-2):82-7. https://doi.org/10.1016/j.tca.2010.06.026
» https://doi.org/10.1016/j.tca.2010.06.026 -
4 Farahany S, Ourdjini A. Effect of cooling rate and silicon refiner/modifier on solidification pathways of Al-11.3Si-2Cu-0.4Fe alloy. Mater Manuf Process. 2013;28:657-663. https://doi.org/10.1080/10426914.2013.763972
» https://doi.org/10.1080/10426914.2013.763972 -
5 Farahany S, Ourdjini A, Idris MH, Shabestari SG. Computer-aided cooling curve thermal analysis of near eutectic Al–Si–Cu–Fe alloy. J Therm Anal Calorim. 2013;114(2):705-17. https://doi.org/10.1007/s10973-013-3005-7
» https://doi.org/10.1007/s10973-013-3005-7 -
6 Cruz CB, Kakitani R, Xavier MGC, Silva BL, Garcia A, Cheung N, et al. Transient unidirectional solidification, microstructure and intermetallics in Sn-Ni alloys. Mater Res. 2018;21(Suppl 1):1-11. https://doi.org/10.1590/1980-5373-mr-2017-1099
» https://doi.org/10.1590/1980-5373-mr-2017-1099 -
7 Silva CCS, Santos VT, Lobo FG, Silva MR, Santos GA, Vasconcellos SP, et al. Phase stability and unidirectional solidification in a Ni-Al bronze. J Mater Res Technol. 2023;25:2240-50. https://doi.org/10.1016/j.jmrt.2023.06.030
» https://doi.org/10.1016/j.jmrt.2023.06.030 -
8 Tamura T, Li M, Takahashi K, Inoue E. Improved solidification structures and mechanical properties of Al–20 wt% Sn alloys processed by an electromagnetic vibration technique. Mater Sci Eng A. 2023;862:144416. https://doi.org/10.1016/j.msea.2022.144416
» https://doi.org/10.1016/j.msea.2022.144416 -
9 Ferreira AF, Peixoto FM, Torres AG, Almeida CM, Nascimento MC, Ferreira LO. Cooling curve evaluation in base Al–Si alloys: effects of silicon additions on the thermal parameters, microstructural patterns, and microhardness. Metallogr Microstruct Anal. 2025;14(1):245-55. https://doi.org/10.1007/s13632-025-01179-1
» https://doi.org/10.1007/s13632-025-01179-1 -
10 Ibañez ER, Alonso PR, Ares AE. Effects of cooling rate and silicon content on microstructure and mechanical properties of directional solidification of eutectic Al-Si alloys. J Mater Eng Perform. 2026;35(8):7370-401. https://doi.org/10.1007/s11665-025-12157-7
» https://doi.org/10.1007/s11665-025-12157-7 -
11 Ferreira IL, Lins JFC, Moutinho DJ, Gomes LG, Garcia A. Numerical and experimental investigation of microporosity formation in a ternary Al–Cu–Si alloy. J Alloys Compd. 2010;503(1):31-9. https://doi.org/10.1016/j.jallcom.2010.04.244
» https://doi.org/10.1016/j.jallcom.2010.04.244 - 12 Thermo-Calc Software AB. Thermo-Calc software. Solna, Sweden: Thermo-Calc Software; 2026.
-
13 Ahmad R, Asmael MBA. Influence of cerium on microstructure and solidification of eutectic Al-Si piston alloy. Mater Manuf Process. 2016;31(15):1948-57. https://doi.org/10.1080/10426914.2015.1127942
» https://doi.org/10.1080/10426914.2015.1127942 -
14 Ahmad R, Asmael MBA. Influence of lanthanum on solidification, microstructure, and mechanical properties of eutectic Al-Si piston alloy. J Mater Eng Perform. 2016;25(7):2799-813. https://doi.org/10.1007/s11665-016-2139-8
» https://doi.org/10.1007/s11665-016-2139-8 -
15 Ahmad R, Sheggaf ZM, Asmael MBA. Effect of praseodymium and erbium additions on solidification characteristics, microstructure and mechanical properties of as–cast ZRE1 magnesium alloy. Materialwiss Werkstofftech. 2017;48(3-4):218-25. https://doi.org/10.1002/mawe.201600766
» https://doi.org/10.1002/mawe.201600766 -
16 Ferreira AF, Moura LJ, Dantas BS, Brum FJB, Garção WJL, Sales RC. Investigations on metallurgical parameters in hypoeutectic Al–Si alloys under upward directional solidifications. Int J Adv Manuf Technol. 2022;121(11-12):7359-82. https://doi.org/10.1007/s00170-022-09836-3
» https://doi.org/10.1007/s00170-022-09836-3 -
17 Meza ES, Bertelli F, Goulart PR, Cheung N, Garcia A. The Effect of the growth rate on microsegregation: experimental investigation in hypoeutectic Al–Fe and Al–Cu alloys directionally solidified. J Alloys Compd. 2013;561:193-200. https://doi.org/10.1016/j.jallcom.2013.01.180
» https://doi.org/10.1016/j.jallcom.2013.01.180 -
18 Dantas BS, Garção WJL, Peixoto FM, Guimarães NA, Tomaszewski IMS, Ferreira AF. Microstructural patterns, microsegregation, porosity, and mechanical properties of hypoeutectic Al-Fe alloy, and its dependency with solidification thermal parameters. Mater Res. 2022;25:e20220187. https://doi.org/10.1590/1980-5373-mr-2022-0187
» https://doi.org/10.1590/1980-5373-mr-2022-0187 -
19 Cao F, Li H, Ning Z, Jia Y, Gu X, Yu L, et al. The formation mechanism of porosity for spray-deposited 7075 alloy. Mater Res. 2015;18(Suppl 1):89-94. https://doi.org/10.1590/1516-1439.328414
» https://doi.org/10.1590/1516-1439.328414 -
20 Okayasu M, Ohkura Y, Takeuchi S, Takasu S, Ohfuji H, Shiraishi T. A study of the mechanical properties of an Al–Si–Cu alloy (ADC12) produced by various casting processes. Mater Sci Eng A. 2012;543:185-92. https://doi.org/10.1016/j.msea.2012.02.073
» https://doi.org/10.1016/j.msea.2012.02.073 -
21 Bhagavath S, Cai B, Atwood R, Li M, Ghaffari B, Lee PD, et al. Combined deformation and solidification-driven porosity formation in aluminum alloys. Metall Mater Trans, A Phys Metall Mater Sci. 2019;50(10):4891-9. https://doi.org/10.1007/s11661-019-05378-8
» https://doi.org/10.1007/s11661-019-05378-8 -
22 Samuel AM, Samuel E, Songmene V, Samuel FH. A review on porosity formation in aluminum-based alloys. Materials. 2023;16(5):1-26. https://doi.org/10.3390/ma16052047
» https://doi.org/10.3390/ma16052047 -
23 Pataric A, Djurdjevic M, Manasijevic S, Stopic S, Mihailovic M. The role of silicon during solidification process of cast Al-Si-Mg alloys. Materials. 2025;18(21):1-12. https://doi.org/10.3390/ma18215033
» https://doi.org/10.3390/ma18215033 -
24 Nascimento MC, Garção WJL, Felipe P Jr, Sales RC, Silva AD, Ferreira AF. Investigation of phase formation, as-cast microstructure, microhardness and 3D porosity in quaternary Al – 5 wt.% Si – 4 wt.% Cu – 1 wt.% Ni alloy obtained under transient heat-flow conditions. Mater Res. 2025;28:e20250296. https://doi.org/10.1590/1980-5373-mr-2025-0296
» https://doi.org/10.1590/1980-5373-mr-2025-0296 -
25 Mahomed N, Kleynhans HA. Reducing shrinkage porosity in high-performance steel castings: case of an ASME B16.34 gate valve body: Part 2 - simulation and experimental verification. Int J Met Cast. 2019;13(2):463-72. https://doi.org/10.1007/s40962-018-0275-7
» https://doi.org/10.1007/s40962-018-0275-7
Edited by
-
Associate Editor:
Hugo Sandim.
-
Editor-in-Chief:
Luiz Antonio Pessan.
The entire dataset supporting the results of this study was published in the article itself.