Evaluation of Aqueous Extracts of Agro-Industrial Waste as Corrosion Inhibitors in a Neutral Saline Medium
Abstract
This work investigated the corrosion inhibition of carbon steel in 0.1 mol L-1 Na2SO4 by lyophilized extracts of garlic white peel (GP) and centrifugation residue of Isabel grape juice (CGJ) using gravimetric tests, polarization curves, electrochemical impedance spectroscopy, and scanning electron microscopy. Initially, the DPPH (2,2-diphenyl-picrylhydrazyl) method analyzed the extracts for antioxidant activity. Considering the capacity to scavenge the DPPH free radical (% DPPH consumed), the GP and GJC lyophilized extracts presented values of 12.64 and 8.47, respectively. The inhibition efficiency exceeded 96% and 88% after 24 h of immersion in the saline medium containing 300 mg L-1 of the GP and CGJ, respectively. These results indicate that producing such extracts is an excellent alternative for using these agro-industrial wastes, as they showed promising results as corrosion inhibitors for carbon steel in the corrosive environment studied.
Keywords:
Corrosion inhibitors; Natural inhibitors; Saline environment; Agro-industrial waste
1. Introduction
Carbon steel is an important material in the pipeline and equipment industries, as it can be flexed or bent without losing its structural integrity. Despite its low cost, exposure to aggressive environments also occurs extensively, leading to material deterioration. Several alternatives have been studied for optimal corrosion control, including the application of corrosion inhibitors. When added to the corrosive medium in adequate concentration, these organic or inorganic compounds can reduce or prevent corrosion-related reactions. Inhibitors have been applied in acidic and neutral environments to protect metals such as carbon steel, nickel, and zinc.
Synthetic corrosion inhibitors, mostly organic compounds containing sulfur and/or nitrogen atoms, have been widely commercialized for years despite several being highly toxic to the environment. The search for environmentally friendly inhibitors has become increasingly necessary to reduce or avoid the impact of toxic inhibitors on the environment. In this context, natural inhibitor sources such as peels, seeds, leaves, fruits, and agro-industrial waste have increasingly gained prominence because they originate from renewable resources.
In Brazil, the processing of agricultural products to extract juices, oils, and sauces for human consumption generates many by-products from industrial treatment. Agro-industrial waste is often used as cattle feed or discarded without generating satisfactory added value for producers. However, many of these residues contain large amounts of polyphenolic and/or S-containing compounds, rich in antioxidant properties, which can be used as corrosion inhibitors1,2. Although the methodologies for extracting these compounds and lyophilizing the extracts are already well known, in some cases, the continuity and quality of the studies aiming to obtain a commercial product depend on an agreement between researchers and the companies supplying the residue3-6.
The garlic white peel is an agro-industrial waste that has already been used as a corrosion inhibitor for carbon steel in acid environments, as well as additives for silane coatings and electrodeposited zinc coatings7-9. Gas chromatography/mass spectrometry analyses of garlic white peel lyophilized extracts have shown that allyl methyl disulfide, diallyl disulfide, methyl allyl trisulfide, diallyl trisulfide, and 2-thio phenecarboxaldehyde were the principal compounds identified in the garlic peel extract, which were related to the inhibitory capacity of this extract2. However, there is no work dealing with using the extracts of this residue to inhibit carbon steel corrosion in saline media. The grape juice centrifugation residue is generated after the centrifugation of the pasteurized grape juice. Although this agro-industrial waste presents very high amounts of antioxidant-rich substances, it is not used for cattle feed due to its high sugar content10. Nonetheless, this raw material may be used as a corrosion inhibitor for carbon steel in different corrosive media.
Due to the enormous application of steel in construction and refining industries, corrosion problems arise because of the contact of the metallic substrate with aggressive humid environments containing sulfate salts, occurring from the contact of the burning of fossil fuels or refining resulting in gases with water (vapor or liquid) on the substrate surface11. Nonetheless, to the best of our knowledge, few works use natural or agro-industrial waste extracts as corrosion inhibitors for carbon steel in these environments. Based on the lack of information concerning this topic, this study investigated the inhibitory action of lyophilized garlic white peel (GP) and centrifugation residue of Isabel grape juice (CGJ) aqueous extracts on the corrosion of carbon steel in a 0.1 mol L-1 Na2SO4 solution, using gravimetric tests (GT), potentiodynamic polarization curves (PP), electrochemical impedance spectroscopy (EIS), and linear polarization resistance (LPR) measurements. We aimed to contribute more directly to the knowledge of using natural inhibitors in a saline medium.
2. Experimental Procedures
2.1. Preparation of the extracts and corrosive media
The white garlic peels (Allium sativum L.) were collected in Rio de Janeiro markets, while the centrifuged residue obtained from the Isabel grape juice (Vitis labrusca) was kindly donated by Poggere Winery (São Marcos, RS, Brazil). The GP and CGJ extracts were obtained by infusion in water. Approximately 5g of each residue was added to 100 mL of deionized water at 100 oC (initial temperature) for 40 min. After this period, the extracts were filtered, lyophilized, and maintained at 4 oC2.
Different concentrations of these lyophilized extracts were added to a 0.10 mol L-1 Na2SO4 solution to produce the corrosive media used in this work. The pH of the solution without the extracts (blank) was around 6.66. This value did not change significantly when the GP extract was added to this corrosive medium (pH ≈ 6.80). However, when the CGJ extract was added to the medium, the pH tended to decrease, reaching acidic values when higher concentrations were used (around 4.35). The experiments were performed using this natural pH to reproduce the real effects of the extract in the corrosive environment.
2.2. Antioxidant activity of the extracts
The antioxidant activity of the extracts was evaluated using the 2,2-diphenyl-picrylhydrazyl (DPPH) radical scavenging activity method12 and the ferric reducing ability of plasma (FRAP) method13. A 96º PA ethanol solution containing 0.06 mmol L-1 DPPH was prepared for the DPPH method. The working solution was obtained by diluting the DPPH solution with ethanol to obtain an absorbance of around 0.980 ±0.02 at 517 nm using a model M 501 Single Beam UV/VIS spectrophotometer. An aliquot of 2.9 mL of this solution was mixed with 0.1 mL of the extracts. The solution was shaken in tubes and incubated in the dark for 30 minutes at room temperature. The absorbance was measured at 517 nm after 30 minutes (A30) and compared with the control (Acontrol). The inhibition of DPPH free radicals (I%) was calculated according to Equation (1).
In the reducing capacity using the FRAP assay13, 200 μL of the extract and 200 μL of FeCl3 (3 mmol L−1 in 5 mol L−1 citric acid) were mixed in a tube and incubated for 30 min in a water bath at 37 °C. 3, 6 mL of a 2,4,6-tris (2-pyridyl)-triazine (TPTZ) solution was then added and the mixture was vortexed. After exactly 10 min, the absorbance at 620 nm was measured using a model M 501 Single Beam UV/VIS spectrophotometer. The standard curve was constructed similarly, using a 6-hydroxy-2,5,7,8-tetramethylchroman-2-carboxylic acid (TROLOX) solution in the 10–500 μmol L-1 concentration range14.
2.3. Chemical characterization of the extracts
2.3.1. Fourier transform infrared spectroscopy (FTIR)
The FTIR analyses of the lyophilized extracts were performed using a Perkin Elmer FTIR spectrophotometer, operating in the transmission mode in the range of 4000-400 cm-1 using the attenuated total reflectance (ATR) technique.
2.3.2. High-performance liquid chromatography (HPLC)
The identification and quantification of phenolic compounds were performed on high-performance liquid chromatography (HPLC) equipment (Agilent Technologies, Germany). The separation was performed on a Pursuit 5 C18 column (250 x 4.6 mm i.d., particle size 5 µm). The HPLC analysis was carried out using a mobile phase gradient consisting of (A) 95% methanol in water and (B) 0.1% formic acid in water. The flow rate was 1.0 mL min-1 with an injection volume of 20 µL and a column temperature of 25ºC.14
2.3.3. Determination of protein content by Biuret reaction
Protein content was quantified using a Cary 60 UV/ViS spectrophotometer (Agilent Technologies, Germany). Aliquots of 0, 0.5, 1.0, 1.5, 2.0, and 2.5 µl of the protein standard (albumin 3 mg/mL) were pipetted into a tube, and the volume was made up to 4.0 mL with milli-Q water. 5.0 mL of the Biuret reagent (0.24 g CuSO4 + 1.5 g of C4H4O6KNa·4H2O - sodium and potassium double tartrate) was added to the aliquots, shaken, and left to stand for 30 minutes. The absorbance was measured at a wavelength of 540 nm, and the purple coloration indicated the presence of proteins. The same procedures were performed using 0.5 mL of the GP and CGJ extracts. All the results obtained were expressed as mg albumin/100 mL extract15.
2.3.4. Inorganic composition
Multielementary determination was performed using an inductively coupled plasma optical emission spectrometry (ICP OES) model iCAP Series 6000 (Thermo Scientific). The sample was prepared by adding 50 mL of each extract directly into a polytetrafluoroethylene vial, adding 2 mL of suprapure HNO3 (HNO3 (65% v/v, Quimis, Brazil)), purified by distillation below its boiling point in a Teflon® system, model BSB-939-IR (Berghof, Germany) and 1 mL of H2O2 35% w/w. The vials were closed and placed in a microwave oven (DGT 100 Plus, Provecto Analitica), and the heating program was applied as follows: 200°C for 10 min, hold at 200°C for 15 min, 200°C and 70º for 22 min (cooling). The resulting solutions were diluted to 10.00 mL before analysis. Determinations were performed by monitoring the emission wavelengths: 455.5 nm (Ba), 228.8 nm (Cd), 324.7 nm (Cu), 238.2 nm (Fe), 279.5 nm (Mg), 257.6 nm (Mn), 407.7 nm (Sr), and 213.8 nm (Zn), based on earlier works of the group16.
2.4. Electrochemical procedures
2.4.1. Electrochemical quartz microbalance (EQCM)
The variation with time of the open circuit potential (OCP) was performed using an Autolab PGSTAT 302N potentiostat/galvanostat coupled with an electrochemical quartz microbalance (EQCM) Maxtek. As this system allows the signals generated by the potentiostat/galvanostat and those of mass variation obtained by the microbalance to be collected during the experiments, it may be used to evaluate the inhibiting process of iron corrosion in a neutral medium. The three-electrode cell used in this experiment consisted of a quartz crystal electrode coated with a gold layer on a chrome support, with a resonance frequency in air of 9 MHz and an exposed area equal to 1.43 cm2. A platinum spiral was used as a counter electrode, and the saturated mercurous sulfate electrode (ESS) was the reference electrode, completing the cell.
To obtain the OCP curves, the surface of the gold electrode was initially coated with iron to simulate the steel surface. Iron deposition was performed using a solution containing 0.90 mol L-1 of FeSO4 and 0.17 mol L-1 of Al2(SO4)3, applying the potential of -1.5 V for 60 min17.
2.4.2. Anti-corrosive performance of the inhibitor extracts
All electrochemical measurements to evaluate the anti-corrosive performance of the inhibitor extracts were carried out in a conventional three-electrode cell, in which an AISI 1020 carbon steel sample was the working electrode, a saturated sulfate electrode was the reference electrode, and a platinum spiral was the counter electrode. The working electrodes were embedded in epoxy resin to permit a surface area of approximately 1 cm2 to be exposed to the electrolyte. Before each measurement, the sample surfaces were sanded with 100, 200, 300, 400, 500, and 600 grit sandpapers. After this process, the specimen was washed with distilled water and ethanol. Finally, the metal surface was dried with a warm air jet.
The electrochemical impedance spectrometry (EIS) tests were performed in Na2SO4 0.1 mol L-1 solution in the absence and presence of different extract concentrations using a Metrohm Autolab-PGSTAT 302 N potentiostat/galvanostat, controlled by the NOVA 1.10 software in a frequency range of 105 Hz to 10-3 Hz and an amplitude of 10 mV. The EIS measurements were carried out at the open circuit potential (OCP) after 30 min of stabilization. The corrosion inhibition efficiency (IE%) was calculated using charge transfer resistance values obtained from the EIS tests, according to Equation (2)4,18:
Where Rct and Rct,0 are the charge transfer resistances of the electrode immersed in the corrosive medium in the presence and absence (blank) of the inhibitor extracts, respectively.
The substrate polarization resistances at different inhibitor concentrations (Rp) were obtained by performing the linear polarization resistance (LPR) experiments in the same corrosive medium. In these tests, the potential was linearly varied around the OCP (± 10 mVSSE) with a scan rate of 0.1 mV s-1, using a Metrohm Autolab-PGSTAT 302 N potentiostat/galvanostat, controlled by GPES (General Purpose Electrochemical System) software. The slope of the resulting curves was used to determine the Rp values. Polarization resistance experiments were also performed for bare steel in the same electrolyte, for comparison. The IE% was also estimated using the polarization resistance values obtained for the substrates immersed in the corrosive medium in the absence (Rp,o) and the presence (Rp) of the extracts, as shown in Equation (3)19:
The polarization potentiodynamic (PP) tests were performed in the same corrosive medium by varying the potential between ± 500 mV around the OCP at a scan rate of 1 mV s-1 using the same Autolab-PGSTAT 302 N potentiostat/galvanostat system controlled by the GPES (General Purpose Electrochemical System) software. Using the Tafel extrapolation method, the IE% values were also calculated from the PP tests, as shown in Equation (4)4,18:
Where jcorr,0 is the corrosion current density in the absence of the inhibitor (blank), and jcorr is the corrosion current density in the presence of the inhibitor.
2.5. Gravimetric tests
The same AISI carbon steel specimens (average area = 6 cm2) were sanded with 100 to 600 grit sandpaper, washed with distilled water and alcohol, and dried with hot air. The mass of each specimen was measured in an analytical balance (Sartorius TE214S) with a precision of 0.1 mg. Then, the samples were immersed, in triplicate, in the same saline test solution for 24 and 48 hours at room temperature in the absence and presence of 100, 200, 300, and 400 mg L-1 of the lyophilized aqueous extracts studied in this work. After the experiments, the specimens were pickled in Clark's solution for 30 seconds, washed with distilled water and alcohol, dried in warm air, and weighed in the same analytical balance. The IE% values were obtained using Equation (5)4,18:
In this equation, Wo and W are the corrosion rate (g cm−2 h−1) in the absence and presence of the inhibitor extracts, respectively, which were calculated using Equation (6)18.
Where Δm is the difference between the initial and final mass of the sample (g), A is the specimen area (cm2), and t is the immersion time (h). All the analyses were performed in triplicate.
2.6. Morphological analysis
Specimens similar to those used in the gravimetric tests were used in the surface analysis. The samples were submitted to the same surface preparation described in Section 2.5 and immersed in a 0.10 mol L−1 Na2SO4 solution in the absence and presence of 100, 200, 300, and 400 mg L−1 of the lyophilized extracts studied in this work at room temperature for 24 and 48 hours. The samples were analyzed before and after being pickled in Clark's solution for 30 seconds, washed with distilled water and alcohol, and dried in warm air.
The samples were adapted to the stub using a conductive tape and analyzed using a Hitachi TM4000 scanning electron microscope, using secondary electron mode (SE), with beam acceleration of 15 kV and magnification of 2000X.
3. Results and Discussion:
3.1. Extract characterization
3.1.1. FTIR Spectroscopy
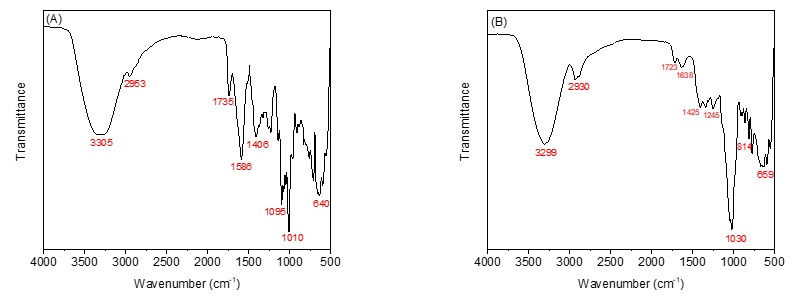
The FTIR spectra of the lyophilized garlic peel (GP) and centrifuged grape juice residue (CGJ) extracts are illustrated in Figure 1.
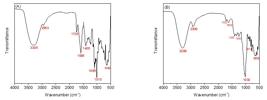
Two significant absorption bands appear at 3299 and 3305 cm−1 that may be related to the stretching vibration of N–H or O–H groups, such as those found in amine or phenolic groups. Bands around 2900 cm−1 indicate symmetric (2927, 2957 cm−1) and asymmetric (2856 cm−1) vibrations for C–H groups. Furthermore, the absorption bands at 1735, 1586, and 1406 cm−1 for the GP extract and 1729, 1638, and 1425 cm−1 for the CGJ extract may be associated with different stretching vibrations, such as C=O, C=C, and N−H20. The peak at 1245 cm−1 (Figure 1B) is attributed to the ring vibration of an epoxy group, and the one near 1095 cm−1 (Figure 1A) is attributed to C–O bonds. The bands near 1010 (Figure 1A) and 1030 cm−1 (Figure 1B) can be attributed to C–H deformations in the aromatic ring, while the bands below 1000 cm−1 are attributed to C–H bond vibrations21,22. All these bands are generally found in natural corrosion inhibitors and are related to phenolic compounds, amino acids, and carboxylic acids with aromatic rings. Thus, these results show that GP and CGJ extracts present fundamental requirements to be tested as natural corrosion inhibitors23.
3.1.2. Antioxidant capacity
The DPPH result was lower for the CGJ extract (8.47 ± 0.01) than the GP extract (12.64 ± 0.02). The FRAP assay showed similar behavior as the CGJ extract exhibited lower antioxidant capacity (134.6 g Trolox/100 mL) than the GP one (189.5 g Trolox/100 mL). The present CGJ results for the DPPH results corroborate the values found by da Rocha24 (9.14 ±1.12) for concentrated grape pomace extract. The present values were correlated with the antioxidant capacity, showing R2 = 0.995, confirming that these extracts may be tested as corrosion inhibitors.
3.1.3. Individual phenolic compounds
A mixture containing nine of the most usually found phenolic compounds in natural inhibitors (Gallic acid, Protocatechuic acid, Vanillic acid, Syringic acid, Transcinnamic acid, Caffeic acid, Coumaric acid, Rutin, and Quercetin) was used as the reference to verify which phenolic compounds were present in the GP and CGJ extracts by high-performance liquid chromatography (HPLC). None of the compounds in the reference phenolic mixture could be found in the GP extract. On the other hand, only Syringic acid (0.58 mg L-1) and Caffeic acid (0.03 mg L-1) were quantified in the CGJ extract using HPLC. These compounds have already been found in other natural extracts and were considered part of a polyphenol group that could mitigate the corrosion process of carbon steel in an acid medium14,25. Therefore, the presence of these compounds in the CGJ extract may be related to its inhibitory capacity.
The presence of these compounds can also be noted when the HPLC and FTIR results are related. For example, in the FTIR spectrum of pure caffeic acid26, bands at about 3424 and 3233 cm−1 are assigned to the stretching vibration of the -OH. The band at 3434 cm -1 has the same designation in the spectrum of the pure syringic acid27. When the FTIR spectra for both GP and CGJ extracts are observed in Figure 1, bands in the same range can be noted. The small intensity bands at 2982 and 2912 cm−1, for the pure caffeic acid, and 2930 and 3028 cm−1 for pure syringic acid, are attributed to aromatic C–H vibration modes26,27. Similar small aromatic bands can be observed in the same frequency range in Figure 1. An intense band at 1645 cm−1 was observed for the pure caffeic acid, which was attributed to the stretching of the carbonyl group C=O26. The same stretching vibration was verified for the pure syringic acid near 1750 cm-1 27. In Figure 1, the bands observed at 1735 cm-1 for the GP extract were more intense than those observed for the CGJ extracts at 1739 cm-1. A very small band was verified for the CGJ extract at 1638 cm-1 (Figure 1B). Furthermore, intense bands at 1625 cm−1 and 1450 cm−1 are attributed to the C–C olefinic stretching modes, while the C-C stretching ring vibrations are expected in the region from 1600 to 1585 cm-1 26,27. Therefore, the intense bands verified for the GP extract in Figure 1A at 1586 cm-1 and 1405 cm-1 may be related to the C-C stretching ring vibrations of polyphenol structures. Also, bands near 1050 cm-1 were attributed to the aromatic C–H bending modes26,28. These bands were also observed in both spectra, as shown in Figure 1. Frequencies below 1100 cm−1 may be related to the C-C-C bending modes of the aromatic system, except for the signals at 815 and 648 cm−1, which were attributed to the bending modes of the carbonyl group26,27. Therefore, the investigation of the chemical structure of GP and CGJ extracts (biomass material) demonstrated absorption bands close to the phenolic compounds identified in HPLC28.
It is important to mention that gas chromatography/mass spectrometry analyses have already verified the presence of S-containing compounds (allyl methyl disulfide, diallyl disulfide, methyl allyl trisulfide, diallyl trisulfide, and 2-thio phenecarboxaldehyde) in the GP extract2. It was expected that other polyphenolic compounds would also be present in the GP extract produced in this work. However, it must be remembered that natural products may present different compositions depending on soil and climate conditions29. Nonetheless, the DPPH and FRAP results indicated the presence of antioxidant compounds in this extract. Therefore, the present HPLC results for the GP extract were not expected, and other analyses must be performed to confirm the compounds contributing to the antioxidant effect observed in this extract.
3.1.4. Determination of protein content by Biuret reaction
Many studies on protein and amino acid derivatives as green corrosion inhibitors have demonstrated improved corrosion inhibition efficiency on different metals30-33. Recent studies on the corrosion inhibition activity of proteins revealed that solutions containing tofu protein can act as corrosion inhibitors, decreasing the corrosion rate34. Therefore, the protein quantification method using the Biuret reagent was important to investigate the potential of the protein content in the extracts produced in this work as green corrosion inhibitors. The protein contents obtained for the GP and CGJ were 1328 ± 8 mg albumin/100 mL extract and 311 ± 13 mg albumin/100 mL extract, respectively. This result indicates that amino acids are also present in the GP and CGJ extracts, which may also contribute to the inhibitory characteristics of these extracts.
The bands around 3300 cm-1 in the FTIR spectra of these extracts (Figure 1) can also be related to N-H stretching of these compounds and to the -OH of carboxylic acids. The presence of C=O vibration near 1730 cm-1 for the GP extract may be attributed to carboxylic acids, while the intense band in 1580 cm-1 (Figure 1A) can be related to angular N-H bending34. In this same figure, the bands near 1095 cm-1 can also be correlated to ester C-O bonds, while the band at 1405 cm-1 can also be related to the COO- bending of amino acids such as glutamic acid and aspartic acid34. Therefore, the protein content in the GP extract may be related to the antioxidant activity observed in the DPPH and FRAP results.
3.1.5. Inorganic composition
Regarding the inorganic composition, only Mg was found in both extracts studied in this work (48.7 ± 0.7 mg L-1 for GP and 7.0 ± 0.2 mg L-1 for CGJ). The other inorganic analytes were below the detection limit of the technique. Nonetheless, the Mg contents in this study were higher than those obtained in earlier works16. Mg2+ ions are a well-known cathodic inhibitor, which may also contribute to the anti-corrosive behavior of these extracts35.
3.2. EQCM evaluations
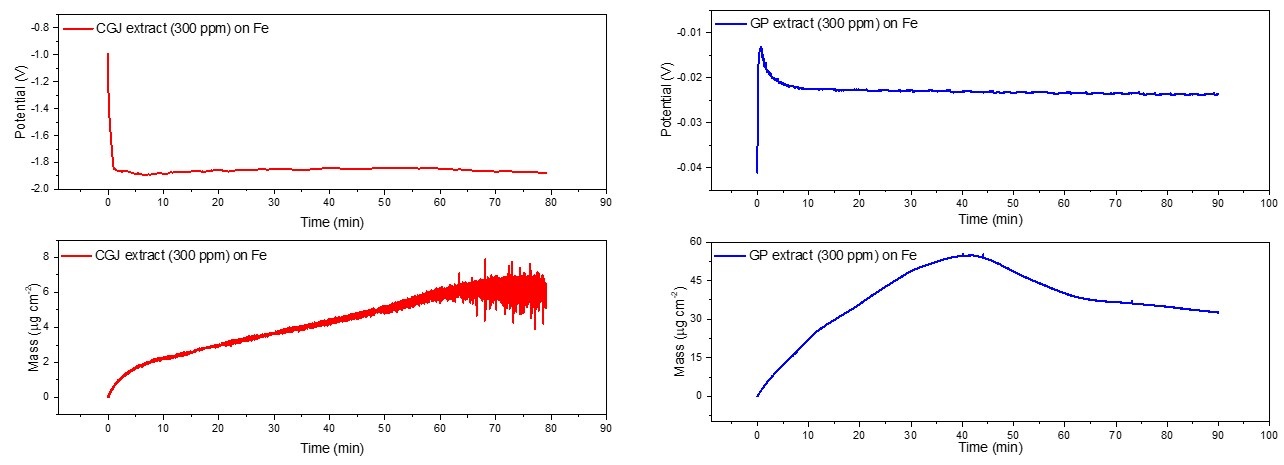
The EQCM analysis was used to verify the effects of the lyophilized inhibitor extracts studied in this work on the corrosion of the iron surface in the 0.1 mol L-1 Na2SO4 solution. The results are presented in Figure 2, where the potential and mass variation with the exposure time can be observed for each condition studied.
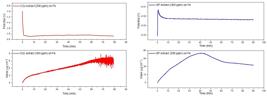
Time dependence of potential (A; B) and mass changes of the iron electrode (C; D) obtained by EQCM measurements.
The chronopotentiometric curves indicate the OCP variation when j = 0 was applied. An intense shift in the potential for more negative values was verified when the CGJ extract was added to the corrosive medium (Figure 2A), suggesting that the adsorption of the phenolic compounds present in this inhibitor extract may have caused polarization on the electrode. On the other hand, a slight decrease in potential was observed when GP extract was added to the 0.1 mol L-1 Na2SO4 solution (Figure 2B).
The monitoring of the electrode potential may also be used to indicate surface coverage, as a stable potential could be considered a complete surface coverage17. In both cases, the electrode potentials stabilized after approximately 10 min. However, in Figure 2C, it is possible to observe that the mass of the electrode immersed in the solution containing the CGJ extract increased slowly, although continuously, during 60 min, until approximately 7 µg cm-2. This result suggests that the adsorption of the polyphenol components of the CGJ extract may result in a thin film on the electrode surface. Thus, the complete surface coverage was not reached during this experiment despite the potential stability. On the other hand, a more intense mass increase can be observed on the electrode immersed in a GP-containing solution (Figure 2D), reaching above 50 µg cm-2 after 40 min. This result suggests that thicker films may be formed on the electrode surface due to the adsorption of the compound present in the GP extract. Nonetheless, five minutes later, there is a mass decrease, which can be related to removing the excess adsorbed molecules on the electrode surface or total electrode mass loss, leading to the initial corrosion stage. Although the same behavior could occur when the CGJ extract was used, it was not observed during the time studied.
3.3. Gravimetric tests
Table 1 presents the results of the corrosion rate measurements in carbon steel in a corrosive medium of 0.10 mol L-1 Na2SO4 in the absence and presence of the lyophilized extracts.
Table 1 shows, for 24 h of exposure to the corrosive medium, a trend of increasing inhibition efficiencies (IE%) with the extract concentration until 300 ppm. This result demonstrates the degree of surface coverage by the inhibitory molecules present in the extracts under these conditions, and can be attributed to the increase in the number of molecules occupied by the inhibitors at the metal interface36. Also, as indicated by the IE% values, the components of the GP extracts may have adsorbed on the surface more intensively than those of the CGJ extracts, likely forming thicker films and corroborating the EQCM experiments (Figure 2D). Additionally, the lower inhibition efficiency of the CGJ extract compared to the GP one may be associated with the acidic nature of the solution containing the CGJ inhibitor (pH = 4.35), which may limit its inhibitory capacity. The acid solution could have dissolved the inhibitory films formed on the steel surface, permitting an attack of the electrolyte on the substrate during the experiment. Nonetheless, a higher inhibitor concentration (400 ppm) led to a decrease in the IE% values. It could be related to competition among the extract inhibitor molecules to access the substrate surface, causing a steric effect and a reduction in the surface coverage. Therefore, 300 ppm of GP or CGJ extracts could efficiently mitigate carbon steel corrosion in the Na2SO4 0.1 mol L-1 solution. Nonetheless, none of the IE% results obtained under this condition could be compared to those verified for carbon steel when natural inhibitors were tested in acidic media2,16. However, lower IE% values were obtained for carbon steel when GP and garlic extract inhibitors were added to NaCl (50%)7 and sulfate (81%) media37. No work could be found using the CGJ extract as a corrosion inhibitor for carbon steel in neutral sulfate media.
It can also be noted in this table that longer immersion times decreased the substrate corrosion rate (Wcorr) in the absence of the inhibitor, causing a decrease in the IE% values obtained in the inhibitor-containing media at 48 h. As these experiments were performed in neutral media and under natural aerated conditions, porous 3D oxidic layers may have been formed, leading to an interphase corrosion inhibition process, which presupposes the formation of a 3D protective layer between the corrosive substrate and the electrolyte38. However, most of the time, these 3D layers are considered porous, consisting of poorly soluble compounds such as oxidic corrosion products, inhibitors, or coatings. The inhibition efficiency of the formed 3D layers strongly depends on their mechanical, structural, and chemical properties, especially their porosity, thickness, and stability, which, in turn, are highly dependent on the composition of the corrosive medium, the exposure time of the sample, and the hydrodynamic conditions38,39.
Since corrosion in near-neutral media is associated with the accumulation of low-soluble oxides or intermediate corrosion products, with the subsequent formation of porous and homogeneous 3D passive layers, it is expected that the inhibition efficiency can be controlled by the rate of the mainly mass-controlled cathodic reaction, in the present case, the oxygen reduction reaction (ORR). Both the formation of the porous oxidic 3D layer and the ORR are time-dependent processes, and therefore, IE% becomes predominantly a function of time38, as well as of the thickness and porosity of the layer. Morsi et al.39 showed that forming a porous oxidic layer on a carbon steel sample in a neutral sulfate solution is strongly time-dependent. In the present work, the porous oxide layer was likely only completely stable after 48 h of exposure, leading to a decrease in the Wcorr.
An effective interphase inhibitor should react chemically and be incorporated into this passive 3D layer, leading to more homogeneous and densely packed networks with less porosity and higher mechanical stability. These changes in the passive 3D layer may cause mass transfer restrictions or geometric blocking and decrease the ORR process, reducing the corrosion rate38. These effects were achieved after 24 h of exposure to the media containing 300 ppm of the GP and CGJ extracts, leading to the highest IE% values verified (96.4% and 88.1% for the electrolytes containing GP and CGJ, respectively). However, independent of the inhibitor extract tested, the IE% strongly decreased after 48 hours of exposure to the corrosive medium. It is expected that many interface inhibitors, that is, those that adsorb only on the substrate surface, producing a 2D layer, lose their efficiency in the presence of surface layers, such as the porous oxide layer formed under the conditions of the present experiments. It occurs due to a weaker interaction between the inhibitor species and the surface in the presence of 3D coverage39.
The previous hypothesis that a stable porous 3D oxide layer was only obtained after 48 h of exposure to the corrosive medium may explain these results. Considering that the 3D oxide layer did not completely cover the carbon steel surface after 24 h of exposure to the corrosive medium due to the time dependence of this layer formation on this surface in a sulfate solution39, it is possible that the polyphenols and other molecules of the GP and CGJ extracts could have acted as interface inhibitors and adsorbed on the non-covered steel surface, leading to their improved anti-corrosive performance when 300 ppm of the extracts were added to the corrosive medium. However, when all the substrate was covered by the stable 3D oxide layer after 48 h of exposure, the components of the extracts could not act as an efficient interphase inhibitor and protect the substrate.
Solvent molecules are also adsorbed at the metal/solution interface during the corrosion inhibition of metals. According to the Bockris-Devanathan-Müller model, the adsorption process in aqueous solution can be considered a substitution process between the organic compounds in the aqueous phase (Orgsol) and water molecules on the electrode surface (H2Oads), as presented in Equation (7):
Where x is the number of water molecules replaced by an organic inhibitor.
Based on the inhibitors’ effects after 24 h of exposure and considering that they could have been adsorbed on the uncovered substrate surface, the interaction between the inhibitor and the metal surface was tested by adsorption isotherms. The fraction of the surface covered (ϴ) by adsorbed molecules is directly proportional to the inhibitory efficiency. Several models have been used for this purpose (Langmuir, Temkin, Flory-Huggins, El-Awady), and the results obtained from mass loss measurements have been used to describe the adsorption process, according to Equations (8-12)6,40,41.
Where c is the concentration, K is the adsorption constant, a is the lateral interaction parameter between adsorbed molecules, x is the number of adsorbed water molecules replaced by inhibitor molecules, and y is the number of molecules adsorbed in an active site.
Langmuir's theory assumes that adsorption occurs in a specific and homogeneous location, and each site contains only one inhibitory molecule. The Temkin isotherm assumes that the heat of adsorption of all molecules covering the adsorbent decreases linearly as a function of the coating due to interactions between the adsorbed molecules (a >0, attraction; a <0, repulsion). The Flory-Huggins isotherm assumes that an active site can be occupied by more than one inhibitory molecule (parameter x); thus, x > 1 indicates that more than one H2Oads molecule was replaced by an organic molecule. Finally, El-Awady et al. consider that a single inhibitory molecule can adsorb more than one active site (parameter y); y < 1 shows that a single inhibitor molecule was adsorbed in more than one active site, i.e., y is the number of inhibitor molecules occupying an active site on the metal surface.
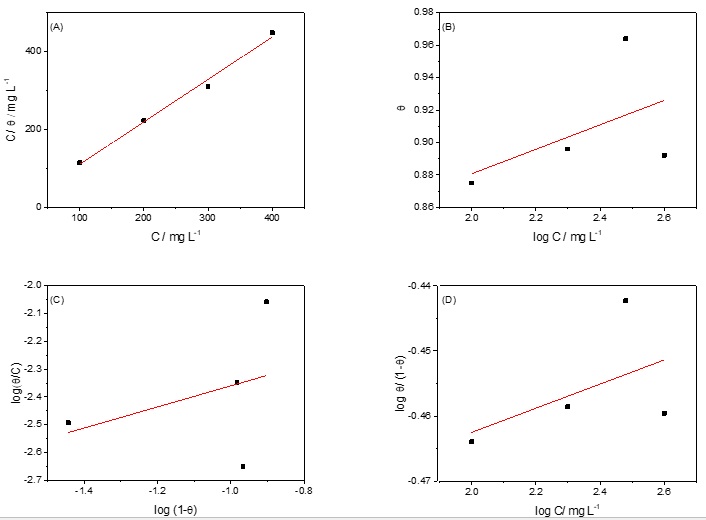
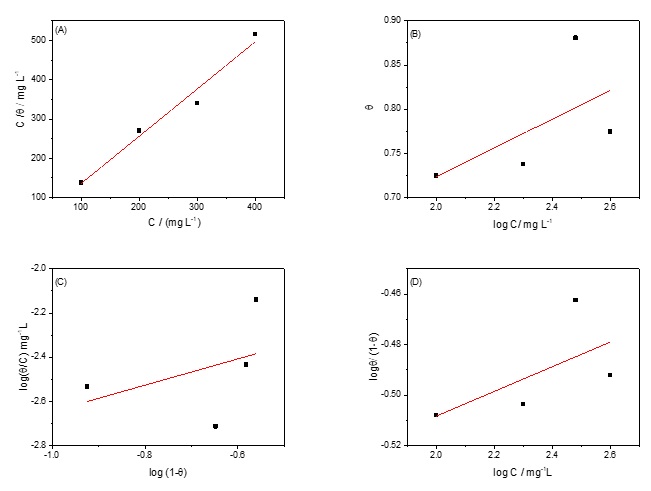
Table 2 shows the parameters for the four adsorption isotherms obtained for the GP (Figure 3) and CGJ (Figure 4) lyophilized extracts as corrosion inhibitors after 24 h of exposure to the corrosive sulfate medium. According to Souza et al.42, adequate determination coefficients are between 0.99 and 0.60 when working with corrosion inhibitors.
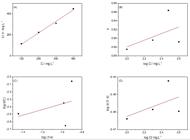
Langmuir (A), Temkin (B), Flory–Huggins (C), and El-Awady (D) adsorption isotherms for the GP extract components on the carbon steel surface in a 0.1 mol L-1 Na2SO4 solution.
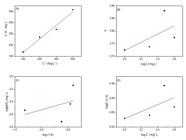
Langmuir (A), Temkin (B), Flory–Huggins (C), and El-Awady (D) adsorption isotherms for the CGJ extract components on the carbon steel surface in a 0.1 mol L-1 Na2SO4 solution.
The Langmuir isotherm showed the best linear regression coefficient values for the GP extract after 24 h of exposure to the corrosive medium, with a determination coefficient (R2) of 0.9926 and an angular coefficient of 0.0600 (Table 2 and Figure 3). This behavior suggests that the molecules present in this extract were adsorbed on the surface of the carbon steel according to a Langmuir adsorption isotherm, which indicates that the inhibition is produced by monolayer adsorption on the metal surface containing a fixed number of adsorption sites. Each site includes an adsorbate with no interaction between the adsorbate molecules. This result agrees with the hypothesis that the oxide layer did not completely cover the substrate under this condition, permitting the GP components to be adsorbed on its surface. The adsorption equilibrium constant (Kads) was calculated from the linear coefficient as 0.9174 L mg-1. Although ΔGads is an important parameter for evaluating the interaction between the inhibitory agent and the metal surface, it is not usually calculated in the case of plant and agro-industrial residue extracts since it involves the molecular mass of the inhibitory molecule, which is not possible to obtain when several compounds are acting to inhibit the corrosion process simultaneously2,5.
The results shown in Table 2 and Figure 4 show that the Langmuir adsorption isotherm also provided the best fit for the CGJ extract data, showing an R2 = 0.9746; however, an angular coefficient slightly greater than one was observed. Based on the present results and the Langmuir isotherm theory, it is likely that the deviation from unity observed in the angular coefficient may have been caused by interaction between the molecules of the inhibitor adsorbed in neighboring sites, which could increase the competition among the molecules and the steric effect. Therefore, inhibitor concentrations up to 300 ppm may have permitted increased substrate coverage, because it was possible for the inhibitor molecules to occupy active sites far enough apart to avoid the steric effect. On the other hand, above this concentration value, the competition among the molecules in neighboring sites may have increased the steric effect, leading to the instability of the adsorbed layer, which could no longer protect the substrate. This result suggests that an optimal concentration of CGJ extract must be used to obtain efficient substrate protection.
The results obtained for the 48 h of exposure were unsatisfactory, as both extracts could not act on the steel surface as interface corrosion inhibitors, nor could interact with the corrosion product to perform as interphase inhibitors38,43. Therefore, there was no reason to test adsorption isotherms under these conditions.
3.4. Electrochemical tests
3.4.1. Electrochemical impedance spectroscopy (EIS)
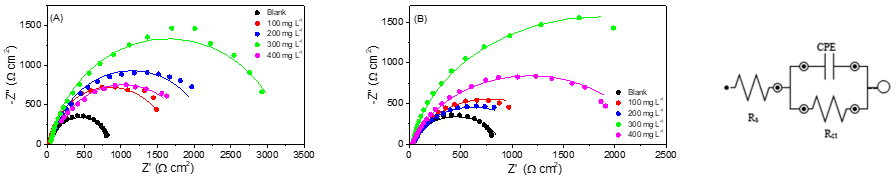
Figure 5 shows the Nyquist diagrams obtained at the open circuit potential of carbon steel in a 0.1 mol L−1 Na2SO4 medium in the absence and presence of different concentrations of the studied extracts. In the solutions without inhibitors, only a depressed capacitive loop was observed, which can be related to a single time constant attributed to charge transfer and double layer capacitance. Such depressions are characteristic of solid electrodes and are commonly referred to as dispersion effects due to surface roughness and inhomogeneities during corrosion. The Nyquist diagrams obtained in the presence of the extracts show the same behavior, indicating that the inhibitor extracts did not affect the corrosion mechanism41.
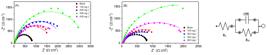
Nyquist diagrams for carbon steel in Na2SO4 medium in the absence and presence of different concentrations of (A) GP and (B) CGJ extracts. (C) Equivalent circuit used to simulate the electrochemical impedance data obtained for carbon steel in the absence and presence of the extract.
Figure 5 also shows that the increase in the capacitive loop, related to the decrease in the corrosion rate, occurred as the extract concentration increased, reaching its maximum when 300 mg L−1 of GP or CGJ extracts were added to the corrosive medium. Also, there are a few differences between the anti-corrosive effects of the extracts. The EIS data were analyzed based on the equivalent circuit shown in Figure 5C, where Rs represents the ohmic resistance of the solution, Rct represents the charge transfer resistance, and CPE is the admittance of the constant phase element. The double layer capacitance, Cdl, was calculated using Equation (13):
Where “N” is the term that defines the equivalence degree of the constant phase element for a capacitive component.
Table 3 shows the parameters obtained by fitting the EIS data using the equivalent circuit of Figure 4C. The results confirm that both extracts decreased the corrosion process of the carbon steel in the Na2SO4 0.1 mol L-1 medium.
It is expected that corrosion resistance systems presenting high IE% values and great inhibitory capacity must present higher Rct and lower CDL values than that verified for the blank experiment17. The data presented in Table 3 shows it is true for most conditions studied. Also, these results agree with the gravimetric experiments, as an increase in the Rct and the IE% values with the extract concentrations was observed, reaching the maximum value when the corrosive medium contained 300 ppm of the GP or CGJ extracts. However, the lowest Cdl values were not verified for the extracts tested under this condition. Assuming that under the conditions of these experiments, the surface was not entirely covered by the 3D-oxide layer38,39, it was expected that the components of the GP and CGJ extracts could have been adsorbed on the substrate surface. However, the high Cdl values, observed mainly for the CGJ extract, suggest that the tested extracts could not replace the water molecules from the substrate surface adequately, leading to a higher exposed surface area, as already indicated by the slight mass increase observed in the EQCM experiments (Figure 2C).
3.4.2 Potentiodynamic polarization curves (PP)
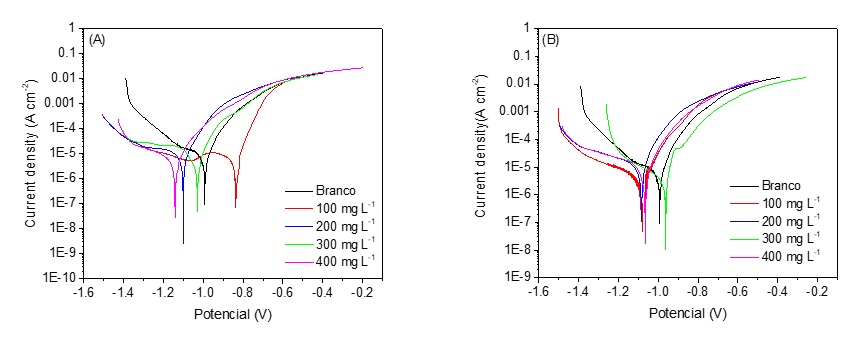
Figure 6 shows the anodic and cathodic polarization curves for carbon steel in a 0.1 mol L−1 Na2SO4 solution, obtained in the absence and presence of the studied extracts. It is noted that, in most of the concentrations added to the corrosive medium, the presence of the extracts changed the polarization curves to more negative potential values, reducing the cathodic current. Nonetheless, some concentrations shifted the curves in the opposite direction. These results suggest that the actuation of these extracts depended on the inhibitor concentration5.
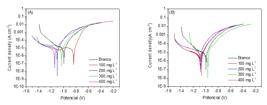
Polarization curves of carbon steel in a Na2SO4 0.1 mol L-1 solution in the absence (blank) and presence of different concentrations of the extracts (A) GP and (B) CGJ.
Table 4 shows the electrochemical parameters corrosion potential (Ecorr), corrosion current density (jcorr), and the anodic (βa) and cathodic (βc) Tafel slopes obtained by the Tafel extrapolation method using overpotential values superior to 30 mV44. The open circuit potential (OCP) is also shown in this table.
Electrochemical parameters obtained by the polarization curves and linear polarization experiments.
For both extracts, the open circuit potential (OCP) showed a cathodic shift higher than 85 mV compared to the blank, except when 300 mg L-1 of the CGJ extract was added to the medium, where a slight anodic shift (44 mV) was observed. The corrosion potential (Ecorr) also tended to present cathodic variations compared to the blank experiments, except when 100 mg L-1 of GP and 300 mg L-1 of CGJ extracts were added to the corrosive medium, where anodic shifts of 154 mV and 30 mV, respectively, were observed. Therefore, under open circuit conditions, the extracts slow the cathodic reactions, demonstrating that they act as cathodic-type inhibitors, except for the predominant anodic character in 300 mg L-1 of the CGJ extract. When the working electrode was polarized, shifting most of the Ecorr to more negative values than the blank test, it is confirmed that the adsorption of inhibitory molecules occurred predominantly on the cathodic sites.
However, as already observed in Figure 6, the concentrations added to the corrosive medium affected the behavior of the inhibitor. While acting as a cathodic inhibitor when 200 and 400 mg L-1 were added to the corrosive medium, the GP extract showed an anodic behavior when the 0.1 mol L−1 Na2SO4 solution contained 100 mg L-1 of this extract was used. Considering the CGJ extract, a cathodic behavior was verified when 100 and 200 mg L-1 of the extract were added to the corrosive medium. Nonetheless, the addition of 300 mg L-1 of GP or CGJ extracts led to a mixed-type inhibitor.
As can also be seen in Table 4, there are more significant changes observed in the values of the cathodic Tafel slopes (βc), confirming that the inhibitor tended to alter the mechanism of the cathodic processes, responsible for the oxygen reduction (ORR) and water hydrogen reduction (WHER). The main exception was verified when 300 mg L-1 of GP or CGJ extracts were added to the corrosive medium, in which both cathodic and anodic (βa) Tafel slopes changed significantly compared to the blank data. This result confirms that, under these conditions, the presence of this extract affected the mechanism of both ORR/WHER on the cathodic sites and the iron dissolution on the anodic sites. It must be pointed out that Tafel slope results observed for the CGJ extracts suggest that it may be acting as a mixed-type inhibitor, interfering in both mechanisms, although showing higher cathodic influence.
The presence of the extract decreased the corrosion current density (jcorr) of the carbon steel in the 0.1 mol L−1 Na2SO4 solution compared to the blank test. The highest IE% values were obtained for both extracts when a concentration of 300 mg L−1 was added to the corrosive medium (64.8% for the GP extract and 66.8% for the CGJ extract), which agrees with the EIS results and the gravimetric tests (GT).
3.4.3. Linear polarization resistance (LPR)
The anti-corrosive ability of the GP and CGJ extracts was also verified based on the polarization resistance (Rp) values obtained using linear polarization resistance experiments (LPR). Rp is a quantitative parameter that is inversely proportional to corrosion rate and can be used to compare corrosion resistance of metals under various chemical and electrochemical conditions. The Rp results are also shown in Table 4, and it is noted that, regardless of the extract used, the highest IE% values were obtained when 300 ppm of the extract was added to the corrosive medium (62.3% and 75.3% for the GP and CGJ extracts, respectively). Although the differences between the IE% values were higher for the results obtained in the solutions containing 300 ppm of GP and CGJ compared to the other electrochemical techniques, it could be related to the variability observed in the natural resources used to produce the extracts29. Despite this, the Rp results also suggest that both extracts are promising corrosion inhibitors for carbon steel in the studied medium.
3.5. Surface analysis
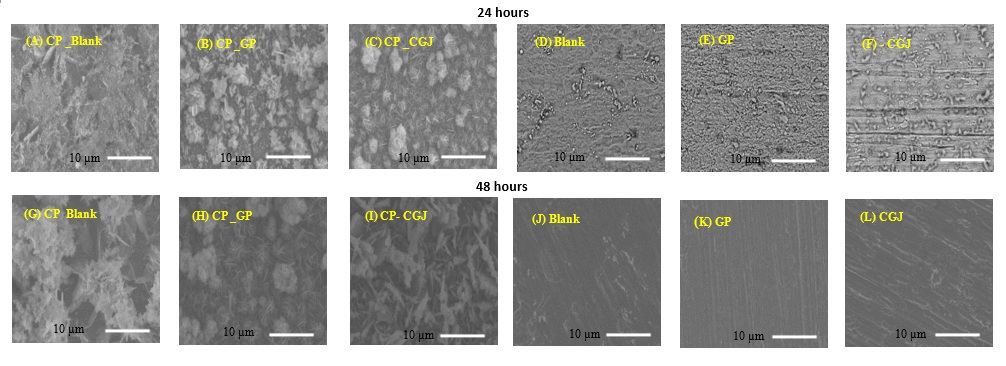
Figure 7 shows the SEM micrographs (magnification of 2000X) of the carbon steel surfaces after immersion for 24 h and 48 h in 0.1 mol L−1 Na2SO4 in the absence and presence of 300 mg L−1 of GP and CGJ extracts at 25 oC.
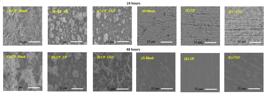
Morphological analysis of the carbon steel surface after (A to F) 24 h and (G to L) 48 h of exposure to the 0.1 mol L−1 Na2SO4 medium, before and after pickling with Clark’s solution. 24 h: (A, D - blank, B, E – GP extract, and C, F – CGJ extract). 48 h: (G, J – blank, H, K – GP extract, and I, L – CGP extract). Magnification: 2000 X.
Figures 7A to 7C and 7G to 7I show the corrosion product formed by the inhibitor/substrate system on the surfaces of the carbon steel substrate after 24 h and 48 h of immersion in the corrosive medium, respectively. When no extract was added to the corrosive medium (Figures 7A and 7G, for 24 h and 48 h of immersion, respectively), the steel surface presented a porous corrosion product composed of globular crystals (often called cotton balls), indicating the presence of α-FeOOH and γ-FeOOH45. These corrosion products generally appear in structures as leaf-like or flower-like flakes. In addition to these cotton balls, flower-like and pointed structures were verified when the steel was immersed in the corrosive medium containing 300 mg L-1 of the GP (Figure 7B) and CGJ (Figure 7C) extracts for 24 h. These structures are probably related to the interaction between the inhibitory molecules present in the inhibition extracts and the surface of the steel46. It is also interesting to note that the loose corrosion product observed for the blank experiment was changed to a more compact layer when the tested inhibitors were added to the electrolyte. Maestro et al.7 proposed that the main corrosion product on the surface of the carbon steel immersed in a saline neutral medium containing GP extract was iron carbonate (FeCO3). As the surfaces of Figures 7C and 7B are not so different, it is possible that this compound was also present on the surface of the sample immersed in the CGJ extract-containing medium. Therefore, the final corrosion product observed on the surfaces immersed in the inhibitor-containing corrosive medium for 24 h may likely be formed of the iron oxides and the inhibitor molecules, resulting in a 3D passive layer37. After 48 h of immersion, the surfaces seemed to be covered by smooth regions of corrosion products containing these new structures (Figures 7H and 7I). However, the final corrosion product appears less compact, showing pores which could have permitted the electrolyte attack on the substrate, decreasing the inhibition efficiency. This appearance can be evidenced more directly by the sample surface exposed to the CGJ-containing solution (Figure 7I), likely due to the acidic characteristics of this medium.
After pickling using Clark's solution for 30 seconds, the morphology observed in Figure 7D for the steel immersed in the corrosion solution for 24 h shows a surface with grooves and micro-voids characteristic of uniform corrosion of carbon steel in a neutral saline medium. Different surfaces can be observed for the surfaces assayed in the presence of the extracts for the same period (Figures 7E and 7F). While a more uniform corroded surface can be noted for the sample exposed to the saline medium containing the GP extract (Figure 7E), a smooth surface showing the abrasion treatment lines and several pits is observed on the surface exposed to the CGJ extract-containing saline medium.
The morphologies observed after pickling in Clark's solution for the samples immersed for 48 h in the corrosive media studied show corroded surfaces presenting grooves and micro-voids, mainly for the blank experiment (Figure 7J) and that in which the CGJ extract was added to the corrosive medium (Figure 7L). Although small voids were observed on the sample's surface immersed in the GP extract-containing medium (Figure 7K), a smoother surface was observed. Although all these images indicate that, compared to the blank test, the steel surface was protected by the inhibitors, it must be emphasized that the results commonly observed for the acid medium were not verified here.
In the gravimetric tests (GT) performed at 24 h, the sample exposed to the solution containing 300 ppm of the GP extract showed higher IE% values than those verified for the CGJ extract under the same concentration. However, the opposite result was observed in the EIS, PP, and RPL experiments, although the differences in the IE% values were not significant, except for the Rp values. It must be remembered that the electrochemical experiments lasted approximately 2 h, while the gravimetric tests were performed in 24 h. Then, gravimetric evaluations were also conducted during 2 h in the same corrosive media and using the same procedures described in section 2.5 to verify the behavior of the extract-containing solutions during the same period used for the electrochemical experiments. Considering that the corrosion rate of the blank experiment in 2 h was 4.82E-05± 4.79E-06 g cm-2 h-1, the results showed that the IE% for the carbon steel in the solution containing 300 ppm of GP extract was only 11.2% (corrosion rate = 4.28E-05± 4.85E-06 g cm-2 h-1). In contrast, the IE% value for the 300 ppm CGJ-containing solution was 41.3% (corrosion rate = 2.83E-05± 2.20E-06 g cm-2 h-1) in the same period. Maestro et al.7 also verified an increase in the IE% values of a saline solution containing GP extracts. Therefore, it seems that forming a protective layer using the GP extract in a neutral medium is slower than using the CGJ one, requiring at least 24 hours to offer adequate protection.
Nonetheless, it is important to mention that the Cdl value of the sample exposed to the CGJ extract-containing solution was higher than that verified for the blank test, suggesting poor surface coverage, as already verified in the EQCM experiments (Figure 2). It may have resulted in pitting corrosion, as observed in Figure 7F. On the other hand, Figure 7E suggests that the presence of GP extract in the corrosive medium decreased the corrosion process more adequately, since only uniform corrosion was verified. Although no smooth surface could be noted in this case, the presence of GP extract components covering the electrode surface seems to avoid localized corrosion, contributing to a more efficient anti-corrosive performance of this extract in this saline medium37,42.
When the images of the pickled substrate are evaluated after 48 h immersed in the corrosive media containing the extracts, that obtained in the GP-containing electrolyte (Figure 7K) shows small amounts of defects, compared to the one obtained in the CGJ-containing solution (Figure 7L). Nonetheless, the GT experiments confirmed that none of the extracts evaluated could act as an interphase inhibitor to protect the substrate adequately after 48 h of exposure to the corrosive medium.
4. Conclusions
The lyophilized GP and CGJ extracts presented antioxidant characteristics that suggested they could be promising green corrosion inhibitors for carbon steel. The EQCM studies indicated that a thin adsorbed CGJ component film was produced during 60 min of exposure to the corrosive medium, while a thicker adsorbed film was verified for the electrode immersed in the GP-containing solution.
Both extracts could efficiently decrease the carbon steel corrosion after 24 h of exposure to a 0.1 mol L-1 Na2SO4 solution, acting as interface inhibitors. In both cases, the inhibition efficiency increased with the extract concentration, reaching the maximum IE% values at 300 ppm. Nonetheless, none of them could reach the IE% values generally verified for carbon steel in acid media containing natural inhibitors (IE% > 90%). The adsorption isotherm using the data obtained from the samples exposed to the solution containing the GP and CGJ extracts for 24 h could be adjusted by the Langmuir model. However, after 48 h of exposure, the IE% values dropped strongly due to the formation of a 3D-iron oxide and the inability of the extracts to perform as interphase inhibitors.
The electrochemical results obtained from EIS, PP, and RPL measurements confirmed that 300 ppm was the optimum concentration of the GP and CGJ extracts to provide adequate anti-corrosive protection for carbon steel in a 0.1 mol L-1 Na2SO4 solution. Nonetheless, the high Cdl value verified for the sample exposed to the solution containing the CGJ extract suggested poor coverage and may have permitted the development of localized corrosion after 24 h and 48 h of exposure to the corrosive medium. On the other hand, only uniform corrosion was verified on the sample's surface immersed in the medium containing the GP extract for 24 h. Although some small localized defects could be noted on the surface exposed for 48 h to the same solution, the present results suggest that this extract may protect the substrate more efficiently in the tested saline medium.
5. Acknowledgments
The authors would like to thank the Rio de Janeiro Research Support Foundation (FAPERJ), the National Council for Scientific and Technological Development (CNPq), the Postgraduate Support Program (PROAP), and the Rio de Janeiro State University (UERJ) for financial support. Marques M. M. also thanks the Federal Institute of Rio de Janeiro (IFRJ) and Professor André Rocha Pimenta for the scanning electron microscopy analyses. Finally, the authors thank the Poggere Winery (São Marcos – RS) for supplying the centrifuged grape juice residue used in this work. This study was financed in part by the "Coordination for the Improvement of Higher Education Personnel - Brazil (CAPES)" - Financial Code 001.
-
Data Availability
The raw/processed data required to reproduce these findings cannot be shared at this time as the data also forms part of an ongoing study
6. References
- 1 Bonilla J, Sobral PJA. Antioxidant and antimicrobial properties of ethanolic extracts of guarana, boldo, rosemary and cinnamon. Braz J Food Technol. 2017;20:e2016024.
- 2 Pereira SSAA, Pêgas MM, Fernández TL, Magalhães M, Schöntag TG, Lago DC, et al. Inhibitory action of aqueous garlic peel extract on the corrosion of carbon steel in HCl solution. Corros Sci. 2012;65:360-6.
- 3 Souza TF, Magalhães M, Torres VV, D’Elia E. Inhibitory action of Ilex paraguariensis extracts on the corrosion of carbon steel in HCl solution. Int J Electrochem Sci. 2015;10(1):22-33.
- 4 Ferreira KCR, Cordeiro RFB, Nunes JC, Orofino H, Magalhães M, Torres AG, et al. Corrosion inhibition of carbon steel in HCl solution by aqueous brown onion peel extract. Int J Electrochem Sci. 2016;11(1):406-18.
- 5 Torres VV, Amado RS, de Sá CF, Fernandez TL, Riehl CA S, Torres AG, et al. Inhibitory action of aqueous coffee ground extracts on the corrosion of carbon steel in HCl solution. Corros Sci. 2011;53(7):2385-92.
- 6 Torres VV, Cabral GB, Da Silva ACG, Ferreira KCR, D’Elia E. Ação inibidora de extratos da semente do mamão papaia na corrosão do aço-carbono 1020 em HCL 1 mol L-1. Quim Nova. 2016;39(4):423-30.
- 7 Maestro CAR, Malafaia AMS, Silva CF, Nascimento CS, Borges KB, Simões TA, et al. Corrosion resistance improvement of mild steel in different pH using peel garlic green inhibitor. Mater Chem Phys. 2023;305(1):e127971.
- 8 Barreto LS, Tokumoto MS, Guedes IC, De Melo HG, Amado FDR, Capelossi VR. Evaluation of the anticorrosion performance of peel garlic extract as corrosion inhibitor for ASTM 1020 carbon steel in acidic solution. Materia. 2017;22(3):e11852.
- 9 Carrijo-Gonçalves GA, Pereira B, Veloso TC, Capelossi VR. Electrochemical and surface morphology characterizations of zinc electroplated coatings. Surf Eng. 2025;41(2):227-40.
- 10 Haas IC S, Toaldo IM, Gois JS, Borges DLG, Petkowicz CLO, Bordignon-Luiz MT. Phytochemicals, monosaccharides and elemental composition of the non-pomace constituent of organic and conventional grape juices (Vitis labrusca L.): effect of drying on the bioactive content. Plant Foods Hum Nutr. 2016;71(4):422-8.
- 11 Zamblau I, Varvara S, Muresan LM. Corrosion behavior of Cu-SiO2 nanocomposite coatings obtained by electrodeposition in the presence of cetyltrimethylammonium bromide. J Mater Sci. 2011;46:6484-90.
- 12 Kim DO, Lee KW, Lee HJ, Lee CY. Vitamin C equivalent antioxidant capacity (VCEAC) of phenolic phytochemicals. J Agric Food Chem. 2002;50(3):13713-7.
- 13 Benzie IFF, Strain JJ. The Ferric Reducing Ability of Plasma (FRAP) as a measure of “antioxidant power”: the FRAP assay. Anal Biochem. 1996;239(1):70-6.
- 14 Schulz M, Borges GSC, Gonzaga LV, Seraglio SKT, Olivo IS, Azevedo MS, et al. Chemical composition, bioactive compounds and antioxidant capacity of juçara fruit (Euterpe edulis Martius) during ripening. Food Res Int. 2015;77:125-31.
- 15 Zenebon O, Pascuet NS, Tiglea P. Métodos físico-químicos para análise de alimentos. 1. ed. São Paulo: Instituto Adolfo Lutz; 2008. 1020 p.
- 16 Costa MAJL, Gois JS, Toaldo IM, Bauerfeldt ACF, Batista DB, Bordignon-Luiz MT, et al. Optimization of espresso spent ground coffee waste extract preparation and the influence of its chemical composition as an eco-friendly corrosion inhibitor for carbon steel in acid medium. Mater Res. 2020;23(5):e20190591.
- 17 Telegdi J, Shaban A, Kálmán E. EQCM study of copper and iron corrosion inhibition in presence of organic inhibitors and biocides. Electrochim Acta. 2000;45(22):3639-47.
- 18 Ramos SAF, Senna LF, Lago DCB. Evaluation of aqueous coffee husk extracts as a corrosion inhibitor of 1020 carbon steel in 1 mol L-1 HCl solution. Mater Res. 2019;22(Suppl 1):e20180839.
- 19 Rezende TGL, Lago DCB, Cesar DV, Senna LF. Electrodeposition of composite coatings of Cu/AlO(OH) using allyl alcohol as an additive. Mater Res. 2017;20(Suppl 2):374-85.
- 20 Garai S, Garai S, Jaisankar P, Singh JK, Elango A. A comprehensive study on crude methanolic extract of Artemisia pallens (Asteraceae) and its active component as effective corrosion inhibitors of mild steel in acid solution. Corros Sci. 2012;60:193-204.
- 21 Fernández K, Agosin E. Quantitative analysis of red wine tannins using Fourier-transform mid-infrared spectrometry. J Agric Food Chem. 2007;55(18):7294-300.
- 22 Li XH, Deng SD, Fu H. Inhibition by Jasminum nudiflorum Lindl. leaves extract of the corrosion of cold rolled steel in hydrochloric acid solution. J Appl Electrochem. 2010;40(9):1641-9.
- 23 Ji G, Anjum S, Sundaram S, Prakash R. Musa paradisica peel extract as green corrosion inhibitor for mild steel in HCl solution. Corros Sci. 2015;90:107-17.
- 24 Rocha JC. Obtenção de inibidores de corrosão a partir de extratos de produtos naturais [thesis]. Rio de Janeiro: Universidade Federal do Rio de Janeiro; 2013. 106 p.
- 25 Shah AM, Rahim AA, Ibrahim MNM, Hussim MH. Depolymerized oil palm frond (OPF) lignin products as corrosion inhibitors for mild steel in 1 M HCl. Int J Electrochem Sci. 2017;12:9017-39.
- 26 Vertuccio L, Guadagno L, D’Angelo A, Viola V, Raimondo M, Catauro M. Sol-gel synthesis of caffeic acid entrapped in silica/polyethylene glycol based organic-inorganic hybrids: drug delivery and biological properties. Appl Sci. 2023;13(4):e2164.
- 27 Zochedh A, Priya M, Chakaravarthy C, Sultan AB, Kathiresan T. Experimental and computational evaluation of syringic acid: structural, spectroscopic, biological activity and docking simulation. Polycycl Aromat Compd. 2023;43(7):6516-48.
- 28 El-Hendawy ANA. Variation in the FTIR spectra of a biomass under impregnation, carbonization, and oxidation conditions. J Anal Appl Pyrolysis. 2006;75(2):159-66.
- 29 Ferreira MD. Instrumentação pós-colheita em frutas e hortaliças. Brasília: Embrapa Instrumentação; 2017. 284 p.
- 30 Xu XT, Xu HW, Li W, Wang Y, Zhang XY. A combined quantum chemical, molcular dynamics and Monto Carlo study of three amino acids as corroison inhibitors for aluminum in NaCl solution. J Mol Liq. 2022;345:e117010.
- 31 Udayappan B, Veawab A. Performance analysis of methionine as an environmentally friendly corrosion inhibitor for carbon steel in the amine based carbon capture process. Int J Greenh Gas Control. 2022;114:e03565.
- 32 Kumar D, Jain N, Jain V, Rai B. Amino acids as copper corrosion inhibitors: a density functional theory approach. Appl Surf Sci. 2020;14:e145905.
- 33 Thoume A, Elmakssoudi A, Left DB, Benzbiria N, Benhiba F, Dakir M, et al. Amino acid structure analog as a corrosion inhibitor of carbon steel in 0.5 M H2SO4: Electrochemical, synergistic effect and theoretical studies. Chem Data Collect. 2020;30:e100586.
- 34 Zunita M, Wahyuningrum D, Wenten IG, Boopathy R. Carbon steel corrosion inhibition activity of tofu associated proteins. Bioresour Technol Rep. 2022;17:e100973.
- 35 Gentil V, Carvalho LJ. Corrosão. 7th ed. Rio de Janeiro: LTC; 2022. 408 p.
- 36 Santos EDC, Cordeiro R, Santos M, Rodrigues PRP, Singh A, D’Elia E. Barley agro-industrial residues as corrosion inhibitor for mild steel in 1mol L-1 HCl solution. Mater Res. 2019;22(2):e20180511.
- 37 Parthipan P, Elumalai P, Narenkumar J, Machuca LL, Murugan K, Karthikeyan OP, et al. Allium sativum (garlic extract) as a green corrosion inhibitor with biocidal properties for the control of MIC in carbon steel and stainless steel in oilfield environments. Intern Biodeter Biodeg. 2018;132:66-73.
- 38 Mansfeld F, Kendig MW, Lorenz WJ. Corrosion inhibition in neutral, aerated media. J Electrochem Soc. 1985;132(2):290-6.
- 39 Morsi MA, Elewady YA, Lorbeer P, Lorenz WJ. The inhibition of the iron corrosion in aqueous solutions containing oxygen. Mater Corros. 1980;31(2):108-14.
- 40 Mauro AC, Ribeiro BD, Garrett R, Borges RM, Silva TU, Machado SP, et al. Ziziphus joazeiro stem bark extract as a green corrosion inhibitor for mild steel in acid medium. Processes. 2021;9(8):e1323.
- 41 Trindade RS, Santos MR, Cordeiro RFB, D’Elia E. A study of the gorse aqueous extract as a green corrosion inhibitor for mild steel in HCl aqueous solution. Green Chem Lett Rev. 2017;10(4):444-54.
- 42 Souza FS, Gonçalves RS, Spinelli A. Assessment of caffeine adsorption onto mild steel surface as an eco-friendly corrosion inhibitor. J Braz Chem Soc. 2014;25(1):81-90.
- 43 Byrne C, D’Alessandro O, Deyá C. Tannins as interphase corrosion inhibitors for aluminum in near-neutral chloride solutions. Mater Corros. 2022;73(5):798-810.
- 44 Wolynec S. Técnicas eletroquímicas em corrosão. São Paulo: EDUSP; 2003. 176 p.
- 45 Antunes RA. Correlação entre ensaios acelerados e ensaios de campo em corpos-de-provas de aço carbono e aço patinavel, sem e com revestimento [dissertation]. São Paulo: Universidade de São Paulo; 2002. 240 p.
- 46 Marcolino JB. Avaliação do potencial de utilização do tanino vegetal da acácia negra como inibidor do processo de corrosão de aço ao carbono em presença de CO2 a alta pressão [thesis]. Rio Grande do Sul: Pontifícia Universidade Católica do Rio Grande do Sul; 2015. 124 p.
The raw/processed data required to reproduce these findings cannot be shared at this time as the data also forms part of an ongoing study