Effect of Austenitizing Temperature on the Retained Austenite and Carbide Fractions in SAE 52100 Steel after Quenching
Abstract
This study investigates the influence of austenitizing temperature on the retained austenite content and hardness of SAE 52100 steel. Nine samples were subjected to different austenitizing temperatures (760–920°C) followed by oil quenching. Microstructural and mechanical characterization techniques, including X-ray diffraction (XRD), ferritoscopy, electron backscatter diffraction (EBSD), transmission electron microscopy (TEM), and hardness test Rockwell were employed. The results indicate that the retained austenite content increases with higher austenitizing temperatures, and TEM and EBSD analyses revealed a reduction in carbide content at higher temperatures, along with an increase in martensite formation. Since ferritoscopy measures magnetic (martensite) versus non-magnetic (retained austenite + carbides) phases, the detected martensite fraction increased as the retained austenite decreased. Hardness measurements showed a direct correlation with austenitizing temperature, with the highest Rockwell hardness observed at 880 °C.
Keywords:
Austenitizing temperature; Retained austenite; Carbides; Hardness; SAE 52100 steel
1. Introduction
SAE 52100 steel is a hypereutectoid steel with 0.93 – 1.0%C (mass %) and other alloying elements, such as chromium, silicon, and manganese1. Due to the high hardness provided by these treatments and high carbon content, the SAE 52100 is widely used in mechanical components such blades, rings and ball bearings1-3, as well as drills, punches, and other tools.
Foster et al.4 measured the MS temperature of a 209 °C by in situ X-ray diffraction and 189 °C by dilatometry in the SAE 52100. After quenching5,6 or austempering7,8, retained austenite is observed in the microstructure, and the amount and stability of this phase play an important role on the materials performance.
SAE 52100 steels can be hardened in oil or salt and are subsequently subjected to tempering heat treatment. After these treatments, the steel's microstructure consists of a martensitic matrix with primary carbides, those that did not dissolve during austenitization, as well as retained austenite. The actual amount of carbides varies depending on casting conditions, hot working, heat treatment conditions, and other factors related to the manufacturing process. These steels are tempered just after quenching, and the final properties are directly influenced by the characteristics of the carbides and retained austenite6. Nakazama and Krauss7 showed that the quenching treatment performed with austenitizing above Acm caused the higher dissolution of carbides, a gradual coarsening of the austenitic grain size, and an increase in the amount retained austenite. They observed the increase of fracture toughness with increasing austenitizing temperature above Acm, despite the fact that fracture propagated primarily along the austenitic grain boundaries.
Among the variables that can influence the microstructure after quenching, the austenitizing temperature stands out as a key factor. This parameter influences the grain size of the austenite, which will transform into martensite, its chemical composition, stability, and retained austenite content3,4. Retained austenite directly affects the properties of steels, playing either a positive or negative role depending on the steel type and application.
Different characterization techniques can be used to quantify retained and reverse austenite in quenched and tempered steels. X-ray diffraction (XRD) is one of the most used9, being recently applied in experiments in-situ in the synchrotron line4,8. Retained austenite can also be quantified by magnetic measurements7,9, and electron backscattered scanning diffraction (EBSD) in the scanning electron microscope (SEM)10,11. Each technique has advantages and disadvantages, and comparison what is particularly interesting.
The study of carbides morphology and amount is best achieved with high resolution microscopy, as proved by other characterization works4,12. EBSD is also a powerful tool for this purpose.
This study aimed to determine the effect of austenitizing temperature on the microstructure and hardness of SAE 52100 steel. Specifically, the amount of retained austenite and carbides were quantified in specimens heat treated with different austenitization temperatures, from 760 °C to 920 °C.
2. Materials and Methods
Nine samples of SAE 52100 steel, obtained from bearing balls and with final dimensions of 30x30x5 mm, were quenched at different austenitizing temperatures, starting from 760 °C, with increments of 20 °C (760 °C, 780 °C, 800 °C, 820 °C, 840 °C, 860 °C, 880 °C, 900 °C, 920 °C), and subsequently oil quenched at 60 °C. The samples were identified as “Q-(Soaking temperature)” in this work (ex.: Q-760, austenitized at 760 °C). Table 1 shows the chemical composition of the studied steel, as determined by spark optical emission spectroscopy.
After the austenitization and oil quenching heat treatment, the microstructural analyzes of the samples austenitized at 760 °C (called Q-760) and 940 °C (Q-940) were carried out by scanning electron microscopy (SEM), transmission electron microscopy (TEM) and X-ray diffraction (XRD). For SEM A FEI Nova NanoLab 600 microscope equipped with EDAX-TSL EDS and EBSD detectors was used. Specimens for SEM and EBSD were prepared by grinding, polishing with diamond pastes 6, 3 and 1 μm, and finally polished with 0.06 μm colloidal silica solution in a MiniMet 1000 Grinder Polisher for 90 minutes at low speed and low force. TSL Collection and TSL Analysis software were used to collect and processing data respectively.
The transmission electron microscopy analyzes were performed using two instruments: a FEI Titan 80-300 CS-corrected (operating voltage of 300 kV) equipped with an X-FEG filament and monochromator, and a FEI G2 Spirit Twin, 80-120 kV (operating voltage of 120 kV) with a LaB6 (lanthanum hexaboride) filament. The samples for TEM were prepared with the FIB (Focused Ion Beam) technique in the FEI Nova 600 NoanoLab. In this method a small lamella of approximately 10 x 10 μm is extracted from the sample, with the thickness ranging from 50 to 100 μm.
The diffractometer used for XRD was the Rigaku MiniFlex II operating with Cu Kα radiation source (λ = 1.5406 Å), and each sample was tested using a scanning angle from 20° to 120°, step size of 0.05°, and a speed of 2°/min. The data were processed using the HighScore Plus Panalytical software.
Samples were analyzed with a ferritoscope Helmut Fisher DMP30 in order to evaluate the amount of ferromagnetic (martensite) and paramagnetic phases in all specimens (Q-760, Q-780, Q-800, Q-820, Q-840, Q-860, Q-880, Q-900 and Q-920).
For the Rockwell hardness test, a digital Ultrasonic Contact Impedance (UCI) durometer was used, with a preload of 98 N (10 kgf) and a load of 1471 N (150 kgf) (scale C).
3. Results
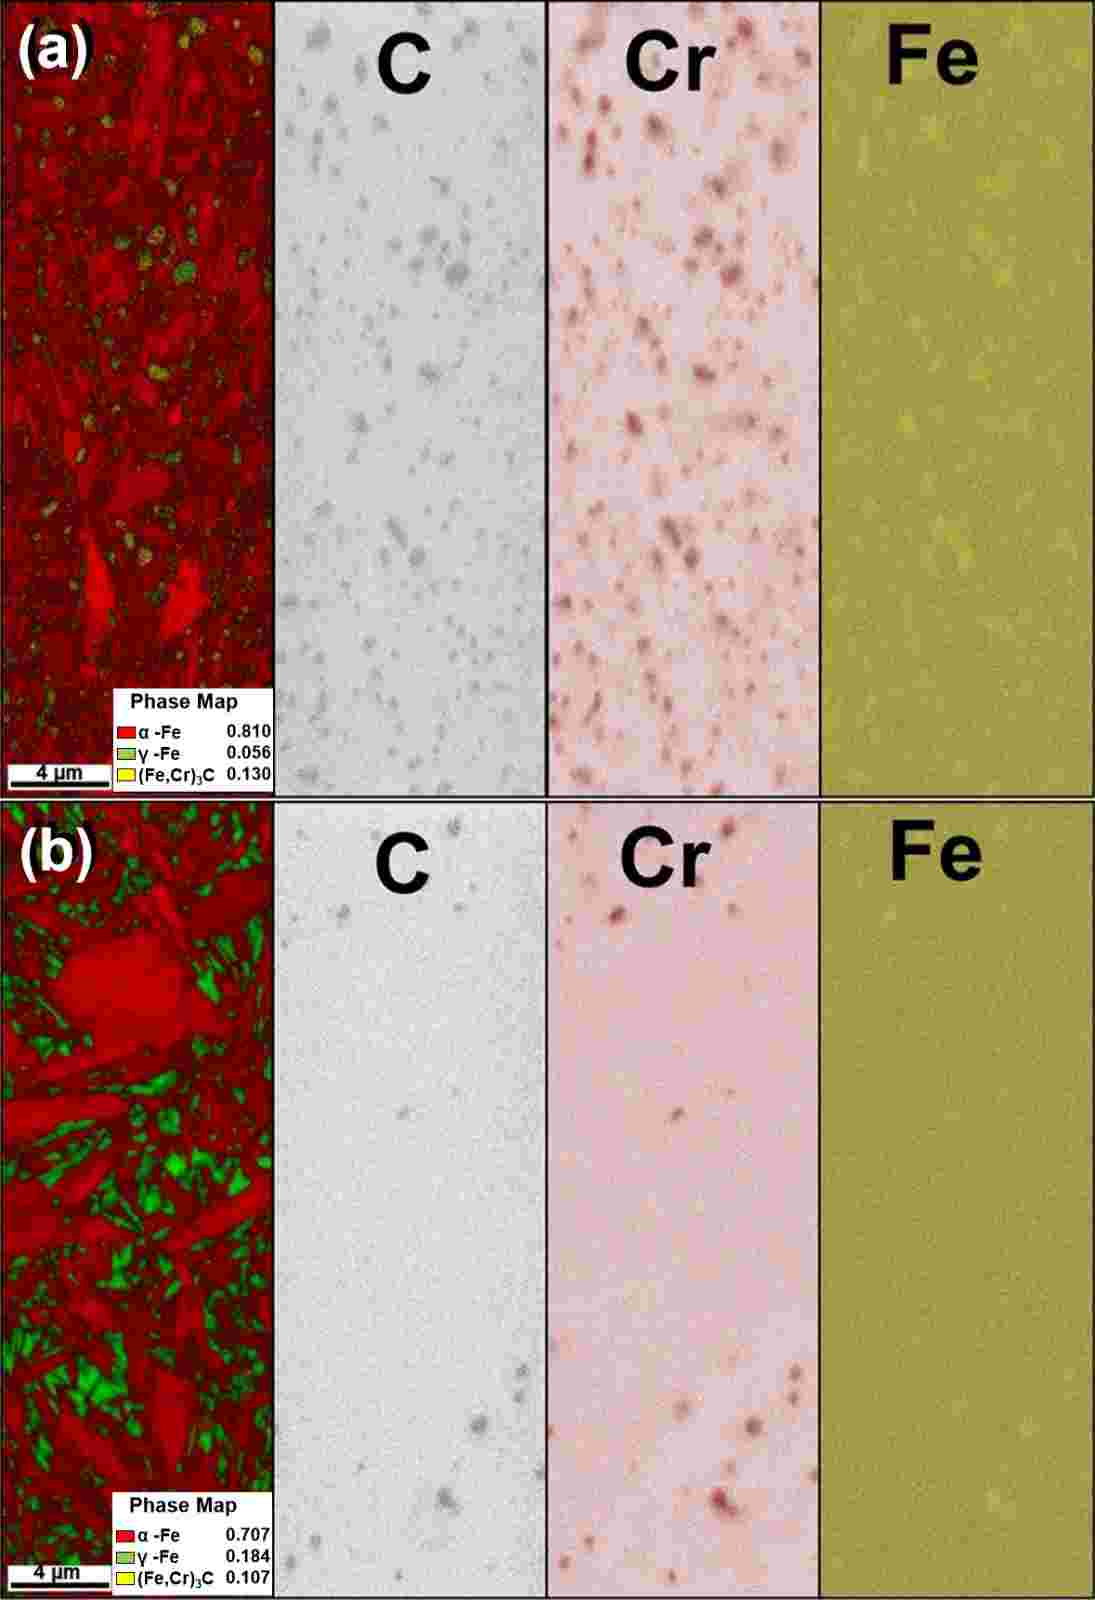
Figure 1 compares the phase map of specimen austenitized at 760oC (Q-760) (Figure 1a) with that austenitized at 920oC (Q-920) (Figure 1b). It can be clearly observed that the regions where carbon is present also contain iron and chromium, indicating that these elements are combined in the form of iron-chromium carbides. The crystallographic data of M3C carbide, with M=Fe and Cr, was successfully attributed to the EBSD software giving good matching for quantification, with only few un-identified points. The crystallographic data of ferrite (α) were attributed to quantify the martensite, due to the similarity of these two phases. Table 2 shows the phase quantification by EBSD of specimens M-760 and M-920.
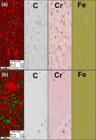
Phase map obtained by EBSD. (a) Sample quenched at 760 °C and (b) sample quenched at 920 °C.
The carbides appear in greater quantities in the samples soaked at lower temperatures and tend to decrease in the samples that were austenitized at higher temperatures. Additionally, an increase in the retained austenite content was observed as the soaking temperature increased.
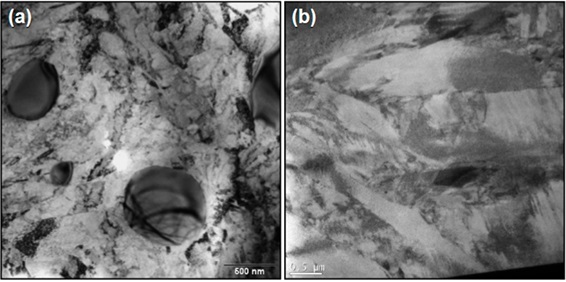
Through TEM analysis, a higher presence of carbides was also observed in the sample quenched at 760 °C compared to the sample quenched at 920 °C. In the TEM images, the sample quenched at 760 °C exhibited cementite particles with approximately 500 nm in diameter, while the sample quenched at 920 °C showed a lath-shaped microstructure typical of martensite, as observed in Figure 2.
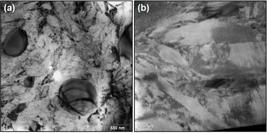
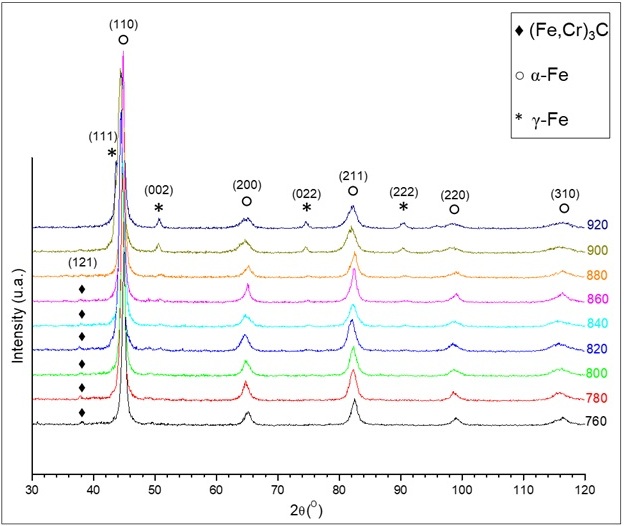
Figure 3 shows the X-ray diffractograms of all specimens. Qualitatively, is possible to note the increase of the (Fe,Cr)3C peak (121) with the decrease of austenitizing temperature, but it was not possible to quantify this carbide by XRD. On the other hand, it is obvious the increase of austenite peaks (002), (022) and (222) with the increase of soaking temperature. The austenite quantification by XRD was performed and the results are presented in Table 3. The results for Q-760 and Q-920 samples are in good agreement with the EBSD results (Table 2).
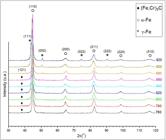
Table 3 also shows the amounts of paramagnetic phases estimated with the ferritoscope. This is a portable equipment which measures non-destructively the ferromagnetic phases based on the initial magnetic permeability. The results presented here are rather semi-quantitative, since there were no standard samples of 52100 to calibrate the ferritoscope. The paramagnetic phases in the SAE 52100 steel are the austenite and (Fe,Cr)3C carbides. Thus, the sum of volumetric percentage of these phases (%γ + %(Fe,Cr)3C) is estimated by difference.
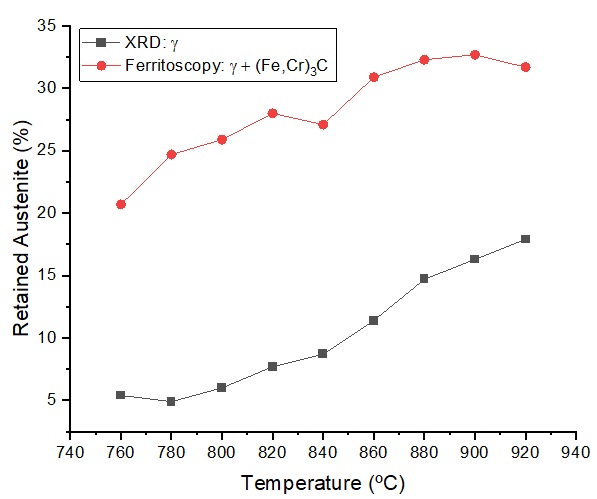
Figure 4 shows XRD and Ferritoscope results as function of the austenitizing temperature. As explained, the points for the ferritoscope correspond to the sum of austenite (γ) and (Fe,Cr)3C carbides. The analysis of the ferritoscope data shows that, although the (Cr,C)3C decreases with the increase of austenitizing temperature, the increase of retained austenite with treatment temperature is more significative.
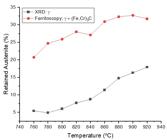
Comparative graph of the retained austenite fraction (%) as a function of temperature using X-ray diffraction and ferritoscopy techniques.
The use of the ferritoscope in phase quantification of ferromagnetic steels, such as the SAE 52100 steel in question, is subject to certain intrinsic limitations related to the magnetic response of the different phases present in the material. Martensite, although ferromagnetic, has a lower magnetization compared to ferrite, which is the calibration standard for the equipment. Consequently, when measuring a sample containing martensite, even if entirely composed of it, the magnetic signal recorded by the ferritoscope will be lower than expected for a sample consisting exclusively of ferrite13. Additionally, in SAE 52100, the presence of carbides, which are essentially non-ferromagnetic, further contributes to the reduction of the measured magnetic fraction. Therefore, the combination of martensite’s lower magnetization with the presence of carbides results in an overestimation of the non-magnetic phase fraction by the ferritoscope. This characteristic should be taken into account when interpreting the results obtained using this technique, making it crucial to correlate with other methodologies, such XRD and EBSD, for a more accurate quantification of the present phases.
The lower magnetization of martensite, combined with the presence of non-ferromagnetic carbides, results in a reduction of the ferromagnetic fraction measured by the ferritoscope. This influence can be observed in Figure 4, where the curves exhibit similar angular coefficients but are shifted relative to each other due to the lower magnetic response of the analyzed material. The similarity in slope suggests that the variation trend is consistent between both measurements, reinforcing the idea that the separation between the curves is due to the intrinsic characteristics of the material. As previously discussed, the lower magnetization of martensite compared to ferrite, along with the non-ferromagnetic contribution of carbides, shifts the measured values toward a lower ferromagnetic fraction.
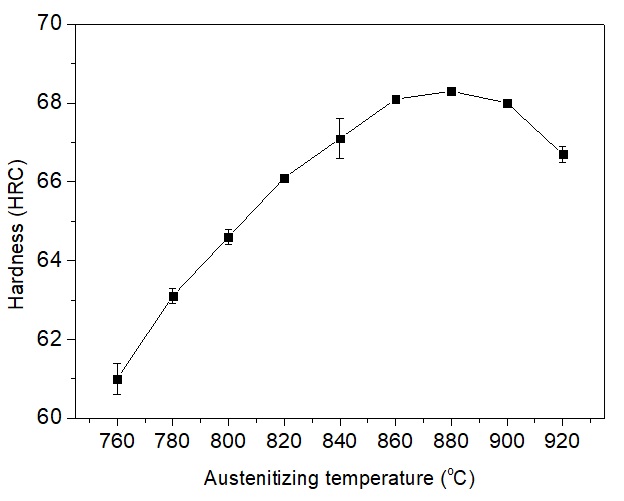
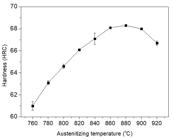
Figure 5 shows the hardness variation with the austenitizing temperature, and a typical behavior is observed. The hardness increases from 760 °C to 880 °C due to the dissolution of carbides and the enrichment of C in the martensite. Foster et al.8 proved that the dissolution of carbides is associated to the increase of austenite lattice parameter due to the enrichment of C in this phase. The hardness decrease above 880 °C can be attributed to the increase of retained austenite in the microstructure.
4. Conclusions
This study evaluated the influence of austenitizing temperature on the hardness and retained austenite content in SAE 52100 steel, and it was possible to conclude that:
-
The retained austenite content increases with the rise in austenitizing temperature, as measured by XRD and corroborated by EBSD and TEM analysis in the comparison of specimens austenitized at 760 °C (Q-760) and at 900 °C (Q-900).
-
Ferritoscopy is a non-destructive way to obtain a semi-quantitative analysis of the paramagnetic phases in the SAE 52100 steel. The sum of paramagnetic phases (γ and (Fe,Cr)3C) are estimated, and found to increase with the austenitizing temperature till 900 °C.
-
The hardness of the samples increases from 760 °C to 880 °C with the austenitizing temperature, reaching a maximum value of 68 HRC at 880 °C due to carbide dissolution and carbon enrichment of the matrix. After this soaking temperature, the hardness decreases as consequence of retained austenite increase.
5. Acknowledgements
Authors acknowledge to National Council for Scientific and Technological Development (CNPq) (308244/2022-2), Fundação Coordenação de Aperfeiçoamento de Pessoal de Nível Superior (CAPES) and to Fundação de Amparo à Pesquisa do Estado do Rio de Janeiro (FAPERJ) for the support.
-
Data Availability
The datasets generated and analyzed in this study are available from the corresponding author upon request.
6. References
-
1 Singh G, Singh PK. Improving the energy efficiency and process scrap in grooved hot rolling of SAE 52100 steel billets. CIRO J Manuf Sci Technol. 2023;41:55-68. http://doi.org/10.1016/j.cirpj.2022.11.014
» http://doi.org/10.1016/j.cirpj.2022.11.014 -
2 Pan Y, Wang B, Barber GC. Study of bainitic transformation kinetics in SAE 52100 steel. J Mater Res Technol. 2019;8(5):4569-76. http://doi.org/10.1016/j.jmrt.2019.08.001
» http://doi.org/10.1016/j.jmrt.2019.08.001 -
3 Nakazawa K, Krauss G. Microstructure and fracture of 52100 steel. Metall Trans, A, Phys Metall Mater Sci. 1978;9(5):681-9. http://doi.org/10.1007/BF02659925
» http://doi.org/10.1007/BF02659925 -
4 Foster D, Paladugu M, Hughes J, Kapousidou M, Islam U, Stark A, et al. In-situ synchrotron X-ray diffraction during quenching and tempering of SAE 52100 steel. Mater Today Commun. 2021;29:102930. http://doi.org/10.1016/j.mtcomm.2021.102930
» http://doi.org/10.1016/j.mtcomm.2021.102930 -
5 Kokkirala S, Osman K, Holmberg J, Kimming S, Iwasaki H, Klement U, et al. The role of retained austenite on the formation of the nanostructured hard turned induced white layer in AISI 52100 bearing steel. Procedia CIRP. 2024;123:292-7. http://doi.org/10.1016/j.procir.2024.05.052
» http://doi.org/10.1016/j.procir.2024.05.052 -
6 Yaso M, Hayashi S, Morito S, Ohba T, Kubota K, Murakami KK. Characteristics of retained austenite in quenched high C-high Cr alloy steels. Mater Trans. 2009;50(2):275-9. http://doi.org/10.2320/matertrans.MRA2008161
» http://doi.org/10.2320/matertrans.MRA2008161 -
7 Luzginova N, Zhao L, Sietsma J. Evolution and thermal stability of retained austenite in SAE 52100 bainitic steel. Mater Sci Eng A. 2007;448(1-2):104-10. http://doi.org/10.1016/j.msea.2006.10.014
» http://doi.org/10.1016/j.msea.2006.10.014 -
8 Foster D, Paladugu M, Hughes J, Kapousidou M, Barcellini C, Daisenberger D, et al. Comparative micromechanics assessment of high-carbon martensite/bainite bearing steel microstructures using in-situ synchrotron X-ray diffraction. Materialia. 2020;14:100948. http://doi.org/10.1016/j.mtla.2020.100948
» http://doi.org/10.1016/j.mtla.2020.100948 -
9 Tavares SSM, Mello SR, Gomes AM, Montenegro J No, Silva MR, Pardal JM. X-ray diffraction and magnetic charaterization of the retained austenite in a chromium alloyed high carbon steel. J Mater Sci. 2006;41(15):4732-6. http://doi.org/10.1007/s10853-006-0025-8
» http://doi.org/10.1007/s10853-006-0025-8 -
10 Chen C-Y, Chiang I, Kang Y-C. The effect of retained austenite on austenite reversion behavior and corresponding mechanical properties of Ti–Mo precipitation hardening stainless steels. J Mater Res Technol. 2025;35:1476-93. http://doi.org/10.1016/j.jmrt.2025.01.131
» http://doi.org/10.1016/j.jmrt.2025.01.131 - 11 Dong TWH, Sheng J-J, Deng Y-H, Wang Y-X. Regulation of nanosized retained-austenite morphology making low alloy ultrahigh strength steel tough. J Mater Res Technol. 2005;35:3563-72.
-
12 Spindola MO, Buono VTL. Effect of intercritical annealing with high cooling rate associated with cold deformation and subcritical annealing on microstructure and mechanical properties of SAE 52100. J Mater Res Technol. 2020;9(4):9136-41. http://doi.org/10.1016/j.jmrt.2020.05.106
» http://doi.org/10.1016/j.jmrt.2020.05.106 -
13 Talonen J, Aspegren P, Hänninen H. Comparison of different methods for measuring strain induced α-martensite content in austenitic steels. Mater Sci Technol. 2004;20(12):1506-12. http://doi.org/10.1179/026708304X4367
» http://doi.org/10.1179/026708304X4367
Edited by
-
Associate Editor:
Igor Vasconcelos.
-
Editor-in-Chief:
Luiz Antonio Pessan.
The datasets generated and analyzed in this study are available from the corresponding author upon request.