Abstract
Paper aims
This research article addresses an innovative solution to face one of the main problems in the footwear industry, namely the high order non-fulfillment rate.
Originality
This research offers companies in the footwear industry the possibility of implementing Andon through a structured and planned process that allows expediting problem solving. The advantage of this system is the ability to signal the status of workstations through rapid visual identification. Moreover, in this way social distancing is also secured, in line with World Health Organization guidelines to prevent the spread of COVID-19.
Research method
The article presents four phases through which the case study was addressed. Planning (determination of objectives), Restructuring of the Operations Area, Improvement of the Production Line and Continuous Improvement.
Main findings
An Arena simulation system was used to establish a new scenario where the defective product indicator decreases by 3.13% and productivity improves by about 38%. In turn, the resulting increase in the number of orders enhances company sales and profits, as well as the ability to meet the customer demand in a timely manner.
Implications for theory and practice
The case study suggests that the main causes of this issue (high order non-fulfillment rate) are the increasing rate of defective goods, delays in the production process, and excessive time consumption in the movement of staff and materials. This research serves as the basis for future lines of research, as well as for other organizations with similar characteristics to implement the proposal.
Keywords
Production; Layout; Andon; Kaizen; 5S
1. Introduction
In current scenario, manufacturing is central to job creation and growth in Latin America. However, manufacturing fell 1.68% in 2019 and is not expected to recover in 2020 according to the National Statistics Institute. Like in most manufacturing activities, the concentration of workforce in Asia affected production and employment in the footwear and leather industry.
According to the Alfa Forum, there are three common elements across the region such as the impact of the gradual increase in Asian production, the large number of informal companies operating over stationary production cycles and the closure of companies and workshops due to commercial failure and illiquidity. It should be noted that Peru is the fourth largest footwear producer in South America (Peru Retail, 2017Retail, P. (2017). Retrieved in 2017, June 12, from https://www.peru-retail.com/peru-cuarto-mayor-productor- calzado-america-del-sur/
https://www.peru-retail.com/peru-cuarto-...
), with more than 50 million pairs per year, only behind Brazil, Argentina and Colombia. Small businesses through good management and staff commitment can achieve positive results based on their implementation, but this will depend so much on the commitment (Sarria Yépez et al., 2017Sarria Yépez, M. P., Fonseca Villamarín, G. A., & Bocanegra-Herrera, C. C. (2017). Modelo metodológico de implementación de lean manufacturing. Revista EAN, 83(83), 51-71. http://dx.doi.org/10.21158/01208160.n83.2017.1825.
http://dx.doi.org/10.21158/01208160.n83....
).
Footwear production in Peru registered a drop since April 2018. The shoe industry contracted by 29.0% in that year, mainly due to low productivity. In response, the Ministry of Production, through the National Innovation Program for Competitiveness and Productivity (Programa Nacional de Innovación para la Competitividad y Productividad), has promoted the creation of the Micro and Small and Medium Sized Enterprises (SMEs) Fund (Fondo MIPYME), which introduces tax measures and reduces red tape to encourage investment, thereby strengthening the development of micro and SMEs by improving conditions for accessing financing and boosting productivity (Innovate Peru, 2020Innovate Peru. (2020). Retrieved in 2020, August 25, from https://www.innovateperu.gob.pe/quienes-somos/nuestros- fondos/mipyme
https://www.innovateperu.gob.pe/quienes-...
). Likewise, it is important to mention the Center for Technological Innovation in the Leather and Footwear Industries (CITEccal), which aims at promoting industrial development and technological innovation across the production chain of the leather, footwear, and related industries, as well as providing companies in this production chain with technological services to foster innovation and enhance competitiveness, through its 5S and Kaizen Productivity Improvement Program (5S & Kaizen PIP) (Perú, 2018Perú, CITEccal. (2018). Retrieved in 2018, March 27, from http://citeccal.itp.gob.pe/citeccal-lima-implemento-programa-de- 5s-y-kaizen-en-empresa-de-calzado/
http://citeccal.itp.gob.pe/citeccal-lima...
). As a success story, a footwear company in the lower- middle income Lima district of Villa Salvador successfully implemented the the 5S & Kaizen PIP, resulting in shorter production times, lower risks, and higher efficiency in production processes and warehouse control. Additionally, the company implemented improvements in the following activities within the production plant: classification (machines, equipment, tools, and materials), plant distribution, labeling of work areas, signaling of security corridors and redesign of certain areas of the production plant.
The motivation of this research is to address the lackluster outlook for Peru’s footwear industry, which has declined since April 2018 mainly due to low productivity, insufficient management capacities and limited use of modern technologies. The company under study in this case was no exception to the point that during our visits a series of unproductive times were made during the visits, in addition to the fact that during the calculation of productivity such as cycle times per station were outside the middle ranges for this type of activity. Poorly designed peruvian SMEs workspaces lead to increased transfer time from one workstation to another. This results in more production time that does not add value. Therefore, this research article proposes Systematic Layout Planning (SLP) method as the most efficient for SMEs. Specifically, this research proposes to develop a system based on lean manufacturing tools and the systematic planning of plant distribution to increase the number of orders handled by footwear companies. The classification of value-added jobs and those that do not have added value, through the use of a value stream mapping, where the indicators make the processes measurable for future evaluation and comparison (Nasution et al., 2018Nasution, A. A., Siregar, I., Anizar, Nasution, T. H., Syahputri, K., & Tarigan, I. R. (2018). Lean manufacturing applications in the manufacturing industry. MATEC Web of Conferences, 220, 02005. http://dx.doi.org/10.1051/matecconf/201822002005.
http://dx.doi.org/10.1051/matecconf/2018...
).
It is important that manufacturing companies in the world begin to grow gradually with the support of methodologies that allow them to identify, know and be able to adapt to the changes that are exposed in the market.
For this reason, one of the most used techniques in companies in this area is Lean Manufacturing, Lean supply or engineering techniques that reflects positive changes that depend clearly on the correct use as implementation.
In the world there are different manufacturing companies classified between small, medium to large, which have implemented different lean manufacturing techniques with beneficial results, as shown by the different studies reviewed in this article as in any other related to this subject. they find research projects where they carry out from a simulation of results to a real implementation of the technique where the great attachment to this type of techniques is evident. (Aguilar, 2016Aguilar, M. (2016). Estrategias de productividad para una empresa basadas en manufactura esbelta (Tesis de maestría). Instituto Politécnico Nacional, Ciudad de México.)
In this way, companies will create competitive advantages to meet their order forms on time. From this point, the article continues with a state-of-the-art review, a validation of its findings and contributions, the conclusions and the references that support this research work.
2. Literature review
To start the analysis on this case study, we resorted to different sources that allowed us to have a support and basis to be able to know how to start, propose and know the existing tools that are available to solve and / or mitigate the problems that are identified as the generation of improvement proposals that last over time.
Manufacturing companies usually play a central role in growth, as they provide a major push for expansion in other economic activities. At the same time, they face external challenges, as well as problems in their internal processes, and therefore it is crucial to identify continuous improvement techniques for ensuring sustainable development over time (Randhawa & Ahuja, 2017aRandhawa, J. S., & Ahuja, I. S. (2017a). 5S - a quality improvement tool for sustainable performance: literature review and directions. International Journal of Quality & Reliability Management, 34(3), 334-361. http://dx.doi.org/10.1108/IJQRM-03-2015-0045.
http://dx.doi.org/10.1108/IJQRM-03-2015-...
). Seeking sustainable solutions has a considerable organizational impact on companies, in turn enabling them to obtain further monetary benefits
Lean manufacturing techniques have been particularly successful towards this end among SMEs. These techniques are based on 5S implementation, i.e., applying five principles promoting new labor practices to eliminate actions that hamper sustainable development (Randhawa & Ahuja, 2017bRandhawa, J. S., & Ahuja, I. S. (2017b). Evaluating impact of 5S implementation on business performance. International Journal of Productivity and Performance Management, 66(7), 948-978. http://dx.doi.org/10.1108/IJPPM-08-2016-0154.
http://dx.doi.org/10.1108/IJPPM-08-2016-...
). Along these lines, lean manufacturing techniques create sustainable development across the organization; i.e., at the process implementation, decision making, and communications levels (Abdul-Rashid et al., 2017Abdul-Rashid, S. H., Sakundarini, N., Raja Ghazilla, R. A., & Thurasamy, R. (2017). The impact of sustainable manufacturing practices on sustainability performance: empirical evidence from Malaysia. International Journal of Operations & Production Management, 37(2), 182-204. http://dx.doi.org/10.1108/IJOPM-04-2015-0223.
http://dx.doi.org/10.1108/IJOPM-04-2015-...
).
Moreover, SLP (Systematic Layout Planning) can be instrumental in addressing other problems facing SMEs, such as poor workplace layout and managerial issues. SLP is based on correctly managing the distribution of operations, such as the transit of materials, by reducing staff time and boosting productivity (Jiamruangjarus et al., 2016Jiamruangjarus, P., Naenna, T., & Zhou, Z. (2016). An integrated multi-criteria decision making methodology for conveyor system selection. Cogent Engineering, 3, 1158515. http://dx.doi.org/10.1080/23311916.2016.1158515.
http://dx.doi.org/10.1080/23311916.2016....
).
Two core ideas that emerge from the literature are: (i) good practices call for staff involvement at all levels in the company, as human capital lies at the heart of successful implementation; and (ii) application of these techniques does not yield immediate results, but rather aims at achieving excellence and standardization over time.
3. Problem identification
The study focused on a small Peruvian company dedicated to footwear production, where the main problem identified in the development of its activities was order delivery, i.e., orders were not adequately fulfilled over a three-years period.
For the identification of this problem, the first step was the collection of sales information. Figure 1 shows a trend in the number of orders sold over the last few years, where it tends to decrease, the last year data has been taken for analysis.

Regarding the year 2019, a month-by-month analysis was carried out to determine the status of the order fulfilment rate.
Figure 2 shows total orders, unfulfilled orders and actual sales in 2019.

Production orders differ from actual sales, as the estimated production batches are not fulfilled in their entirety, which causes many orders to remain unfulfilled in a given month.
The performance of the non-fulfilment rate for these orders is decomposed for recent years. Table 1 indicates the number of orders not attended, which decrease over recent years.
The Ishikawa diagram (Figure 3) shows different scenarios that may be the cause of the problem.

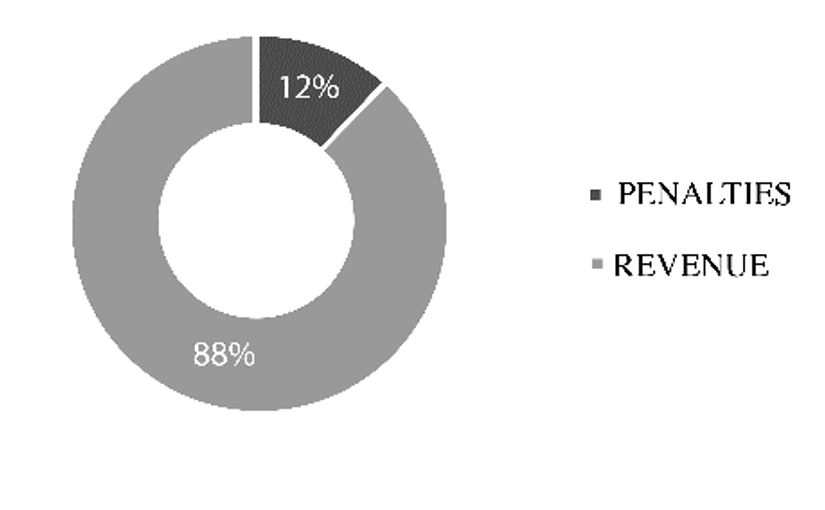
Moreover, the company bears a 25% penalty on the selling price of unfulfilled orders. This charge directly affects the company's income, with an annual impact of 12% estimated for last year as shown in Figure 4.

This research will focus on proposing a design aimed at reducing this financial impact by solving the company’s organizational problems.
The Key Performance Indicator (KPI) is used in consideration to the fulfilment of orders in a requested period. The Equation 1 shows the status obtained with respect to last year's sales.
At later stages, the KPI will serve to compare the current situation with the proposal, in order to measure the impact of this research.
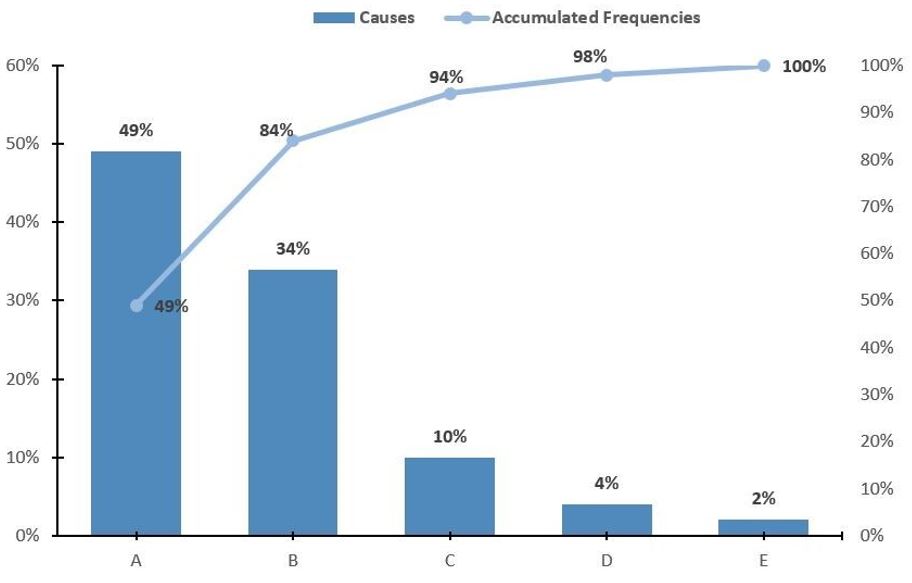
A Pareto chart is laid out to identify the most likely problem sources. In Figure 5, the Pareto graph shows us the possible causes obtained as:

-
A: Cause 1: Increase in defective products.
-
B: Cause 2: Excessive time in movement of people and material.
-
C: Cause 3: Delays in the shoe production process.
-
D: Cause 4: Lack of inventory control.
-
E: Cause 5: Problems with the supply of materials.
These causes are measured by an economic weighting to know which are the most influential regarding the problem and the company, resulting in 80% of the problems being concentrated in causes A, B and C.
After identifying the main causes that influence the problem described, it was proposed to know the relationship that exists between each of them and in turn how influential they are among themselves, for this reason we will use the Vester matrix as the Zopp diagram.
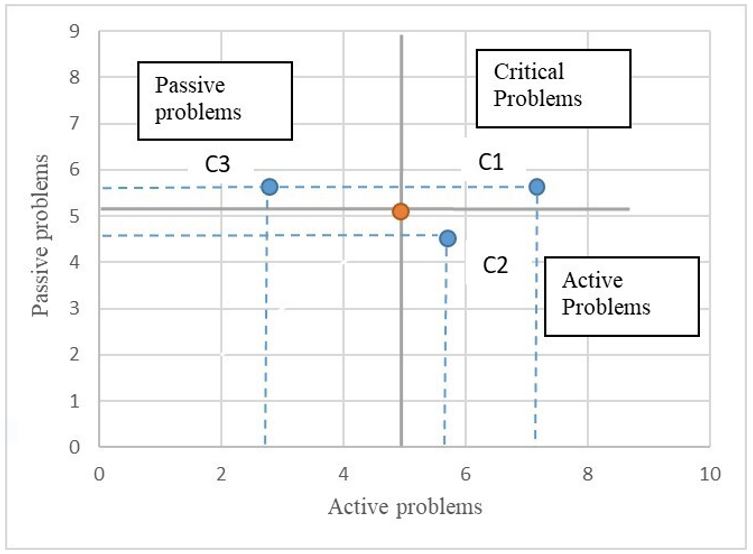
In the same way, the Zopp diagram based on the results of the previous diagram allows us to make a division by passive, active and critical problems that allow us to make a decision or reaffirm, failing that, the steps to follow to solve the case study proposed.
For the realization of this matrix, a valuation scale of:
-
Weak cause
-
Medium cause
-
Strong cause
-
Very strong cause
Based on this, the main causes were defined as C1, C2 and C3. Table 2 shows the Vester matrix developed with a chosen weight with respect to the information obtained from each of the causes presented.
The Zoop focus diagram was developed. In Figure 6, the coordinates obtained with the weighting of the Vester diagram were placed and it was obtained that the critical problem is seized by the deficiency in the production processes, the active problem as the deficient productive capacity and the passive problem as the waste of production time.

Once the main causes have been defined, the formal proposal is carried out to reduce or mitigate the impact of this problem.
4. Methodology
4.1. Methodology of research
The problem of Increased orders not attended is mainly due to 2 causes:
Increase in defective products and Excessive time in movement of people and material. Cause 1 is defined as the pairs of shoes that do not allow to cover the estimated demands in the required days, which generates several unmet orders. In relation to cause 2, it was defined that there is a deficient allocation of areas within the operations yard, this generates several unnecessary movements that causes lost time that could be used to produce more shoe products.
4.1.1. Cause 1: increase in defective products
To be able to cover this cause, it is important to know if our process is out of control or not, for this reason we choose to carry out a general demonstration and rely on statistics with a control graph, which is evidenced in Figure 7 with Laney's P' Defect Table. The graph below shows us that the process is not out of control since there is a point that exceeds three standard deviations from the center line. (Pérez Bernabeu& Sellés& Gisbert, 2012Gisbert Soler, V., Pérez Bernabeu, E., & Sellés Cantó, M. A. (2012).Los gráficos de control por atributos(3rd ed.). Spain: 3C Empresa.)

Based on this, the defective products indicator was calculated to know the current state of the company.
4.1.2. Cause 2: excessive time in movement of people and material
This cause was defined in the part of Contribution, phase2. This, at a more detailed level, is complemented by the Bimanual diagram. Next, a bimanual diagram is show of the critical cutting area.
4.1.2.1. Bimanual diagram – cutting area
The Bimanual diagram allows us to know all the activities carried out by an operator in one of the most critical areas of the company's operations flow, which is observed and detailed in Figure 8 (Andrade et al., 2019Andrade, Y., Cardenas, L., Viacava, G., Raymundo, C., & Dominguez, F. (2019). Lean manufacturing model for the reduction of production times and reduction of the returns of defective items in textile industry. In G. Di Bucchianico (Ed.), Advances in design for inclusion. AHFE 2019 (Advances in Intelligent Systems and Computing, Vol. 954). Cham: Springer. http://dx.doi.org/10.1007/978-3-030-20444-0_39.
http://dx.doi.org/10.1007/978-3-030-2044...
).

An excessive number of unproductive movements is evident, especially on the part of the left hand.
The following table 3 shows the percentages of non-productivity for each hand in carrying out movements for the cutting station.
4.2. Lean tools and methods
4.2.1. Lean tools
The implementation of Lean manufacturing has a significant impact on all levels of the organization, to the point that in a production company it is essential not to consider the relationship that the implementation of this technique finds with the organization's supply chain.
Therefore, it is important to consider the different variables that influence this analysis, such as suppliers, clients, collaborators, among others (Vanichchinchai, 2020Vanichchinchai, A. (2020). Exploring organizational contexts on lean manufacturing and supply chain relationship. Journal of Manufacturing Technology Management, 31(2), 236-259. http://dx.doi.org/10.1108/JMTM-01-2019-0017.
http://dx.doi.org/10.1108/JMTM-01-2019-0...
).
Bhamu and Sangwan concluded that the goal of Lean manufacturing is to be highly responsive to customer demand by reducing waste. Lean manufacturing aims at producing products and services at the lowest cost and as fast as required by the customer (Bhamu & Singh Sangwan, 2014Bhamu, J., & Singh Sangwan, K. (2014). Lean manufacturing: literature review and research issues. International Journal of Operations & Production Management, 34(7), 876-940. http://dx.doi.org/10.1108/IJOPM-08-2012-0315.
http://dx.doi.org/10.1108/IJOPM-08-2012-...
)
Sayid and Nurh pointed out that, the 5S method constitutes one of the most effective tools for continuous improvement, since it is the basis for reducing activities that do not add value. In a production process line, a good change or improvement can be achieved in many ways, such as reducing inventory, production time, defective parts, etc. The implementation of the 5S methodology consists of teamwork, training work, reaching multiple skills and a learning environment (Sayid Mia et al., 2017aSayid Mia, M. A., Nur-E-Alam, M., & Uddin, M. K. (2017a). Court shoe production line: improvement of process cycle efficiency by using lean tools. Leather and Footwear Journal, 17(3), 135-146. http://dx.doi.org/10.24264/lfj.17.3.3.
http://dx.doi.org/10.24264/lfj.17.3.3...
).
The motivation is mainly given that today achieving high productivity is a very important factor for the production field. Some of the changes required by lean manufacturing can be detrimental if not implemented correctly and some aspects of it are not appropriate for all companies.
Regarding the results, (Sayid Mia et al., 2017bSayid Mia, M. A., Nur-E-Alam, M., Rahman, M. L., & Uddin, M. K. (2017b). Footwear industry in bangladesh: reduction of lead time by using lean tools. Journal of Environmental Science, Computer Science and Engineering & Technology, 6(3), 251-259. http://dx.doi.org/10.24214/jecet.C.6.3.25159.
http://dx.doi.org/10.24214/jecet.C.6.3.2...
) indicates that, the operating time of the sewing machine increases to 96%, while the efficiency of the process cycle increased from 8.32% to 19.46%. On the other hand, in a textile company in Peru, an implementation carried out in 2019 by Andrade et al. (2019)Andrade, Y., Cardenas, L., Viacava, G., Raymundo, C., & Dominguez, F. (2019). Lean manufacturing model for the reduction of production times and reduction of the returns of defective items in textile industry. In G. Di Bucchianico (Ed.), Advances in design for inclusion. AHFE 2019 (Advances in Intelligent Systems and Computing, Vol. 954). Cham: Springer. http://dx.doi.org/10.1007/978-3-030-20444-0_39.
http://dx.doi.org/10.1007/978-3-030-2044...
of the 5S and Kanban techniques meant an increase in the company's income by 84%. Likewise, pole production increased by 41% and the number of defective products and undelivered orders decreased by 25% and 26%, respectively.
Andon systems allow you to visualize the status of different processes based on selected alarms related to a particular color and, in some way, create awareness based on visual information to improve the efficiency of the industry. For example, yellow is used in production failures; quality in blue; materials in green and maintenance in red. The motivation for the investigations arises because there are currently few industries and companies that use Andon systems and, furthermore, technical proposals can support lean manufacturing activities in any company because these Andon-based proposals constitute a suitable industrial tool.
The experimental results carried out by Reyes et al. (2019)Reyes, J., Morales, L., Aldas, D., Reyes, R., & Toasa, R. (2019). Real time automatic andon alerts for android platforms applied in footwear manufacturing. In Proceedings of the First International Conference, ICCCE 2018. Cham: Springer. http://dx.doi.org/10.1007/978-3-030-12018-4_4.
http://dx.doi.org/10.1007/978-3-030-1201...
showed that, the module is adaptable in shoe production processes, delivering timely notifications and projecting 95% efficiency in the production process after 38 successful experiments. López and Molina presented a customized industrial system to make requests for support on manufacturing lines. Implementation resulted in the average time to attend and complete a request being reduced from 18.9 minutes to 10.4 minutes (Lopez-Leyva et al., 2020Lopez-Leyva, J. A., Molina-Inzunza, A., Navarro-Paz, P., Verduzco-Unzón, S., & Yáñez, M. (2020). Customized smart andon system to improve the efficiency of industrial departments. Journal of Scientific and Industrial Research, 79(1), 35-37.). Singh & Singh (2018)Singh, J., & Singh, H. (2018). Enigma of KAIZEN approach in manufacturing industry of Northern India: a case study. International Journal of Quality & Reliability Management, 35(1), 187-207. http://dx.doi.org/10.1108/IJQRM-12-2016-0220.
http://dx.doi.org/10.1108/IJQRM-12-2016-...
revealed that, after implementation of lean tools the production efficiency improved from 93% to 97%.
The implementation of lean manufacturing according to its success in its implementation generates positive and lasting results in organizations, however it is important to take into account the main barriers to which it is exposed during its defeat.
One of the most outstanding is the human value, since they will be part of the development and success of these techniques, therefore, it is extremely important to form intercultural relationships that familiarize people with these methodologies.
In addition, the intervention of the state providing the respective programs for the training and implementation of these technologies is very helpful for small companies that choose to put these methodologies into practice that can serve as future study cases for different students from universities or universities. organizations that help to improve or propose measures that benefit the organization (Abu et al., 2021Abu, F., Gholami, H., Saman, M. Z. M., Zakuan, N., Streimikiene, D., & Kyriakopoulos, G. L. (2021). An SEM approach for the barrier analysis in lean implementation in manufacturing industries. Sustainability, 13(4), 1-18. http://dx.doi.org/10.3390/su13041978.
http://dx.doi.org/10.3390/su13041978...
)
The success of lean manufacturing techniques lies in the management and leadership that can be applied within the organization, since it will allow to have control and monitoring of all the activities that influence within the organization, such as identifying the problems that may arise during its development, therefore it is here where it would be possible to identify and propose corrective measures that contribute, solve or mitigate it (Yuik et al., 2020Yuik, C. J., Perumal, P. A., & Feng, C. J. (2020). Exploring critical success factors for the implementation of lean manufacturing in machinery and equipment SMEs. Engineering Management in Production and Services, 12(4), 77-91. http://dx.doi.org/10.2478/emj-2020-0029.
http://dx.doi.org/10.2478/emj-2020-0029...
).
It is important to emphasize that the implementation of lean manufacturing techniques in SMEs must be developed in a sustainable way in the sense that they have to have a notion within their processes regarding the care and treatment of their waste, since the greatest challenges for the future will be linked to the environmental impact produced by manufacturing companies.
For this reason, it is important to consider within the new proposals training and measures related to the reuse or correct use of the disposal of waste generated by production companies, therefore this is one of the most important challenges that must be instilled in all companies to achieve a sustainable circular economy over time (Tanco et al., 2021Tanco, F., Kalemkerian, F., & Santos, J. (2021). Main challenges involved in the adoption of sustainable manufacturing in Uruguayan small and medium sized companies. Journal of Cleaner Production, 293, 126139. http://dx.doi.org/10.1016/j.jclepro.2021.126139.
http://dx.doi.org/10.1016/j.jclepro.2021...
)
4.2.1.1. Systematic layout planning
The systematic layout planning (SLP) is a procedural layout design approach. The process involved in performing SLP is relatively straightforward; however, it is a proven tool in providing layout design guidelines in practice in the past few decades (Yang et al., 2000Yang, T., Su, C.-T., & Hsu, Y.-R. (2000). Systematic layout planning: A study on semiconductor wafer fabrication facilities. International Journal of Operations & Production Management, 20(11), 1359-1371. http://dx.doi.org/10.1108/01443570010348299.
http://dx.doi.org/10.1108/01443570010348...
).
Ali Naqvi et al. (2016)Ali Naqvi, S. A., Fahad, M., Atir, M., Zubair, M., & Shehzad, M. M. (2016). Productivity improvement of a manufacturing facility using systematic layout planning. Cogent Engineering, 3(1), 1207296. http://dx.doi.org/10.1080/23311916.2016.1207296.
http://dx.doi.org/10.1080/23311916.2016....
pointed out that, poorly designed company work areas generate a longer transfer time from one workstation to another. To apply the steps of SLP, Klodawski indicated that, it is necessary to identify the company's management strategy, the restrictions of the operations yard, the type of materials, time and travel distances within the area because the space used represents a cost to the company (Kłodawski et al., 2017Kłodawski, M., Jacyna, M., Lewczuk, K., & Wasiak, M. (2017). The issues of selection warehouse process strategies. Procedia Engineering, 187, 451-457. http://dx.doi.org/10.1016/j.proeng.2017.04.399.
http://dx.doi.org/10.1016/j.proeng.2017....
). On the other hand, Goyal & Verma (2019)Goyal, G., & Verma, D. S. (2019). Optimization of plant layout in manufacturing industry. International Journal of Recent Technology and Engineering, 8(2), 3115-3118. http://dx.doi.org/10.35940/ijrte.B2679.078219.
http://dx.doi.org/10.35940/ijrte.B2679.0...
pointed out that for the optimization of the plant design, 2 analyses must be considered. First, the activity analysis, in which a design is planned, must have thoroughly studied all the activities of the plant. Second, the situational analysis, in which the movement of activities is the key component to design a new plant design for optimization.
Based on the data collected and the analysis of the activity, the spaghetti diagram of the current design is designed. Regarding the most significant contribution, the authors designed an optimized plant layout and added a rail in the operations area to facilitate the shoe assembly sequence. Tarigan and Ishak indicates that redesigning the layout can reduce the waiting time of service process. In that case, displacement was reduced in 64%. Respect the time of service, this was reduced in 22% (Tarigan et al., 2020Tarigan, U., Ishak, A., Hutauruk, Y. O., Siregar, K., Sari, R. M., & Tarigan, U. P. P. (2020). Implementation of lean services and facility layout to improve health clinical service processes. IOP Conference Series. Materials Science and Engineering, 1003(1), 012031. http://dx.doi.org/10.1088/1757-899X/1003/1/012031.
http://dx.doi.org/10.1088/1757-899X/1003...
).
The application of the plant distribution proposals helped increase the company's productivity by 38% and the total movement of material decreased by 14%. Travel distances are reduced from 174m to just 29m in total. Similarly, the production process times were reduced by 33%. This increased production with an additional 10,000 pairs per year, allowing the company to complete all previously unfulfilled orders and create a lead opportunity. In a textile manufacturing company, Rabanal pointed out that, the application of the SLP methodology helped to reduce cycle times, this was reduced from 138.74 minutes to 120.46 minutes and the distance travelled in the operating yard was reduced from 87.50m to 39m (Rabanal et al., 2020Rabanal, Mariela & Zamami, Sonia & Quiroze, Juan & Alvarez, José. (2020). Systematic layout planning: a research on the third party logistics of a Peruvian Company. In T. Ahram, R. Taiar, S. Colson & A. Choplin (Eds.), Human Interaction and Emerging Technologies. IHIET 2019 (Advances in Intelligent Systems and Computing, Vol. 1018). Cham: Springer. http://dx.doi.org/10.1007/978-3-030-25629-6_153.
http://dx.doi.org/10.1007/978-3-030-2562...
).
The systematic layout planning (SLP) is a procedure used to set the layout of workplace in a plant notice to the logical relationship between workplace with high frequency are placed close to each other (Suhardini et al., 2017Suhardini, D., Septiani, W., & Fauziah, S. (2017). Design and simulation plant layout using systematic layout planning. IOP Conference Series. Materials Science and Engineering, 277, 012051. http://dx.doi.org/10.1088/1757-899X/277/1/012051.
http://dx.doi.org/10.1088/1757-899X/277/...
). The systematic layout planning (SLP) is a tool to improve distances between facilities (machines and workstations) and also improve the flow of material (Yenni, 2007Yenni, E. (2007). Perancangan ulang tata letak gedung di RSUD dr Soeroto Ngawi dengan menggunakan pendekatan Systematic Layout Planning. Surakarta: UNS.).
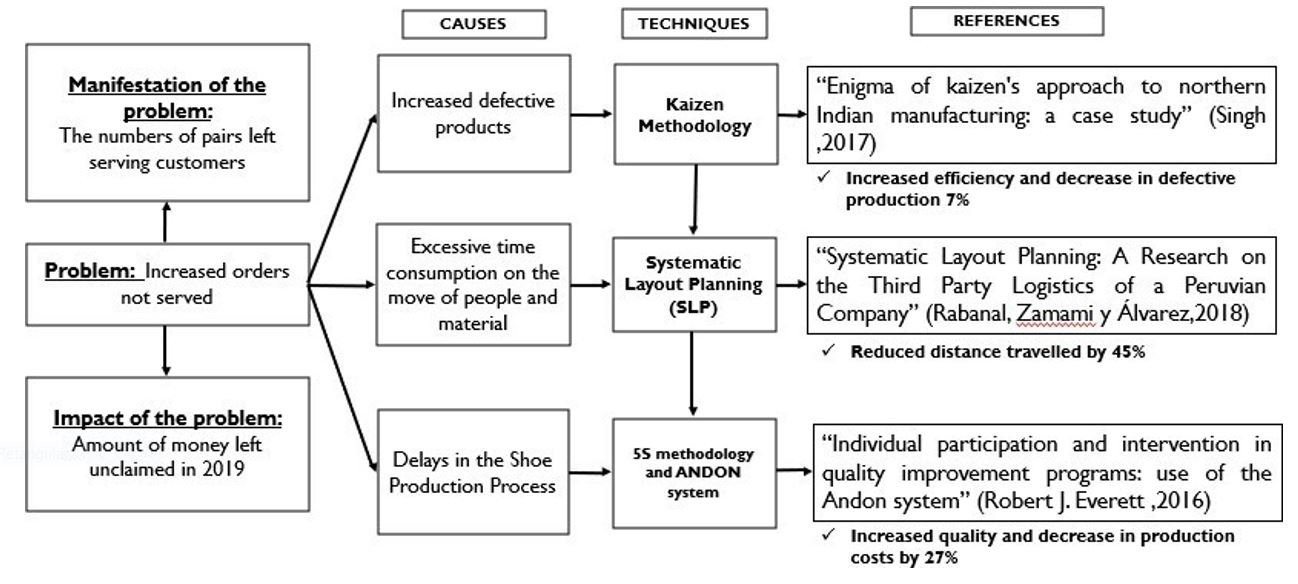
Figure 9 identifies the techniques with the solution.

5. Contribution
5.1. Specific view
The formulation of the proposal or specific view of the case study was defined based on the articles related to the problem that was shown in the state of the art, where precise and adequate information was obtained for the creation of an improvement solution.
Figure 10 shows the four phases through which the case study was addressed, from the choice of the company to the implementation of the proposal.

5.2. Process view
5.2.1. Phase 1
Phase 1 is the planning stage, i.e., defining the objectives of the project and the time estimated for implementing each step. The main objective is increasing the number of orders served by the company, thereby improving the KPI from 94.43% to a proposed value greater than 97%.
The secondary objectives are related to the causes identified in the previous point, where different indicators associated with each of them were calculated. Regarding cause one, the indicator of defective products was calculated, where a current value of 6.22% was obtained, in which a reduction to 4% is proposed. Another important indicator linked to cause 2 is productivity, which proposes an increase of more than 30% also the current cycle time that the company manages for the elaboration of a pair of shoes was evaluated, where a decrease was estimated of the time in 30% with respect to the current of 15.94 min per produced pair.
After preparing the objectives, the choice of techniques that have a significant impact on the solution to the main causes of the problem was considered.
The chosen tools are based on previous success cases where we started from a situation similar to the current situation of this project which were identified during the literature review of sources that serve as a starting point to know how to react and what measures to propose to solve the problems identified, so it was decided to propose the use of lean manufacturing methodologies such as the implementation of the 5s, SLP, Andon system and finally the application of kaizen.
These techniques have an important and relevant relationship with respect to each identified cause, therefore, their order is extremely important during the implementation of these lean manufacturing tools.
In the process view, the detail of each technique proposed in the proposed model will be described, which starts from phase 2 called restructuring of the operations yard to phase 4, which is continuous improvement.
5.2.2. Phase 2
The second phase consists of the development of the first technique in choice, which is represented by the SLP. This tool encompasses the concept of a new plant distribution focused on the reduction of both movements and time of materials and operating personnel.
The first step is focused on a diagnosis of each work area with respect to the areas that directly intervene with the production process, where a route diagram and interactions are used to know the flow and importance of the work areas.
Figure 11 shows the current plant layout.

Once the pattern product path is known, the type and intensity of the interactions between the different production areas are considered.
The intensity of interaction between areas is determined as shown in Table 4.
The interactions between the areas are established taking into account the flow of materials and the product in process. The intensity levels are given by the following parameters: A (Absolutely Necessary), E (Especially Necessary), I (Important), O (Normal), U (Without Importance), X (Not Recommendable).
In Figure 12, it is evident that the areas of roughing, machining, and assembling are absolutely necessary that they are close; however, these are remote in the current design.

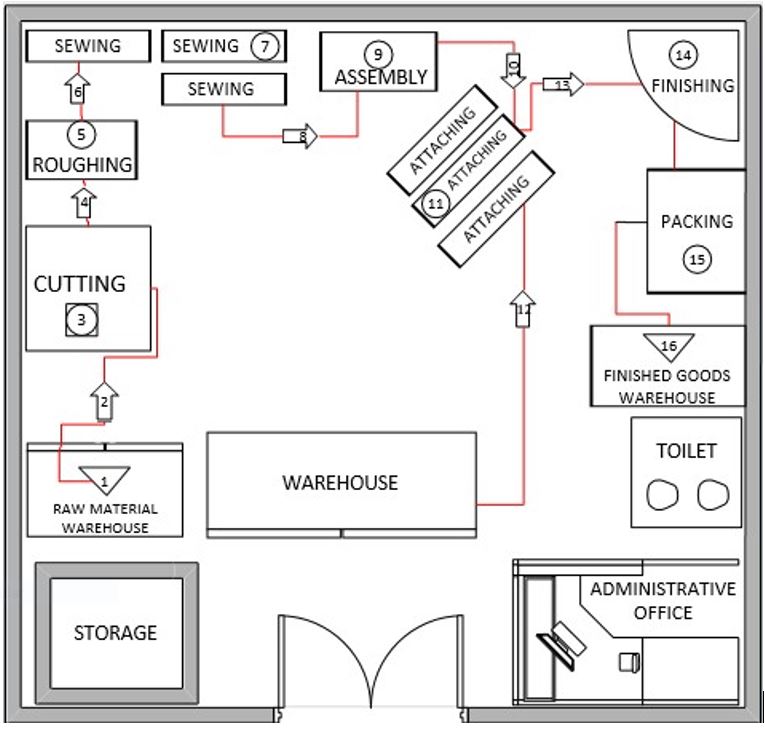
Also, phase 2 consists of proposing a plant distribution where activities involving the highest flow of materials are as close to each other as possible, to ensure compliance with the principle of minimum movement (Figure 13).

The work areas are arranged according to the sequence of operations so that there is continuous flow of materials without congestion (principle of flow).
Figure 14 shows the proposed plant layout.

Then the Effort matrix calculation is performed, where a variation in productivity of 38% is obtained and a reduction in the distance traveled of 12.5 meters.
Then matrix Tables 5, 6, 7, 8, 9 to 10 of Distance (m), Quantity (kg) and Effort (kg-m) are prepared in which the current plant distribution and the distribution proposal are considered.
-
Current Situation
-
Proposed Situation
Finally, when the partial efforts of the matrix tables of the current and proposed situation are added, the result is 1188 kg.m and 738 kg.m respectively. With these data, the variation in productivity will be found.
In conclusion, with the new plant layout, a 38% improvement in productivity was obtained and the distance traveled was reduced by 12.5 meters.
Once the proposed plant design is completed, it is complemented by the installation of an Andon system. The first action focuses on training staff to understand and interact with this model.
The next action is the implementation of the Andon lights on each workstation that will allow a quick visualization and identification of problems that may arise during the production process. Figure 15 shows the prototype proposed for implementation under an Andon strategy, which consists of a basic model of two lights with a different meaning for each possible situation in shoe production.

The intensity of these lights will have a convenient meaning for each one, where the red light indicates the failure of the machine or personnel support, and the yellow light indicates the lack of material or working tools.
The proper use of this technique allows to maintain a continuous production, where the person becomes multifunctional, which leads to having trained and prepared operators to be able to support the most critical production processes of the company (Everett & Sohal, 1991Everett, R. J., & Sohal, A. S. (1991). Individual Involvement and Intervention in Quality Improvement Programmes: Using the Andon System. International Journal of Quality & Reliability Management, 8(2). http://dx.doi.org/10.1108/EUM0000000001635.
http://dx.doi.org/10.1108/EUM00000000016...
).
This technique increases the quality of the products produced as an immediate response to any problem raised that allows a continuous and effective production flow to be maintained.
5.2.3. Phase 3
Phase 3 focuses on the implementation of the 5s methodology. This technique is based on the 5-step implementation process, which are:
-
1S- Sort
-
2S-Straighten
-
3S-Sweep
-
4S-Standardize
-
5S-Sustain
In the first instance, an audit was carried out to know precisely the current state of the company (Figure 16) and carry out an action plan based on the data collected for the development of this methodology.

The results obtained show that the company is far from the ideal situation expected, in addition provides an overview where more work is required to achieve an adequate insertion of this work philosophy.
The next step is to carry out training for both operational and administrative personnel. The training will be focused on topics related to techniques and measures taken to improve productivity in the development of their activities, where it will be carried out by the entity CITEccal which provides a specialized program called “Continuous Productivity Improvement Program: 5S and Kaizen”.
The first “s” covers the classification stage, i.e., identifying the work tools in each area to classify them as necessary or unnecessary depending on the work scenario.
The second “s” relates to establishing an order to facilitate operators’ work. Along these lines, a table was proposed for each type of material and tool.
The third “s” is geared towards cleanliness. Towards this end, a control structure was proposed to create a friendly and comfortable work environment.
This program proposed in Figure 17 will be monitored by the production manager, who will be in charge of its correct use by all work areas.

The fourth “s” focuses on the standardization of processes, i.e., fully understanding the importance of the activities mentioned above to encourage contributions and different perspectives from workers.
Finally, the fifth “s” focuses on the discipline or internalization of the methodology across the production process to create a sustainable work environment and identify opportunities for improvement.
Implementing this philosophy can generate positive change in developing countries. This indicates that it will try to make the manufacturing industries more competitive by satisfying the customer through a modern and reliable optimization strategy (Adesta & Agung, 2018Adesta, E., & Agung, H. (2018). The evaluation of lean manufacturing implementation and their impact to manufacturing performance. IOP Conference Series. Materials Science and Engineering, 453, 012031. http://dx.doi.org/10.1088/1757-899X/453/1/012031.
http://dx.doi.org/10.1088/1757-899X/453/...
).
5.2.4. Phase 4
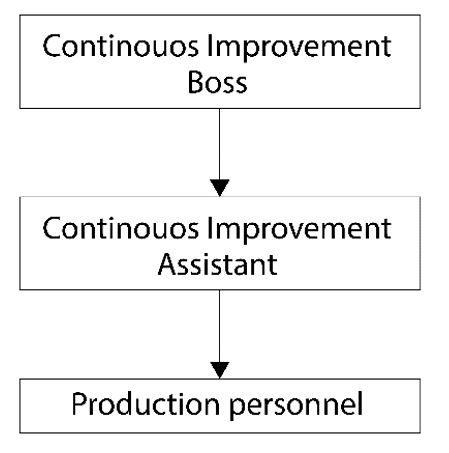
Phase 4, called “continuous improvement”, is based on the implementation of the Kaizen methodology, i.e., a modern technique focused on the standardization of processes and optimal personnel management. It involves creating a Kaizen task force as a new work area organized as follows:
Figure 18 shows an organizational chart where the leader responsible for the operation and successful implementation of the methodology is the Continuous Improvement Manager (the new head of production). The next step is the training of both production and administrative staff, where the production manager will receive an additional course that allows him to acquire skills and faculties to carry out the activities in

this area. Then the problems presented within the organization will be raised and the cycle of kaizen activities will proceed, which is defined from the selection of the topic to the monitoring and evaluation of results (Figure 19).

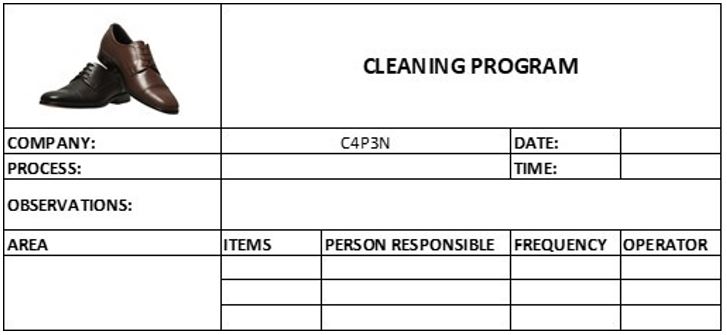
Finally, a new format is introduced for the control of both current productive activities and improvements through a tab of indicators showing the current and future state of problems facing the company. The use of indicator sheets is proposed to ensure better control and monitoring of current problems within the company.
Figure 20 shows order fulfillment indicator sheet.

Figure 21 shows defective products indicator sheet

The use of these indicator sheets is proposed to ensure better control and monitoring of current problems within the company.
6. Validation
The implementation of Lean Manufacturing consists in that all members of this organization are committed to this system towards continuous improvement in all areas (Sierra & Beltrá, 2017Sierra, V. P., & Beltrá, L. C. (2017). Metodología dinámica para la implementación de 5’s en el área de producción de las organizaciones. Revista Ciencias Estratégicas, 25(38), 411-423.).
Validation of improvements created by 5S, and Kaizen was tested through simulation using the ARENA software and economic evaluation of the results obtained.
The study of the system will cover from the selection of raw material necessary to fulfill the received orders to the packing.
The impact of such validation will be evaluated at the political, environmental, socio-cultural, technological and citizen levels.
Next, the representation of the system is shown (Figure 22).

6.1. Validation by simulator
Validation using ARENA was performed to compare the current model and proposed models in order to determine more precisely the advantages of implementing 5S and Kaizen in the production process. The following variables were assessed:
-
Time required at production stations
-
Number of pairs of shoes produced in the last year
-
Number of operators employed in the production area
6.1.1. Clasification of variables
For the definition and obtaining of the variables, all the factors that directly or indirectly influence the study process were considered. Therefore, the classification that was given was divided as follows.
Exogenous variables:
-
Time between arrivals (Not Controllable)
-
Service time at each station (Not Controllable)
-
Order number (Not Controllable)
-
Numbers of workers (Controllable)
-
Number of boxes (Controllable)
-
Hours of operation (Controllable)
-
Operators’ salary (Controllable)
Endogenous variables:
-
Number of orders handled that leave the system
-
Number of orders leaving the system
-
Average cycle time
-
Time required at production stations
-
Number of pairs of shoes produced in the last year
-
Number of operators employed in the production area Figure 23 shows the simulation model:

The simulation represents the entire system of the shoe manufacturing process at company. It begins with orders arriving at the system and ends with the boxing the final product.
The orders of the clients arrive at the system, by means of the command ‘Assign’ the variables and the arrival attribute are assigned. Then, the ‘Decide’ command is added, with which it is verified if there are flaws in the leather. Subsequently, if the die cutting machine is available, then you proceed to enter and thus enter each station of the system. Finally, at the end of the nesting process, the system time is also ended by means of the “record” command.
The current model is then compared with the three scenarios proposed for improvement:
-
Scenario 1:
The assembly operator is moved to the die cutting area and an operator is added to the roughing area.
-
Scenario 2:
The assembly operator is transferred to the die cutting area and an operator is added to the roughing and enabling area.
-
Scenario 3:
The assembly operator is moved to the die cutting area and an operator is added to the finishing and turning area.
The main reason for this exercise is to provide the ability to choose the optimal scenario under evolving conditions (such as the current pandemic context) by making an efficient use of resources; i.e., minimizing costs and risks.
Table 11 shows the results for each scenario:
Based on an 8-hour working day, the results reflect a beneficial impact from the proposal, where scenario 3 yields a higher daily profit ($253).
6.2. Economic validation
The economic validation was carried out by estimating the savings gain obtained by using the above- mentioned methodologies.
To obtain the Savings Benefit, the results obtained by the simulator were used, where the difference was taken which the company would be generating with this proposal.
The exercise considers a $4782.97 investment; i.e., the necessary expenses for developing the project, from staff training to the use of technological tools or materials.
In addition, concepts such as OCC (Opportunity Cost of Capital) and VAN were taken into account, which allowed finding the economic indicators that demonstrate a quantitative viability of the case study.
Calculations run over a period of five years yield positive results. Table 12 shows a Net Present Value (NPV) of $1,005.31 and an Internal Rate of Return (IRR) of 21.44%.
The results suggest that the project is profitable and sustainable over time, since NPV>0 and IRR>OCC (Opportunity Cost of Capital, currently 13.2%).
The final results obtained reflect a comparison of the indicators defined in the previous points. For this reason, a matrix was made that exemplifies using a color scale and parameters that are so positive and beneficial the results obtained from this proposal.
The Table 13 shows the final results obtained where they indicate an improvement in the current measurement indicators with the simulated ones, indicating that this project managed to cover and solve the problems identified within the organization.
The Production time indicator reflects an improvement compared to the current situation; however, it fails to meet the values proposed at the start of the project indicating that over a longer period of implementation, this proposal will measure its progress with respect to the projected situation.
Regarding the other indicators, they reflect beneficial results in favor of the proposal since, based on the expected values in the first three cases, the proposed is fulfilled, in addition, the proposed values have been defined based on previous studies implemented with cases. of similar successes to the developed project.
7. Discussion
This study uses data for Peru. The shoemaking process begins from the moment leather enters the cutting area and ends in the fitting area. The time series for each station were validated through a sensitivity analysis. Later the model was estimated using ARENA. The results are presented using the following indicators: order fulfillment, defective products, and productivity. Regarding fulfilled orders, 100% fulfillment is achieved, as daily production capacity increases and therefore more orders can be met. Defective products decreased from 6.2% to 3.1%, mainly due to the application of Kaizen. Through the synergies created between the operational and management areas, leather verification areas can be efficiently managed, and better management of input suppliers is possible. Finally, productivity improves by 38% through the relocation of production areas, which secures the minimum distance and material flow principles.
It is also important to mention that, in most countries where these techniques are applied, a continuous improvement area is in charge of following up on operations to identify problems and suggest solutions, thereby removing such responsibility from the production area.
The initial goal of this work was to actually implement the proposal but, due to the pandemic, only simulations can be provided for the moment. In the future it might be possible to use video cameras, with authorization from senior management, to record the production process within the operations yard. In this way, more accurate data may be obtained, as staff would work at a normal pace and without interference.
It should also be noted that an economic analysis was carried out to assess the potential impact of an investment on the company. Towards this end, indicators such as the NPV and the IRR were used to estimate the feasibility of the project, with favorable results (NPV>0, IRR>OCC).
In conclusion, by implementing the improvements suggested above, the company may not just solve non-fulfillment of orders, but also open the possibility of capturing new orders on a larger scale. Finally, this study is intended as a potential contribution to future research on the efficient use of lean manufacturing among Peru’s footwear SMEs.
8. Final considerations
Lean manufacturing adoption as a work culture and philosophy had a significant effect on all operational and administrative areas in the company under study, in turn resulting in continuously improved performance.
At an initial stage, the study assessed the current state of the company; identified that the main problem facing it was the number of unfulfilled orders; and established that the main causes were the increase in defective products in recent years, the excessive time used in the movement of staff and materials, and the delays during the manufacturing process.
In this light, the study simulated SLP implementation to improve the layout of operational areas, thereby improving productivity from 30% to 38%. In turn, enhanced productivity expedites production processes, thus releasing time that can be allocated to new improvement activities. The study also simulated the implementation of other lean manufacturing techniques such as 5S, Kaizen, and the Andon system, which create improvements at both the operational and social/cultural levels, in turn reducing defective orders by 40% and increasing the number of orders served. The effect of the variables considered was simulated using the ARENA software.
In conclusion, we draw from international manufacturing practices and apply them to a company chosen for this case study. Additionally, the results are relevant to the current world pandemic context, since implementation of the techniques considered in the study emphasizes biosafety measures combined with ANDON system techniques, which seek to ensure a healthy work environment. Finally, this study is intended as a stepping stone for future research on automated technologies and for the creation of a production control database, with an aim to speed up problem resolution in real time.
9. Conclusions
The problem identified in the case of study raised encompassed the problem of the number of orders of shoes not to be attended. For this reason, an innovative proposal was made that couple techniques such as SLP and lean manufacturing, in order to increase the number of peers served by the company and reduce the impact of the causes that generate the problem.
The proposal consisted of four phases where it began from a current diagnosis of the company's situation, followed by the implementation of these continuous improvement models that changed in large part the common activities carried out by the company. In addition, as part of the model validation a simulation software called ARENA was used, where the results obtained indicate a favorable and positive change after the implementation of the techniques, since the amount of defective products decreased from 6.22% to 3.13%, the production time is shortened from 15.94 min per pair to 15 min per pair and the variation in productivity amounts to 38% resulting in an increase in the number of orders served by the company.
The main contribution of this study is the implementation of lean manufacturing techniques in their application with small companies, which generate positive results taking into account the detection of the main causes that generates the problem and proposing its subsequent solution and / or mitigation measure. It is also important to mention that the human value as the state play a fundamental role for the implementation of these techniques since depending on the commitment of the workers with the improvement process it will be reflected in an early time horizon and the programs or entities that promote and support the training of lean manufacturing models should be provided by the state with the intention of giving the greatest facilities to small growing companies.
In terms of limitations in research, it can be mentioned: the communication system within the company is not the best, since there is not an adequate flow of information between the strategic areas. Another limitation was the reduced visits to the plant due to sanitary restrictions due to the pandemic.
In respect of future research related to this research topic, the pandemic situation implies that the company has to make a disbursement in terms of security protocols. The simulation in Arena offers an encouraging scenario regarding the increase in the fulfillment of shoe orders, so it is recommended to replace the strategic objectives of the company. The implementation of the Andon system in this footwear SME allows investigation in automated technologies and a database in production control in the future to speed up the resolution of problems in real time.
In short, the implementation of these systems improves the rate of production and reduces costs at different production levels, it will also be necessary to carry out regular checks for its success and sustainability to make it possible to know the status of the project and in any case improvement actions when required.
-
How to cite this article: Munive Silvestre, S. E., Paucar Chaicha, V. D., Alvarez Merino, J. C., Nallusamy, S. (2022). Implementation of a Lean Manufacturing and SLP- based system for a footwear company. Production, 32, e20210072. https://doi.org/10.1590/0103-6513.20210072
References
- Abdul-Rashid, S. H., Sakundarini, N., Raja Ghazilla, R. A., & Thurasamy, R. (2017). The impact of sustainable manufacturing practices on sustainability performance: empirical evidence from Malaysia. International Journal of Operations & Production Management, 37(2), 182-204. http://dx.doi.org/10.1108/IJOPM-04-2015-0223
» http://dx.doi.org/10.1108/IJOPM-04-2015-0223 - Abu, F., Gholami, H., Saman, M. Z. M., Zakuan, N., Streimikiene, D., & Kyriakopoulos, G. L. (2021). An SEM approach for the barrier analysis in lean implementation in manufacturing industries. Sustainability, 13(4), 1-18. http://dx.doi.org/10.3390/su13041978
» http://dx.doi.org/10.3390/su13041978 - Adesta, E., & Agung, H. (2018). The evaluation of lean manufacturing implementation and their impact to manufacturing performance. IOP Conference Series. Materials Science and Engineering, 453, 012031. http://dx.doi.org/10.1088/1757-899X/453/1/012031
» http://dx.doi.org/10.1088/1757-899X/453/1/012031 - Aguilar, M. (2016). Estrategias de productividad para una empresa basadas en manufactura esbelta (Tesis de maestría). Instituto Politécnico Nacional, Ciudad de México.
- Ali Naqvi, S. A., Fahad, M., Atir, M., Zubair, M., & Shehzad, M. M. (2016). Productivity improvement of a manufacturing facility using systematic layout planning. Cogent Engineering, 3(1), 1207296. http://dx.doi.org/10.1080/23311916.2016.1207296
» http://dx.doi.org/10.1080/23311916.2016.1207296 - Andrade, Y., Cardenas, L., Viacava, G., Raymundo, C., & Dominguez, F. (2019). Lean manufacturing model for the reduction of production times and reduction of the returns of defective items in textile industry. In G. Di Bucchianico (Ed.), Advances in design for inclusion. AHFE 2019 (Advances in Intelligent Systems and Computing, Vol. 954). Cham: Springer. http://dx.doi.org/10.1007/978-3-030-20444-0_39
» http://dx.doi.org/10.1007/978-3-030-20444-0_39 - Bhamu, J., & Singh Sangwan, K. (2014). Lean manufacturing: literature review and research issues. International Journal of Operations & Production Management, 34(7), 876-940. http://dx.doi.org/10.1108/IJOPM-08-2012-0315
» http://dx.doi.org/10.1108/IJOPM-08-2012-0315 - Everett, R. J., & Sohal, A. S. (1991). Individual Involvement and Intervention in Quality Improvement Programmes: Using the Andon System. International Journal of Quality & Reliability Management, 8(2). http://dx.doi.org/10.1108/EUM0000000001635
» http://dx.doi.org/10.1108/EUM0000000001635 - Gisbert Soler, V., Pérez Bernabeu, E., & Sellés Cantó, M. A. (2012).Los gráficos de control por atributos(3rd ed.). Spain: 3C Empresa.
- Andrade, A. M., Del Río, C. A., & Alvear, D. L. (2019). Estudio de Tiempos y Movimientos para Incrementar la Eficiencia en una Empresa de Producción de Calzado. Información Tecnológica, 30(3), 83-94, from https://www.scielo.cl/pdf/infotec/v30n3/0718-0764-infotec-30-03-00083.pdf http://dx.doi.org/10.4067/S0718-07642019000300083
» https://www.scielo.cl/pdf/infotec/v30n3/0718-0764-infotec-30-03-00083.pdf» http://dx.doi.org/10.4067/S0718-07642019000300083 - Goyal, G., & Verma, D. S. (2019). Optimization of plant layout in manufacturing industry. International Journal of Recent Technology and Engineering, 8(2), 3115-3118. http://dx.doi.org/10.35940/ijrte.B2679.078219
» http://dx.doi.org/10.35940/ijrte.B2679.078219 - Innovate Peru. (2020). Retrieved in 2020, August 25, from https://www.innovateperu.gob.pe/quienes-somos/nuestros- fondos/mipyme
» https://www.innovateperu.gob.pe/quienes-somos/nuestros- - Jiamruangjarus, P., Naenna, T., & Zhou, Z. (2016). An integrated multi-criteria decision making methodology for conveyor system selection. Cogent Engineering, 3, 1158515. http://dx.doi.org/10.1080/23311916.2016.1158515
» http://dx.doi.org/10.1080/23311916.2016.1158515 - Kłodawski, M., Jacyna, M., Lewczuk, K., & Wasiak, M. (2017). The issues of selection warehouse process strategies. Procedia Engineering, 187, 451-457. http://dx.doi.org/10.1016/j.proeng.2017.04.399
» http://dx.doi.org/10.1016/j.proeng.2017.04.399 - Lopez-Leyva, J. A., Molina-Inzunza, A., Navarro-Paz, P., Verduzco-Unzón, S., & Yáñez, M. (2020). Customized smart andon system to improve the efficiency of industrial departments. Journal of Scientific and Industrial Research, 79(1), 35-37.
- Nasution, A. A., Siregar, I., Anizar, Nasution, T. H., Syahputri, K., & Tarigan, I. R. (2018). Lean manufacturing applications in the manufacturing industry. MATEC Web of Conferences, 220, 02005. http://dx.doi.org/10.1051/matecconf/201822002005
» http://dx.doi.org/10.1051/matecconf/201822002005 - Perú, CITEccal. (2018). Retrieved in 2018, March 27, from http://citeccal.itp.gob.pe/citeccal-lima-implemento-programa-de- 5s-y-kaizen-en-empresa-de-calzado/
» http://citeccal.itp.gob.pe/citeccal-lima-implemento-programa-de- - Rabanal, Mariela & Zamami, Sonia & Quiroze, Juan & Alvarez, José. (2020). Systematic layout planning: a research on the third party logistics of a Peruvian Company. In T. Ahram, R. Taiar, S. Colson & A. Choplin (Eds.), Human Interaction and Emerging Technologies. IHIET 2019 (Advances in Intelligent Systems and Computing, Vol. 1018). Cham: Springer. http://dx.doi.org/10.1007/978-3-030-25629-6_153
» http://dx.doi.org/10.1007/978-3-030-25629-6_153 - Randhawa, J. S., & Ahuja, I. S. (2017a). 5S - a quality improvement tool for sustainable performance: literature review and directions. International Journal of Quality & Reliability Management, 34(3), 334-361. http://dx.doi.org/10.1108/IJQRM-03-2015-0045
» http://dx.doi.org/10.1108/IJQRM-03-2015-0045 - Randhawa, J. S., & Ahuja, I. S. (2017b). Evaluating impact of 5S implementation on business performance. International Journal of Productivity and Performance Management, 66(7), 948-978. http://dx.doi.org/10.1108/IJPPM-08-2016-0154
» http://dx.doi.org/10.1108/IJPPM-08-2016-0154 - Retail, P. (2017). Retrieved in 2017, June 12, from https://www.peru-retail.com/peru-cuarto-mayor-productor- calzado-america-del-sur/
» https://www.peru-retail.com/peru-cuarto-mayor-productor- - Reyes, J., Morales, L., Aldas, D., Reyes, R., & Toasa, R. (2019). Real time automatic andon alerts for android platforms applied in footwear manufacturing. In Proceedings of the First International Conference, ICCCE 2018 Cham: Springer. http://dx.doi.org/10.1007/978-3-030-12018-4_4
» http://dx.doi.org/10.1007/978-3-030-12018-4_4 - Sarria Yépez, M. P., Fonseca Villamarín, G. A., & Bocanegra-Herrera, C. C. (2017). Modelo metodológico de implementación de lean manufacturing. Revista EAN, 83(83), 51-71. http://dx.doi.org/10.21158/01208160.n83.2017.1825
» http://dx.doi.org/10.21158/01208160.n83.2017.1825 - Sayid Mia, M. A., Nur-E-Alam, M., & Uddin, M. K. (2017a). Court shoe production line: improvement of process cycle efficiency by using lean tools. Leather and Footwear Journal, 17(3), 135-146. http://dx.doi.org/10.24264/lfj.17.3.3
» http://dx.doi.org/10.24264/lfj.17.3.3 - Sayid Mia, M. A., Nur-E-Alam, M., Rahman, M. L., & Uddin, M. K. (2017b). Footwear industry in bangladesh: reduction of lead time by using lean tools. Journal of Environmental Science, Computer Science and Engineering & Technology, 6(3), 251-259. http://dx.doi.org/10.24214/jecet.C.6.3.25159
» http://dx.doi.org/10.24214/jecet.C.6.3.25159 - Sierra, V. P., & Beltrá, L. C. (2017). Metodología dinámica para la implementación de 5’s en el área de producción de las organizaciones. Revista Ciencias Estratégicas, 25(38), 411-423.
- Singh, J., & Singh, H. (2018). Enigma of KAIZEN approach in manufacturing industry of Northern India: a case study. International Journal of Quality & Reliability Management, 35(1), 187-207. http://dx.doi.org/10.1108/IJQRM-12-2016-0220
» http://dx.doi.org/10.1108/IJQRM-12-2016-0220 - Suhardini, D., Septiani, W., & Fauziah, S. (2017). Design and simulation plant layout using systematic layout planning. IOP Conference Series. Materials Science and Engineering, 277, 012051. http://dx.doi.org/10.1088/1757-899X/277/1/012051
» http://dx.doi.org/10.1088/1757-899X/277/1/012051 - Tanco, F., Kalemkerian, F., & Santos, J. (2021). Main challenges involved in the adoption of sustainable manufacturing in Uruguayan small and medium sized companies. Journal of Cleaner Production, 293, 126139. http://dx.doi.org/10.1016/j.jclepro.2021.126139
» http://dx.doi.org/10.1016/j.jclepro.2021.126139 - Tarigan, U., Ishak, A., Hutauruk, Y. O., Siregar, K., Sari, R. M., & Tarigan, U. P. P. (2020). Implementation of lean services and facility layout to improve health clinical service processes. IOP Conference Series. Materials Science and Engineering, 1003(1), 012031. http://dx.doi.org/10.1088/1757-899X/1003/1/012031
» http://dx.doi.org/10.1088/1757-899X/1003/1/012031 - Vanichchinchai, A. (2020). Exploring organizational contexts on lean manufacturing and supply chain relationship. Journal of Manufacturing Technology Management, 31(2), 236-259. http://dx.doi.org/10.1108/JMTM-01-2019-0017
» http://dx.doi.org/10.1108/JMTM-01-2019-0017 - Yang, T., Su, C.-T., & Hsu, Y.-R. (2000). Systematic layout planning: A study on semiconductor wafer fabrication facilities. International Journal of Operations & Production Management, 20(11), 1359-1371. http://dx.doi.org/10.1108/01443570010348299
» http://dx.doi.org/10.1108/01443570010348299 - Yenni, E. (2007). Perancangan ulang tata letak gedung di RSUD dr Soeroto Ngawi dengan menggunakan pendekatan Systematic Layout Planning Surakarta: UNS.
- Yuik, C. J., Perumal, P. A., & Feng, C. J. (2020). Exploring critical success factors for the implementation of lean manufacturing in machinery and equipment SMEs. Engineering Management in Production and Services, 12(4), 77-91. http://dx.doi.org/10.2478/emj-2020-0029
» http://dx.doi.org/10.2478/emj-2020-0029
Publication Dates
-
Publication in this collection
13 May 2022 -
Date of issue
2022
History
-
Received
07 June 2021 -
Accepted
07 Apr 2022