 Managing uncertainty in product development and manufacturing integration: a multi-criteria, multi-phase evaluation
Abstract
Paper aims This paper aims to analyze how different sources of uncertainty interact and influence decision making across the early phases of the Product Development Process, with particular attention to their implications for manufacturing readiness and project performance.
Originality The study advances project management and product development research by integrating a phase based perspective of uncertainty with a causal modeling approach, offering a structured understanding of how uncertainty dynamics evolve rather than treating uncertainties as isolated or static factors.
Research method The research adopts the Decision Making Trial and Evaluation Laboratory method, supported by expert interviews, to model cause and effect relationships among eight uncertainty dimensions across the informational, conceptual, and detailed design phases of product development.
Main findings The results indicate that technological and competitive uncertainties are the most influential factors in the informational phase, exerting strong mutual influence. In the conceptual phase, commercial uncertainty emerges as the most affected dimension, reflecting its dependence on strategic, technological, and market related factors. In the detailed phase, uncertainty intensifies, with commercial, technological, and resource uncertainties showing the highest levels of interdependence and overall importance.
Implications for theory and practice The study contributes theoretically by demonstrating the value of a dynamic, phase sensitive view of uncertainty in product development projects. For practitioners, the findings highlight the need for adaptive, phase specific uncertainty management strategies that support better decision making, reduce late stage risks, and improve alignment between product development and manufacturing execution. These insights support more resilient projects and sustained competitive advantage.
Keywords:
Uncertainty management; Product development; DEMATEL; Manufacturing integration; Project risk
1. Introduction
The current competitive landscape and accelerated pace of societal change demand that companies enhance their efficiency and flexibility to respond to evolving market needs. In this context, organizations are increasingly challenged to develop products that align closely with customer expectations, requiring agile and competitive manufacturing systems (Saisridhar et al., 2024). A key difficulty lies in integrating the technical and technological innovations emerging from product development into existing manufacturing processes in a cost-effective manner (Kaufmann & Kock, 2022).
One of the main barriers to achieving this integration is the lack of alignment and communication between product development and manufacturing functions, which often results in prolonged development cycles and missed market deadlines (Bakhshi et al., 2025; Jugend & Silva, 2014). Reducing this gap and effectively managing uncertainty are therefore critical to improving new product development (NPD) outcomes. Projects inherently face multiple forms of uncertainty, originating from both internal and external sources such as market volatility, technological change, societal trends, and organizational dynamics (Bakhshi et al., 2025; Kaufmann & Kock, 2022; Saisridhar et al., 2024). Managing these uncertainties is essential, given their impact on project duration, cost, and the ability to meet customer requirements (Stock et al., 2021).
The Decision-Making Trial and Evaluation Laboratory (DEMATEL) method offers a robust approach for modelling and understanding complex interrelationships among factors contributing to uncertainty. By quantifying the intensity and direction of influence among variables, DEMATEL supports decision-makers in identifying critical drivers and dependencies. As highlighted by Kashi and Franek (Dinh Khoa & Mai Anh, 2024), the method is particularly useful for mapping causal relationships in multidimensional systems.
Despite its potential, the literature reveals notable gaps. Many studies focus on isolated stages of the product development process (Eslami & Melander, 2019; Petronijevic et al., 2022), potentially neglecting the broader systemic implications of uncertainty across the entire PDP. Moreover, product development activities are often conducted in a fragmented manner, with limited integration among organizational actors and knowledge sources (Marin & Kaminski, 2020). Furthermore, research often fails to address sector-specific characteristics or to incorporate emerging technological contexts such as digital transformation and Industry 4.0, which are transforming manufacturing systems and production environments (Schmidt et al., 2023). This fragmented view may lead to suboptimal decisions, increasing project risks and inefficiencies (Shabani et al., 2023).
Addressing these gaps requires a more comprehensive and integrative analytical approach. This study applies the DEMATEL method to evaluate how key uncertainty factors interact across three early stages of the product development process: informational, conceptual, and detailed design, and their implications for manufacturing integration. By examining uncertainty across multiple phases, the study contributes to a more holistic understanding of project dynamics and supports the development of targeted strategies for uncertainty management.
The paper is structured as follows: Section 2 presents the literature review, Section 3 describes the methodological approach, Section 4 discusses the results, and Section 5 concludes with managerial and theoretical implications and avenues for future research. The central research question guiding this study is: How do uncertainty-related variables impact the effectiveness of product development and its integration with manufacturing?
2. Theoretical background
2.1. Product development and process integration
The Product Development Process (PDP) encompasses a structured set of activities aimed at defining the specifications of a product and its associated manufacturing process, considering market needs, production capabilities, and technological constraints (Butturi et al., 2025; Varandas Junior & Miguel, 2012). As noted by Patel et al. (2024), PDP involves multiple stakeholders with distinct interests: organizations seek rapid returns on investment; customers demand innovative and affordable products; sales teams require differentiation; and production engineers aim for manufacturability with minimal waste. Although it is impossible to eliminate all variability from PDP, a structured approach enables better control, especially in complex projects (Browning & Koch, 2025). Among widely adopted models, Amajuoyi et al. (2024) proposed a framework comprising three macro-processes: pre-development, development, and post-development, supported by continuous processes such as engineering change management and PDP improvement.
Within the development macro-process, three early phases (i.e., informational, conceptual, and detailed design) are particularly relevant due to their high potential for influence and relatively low implementation costs. The informational phase involves translating strategic directives into technical specifications (Romeiro et al., 2013). The conceptual phase models product functionality, explores solution alternatives, and defines system architecture. It includes technical and economic feasibility analyses (Amajuoyi et al., 2024). The detailed phase consolidates the product definition through testing, documentation, and production planning, forming the basis for manufacturing scale-up (Abanda et al., 2025).
Reducing uncertainty during these early phases enhances alignment with customer needs and ensures a smoother transition to production. According to Amajuoyi et al. (2024), effective PDP depends on information quality and continuous requirement reassessment based on changing market conditions.
2.2. Uncertainty in project and product development
Uncertainty is inherent in all projects and varies in source, magnitude, and impact. Broadly defined as the inability to predict outcomes or determine the true state of a system (Moerth-Teo et al., 2025; Zio, 2025), uncertainty in engineering design and PDP arises from both internal and external factors. These include technological changes, market dynamics, regulatory shifts, and organizational transformation (Bakhshi et al., 2025; Kaufmann & Kock, 2022; Saisridhar et al., 2024). From a classification perspective, uncertainty can be epistemic (reducible through improved knowledge) or aleatory (stemming from intrinsic randomness) (Brinkmann & Wynn, 2025). In PDP, both types coexist and affect project performance in different ways. Project management literature often addresses uncertainty via risk analysis, conceptualizing it in terms of event probability and impact on objectives (Liew et al., 2024). Process-wise, uncertainty is reflected in risk elements: external (e.g., supplier reliability, natural events) or internal (e.g., estimation errors, capacity limitations) (Hu et al., 2025; Liew et al., 2024). Some uncertainties are exogenous to PDP, driven by external dynamics such as market volatility or political shifts; others are endogenous, linked to process complexity or low maturity in product or process technologies (Ali & Rafique, 2024; Ferguson et al., 2024; Zhang & Li, 2025).
Effective uncertainty management is thus a key determinant of project success. Failures typically stem from overconfidence in technical knowledge, disregard for human factors, or inadequate risk prioritization (Panarotto & Alonso Fernández, 2024). Various studies identify core uncertainty domains including technological, resource, competitive, supplier, consumer, political, organizational, and commercial as critical influences in PDP (Cowden et al., 2024; Eslami & Melander, 2019). Notably, while uncertainty increases potential risks, it also introduces opportunities for competitive advantage. Higher uncertainty environments, when managed strategically, may lead to superior outcomes (Zhang & Min, 2024). To support such management, Restrepo et al. (2025) defines Uncertainty Management as a structured, quantitative decision-making process aimed at identifying optimal outcomes under uncertain conditions. Aligned with ISO 31000 guidelines, the goal is not merely to mitigate threats but also to enhance the exploitation of emerging opportunities through informed prioritization, control, and monitoring (Kao et al., 2026).
3. Methodological approach
This study employed the Decision-Making Trial and Evaluation Laboratory (DEMATEL) method, originally developed by the Battelle Memorial Institute (Thakkar, 2021), in conjunction with expert interviews. DEMATEL is particularly effective for structuring and visualizing complex causal relationships within systems, as it allows for the aggregation of expert knowledge to construct a comprehensive structural model and produce a causal diagram.
Through a matrix-based approach, DEMATEL reveals cause-and-effect relationships among interrelated elements by quantifying their direct and indirect influences (Thakkar, 2021). The method is well suited for exploring systems characterized by intricate interdependencies, as it enables a deeper understanding of how individual factors interact and influence each other (Dalvi-Esfahani et al., 2019; Ortiz-Barrios et al., 2020). Similar applications have been reported in industrial decision-making contexts, where DEMATEL has been used to identify causal relationships among critical performance factors (Darestani et al., 2020).
By converting relational feedback loops into directed graphs, DEMATEL facilitates the identification of the most influential and dependent components within a system, thereby supporting more informed decision-making (Dalvi-Esfahani et al., 2019). In addition to mapping interrelations, the method contributes to dimensionality reduction by highlighting the most relevant criteria for analysis. According to Huynh-Cam et al. (2024), the use of impact-relational digraphs enhances the clarity of subsystem dynamics and supports more targeted management actions.
3.1. Methodological justification
The DEMATEL method was selected because the objective of this study is not merely to rank uncertainty factors, but to understand the direction, intensity, and interdependence of causal relationships among them across different PDP phases. Unlike purely hierarchical or scoring-based multi-criteria methods, DEMATEL explicitly models feedback loops and bidirectional influences, which are central to uncertainty propagation in complex product development environments (Huynh-Cam et al., 2024). In the context of this research, relationships among uncertainty factors are treated as non-compensatory in structural logic, since the influence of one factor over another is not offset by superior performance elsewhere. Instead, uncertainties accumulate and propagate through cause-effect mechanisms. However, the aggregation of expert judgments through averaging implies a limited compensatory feature at the data consolidation stage, ensuring collective representation rather than dominance by individual perceptions.
Among alternative approaches, the Analytic Hierarchy Process (AHP) is often cited. It was not adopted because this study aims to model causal and reciprocal relationships among interdependent uncertainty factors, rather than derive hierarchical priority weights. AHP assumes relative independence and focuses on preference intensity, whereas DEMATEL better captures systemic interdependencies (Ortiz-Barrios et al., 2020). The 0-4 influence scale follows established DEMATEL applications (e.g., Sallum et al., 2018; Campos et al., 2021) and measures degree of influence, not strict preference. A narrower scale reduces cognitive burden and improves consistency across multiple comparisons. As DEMATEL relies on normalization, expanding to a 1-9 scale would add limited precision while increasing subjectivity.
The use of nine experts constitutes a limitation related to sample size and generalizability. Although this number is consistent with prior DEMATEL-based studies, which emphasize expertise over large samples, the findings reflect perceptions from a specific professional context and may not capture the full diversity of uncertainty dynamics across industries. However, the experts were carefully selected based on experience in product development and manufacturing integration, ensuring informed and technically grounded assessments. In causal modelling approaches such as DEMATEL, the quality and relevance of expertise are more critical than statistical representativeness (Ortiz-Barrios et al., 2020).
3.2. Uncertainty sources
To identify and systematize the main uncertainties addressed in the literature, a literature review was conducted using three academic databases. Web of Science served as the primary source due to its long-standing role in monitoring the evolution of global scientific output (Ortega & Delgado-Quirós, 2024). To broaden the scope of the review, Scopus was also included, given its extensive coverage and relevance in scientific research. Additionally, Google Scholar was consulted to capture influential publications that might not be indexed in traditional databases but are widely referenced in the academic community. Table 1 presents the uncertainties most frequently cited across the reviewed studies.
Explanation of contributing factors, adapted from Cowden et al. (2024); Eslami & Melander (2019).
3.3. Definition of the study phases
The development macro-phase comprises five distinct phases: informational design, conceptual design, detailed design, preparation for production, and product launch. The first three of these phases are delineated in Table 2.
The focus on the informational, conceptual, and detailed design phases is justified by their strategic relevance in shaping the overall trajectory of product development projects. These early phases concentrate the most critical decisions regarding product architecture, technology selection, market positioning, and resource allocation, while maintaining relatively high flexibility and lower cost of change. Similarly, early-stage design decisions significantly constrain downstream manufacturing and operational performance. By concentrating on these first three phases, this study captures the period in which uncertainty is both most influential and most manageable, before decisions become locked-in and reversibility diminishes. Later phases tend to focus more on execution and control, where the scope for structurally reshaping uncertainty relationships is substantially reduced.
3.4. Expert consultation process
The interview protocol was carefully developed through collaborative discussions among the authors to ensure that the language and terminology used in the questionnaire were aligned with the vocabulary commonly employed by professionals in their respective organizational contexts. Particular attention was given to defining the respondent profile, with the selection criteria refined to target individuals possessing relevant experience and the capacity to provide informed and meaningful insights for the study. Table 3 presents a summary of the respondents’ professional backgrounds.
Respondents were instructed to quantify the degree of interference of factors (uncertainties) using a numerical scale from 0 to 4, as delineated in Table 4.
According to Sallum et al. (2018), a scale ranging from 0 to 4 is employed to assess influence. Zero signifies no influence, one indicates minimal influence, two denotes moderate influence, three represents substantial influence, and four corresponds to very strong influence. Table 5 delineates the correlation between the degree of influence one factor exerts upon another and the corresponding numerical representation to be chosen.
3.5. Application of the Decision Making Trial and Evaluation Laboratory (DEMATEL) Method.
Following the data collection process, the DEMATEL method was employed to analyse the interrelationships among the identified uncertainty factors in product development. It followed a structured seven-stage procedure, based on methodological guidelines proposed by Nalluri et al. (2025), Dalvi-Esfahani et al. (2025), and Ortiz-Barrios et al. (2020). It is worth noting that the initial stages - (i) defining the factors and research objectives, and (ii) collecting data from experts - were previously detailed. The subsequent steps, specific to the DEMATEL implementation, are outlined below:
-
Stage 1: In collaboration with the experts, the questionnaire was designed to capture perceived causal relationships among the uncertainty factors. At this stage, the evaluation criteria and scope of analysis were clearly defined, aligning the research objectives with the experts’ perspectives.
-
Stage 2: Meetings were conducted to select experts with relevant experience to ensure reliable and meaningful input. The finalized questionnaires were then distributed, and each expert evaluated the degree of influence between each pair of factors using a pairwise comparison approach, resulting in an n×nn \ nn×n matrix for each respondent.
-
Stage 3: Once the individual responses were collected, the direct-relation matrices were generated in accordance with Equation 1, forming the basis for subsequent analytical steps.
-
Stage 4: In this stage, the general direct-relation matrix (X) is normalized. Each element in the matrix is divided by the maximum of the sums of the rows or columns, ensuring that all values fall within a defined scale and are comparable.
-
Stage 5: The total-relation matrix (T) is then computed. This involves subtracting matrix X from the identity matrix (I), calculating the inverse of (I – X), and multiplying the result by X.
-
Stage 6: To construct the causal diagram, the sum of the rows (D) and the sum of the columns (R) are calculated for matrix T. These values are used to determine the prominence (D+RD + RD+R) and net effect (D−RD - RD−R) of each factor, which are essential for identifying cause–effect relationships.
-
Stage 7: Finally, a causal digraph is constructed. A threshold value is defined - typically based on the mean or standard deviation of the elements in matrix T - to filter out negligible relationships. Only the values exceeding this threshold are retained and represented in the diagram to highlight the most significant causal influences.
4. Results
Following the procedures described in Section 3.5, the analysis was conducted through three rounds of DEMATEL, incorporating the perspectives of nine experts on the early stages of product development - namely, the informational, conceptual, and detailed design phases. The experts evaluated the influence of eight key sources of uncertainty: technological, resource, competitive, supplier, consumer, political, organizational, and commercial. Their assessments were structured around the potential impact of each uncertainty type on the respective development phases. Individual judgments were recorded in the form of 8×8 pairwise comparison matrices, one for each phase, resulting in three matrices per expert. These matrices are provided in Appendix 1. Subsequently, for each development phase, an average direct-relation matrix was computed by aggregating the responses of all experts. Table 6 presents the resulting average direct-relation matrices for the informational, conceptual, and detailed phases, respectively. Table 7 presents the degree of influence between each pair of factors using a pairwise comparison approach.
For the construction of the causal diagrams, threshold values were established for the total-relation matrix (T) in each phase of the product development process. Specifically, relationships with values exceeding 1.132, 1.266, and 2.537 were considered significant for the informational, conceptual, and detailed design phases, respectively. These values served to filter out weaker influences and retain only the most relevant relationships. The significant entries are highlighted in bold in Table 8.
The value of D+R reflects the overall level of interaction a given factor has within the system, representing the total amount of influence it both exerts on and receives from other factors. In contrast, the D–R value indicates the net influence of a factor, allowing the identification of causal (positive D–R) and effect (negative D–R) elements within the system. A positive D–R suggests that the factor acts primarily as a cause, exerting greater influence than it receives, whereas a negative D–R denotes an effect, being more influenced by others. Table 9 presents the prominence (D+R) and the cause–effect orientation (D–R) of each uncertainty factor across the phases analysed.
The comparative analysis across the informational, conceptual, and detailed phases reveals a dynamic pattern of influence among uncertainty factors. While early stages are dominated by technological and competitive uncertainties, later stages show increasing interdependence, particularly involving commercial and resource dimensions. These results suggest that uncertainty does not remain static throughout the PDP, but evolves in structure and intensity.
The findings reinforce the argument that uncertainty management in product development must be approached from a systemic and phase-sensitive perspective. Rather than acting independently, uncertainty dimensions form evolving causal structures that reshape decision-making conditions across the PDP.
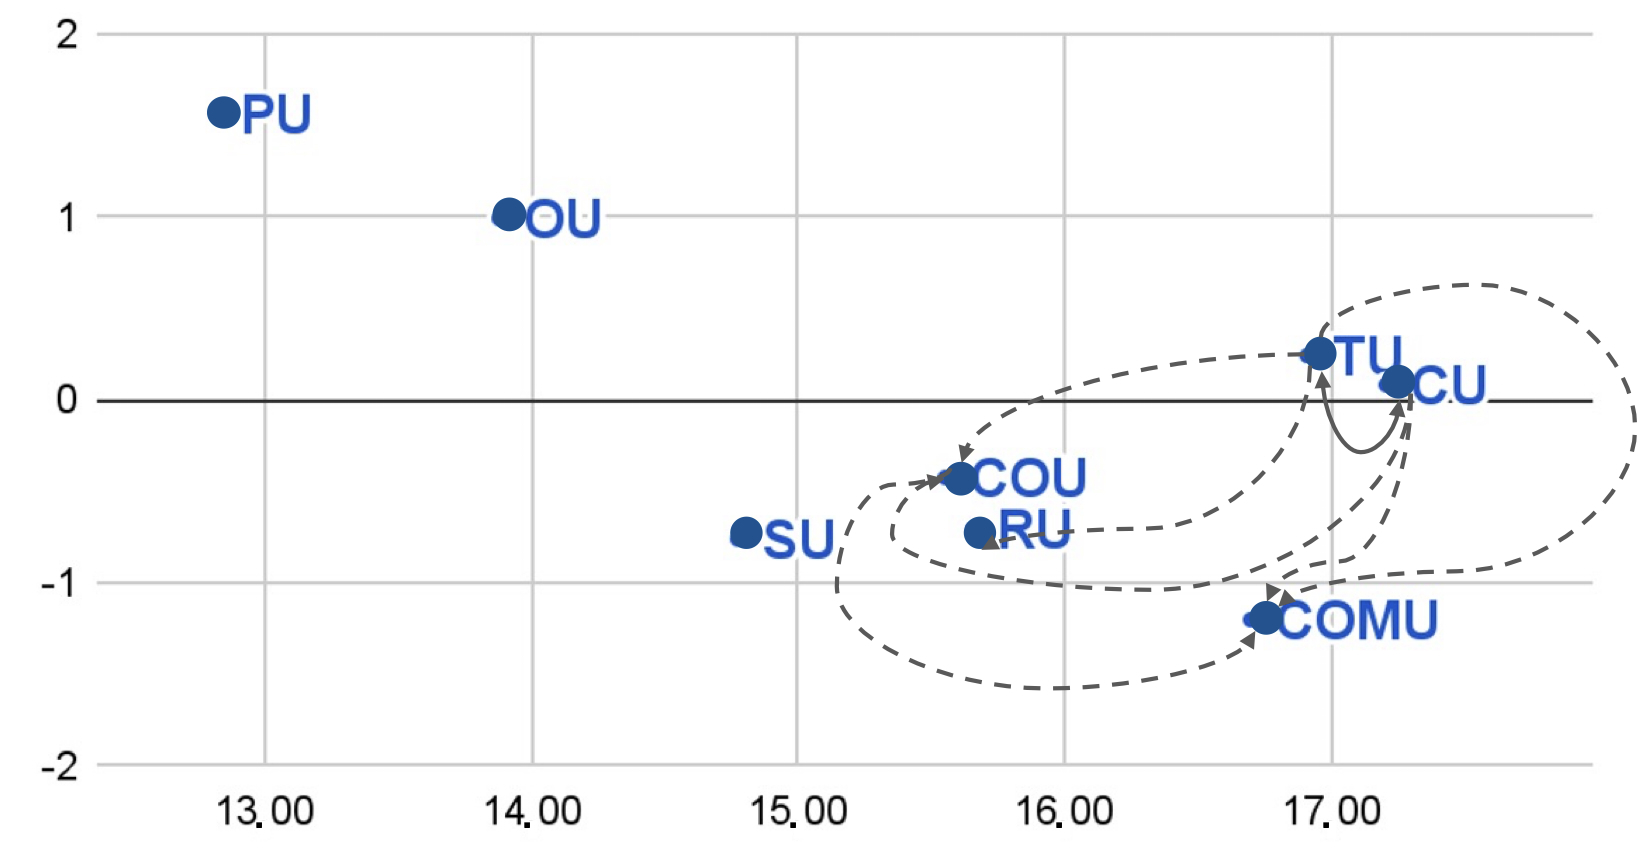
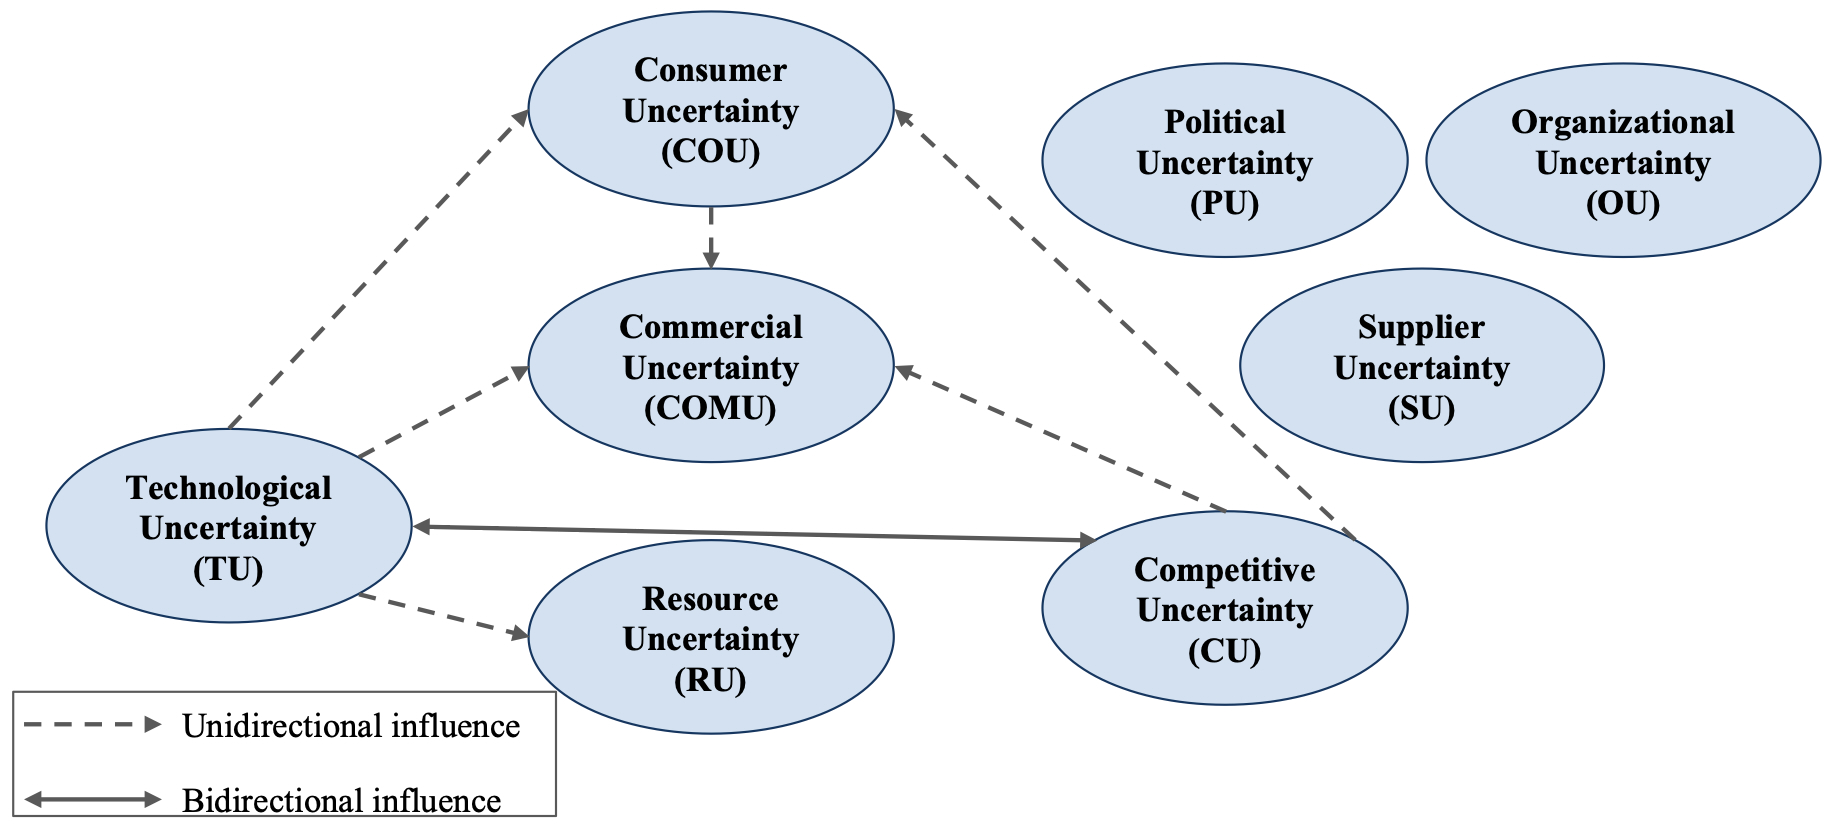
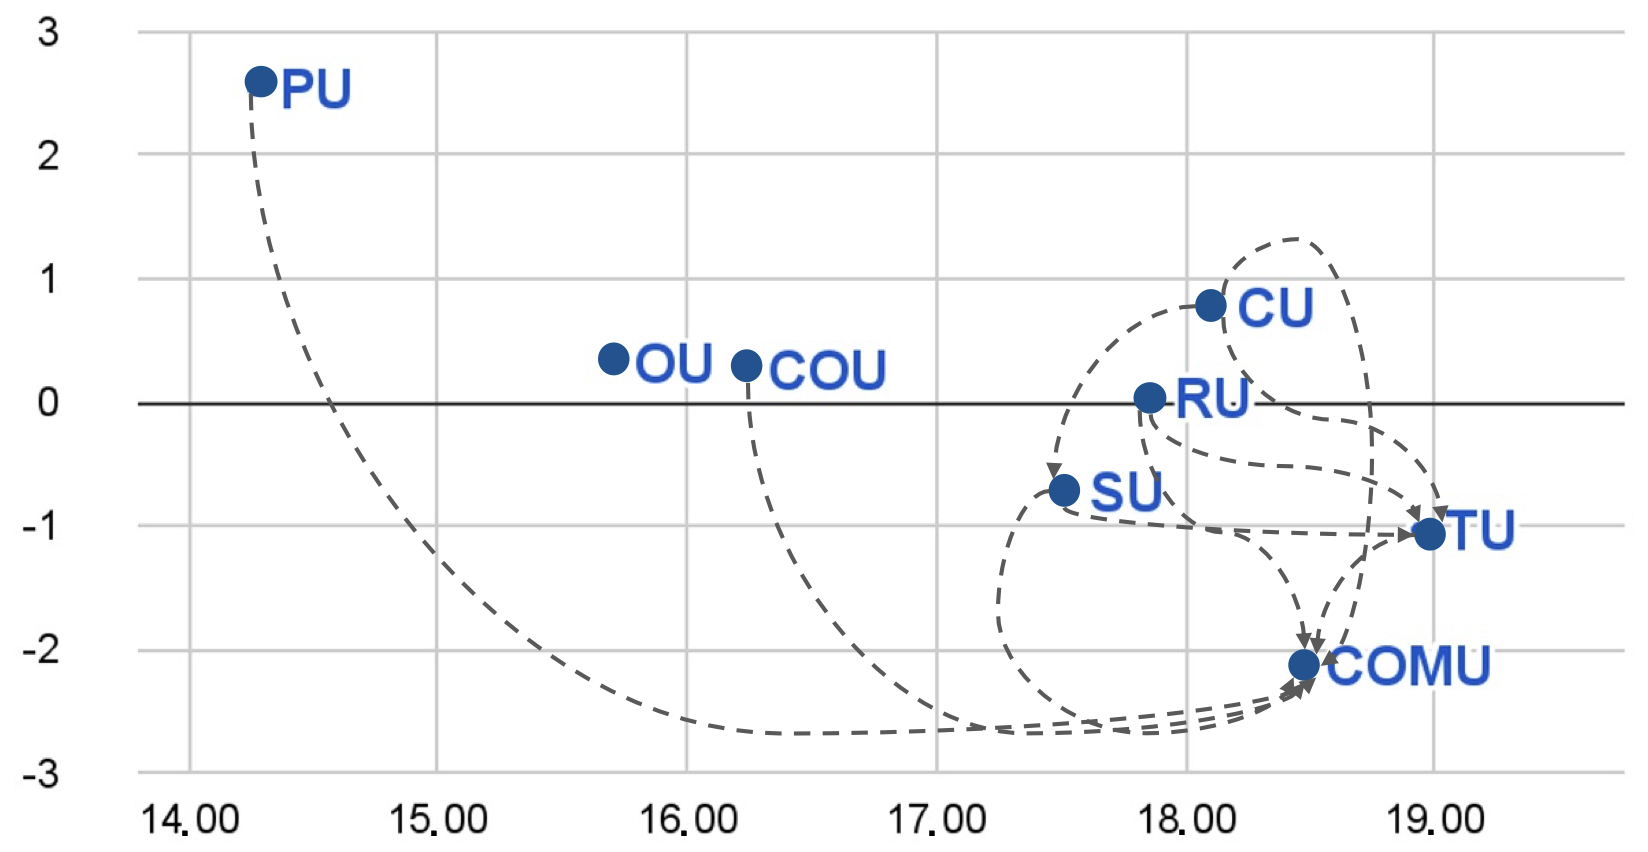
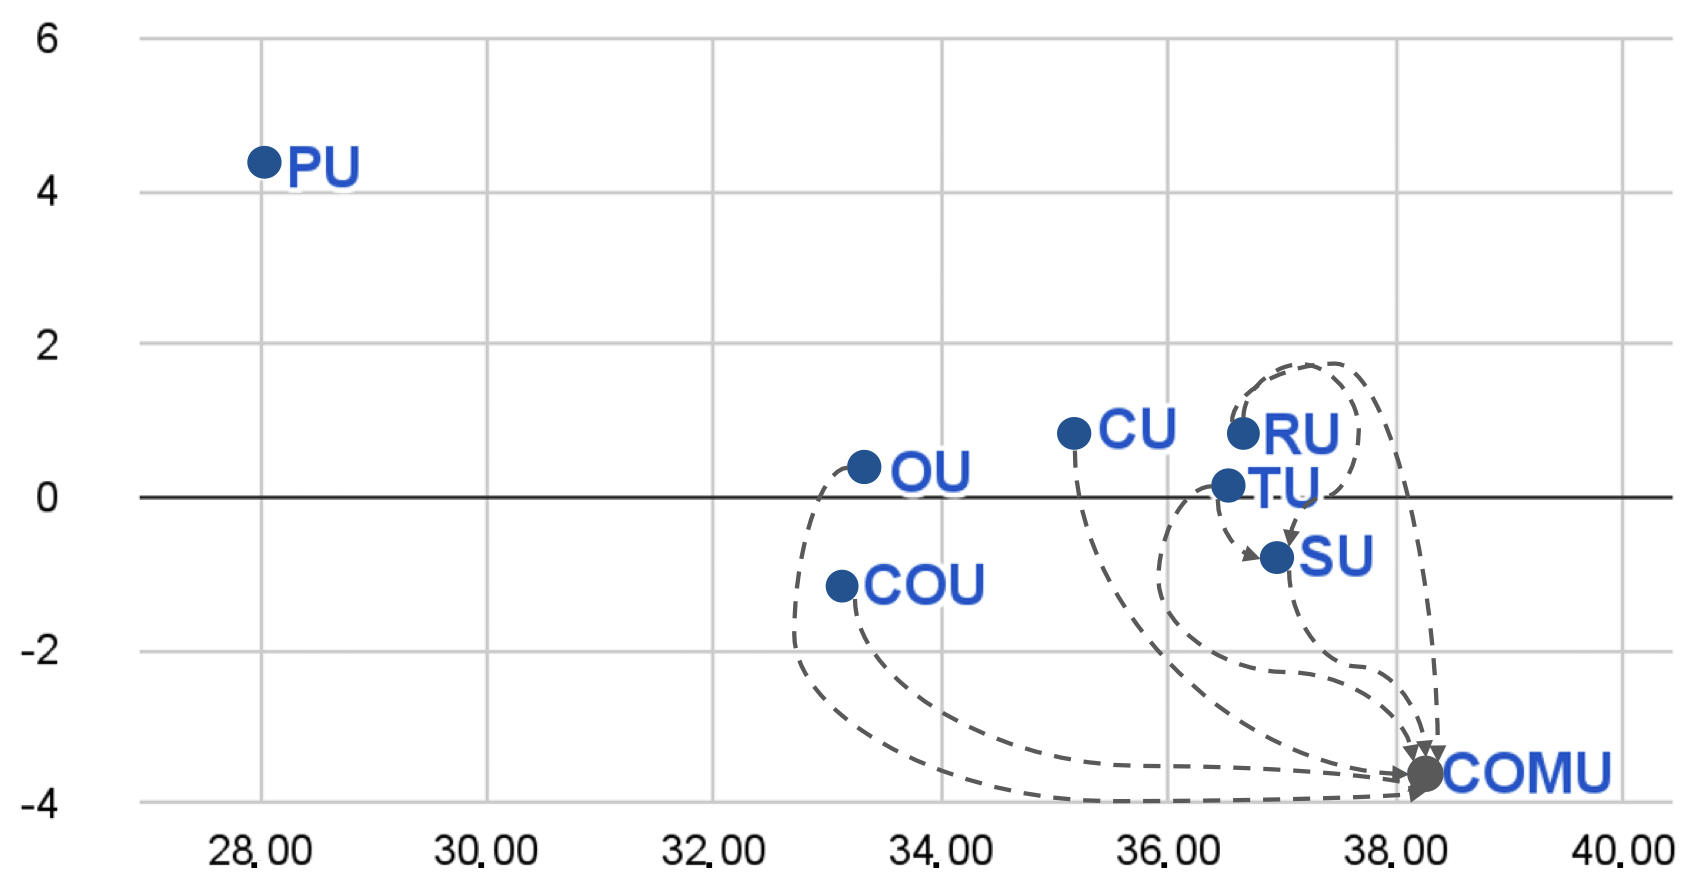
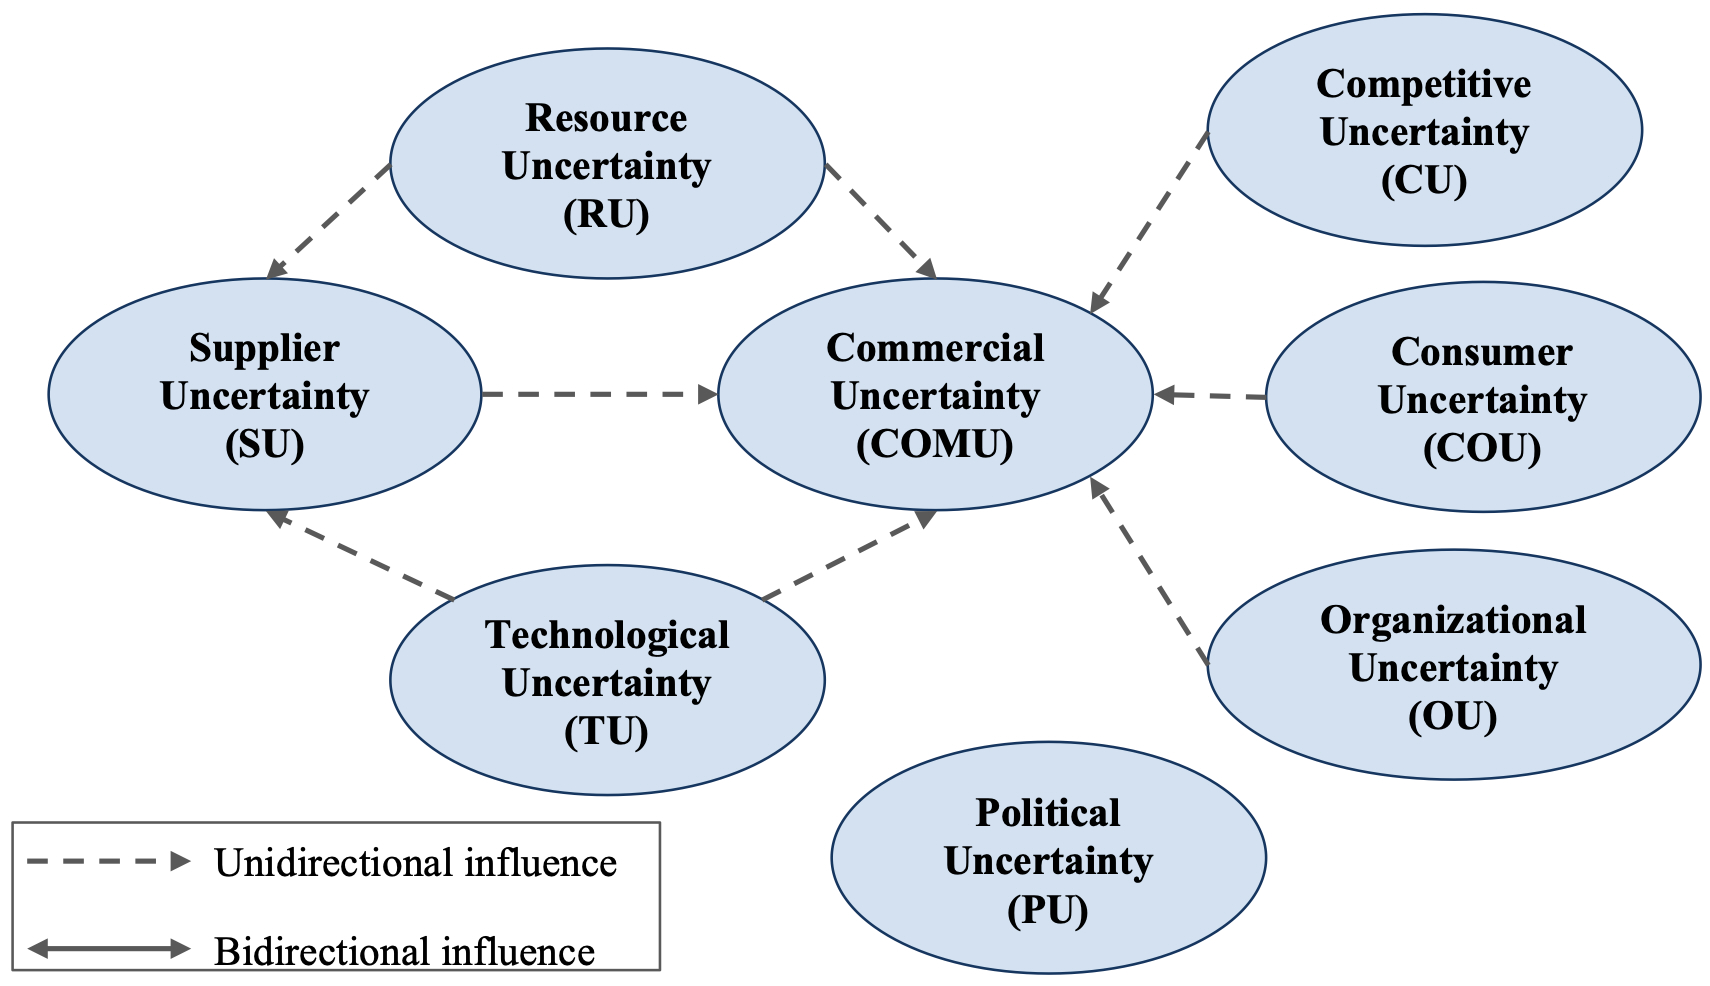
Causal diagrams were constructed for each phase based on the total relationship matrix (T-matrix) presented in Table 8 and the prominence and net cause-effect values summarized in Table 9. In these diagrams, the x-axis represents the overall importance (D+R) of each factor, while arrows indicate the direction and strength of influence. Bilateral influences are represented by solid lines, whereas unilateral influences are depicted with dashed lines. A threshold value of 1.132 (calculated as the average value of the T-matrix elements plus one standard deviation (i.e., 0.156)) was used to determine which influences were significant enough to be included in the diagrams.
Figures 1and 2 illustrate the causal structure of uncertainty factors during the informational phase. Technological and competitive uncertainties emerged as the most prominent and mutually reinforcing factors, exerting bilateral influence not only on each other but also across the broader set of variables. These findings align with the literature, particularly Cowden et al. (2024), who emphasize the dual internal and external nature of technological uncertainty and highlight the critical importance of selecting appropriate technologies in early-stage development, as well as its role in amplifying competitive pressures (Eslami & Melander, 2019; Zhang & Li, 2025). Similarly, Eslami and Melander (2019) and Cowden et al. (2024) underscore the central role of competitive uncertainty in this phase, as early strategic decisions are largely contingent upon accurate interpretations of market dynamics and competitor behaviour (Saisridhar et al., 2024).
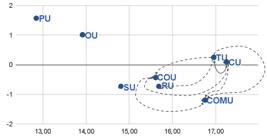
Causal Diagram - Informational Phase. Note: TU technological uncertainty factor, RU resource uncertainty factor, CU competitive uncertainty factor, SU supplier uncertainty factor, COU consumer uncertainty factor, PU political uncertainty factor, OU organizational uncertainty factor, and COMU commercial uncertainty factor.

Conversely, political, organizational, and supplier uncertainties were perceived as having lower influence in the informational phase. Their limited prominence at this stage suggests that external structural or supply-chain-related disruptions may not yet significantly affect decision-making, although their influence may grow in subsequent phases of the development process (Kaufmann & Kock, 2022; Hu et al., 2025).
Figures 3and 4 illustrate the causal relationships among uncertainty factors during the conceptual phase of product development. In this stage, commercial uncertainty is identified as the most influenced factor, receiving input from a variety of other uncertainties. In contrast, competitive and supplier uncertainties emerge as the most influential drivers of other factors within the system. Notably, political uncertainty exerts the strongest influence on commercial uncertainty in this phase, highlighting the growing relevance of external institutional and regulatory conditions.
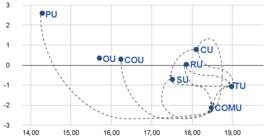
Causal Diagram - Conceptual Phase. Note: TU technological uncertainty factor, RU resource uncertainty factor, CU competitive uncertainty factor, SU supplier uncertainty factor, COU consumer uncertainty factor, PU political uncertainty factor, OU organizational uncertainty factor, and COMU commercial uncertainty factor.
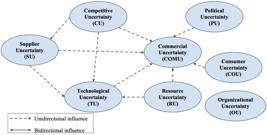
These results are consistent with the observations of Eastwood et al. (2017) and Eslami & Melander (2019), who characterize political uncertainty as an external force shaped by governmental regimes and policy directions that can significantly affect organizational decision-making. Furthermore, commercial uncertainty at this stage is subject to both internal and external influences: internally, it relates to the adequacy of workforce training and organizational readiness; externally, it is shaped by the market viability of the product, including pricing strategies and customer acceptance.
A threshold of 1.266, calculated as the average value of the total relationship matrix plus one standard deviation (0.182), was used to determine the minimum strength required for a relationship to be considered significant in the causal diagrams for this phase.
Figures 5and 6 depict the causal relationships among uncertainty factors in the detailed design phase of the product development process. Notably, commercial uncertainty emerges as the factor most influenced by other uncertainties at this stage, suggesting its centrality in later decision-making. In contrast to earlier phases, technological and resource uncertainties exert the most substantial influence on other factors during this phase. Technological uncertainty continues to play a dominant role, consistent with the findings of Eslami & Melander (2019), who describe this factor as particularly critical from the external perspective of customers, who may lack the expertise to assess the suitability of emerging technologies.
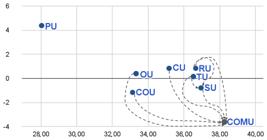
Causal Diagram - Detailed Phase. Note: TU technological uncertainty factor, RU resource uncertainty factor, CU competitive uncertainty factor, SU supplier uncertainty factor, COU consumer uncertainty factor, PU political uncertainty factor, OU organizational uncertainty factor, and COMU commercial uncertainty factor.

Resource uncertainty also stands out as a key influencing factor, aligning with Eastwood et al. (2017), who emphasize concerns regarding the availability and adequacy of raw materials, human resources, and financial capital in later PDP stages. Political uncertainty, though less prominent in earlier phases, becomes a significant antecedent to commercial uncertainty in this phase, illustrating how external regulatory and macroeconomic dynamics can cascade into market viability considerations.
The threshold value used to filter significant causal relationships in the detailed design phase was set at 2.537, derived from the mean of the T-matrix values plus one standard deviation (0.337), ensuring analytical consistency across phases.
Analysing expert perspectives on individual factors within each phase of product development provides valuable insight into the dynamic behaviour of these factors throughout the entire development lifecycle. This approach allows for a granular evaluation of how each factor's influence shifts as the new product progresses from conception to launch.
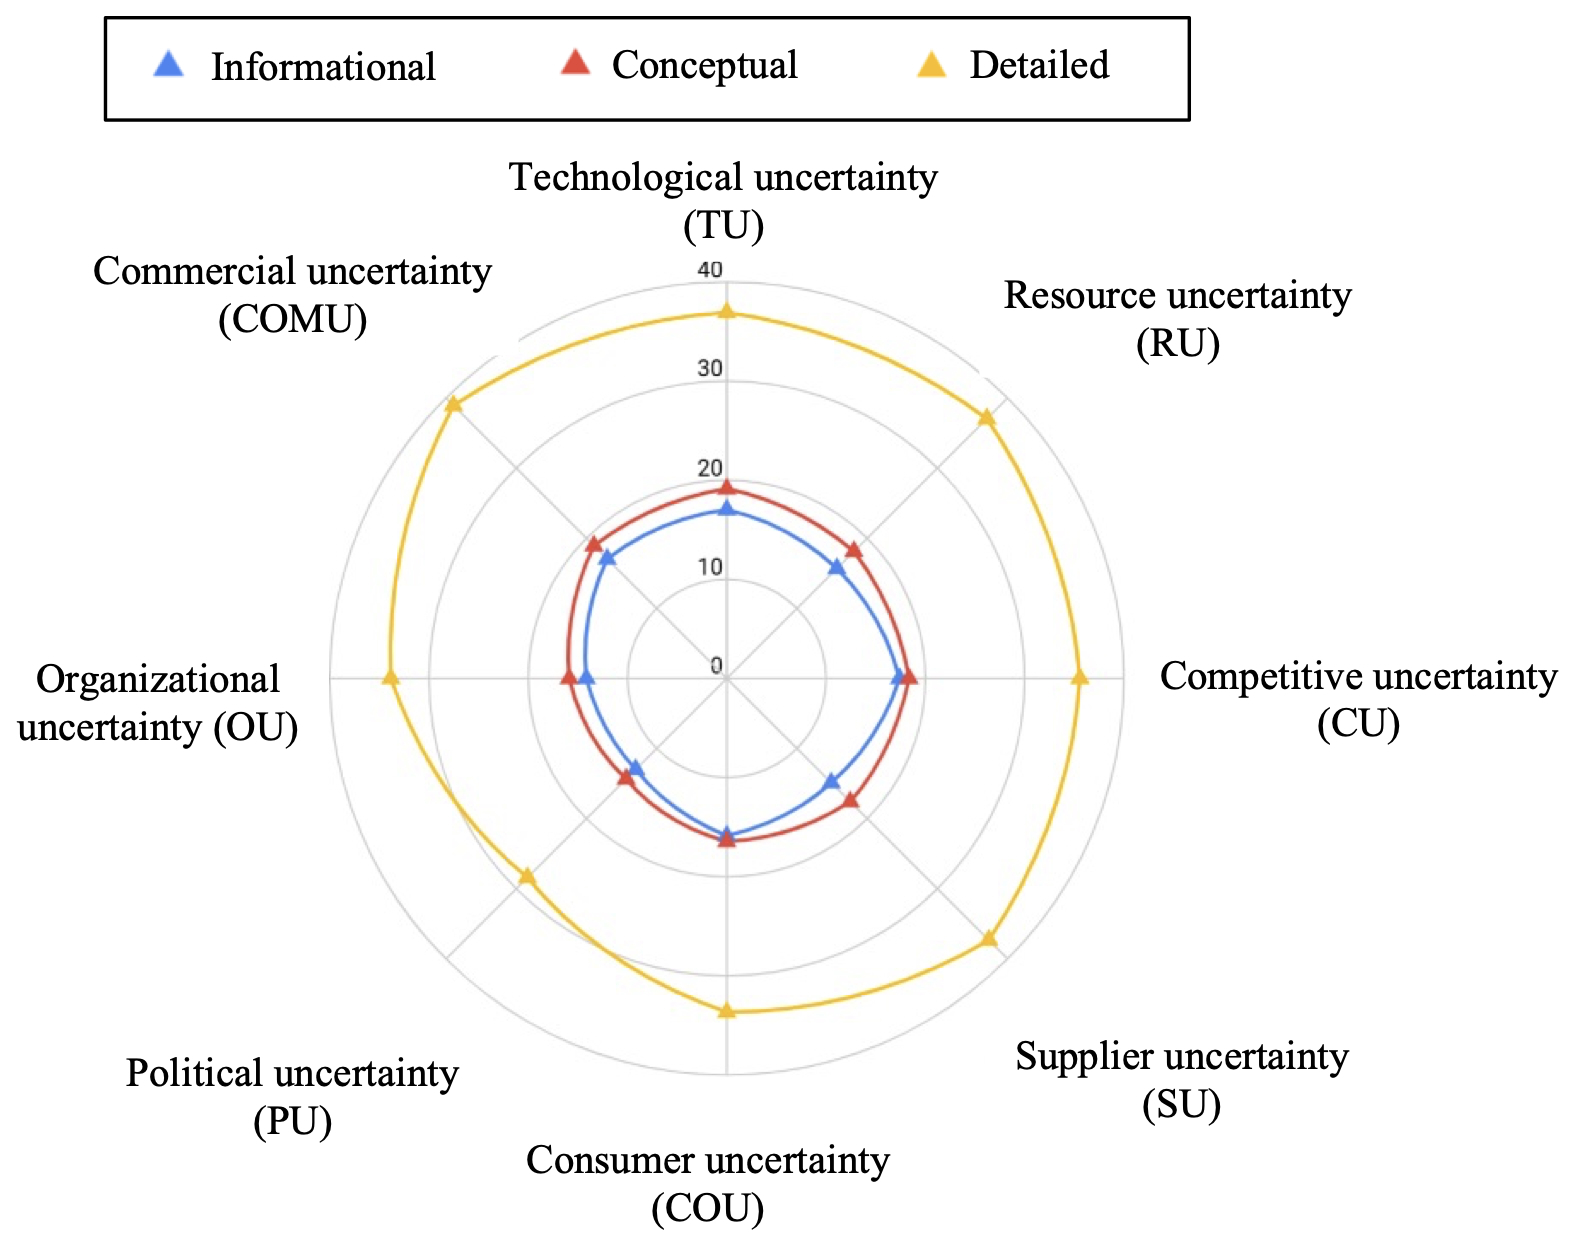
To visualize the cumulative importance of these factors, a methodology involving the summation of D+R vectors (where 'D' and 'R' likely represent specific metrics related to direction and magnitude of impact, respectively) for each phase of development is employed. The resulting aggregate view, illustrated in Figure 7, presents a comprehensive overview of the perceived significance of each factor across the entire PDP. This aggregated representation enables stakeholders to understand the relative weight and contribution of each factor to the overall success of the product development initiative.

Comparative analysis across the three phases reveals that the prominence of uncertainty factors remains relatively similar between the informational and conceptual stages. However, in the detailed design phase, a substantial increase in both the intensity and complexity of interactions among uncertainty factors is observed. This supports the view presented by Zhang and Min (2024), who associate elevated uncertainty with ambiguous requirements, novel design processes, technological development, conflicting stakeholder interpretations, and interdependent activities that characterize the latter stages of product development (Ferguson et al., 2024; Panarotto & Alonso Fernández, 2024).
Ferreira et al. (2024) further reinforces the necessity of integrated problem-solving strategies and early stakeholder involvement to address such uncertainties effectively. In line with these perspectives, the findings of this study suggest that uncertainty management efforts must intensify during the detailed design phase, with greater attention to monitoring, responsiveness, and mitigation mechanisms (Stock et al., 2021; Liew et al., 2024). Table 10 presents factor ranking across PD phases.
5. Discussion
5.1. Theoretical implications
The comprehensive analysis of uncertainty factors throughout the different phases of product development using the DEMATEL method contributes significantly to the theoretical understanding of complexity management within innovation processes. The findings confirm that technological and competitive uncertainties hold substantial influence during the informational phase, exerting bilateral effects (meaning they both impact and are impacted by other factors). This confirms prior assertions by Cowden et al. (2024) and Eslami and Melander (2019), emphasizing the importance of early-stage technological comprehension and market positioning in minimizing overall project risks, particularly under conditions of high technological novelty (Zhang & Li, 2025). The study also elucidates how these uncertainties do not remain static, but instead, they evolve as the project advances, with commercial uncertainty becoming predominant in the conceptual phase and persisting into the detailed phase, mainly due to resource-related concerns (Hu et al., 2025; Ferguson et al., 2024).
By illustrating the dynamic influence and interdependence of these variables via the causal diagrams, this research underscores that managing uncertainties in product development is a complex, multi-dimensional process. The temporal perspective incorporated in this study supports the notion that risk factors must be managed proactively and adaptively across different stages of development, aligning with systems theory and process management paradigms (Bakhshi et al., 2025). The integration of the DEMATEL approach advances existing literature by providing a nuanced, influence-based perspective, highlighting cause-effect relationships that are often overlooked in traditional uncertainty assessments. This contributes to a more comprehensive framework for future research into uncertainty management, emphasizing the need for dynamic, adaptable strategies tailored to each phase.
5.2. Managerial implications
The findings provide practical guidance for managers in product development projects, emphasizing the need for proactive and flexible strategies tailored to stage-specific uncertainties.
In the informational phase, priority should be given to reducing technological and competitive uncertainties through close R&D collaboration, technological scouting, and industry intelligence. Strong knowledge-sharing channels enable early detection of risks, supporting informed decisions and better alignment with external realities.
During the conceptual phase, managers should focus on commercial uncertainty by actively engaging customers, suppliers, and stakeholders. Iterative feedback, market testing, and early prototypes ensure concepts meet market needs, while clear communication and involvement reduce future misalignment risks.
In the detailed phase, resource uncertainty demands rigorous planning, including cost analysis, supply chain assessments, and contingency measures. Diversifying suppliers, maintaining safety stocks, and building flexible manufacturing capabilities help mitigate scarcity, overruns, and delays. Monitoring key influence indicators facilitates timely interventions.
Overall, an adaptive approach, continuously reevaluating uncertainties, promoting agility, cross-functional collaboration, and flexible resource allocation, enhances project success. These strategies improve market alignment, shorten time-to-market, and boost manufacturing efficiency. Early uncertainty management investments deliver lasting benefits in product quality, customer satisfaction, and competitive advantage.
5.3. Limitations and future directions
This study advances the mapping of influence relationships among uncertainties across product development phases, but several limitations must be acknowledged. First, the analysis focuses mainly on internal factors (technological, commercial, and resource uncertainties), without explicitly addressing external variables such as regulatory changes, geopolitical risks, or macroeconomic fluctuations. Including these could offer a more comprehensive risk landscape, particularly in highly dynamic industries. Second, reliance on expert judgment introduces subjectivity and potential biases. While expert elicitation is validated, future studies could integrate quantitative data, like project performance metrics or real-time external factor tracking, to validate and strengthen the model.
Third, the research is confined to early-stage uncertainties, overlooking their impact on later lifecycle phases or inter-phase feedback mechanisms. Longitudinal studies or feedback loop modelling would better reveal how uncertainties propagate or dissipate over time. Additionally, hybrid methodologies, such as combining DEMATEL with simulation models or machine learning, could dynamically simulate uncertainty scenarios and evaluate resilience strategies, allowing virtual testing of mitigation approaches for improved preparedness. Finally, future work should examine sector-specific uncertainty characteristics, as factors differ markedly between high-tech and traditional manufacturing. Extending to multi-organizational contexts would illuminate inter-organizational uncertainty effects on risk management.
6. Conclusion
This study investigates the interrelationships among uncertainty factors during the early phases of the PDP, adopting the DEMATEL method to model causal influences among informational, conceptual, and detailed design uncertainties. The findings show that technological and competitive uncertainties are the most influential drivers in the initial (informational) phase of the PDP. As the process progresses, commercial uncertainty becomes increasingly impacted, especially in the conceptual and detailed design stages. The results suggest a propagation of uncertainty through the PDP, where early-phase uncertainty significantly shapes downstream complexity and risk.
For theoretical implications, this research contributes to the project management literature by advancing a structured understanding of uncertainty in the PDP context. First, by disaggregating uncertainty into three distinct but interconnected phases (i.e., informational, conceptual, and detailed design) it offers a phased-based model for evaluating the cascading effects of uncertainty. Second, it reinforces the systemic nature of uncertainty propagation, showing how early-stage factors (e.g., technological and competitive uncertainty) influence subsequent decision-making and project dynamics. Third, by applying DEMATEL in the context of PDP, the study illustrates the value of systems thinking tools in the analysis of complex project environments.
For practical implications, the study suggests that project managers should prioritize uncertainty mitigation strategies at the early stages of product development, particularly focusing on technological and competitive factors. Proactively managing these influential sources can help reduce the compounding of risk in later stages, where changes are more costly and impactful. Additionally, managers are encouraged to adopt dynamic governance structures that support iterative information flow and cross-functional collaboration across the PDP phases. This enables more agile and informed decision-making, particularly in environments with high innovation intensity or market turbulence. Finally, this work highlights the potential of using multi-criteria decision-making tools, such as DEMATEL, as part of a broader project risk and complexity management framework.
Appendix 1 Table A1 Expert response matrix.
Table A1. Zero signifies no influence, one indicates minimal influence, two denotes moderate influence, three represents substantial influence, and four corresponds to very strong influence.
| INFORMATIONAL PHASE | CONCEPTUAL PHASE | DETAILED PHASE | ||||||||||||||||||||||
|---|---|---|---|---|---|---|---|---|---|---|---|---|---|---|---|---|---|---|---|---|---|---|---|---|
| E1= | 0 | 2 | 3 | 2 | 3 | 1 | 1 | 3 | 0 | 2 | 1 | 3 | 1 | 1 | 1 | 2 | 0 | 2 | 1 | 1 | 1 | 1 | 1 | 2 |
| 1 | 0 | 1 | 1 | 1 | 1 | 1 | 1 | 3 | 0 | 0 | 1 | 1 | 1 | 1 | 1 | 1 | 0 | 0 | 1 | 1 | 1 | 1 | 1 | |
| 1 | 1 | 0 | 1 | 4 | 1 | 1 | 4 | 1 | 0 | 0 | 2 | 2 | 1 | 1 | 3 | 1 | 0 | 0 | 2 | 2 | 1 | 1 | 3 | |
| 3 | 3 | 1 | 0 | 2 | 1 | 1 | 2 | 2 | 3 | 1 | 0 | 2 | 0 | 0 | 2 | 1 | 3 | 1 | 0 | 2 | 0 | 0 | 2 | |
| 2 | 0 | 1 | 0 | 0 | 0 | 0 | 3 | 2 | 1 | 0 | 1 | 0 | 0 | 0 | 3 | 1 | 1 | 0 | 1 | 0 | 0 | 0 | 3 | |
| 2 | 3 | 1 | 1 | 3 | 0 | 0 | 3 | 2 | 3 | 2 | 2 | 1 | 0 | 1 | 3 | 1 | 1 | 2 | 2 | 1 | 0 | 1 | 2 | |
| 1 | 2 | 0 | 1 | 1 | 0 | 0 | 1 | 2 | 2 | 0 | 0 | 1 | 0 | 0 | 1 | 2 | 2 | 0 | 0 | 1 | 0 | 0 | 1 | |
| 0 | 0 | 0 | 0 | 1 | 0 | 0 | 0 | 0 | 0 | 0 | 0 | 1 | 0 | 0 | 0 | 0 | 0 | 0 | 0 | 1 | 0 | 0 | 0 | |
| E2= | 0 | 3 | 4 | 4 | 3 | 2 | 4 | 4 | 0 | 3 | 2 | 4 | 1 | 1 | 3 | 3 | 0 | 2 | 2 | 4 | 2 | 0 | 1 | 3 |
| 4 | 0 | 1 | 2 | 1 | 1 | 1 | 1 | 4 | 0 | 2 | 2 | 0 | 2 | 3 | 2 | 3 | 0 | 1 | 4 | 0 | 2 | 4 | 3 | |
| 3 | 2 | 0 | 2 | 3 | 2 | 1 | 2 | 4 | 1 | 0 | 2 | 3 | 0 | 3 | 2 | 2 | 3 | 0 | 4 | 1 | 0 | 4 | 1 | |
| 2 | 2 | 3 | 0 | 0 | 0 | 1 | 0 | 4 | 3 | 1 | 0 | 0 | 1 | 2 | 2 | 3 | 4 | 3 | 0 | 0 | 1 | 4 | 1 | |
| 3 | 2 | 3 | 0 | 0 | 0 | 3 | 0 | 3 | 1 | 3 | 0 | 0 | 1 | 3 | 4 | 1 | 2 | 3 | 1 | 0 | 0 | 4 | 2 | |
| 2 | 3 | 3 | 3 | 4 | 0 | 3 | 1 | 1 | 3 | 4 | 3 | 3 | 0 | 4 | 1 | 0 | 4 | 1 | 4 | 2 | 0 | 3 | 1 | |
| 1 | 3 | 1 | 1 | 2 | 0 | 0 | 3 | 3 | 2 | 1 | 1 | 1 | 3 | 0 | 1 | 1 | 4 | 0 | 3 | 1 | 3 | 0 | 3 | |
| 3 | 4 | 3 | 3 | 1 | 1 | 1 | 0 | 2 | 1 | 3 | 1 | 2 | 2 | 3 | 0 | 2 | 2 | 4 | 0 | 4 | 1 | 4 | 0 | |
| E3= | 0 | 4 | 4 | 3 | 4 | 1 | 3 | 4 | 0 | 4 | 3 | 4 | 3 | 2 | 3 | 2 | 0 | 4 | 3 | 4 | 3 | 2 | 3 | 2 |
| 4 | 0 | 4 | 3 | 3 | 2 | 3 | 1 | 4 | 0 | 3 | 3 | 3 | 1 | 4 | 2 | 4 | 0 | 3 | 3 | 3 | 1 | 4 | 2 | |
| 4 | 3 | 0 | 3 | 3 | 1 | 3 | 4 | 3 | 3 | 0 | 3 | 3 | 2 | 3 | 3 | 3 | 3 | 0 | 3 | 3 | 2 | 3 | 3 | |
| 3 | 2 | 3 | 0 | 3 | 1 | 1 | 3 | 3 | 3 | 3 | 0 | 3 | 2 | 3 | 3 | 3 | 3 | 3 | 0 | 3 | 2 | 3 | 3 | |
| 2 | 2 | 3 | 3 | 0 | 2 | 3 | 3 | 3 | 1 | 3 | 3 | 0 | 2 | 2 | 3 | 3 | 1 | 3 | 3 | 0 | 2 | 2 | 3 | |
| 1 | 1 | 2 | 1 | 2 | 0 | 2 | 3 | 2 | 2 | 3 | 3 | 3 | 0 | 2 | 4 | 2 | 2 | 3 | 3 | 3 | 0 | 2 | 4 | |
| 3 | 4 | 4 | 3 | 2 | 2 | 0 | 3 | 3 | 3 | 3 | 3 | 2 | 2 | 0 | 3 | 3 | 3 | 3 | 3 | 2 | 2 | 0 | 3 | |
| 3 | 2 | 2 | 3 | 2 | 3 | 2 | 0 | 4 | 2 | 3 | 3 | 3 | 3 | 2 | 0 | 4 | 2 | 3 | 3 | 3 | 3 | 2 | 0 | |
| E4= | 0 | 4 | 3 | 3 | 2 | 1 | 2 | 1 | 0 | 3 | 2 | 3 | 2 | 1 | 2 | 1 | 0 | 2 | 1 | 2 | 1 | 1 | 1 | 1 |
| 4 | 0 | 3 | 3 | 2 | 1 | 2 | 3 | 3 | 0 | 2 | 2 | 1 | 1 | 2 | 2 | 2 | 0 | 1 | 2 | 1 | 1 | 2 | 1 | |
| 3 | 2 | 0 | 3 | 2 | 1 | 2 | 3 | 2 | 2 | 0 | 2 | 1 | 1 | 2 | 2 | 1 | 1 | 0 | 2 | 1 | 1 | 1 | 1 | |
| 4 | 3 | 2 | 0 | 2 | 3 | 2 | 2 | 3 | 2 | 2 | 0 | 2 | 2 | 2 | 2 | 2 | 2 | 1 | 0 | 1 | 1 | 2 | 1 | |
| 3 | 3 | 2 | 3 | 0 | 3 | 2 | 3 | 2 | 2 | 2 | 2 | 0 | 3 | 2 | 2 | 1 | 1 | 1 | 1 | 0 | 1 | 1 | 1 | |
| 1 | 1 | 1 | 2 | 2 | 0 | 2 | 1 | 1 | 1 | 1 | 1 | 2 | 0 | 2 | 2 | 1 | 1 | 1 | 1 | 1 | 0 | 2 | 1 | |
| 3 | 3 | 3 | 3 | 2 | 2 | 0 | 3 | 2 | 2 | 2 | 2 | 2 | 1 | 0 | 2 | 2 | 2 | 2 | 1 | 1 | 1 | 0 | 2 | |
| 2 | 3 | 2 | 3 | 3 | 1 | 2 | 0 | 2 | 2 | 1 | 2 | 2 | 1 | 1 | 0 | 1 | 1 | 1 | 1 | 1 | 1 | 1 | 0 | |
| E5= | 0 | 2 | 3 | 2 | 4 | 2 | 2 | 2 | 0 | 4 | 3 | 3 | 1 | 2 | 2 | 2 | 0 | 4 | 2 | 4 | 2 | 2 | 2 | 3 |
| 2 | 0 | 3 | 2 | 1 | 3 | 3 | 1 | 4 | 0 | 2 | 3 | 2 | 3 | 3 | 2 | 4 | 0 | 3 | 4 | 2 | 2 | 4 | 2 | |
| 3 | 3 | 0 | 2 | 4 | 4 | 3 | 3 | 3 | 2 | 0 | 3 | 2 | 3 | 2 | 4 | 2 | 3 | 0 | 1 | 3 | 1 | 1 | 3 | |
| 2 | 2 | 2 | 0 | 1 | 1 | 2 | 2 | 3 | 3 | 3 | 0 | 2 | 1 | 1 | 3 | 4 | 4 | 1 | 0 | 2 | 3 | 3 | 2 | |
| 4 | 1 | 4 | 1 | 0 | 4 | 2 | 4 | 1 | 2 | 2 | 2 | 0 | 2 | 1 | 3 | 2 | 2 | 3 | 2 | 0 | 2 | 1 | 4 | |
| 2 | 3 | 4 | 1 | 4 | 0 | 2 | 4 | 2 | 3 | 3 | 1 | 2 | 0 | 2 | 1 | 2 | 2 | 1 | 3 | 2 | 0 | 3 | 1 | |
| 2 | 3 | 3 | 2 | 2 | 2 | 0 | 2 | 2 | 3 | 2 | 1 | 1 | 2 | 0 | 1 | 2 | 4 | 1 | 3 | 1 | 3 | 0 | 2 | |
| 2 | 1 | 3 | 2 | 4 | 4 | 2 | 0 | 2 | 2 | 4 | 3 | 3 | 1 | 1 | 0 | 3 | 2 | 3 | 2 | 4 | 1 | 2 | 0 | |
| E6= | 0 | 2 | 2 | 3 | 1 | 0 | 0 | 2 | 0 | 3 | 2 | 4 | 1 | 0 | 0 | 2 | 0 | 1 | 2 | 1 | 1 | 0 | 0 | 2 |
| 1 | 0 | 1 | 2 | 0 | 0 | 0 | 3 | 3 | 0 | 2 | 2 | 2 | 1 | 0 | 4 | 1 | 0 | 2 | 2 | 1 | 0 | 0 | 3 | |
| 2 | 1 | 0 | 0 | 3 | 0 | 3 | 4 | 3 | 2 | 0 | 1 | 3 | 0 | 3 | 4 | 2 | 1 | 0 | 0 | 3 | 0 | 2 | 4 | |
| 1 | 1 | 1 | 0 | 1 | 0 | 1 | 1 | 2 | 2 | 2 | 0 | 0 | 0 | 0 | 3 | 1 | 2 | 1 | 0 | 1 | 0 | 0 | 2 | |
| 0 | 1 | 3 | 0 | 0 | 3 | 0 | 4 | 0 | 3 | 3 | 0 | 0 | 1 | 0 | 4 | 0 | 1 | 3 | 0 | 0 | 1 | 0 | 3 | |
| 1 | 1 | 2 | 2 | 4 | 0 | 2 | 3 | 2 | 1 | 1 | 2 | 2 | 0 | 1 | 3 | 0 | 1 | 1 | 1 | 2 | 0 | 0 | 3 | |
| 1 | 1 | 4 | 2 | 1 | 0 | 0 | 1 | 2 | 2 | 4 | 2 | 1 | 0 | 0 | 1 | 0 | 1 | 1 | 1 | 1 | 0 | 0 | 1 | |
| 2 | 3 | 4 | 2 | 3 | 3 | 1 | 0 | 2 | 2 | 3 | 2 | 4 | 2 | 1 | 0 | 1 | 1 | 2 | 1 | 4 | 1 | 0 | 0 | |
| E7= | 0 | 4 | 0 | 4 | 1 | 2 | 1 | 4 | 0 | 4 | 0 | 4 | 1 | 2 | 1 | 4 | 0 | 4 | 0 | 4 | 1 | 2 | 1 | 4 |
| 4 | 0 | 2 | 4 | 1 | 1 | 4 | 4 | 4 | 0 | 2 | 4 | 1 | 1 | 4 | 4 | 4 | 0 | 2 | 4 | 1 | 1 | 4 | 4 | |
| 3 | 0 | 0 | 2 | 4 | 1 | 2 | 4 | 3 | 0 | 0 | 2 | 4 | 1 | 2 | 4 | 3 | 0 | 0 | 2 | 4 | 1 | 2 | 4 | |
| 4 | 4 | 1 | 0 | 1 | 0 | 1 | 3 | 4 | 4 | 1 | 0 | 1 | 0 | 1 | 3 | 4 | 4 | 1 | 0 | 1 | 0 | 1 | 3 | |
| 1 | 1 | 4 | 1 | 0 | 0 | 3 | 4 | 1 | 1 | 4 | 1 | 0 | 0 | 3 | 4 | 1 | 1 | 4 | 1 | 0 | 0 | 3 | 4 | |
| 1 | 1 | 2 | 2 | 1 | 0 | 1 | 1 | 1 | 1 | 2 | 2 | 1 | 0 | 1 | 1 | 1 | 1 | 2 | 2 | 1 | 0 | 1 | 1 | |
| 3 | 3 | 2 | 3 | 1 | 0 | 0 | 4 | 3 | 3 | 2 | 3 | 1 | 0 | 0 | 4 | 3 | 3 | 2 | 3 | 1 | 0 | 0 | 4 | |
| 4 | 1 | 4 | 2 | 4 | 0 | 0 | 0 | 4 | 1 | 4 | 2 | 4 | 0 | 0 | 0 | 4 | 1 | 4 | 2 | 4 | 0 | 0 | 0 | |
| E8= | 0 | 2 | 1 | 1 | 2 | 1 | 1 | 1 | 0 | 2 | 1 | 1 | 2 | 1 | 2 | 3 | 0 | 2 | 2 | 2 | 3 | 1 | 1 | 2 |
| 2 | 0 | 2 | 1 | 2 | 1 | 1 | 4 | 2 | 0 | 2 | 1 | 1 | 1 | 2 | 3 | 2 | 0 | 2 | 2 | 1 | 1 | 1 | 1 | |
| 2 | 3 | 0 | 4 | 1 | 4 | 2 | 3 | 2 | 3 | 0 | 4 | 3 | 2 | 3 | 3 | 2 | 1 | 0 | 3 | 1 | 1 | 1 | 3 | |
| 4 | 1 | 1 | 0 | 2 | 2 | 1 | 3 | 4 | 1 | 1 | 0 | 2 | 1 | 1 | 2 | 3 | 1 | 1 | 0 | 2 | 1 | 1 | 3 | |
| 2 | 2 | 3 | 3 | 0 | 2 | 1 | 4 | 2 | 2 | 3 | 3 | 0 | 1 | 2 | 2 | 1 | 1 | 2 | 2 | 0 | 1 | 1 | 3 | |
| 1 | 2 | 2 | 3 | 1 | 0 | 1 | 2 | 1 | 2 | 2 | 3 | 1 | 0 | 1 | 3 | 1 | 1 | 2 | 1 | 2 | 0 | 1 | 4 | |
| 1 | 3 | 1 | 1 | 1 | 1 | 0 | 1 | 1 | 3 | 1 | 2 | 1 | 1 | 0 | 3 | 1 | 2 | 1 | 2 | 1 | 1 | 0 | 2 | |
| 3 | 3 | 3 | 3 | 2 | 2 | 2 | 0 | 3 | 3 | 3 | 2 | 2 | 3 | 3 | 0 | 2 | 1 | 3 | 3 | 3 | 4 | 2 | 0 | |
| E9= | 0 | 3 | 3 | 3 | 3 | 3 | 2 | 2 | 0 | 2 | 2 | 3 | 2 | 2 | 2 | 2 | 0 | 2 | 2 | 2 | 2 | 3 | 3 | 3 |
| 2 | 0 | 3 | 2 | 2 | 3 | 3 | 2 | 2 | 0 | 2 | 2 | 2 | 2 | 2 | 2 | 1 | 0 | 2 | 2 | 2 | 2 | 2 | 2 | |
| 2 | 3 | 0 | 2 | 3 | 1 | 2 | 2 | 2 | 2 | 0 | 2 | 3 | 3 | 2 | 2 | 2 | 2 | 0 | 2 | 3 | 3 | 3 | 2 | |
| 2 | 2 | 3 | 0 | 3 | 2 | 3 | 2 | 2 | 2 | 3 | 0 | 3 | 2 | 2 | 2 | 2 | 3 | 3 | 0 | 2 | 2 | 2 | 2 | |
| 2 | 1 | 2 | 2 | 0 | 2 | 2 | 2 | 2 | 2 | 2 | 3 | 0 | 2 | 3 | 3 | 2 | 2 | 2 | 2 | 0 | 3 | 3 | 3 | |
| 1 | 2 | 2 | 2 | 2 | 0 | 2 | 2 | 2 | 2 | 2 | 3 | 2 | 0 | 2 | 3 | 3 | 2 | 2 | 2 | 2 | 0 | 3 | 1 | |
| 3 | 3 | 2 | 3 | 3 | 3 | 0 | 2 | 2 | 2 | 2 | 2 | 3 | 3 | 0 | 3 | 2 | 2 | 3 | 2 | 2 | 2 | 0 | 3 | |
| 2 | 2 | 3 | 2 | 2 | 2 | 2 | 0 | 2 | 1 | 1 | 1 | 2 | 2 | 2 | 0 | 3 | 2 | 1 | 2 | 2 | 2 | 2 | 0 | |
Data availability
No research data was used.
-
How to cite this article:
Rezende, D. G., Quirino, M., Neiva, C. S., Marcuzzo, R., Bouzon, M., & Forcellini, F. A. (2026). Managing uncertainty in product development and manufacturing integration: a multi-criteria, multi-phase evaluation. Production, 36, e20250133. https://doi.org/10.14488/0103-6513.20250133
-
Financial Support
This study was financed in part by the Coordenação de Aperfeiçoamento de Pessoal de Nível Superior - Brasil (CAPES) - Finance Code 001 – through the Programa de Excelência Acadêmica (PROEX).
-
Ethical Statement
The research conducted does not require approval by an ethics committee, in accordance with Article 1 of CNS Resolution No. 510/2016, as it involves only the opinions of experts.
References
-
Abanda, F. H., Jian, N., Adukpo, S., Tuhaise, V. V., & Manjia, M. B. (2025). Digital twin for product versus project lifecycles’ development in manufacturing and construction industries. Journal of Intelligent Manufacturing, 36(2), 801-831. https://doi.org/10.1007/s10845-023-02301-2
» https://doi.org/10.1007/s10845-023-02301-2 -
Ali, M. A., & Rafique, Q. (2024). Strategic integration of real options for enhanced valuation and optimization in mining project planning under uncertainty: a comprehensive review. International Journal of Project Management, 6(2), 26-50. https://doi.org/10.47672/ijpm.2004
» https://doi.org/10.47672/ijpm.2004 -
Amajuoyi, P., Benjamin, L. B., & Adeusi, K. B. (2024). Agile methodologies: Adapting product management to rapidly changing market conditions. GSC Advanced Research and Reviews, 19(2), 249-267. https://doi.org/10.30574/gscarr.2024.19.2.0181
» https://doi.org/10.30574/gscarr.2024.19.2.0181 -
Bakhshi, J., Golzad, H., Martek, I., Hosseini, M. R., & Papadonikolaki, E. (2025). Unveiling the complexity code: Navigating BIM-enabled projects with a project management complexity index. Engineering, Construction, and Architectural Management, 32(11), 7703-7732. https://doi.org/10.1108/ECAM-07-2023-0702
» https://doi.org/10.1108/ECAM-07-2023-0702 -
Brinkmann, J. T., & Wynn, D. C. (2025). Aspects of information maturity in design and development. Research in Engineering Design, 36(2), 8. https://doi.org/10.1007/s00163-025-00450-4
» https://doi.org/10.1007/s00163-025-00450-4 -
Browning, T. R., & Koch, J. (2025). Exploring the process of manufacturing change management. IEEE Transactions on Engineering Management, 72, 3599-3620. https://doi.org/10.1109/TEM.2025.3597572
» https://doi.org/10.1109/TEM.2025.3597572 -
Butturi, M. A., Neri, A., Mercalli, F., & Gamberini, R. (2025). Sustainability-oriented innovation in the textile manufacturing industry: pre-consumer waste recovery and circular patterns. Environments (Basel, Switzerland), 12(3), 82. https://doi.org/10.3390/environments12030082
» https://doi.org/10.3390/environments12030082 -
Campos, E. A. R., Tavana, M., Schwengber ten Caten, C., Bouzon, M., & Carísio de Paula, I. (2021). A grey-DEMATEL approach for analyzing factors critical to the implementation of reverse logistics in the pharmaceutical care process. Environmental Science and Pollution Research International, 28(11), 14156-14176. https://doi.org/10.1007/s11356-020-11138-8 PMid:33206293.
» https://doi.org/10.1007/s11356-020-11138-8 -
Cowden, B., Karami, M., Tang, J., Ye, W., & Adomako, S. (2024). The spectrum of perceived uncertainty and entrepreneurial orientation: Impacts on effectuation. Journal of Small Business Management, 62(1), 381-414. https://doi.org/10.1080/00472778.2022.2051179
» https://doi.org/10.1080/00472778.2022.2051179 -
Dalvi-Esfahani, M., Niknafs, A., Kuss, D. J., Nilashi, M., & Afrough, S. (2019). Social media addiction: Applying the DEMATEL approach. Telematics and Informatics, 43, 101250. https://doi.org/10.1016/j.tele.2019.101250
» https://doi.org/10.1016/j.tele.2019.101250 -
Dalvi-Esfahani, M., Nilashi, M., Abumalloh, R. A., Thurasamy, R., & Ahmad, M. S. (2025). Investigating the interrelationships between the barriers of green computing adoption: TISM-MICMAC-DEMATEL method. Quality & Quantity, 59(Suppl. 1), 507-570. https://doi.org/10.1007/s11135-024-01977-9
» https://doi.org/10.1007/s11135-024-01977-9 -
Darestani, S. A., Ganji, M., & Imannezhad, R. (2020). What are the key determinants of maintenance performance? Production, 30, e20190155. https://doi.org/10.1590/0103-6513.20190155
» https://doi.org/10.1590/0103-6513.20190155 -
Dinh Khoa, V., & Mai Anh, N. T. (2024). Examining the relationship between supply chain integration, innovation speed and supply chain performance under demand uncertainty. Engineering Management Journal, 36(1), 14-29. https://doi.org/10.1080/10429247.2023.2174766
» https://doi.org/10.1080/10429247.2023.2174766 -
Eastwood, C., Klerkx, L., & Nettle, R. (2017). Dynamics and distribution of public and private research and extension roles for technological innovation and diffusion: case studies of the implementation and adaptation of precision farming technologies. Journal of Rural Studies, 49, 1-12. https://doi.org/10.1016/j.jrurstud.2016.11.008
» https://doi.org/10.1016/j.jrurstud.2016.11.008 -
Eslami, M., & Melander, L. (2019). Exploring uncertainties in collaborative product development: Managing customer-supplier collaborations. Journal of Engineering and Technology Management, 53, 49-62. https://doi.org/10.1016/j.jengtecman.2019.05.003
» https://doi.org/10.1016/j.jengtecman.2019.05.003 -
Ferguson, S., Brahma, A., Eckert, C., & Isaksson, O. (2024). Managing and modelling margins in design as a means for confronting the challenges of a disruptive world. Journal of Engineering Design, 35(10), 1185-1192. https://doi.org/10.1080/09544828.2024.2414130
» https://doi.org/10.1080/09544828.2024.2414130 -
Ferreira, L. M. D., Moreira, A. C., & Silva, P. (2024). Lean implementation in product development processes: a framework proposal. Production Planning and Control, 35(15), 1927-1943. https://doi.org/10.1080/09537287.2023.2217429
» https://doi.org/10.1080/09537287.2023.2217429 -
Hu, J., Liu, Z., & Shi, Y. (2025). An integrated process-oriented framework of low-carbon manufacturing networks: Evidence from multiple cases. Production Planning and Control, 37(4), 315-333. https://doi.org/10.1080/09537287.2025.2541329
» https://doi.org/10.1080/09537287.2025.2541329 -
Huynh-Cam, T. T., Nalluri, V., Chen, L. S., White, J., Nguyen, T. H., Nguyen, V. C., & Lu, T. C. (2024). DT-fuzzy DEMATEL: a new method for determining important factors for student satisfaction with e-course adoption in a Vietnamese university. Journal of Applied Research in Higher Education, 18(1), 99-120. https://doi.org/10.1108/JARHE-04-2024-0173
» https://doi.org/10.1108/JARHE-04-2024-0173 -
Jugend, D., & Silva, S. L. (2014). Product-portfolio management: a framework based on methods, organization, and strategy. Concurrent Engineering, 22(1), 17-28. http://dx.doi.org/10.1177/1063293X13508660
» http://dx.doi.org/10.1177/1063293X13508660 -
Kao, P. J., Dacko, S., & Hu, Y. (2026). Unraveling the complexity of radical service innovation: a systematic review, integrative framework, and research roadmap. Journal of Business Research, 202, 115754. https://doi.org/10.1016/j.jbusres.2025.115754
» https://doi.org/10.1016/j.jbusres.2025.115754 -
Kaufmann, C., & Kock, A. (2022). Does project management matter? The relationship between project management effort, complexity, and profitability. International Journal of Project Management, 40(6), 624-633. https://doi.org/10.1016/j.ijproman.2022.05.007
» https://doi.org/10.1016/j.ijproman.2022.05.007 -
Liew, C. F., Prakash, J., & Ong, K. S. (2024). Equipment cost efficiency: a comprehensive metric for evaluating operational and financial performance in manufacturing. Manufacturing Letters, 39, 16-19. https://doi.org/10.1016/j.mfglet.2023.12.002
» https://doi.org/10.1016/j.mfglet.2023.12.002 -
Marin, R. O., & Kaminski, P. C. (2020). Open innovation integration to product development: a sector level analysis within the manufacturing industry. Production, 30, e20200012. https://doi.org/10.1590/0103-6513.20200012
» https://doi.org/10.1590/0103-6513.20200012 -
Moerth-Teo, O., de Neufville, R., Suh, E. S., & Ramsauer, C. (2025). Practical incorporation of lifecycle flexibility into products at their early development stage. Research in Engineering Design, 36(3), 1-17. https://doi.org/10.1007/s00163-025-00448-y
» https://doi.org/10.1007/s00163-025-00448-y -
Nalluri, V., Chowdary, K. M., & Chen, L. S. (2025). Risk evaluation in the implementation of sustainable measures in the supply chain operations: a Fuzzy Delphi-DEMATEL approach. Cleaner Logistics and Supply Chain, 17, 100262. https://doi.org/10.1016/j.clscn.2025.100262
» https://doi.org/10.1016/j.clscn.2025.100262 -
Ortega, J. L., & Delgado-Quirós, L. (2024). The indexation of retracted literature in seven principal scholarly databases: a coverage comparison of dimensions, OpenAlex, PubMed, Scilit, Scopus, The Lens and Web of Science. Scientometrics, 129(7), 3769-3785. https://doi.org/10.1007/s11192-024-05034-y
» https://doi.org/10.1007/s11192-024-05034-y -
Ortiz-Barrios, M., Miranda-Dela Hoz, C., López-Meza, P., Petrillo, A., & De Felice, F. (2020). A case of food supply chain management with AHP, DEMATEL, and TOPSIS. Journal of Multi-Criteria Decision Analysis, 27(1-2), 104-128. https://doi.org/10.1002/mcda.1693
» https://doi.org/10.1002/mcda.1693 -
Panarotto, M., & Alonso Fernández, I. (2024). Local absorption of uncertainty in complex systems using resilient objects. Journal of Engineering Design, 35(10), 1292-1310. https://doi.org/10.1080/09544828.2024.2327913
» https://doi.org/10.1080/09544828.2024.2327913 -
Patel, S., Liu, Y., Siddique, Z., & Ghamarian, I. (2024). Metal additive manufacturing: Principles and applications. Journal of Manufacturing Processes, 131, 1179-1201. https://doi.org/10.1016/j.jmapro.2024.09.101
» https://doi.org/10.1016/j.jmapro.2024.09.101 -
Petronijevic, J., Etienne, A., & Siadat, A. (2022). Global risk assessment for development processes: from framework to simulation. International Journal of Production Research, 60(24), 7214-7238. https://doi.org/10.1080/00207543.2021.2023912
» https://doi.org/10.1080/00207543.2021.2023912 -
Restrepo, J. A., Giraldo, E. A., & Vanegas, J. G. (2025). Measuring the production performance indicators for metal-mechanic industry: an LDA modeling approach. International Journal of Productivity and Performance Management, 74(1), 1-23. https://doi.org/10.1108/IJPPM-04-2023-0201
» https://doi.org/10.1108/IJPPM-04-2023-0201 - Romeiro, E., Ferreira, C. V., & Cauchik, P. A. (2013). Projeto do produto USA: Elsevier.
-
Saisridhar, P., Thuerer, M., & Avittathur, B. (2024). Assessing supply chain responsiveness, resilience and robustness (Triple-R) by computer simulation: A systematic review of the literature. International Journal of Production Research, 62(4), 1458-1488. https://doi.org/10.1080/00207543.2023.2180302
» https://doi.org/10.1080/00207543.2023.2180302 -
Sallum, F. S. V., Gomes, L. F. A. M., & Machado, M. A. S. (2018). A dematel-topsis-wings approach to the classification of multimarket investment funds. Independent Journal of Management & Production, 9(4), 1203-1234. https://doi.org/10.14807/ijmp.v9i4.822
» https://doi.org/10.14807/ijmp.v9i4.822 -
Schmidt, F. C., Lopes, A. P. V. B. V., & Loures, E. R. (2023). A production system for the auto parts industry with elements of Industry 4.0. Production, 33, e20220005. https://doi.org/10.1590/0103-6513.20220005
» https://doi.org/10.1590/0103-6513.20220005 -
Shabani, R., Malvik, T. O., Johansen, A., & Torp, O. (2023). Dealing with uncertainties in the design phase of road projects. International Journal of Managing Projects in Business, 16(8), 27-57. https://doi.org/10.1108/IJMPB-02-2022-0050
» https://doi.org/10.1108/IJMPB-02-2022-0050 -
Stock, G. N., Tsai, J. C.-A., Jiang, J. J., & Klein, G. (2021). Coping with uncertainty: knowledge sharing in new product development projects. International Journal of Project Management, 39(1), 59-70. https://doi.org/10.1016/j.ijproman.2020.10.001
» https://doi.org/10.1016/j.ijproman.2020.10.001 -
Thakkar, J. J. (2021). Decision-Making Trial and Evaluation Laboratory (DEMATEL). In J. J. Thakkar. Multi-criteria decision making (Studies in Systems, Decision and Control, 336). USA: Springer. https://doi.org/10.1007/978-981-33-4745-8_9
» https://doi.org/10.1007/978-981-33-4745-8_9 -
Varandas Junior, A., & Miguel, P. A. C. (2012). Análise do processo de preparação da produção no desenvolvimento de novos produtos por meio de um estudo de caso em uma empresa do setor siderúrgico. Production, 22(2), 185-200. https://doi.org/10.1590/S0103-65132012005000012
» https://doi.org/10.1590/S0103-65132012005000012 -
Zhang, C., & Li, S. (2025). Different forms of supplier involvement, knowledge orchestration capability, technological uncertainty and new product development performance: a test of three-way interaction. European Journal of Innovation Management, 28(4), 1527-1554. https://doi.org/10.1108/EJIM-07-2023-0544
» https://doi.org/10.1108/EJIM-07-2023-0544 -
Zhang, Z., & Min, M. (2024). Why project managers’ knowledge hiding is harmful to NPD projects: Resilient team resource caravans as an explanatory mechanism. International Journal of Operations & Production Management, 44(12), 2013-2035. https://doi.org/10.1108/IJOPM-01-2023-0018
» https://doi.org/10.1108/IJOPM-01-2023-0018 -
Zio, E. (2025). Advances in reliability analysis and risk assessment for enhanced safety. Journal of Reliability Science and Engineering, 1(1), 013002. https://doi.org/10.1088/3050-2454/adbc65
» https://doi.org/10.1088/3050-2454/adbc65
Edited by
-
Editor(s):
Antonio Cezar BorniaMadalena AraújoPaulo Afonso