
 Physiology and production components of cowpea under salt stress and chitosan application
ABSTRACT
Cowpea (Vigna unguiculata (L.) Walp.) is one of the main grain crops that form part of Brazilian food consumption, but its production is affected by edaphoclimatic conditions and high salinity of the irrigation water. The aim of this research was to evaluate the effects of chitosan concentrations on the physiology and production components of cowpea grown under salt stress. The experiment was conducted in a greenhouse, adopting a completely randomized design, in a 2 × 5 factorial scheme, with two levels of electrical conductivity of irrigation water (ECw - 0.6 and 4.0 dS m-1) and five concentrations of chitosan (0, 0.25, 0.50, 0.75, and 1.00 g L-1), with four replicates, each of which consisting of three plants. Irrigation water with electrical conductivity of 4.0 dS m-1 negatively affected the synthesis of photosynthetic pigments, chlorophyll a fluorescence, and grain production of cowpea cv. BRS Tapaihum. Foliar application of chitosan at concentrations between 0.46 and 0.71 g L-1 mitigated the deleterious effects of salt stress on photochemical efficiency, grain production, and grain index per plant. Chitosan applications under irrigation water of electrical conductivity of 0.6 dS m-1 promoted an increase in the mean pod length, grain production and grain index of cowpea plants cv. BRS Tapaihum.
Key words:
Vigna unguiculata; production; salinity
HIGHLIGHTS:
Salinity affects leaf physiology and production of cowpea.
Foliar application of chitosan mitigates the adverse effects of salinity.
Chitosan improves water use efficiency of cowpea plants under salinity.
RESUMO
O feijão-caupi (Vigna unguiculata (L.) Walp.) é um dos principais grãos que fazem parte do consumo alimentar dos brasileiros, no entanto, sua produção é afetada pelas características edafoclimáticas e pela alta salinidade da água de irrigação. Objetivou-se com a pesquisa avaliar os efeitos das concentrações de quitosana na fisiologia e produção de feijão-caupi sob estresse salino. O experimento foi realizado em casa de vegetação em Campina Grande, PB, utilizando-se o delineamento inteiramente casualizado, em esquema fatorial 2 × 5, sendo dois níveis de condutividade elétrica da água de irrigação (CEa - 0,6 e 4,0 dS m-1) e cinco concentrações de quitosana (0; 0,25; 0,50; 0,75 e 1,00 g L-1) com quatro repetições cada uma consistindo de três plantas. A irrigação com água de condutividade elétrica de 4,0 dS m-1 afetou negativamente a síntese de pigmentos fotossintéticos, a fluorescência da clorofila a e a produção de grãos de feijão-caupi cultivar BRS Tapaihum. A aplicação foliar de quitosana entre as concentrações de 0,46 e 0,71 g L-1 amenizou os efeitos do estresse salino, aumentando a eficiência fotoquímica, a produção e o índice de grãos por planta. As aplicações de quitosana sob água de irrigação com condutividade elétrica de 0,6 dS m-1 promoveram aumento no comprimento médio da vagem, produção de grãos e índice de grãos das plantas de feijão-caupi cv. BRS Tapaihum.
Palavras-chave:
Vigna unguiculata; produção; salinidade
Introduction
Cowpea (Vigna unguiculata (L.) Walp.) originates from Central America and stands out in family farming for being one of the most representative crops. It is a fundamental food for low-income populations, in addition to acting as a source of proteins, essential amino acids, carbohydrates, vitamins, and minerals (Nascimento et al., 2024). Brazil is the world’s third largest producer, only behind Nigeria and Niger (CONAB, 2021).
The practice of irrigation allows agricultural production throughout the year; however, in the Northeast region of Brazil, water restrictions in terms of quality and quantity make crops dependent on irrigation, which often is carried out with water of high salt content. Water sources consist of artesian wells that have high concentrations of soluble salts, which can limit production as salt stress reduces water availability to plants (Lima et al., 2022). Furthermore, excess salts in irrigation water can cause soil degradation due to salt accumulation. Currently, 20% of cultivated land is affected by salts, and it is estimated that, in about 30 years, this proportion could increase to 50%, because of climate change and human action (Ge et al., 2022).
The effect of salts can also lead to a reduction in the osmotic potential of the soil solution, inducing the closure of stomata and reductions in transpiration and CO2 assimilation rate, in addition to causing pigment degradation and lipid peroxidation of membranes (Ramos et al., 2022). Therefore, it is crucial to use strategies that enable the use of saline waters in agriculture. These strategies include the use of eliciting substances, such as the application of chitosan (Alfonso et al., 2017), a linear unbranched polymer of β-1,4-d-glucosamine that can effectively reduce the deleterious effects of salt stress and increase the synthesis of photosynthetic pigments, plant growth, and yield (Alfonso et al., 2017).
In this context, foliar application of chitosan at adequate concentrations can attenuate the deleterious effects caused by irrigation with saline waters on the physiology and production components of cowpea. The aim of this research was to evaluate the effects of chitosan concentrations on the physiology and production components of cowpea grown under salt stress.
Material and Methods
The experiment was conducted from March to May 2023 in a greenhouse, belonging to the Academic Unit of Agricultural Engineering (UAEA) of the Universidade Federal de Campina Grande (UFCG), in Campina Grande city, Paraíba state, Brazil (7° 15’ 18’’ S, 35° 52’ 28” W, with an average altitude of 550 m). The greenhouse used was arched, with length of 30 m, width of 21 m, ceiling height of 3.0 m, and low-density polyethylene cover (150 microns). During the experimental period, average temperature (maximum = 29.36 °C, mean = 24.19 °C, and minimum = 21.26 °C) and relative air humidity (85.96%) were recorded in the internal area of the greenhouse.
Treatments consisted of two levels of electrical conductivity of irrigation water (ECw - 0.6 and 4.0 dS m-1) and five concentrations of chitosan (0 - control, 0.25, 0.50, 0.75, and 1.00 g L-1), distributed in a completely randomized design, in a 2 × 5 factorial arrangement, with four replicates and three plants per plot, totaling 40 experimental units.
Salinity levels were adapted from studies conducted by Barbosa et al. (2021), and chitosan concentrations were adapted from the study conducted by Mulaudzi et al. (2022) with sorghum (Sorghum bicolor L. Moench). Chitosan solutions were applied by foliar spraying.
Pots of 10 L capacity were used as drainage lysimeters, perforated at the base to allow drainage, and connected to transparent drains. To facilitate drainage, a geotextile fabric and a 0.3-kg layer of crushed stone (No. 0) were placed to prevent clogging by the soil material. A plastic polyethylene bottle with 2 L capacity was placed below each drain to collect drained water to estimate plant water consumption.
The soil used to fill the lysimeters, classified as Entisol (United States, 2014), came from the municipality of Lagoa Seca, PB, Brazil (0-30 cm depth). Chemical and physical attributes of the soil (Table 1) were determined according to the methodology of Teixeira et al. (2017).
Sowing was carried out using four seeds of BRS Tapaihum cowpea per pot, distributed equidistantly, at a standard depth of 3 cm. Fifteen days after emergence, thinning was carried out, leaving one plant per pot.
Fertilization with NPK was carried out according to the fertilization recommendation of Novais et al. (1991), applying 100, 300, and 150 mg kg-1 soil of N, P2O5 and K2O, respectively, using urea (45% N), monoammonium phosphate (12% N; 54% P2O5) and KCl (60% K2O), via fertigation performed fortnightly, divided into three applications throughout the cycle (13, 38, and 43 days after sowing - DAS), applying 1.5, 4.5, and 2.25 g of N, P and K, respectively.
As a source of micronutrients, Dripsol Micro® was applied every 15 days at a concentration of 1.0 g L-1, containing: Ca (1%), Mg (1.4%), S (2.7%), Zn (0.5%), B (0.05%), Fe (0.5%), Mn (0.05%), Cu (0.5%), and Mo (0.02%), following the manufacturer’s recommendation. On average, 100 mL of the solution was applied per application.
The brackish waters were prepared by dissolving NaCl, CaCl2.2H2O, and MgCl2.6H2O salts in the local-supply water (0.4 dS m-1) in the equivalent ratio of 7:2:1, a ratio that is predominant in the main sources of water used for irrigation in the Brazilian Northeast (Silva Júnior et al., 1999), following the relationship between ECw and the concentration of salts (Richards, 1954) according to Eq. 1.
Where:
Q - concentration of salts (mmolc L-1); and,
ECw - electrical conductivity of irrigation water (dS m-1).
After preparation, the waters were calibrated by checking their electrical conductivity with an electrical conductivity meter (TECNOPON®). For irrigation management, local-supply water (0.4 dS m-1) was used up to 17 DAS; after this period, waters with different levels of electrical conductivity, according to treatment, began to be used.
Irrigation was carried out daily, applying to each pot the volume determined by the water balance in the root zone through the drainage lysimetry method (Bernardo et al., 2009).
The volumes of water used for irrigation during the research were noted to determine the water consumed by the plants, as can be seen in Table 2.
Chitosan powder manufactured by the Originalis® Biotech Company, with 1.31% of total ash and 86.12% of deacetylation degree, was used in the experiment. The chitosan solution was prepared at the time of application by dissolving in 0.1 M acetic acid (6 mL L-1) with the aid of a magnetic stirrer (Centauro®) and then diluted to 0.25, 0.50, 0.75, and 1.00 g L-1 using distilled water and adhesive spreader in the proportion of 0.5 mL L-1; however, for the controls (0 g L-1), foliar application was not performed. Foliar applications began at 05:00 p.m., carried out at 15, 30, and 45 DAS, by spraying the adaxial and abaxial sides of the leaves with a manual pet bottle sprayer (Fertak®), using an average volume of 35.62 mL per plant applied according to each concentration.
At 45 DAS, photosynthetic pigments, and chlorophyll a fluorescence were analyzed. Water use efficiency, and production components of cowpea plants cv. BRS Tapaihum were determined at 60 DAS.
Contents of photosynthetic pigments (chlorophyll a, chlorophyll b, chlorophyll total, and carotenoids) were determined according to Arnon (1949). Chlorophyll extraction was performed in containers with 8 mL of 80% acetone and using leaf samples with a defined weight after collection, which were then kept in the dark and in a refrigerator for 48 hours, due to the great oxidation undergone by the leaves. The leaf discs were collected at 06:00 a.m., and chlorophyll a, chlorophyll b, chlorophyll total, and carotenoid contents were quantified by emission spectrophotometry at 470, 646, and 663 nm of absorbance (ABS), respectively, and calculated using Eqs. 2, 3, 4 and 5:
The values obtained for the contents of chlorophyll a, chlorophyll b, chlorophyll total, and carotenoids (Car) in the leaves were expressed in μg mL-1.
For the chlorophyll a fluorescence analyses, the following parameters were determined: initial fluorescence (F0), maximum fluorescence (Fm), variable fluorescence, and quantum efficiency of photosystem II (Fv/Fm), using the Hansatech PEA instrument. These analyses were performed by placing clips on the leaves and reading the values after 30 min of adaptation to the dark.
Production components were determined according to the harvesting methodology recommended by Oliveira et al. (2015). At 60 DAS, dry pods of each pot were collected, and the following variables were evaluated: number of pods per plant (NPP); average pod length (APL), measured in cm in five pods taken at random from each plot; number of grains per pod (NGP), according to the count obtained from the average of five pods taken at random; grain production (GP), determined by the total production of grains in each plant, in g per plant; and the grain index (GI), which was determined from the ratio between the dry mass of grains and pods, according to Eq. 6, with sampling of five pods per plant. The same pods were used for APL, NGP, and GI.
Where:
MG - mass of grains collected in five pods (g); and,
MP - total mass of five pods (g).
Water use efficiency (g m-3) was determined by the ratio between total grain production per plant (g per plant) and water consumed (m3) per plant, according to Eq. 7.
Where:
WUE - water use efficiency (g m-3);
GPP - grain production per plant (g); and,
WC - water consumed per plant (m3).
The data obtained were subjected to the normality test (Shapiro-Wilk test) and homogeneity test (Bartlett test), and then to analysis of variance by the F test (p ≤ 0.05). Variables that were significantly affected by salinity were subjected to the means comparison test (F test), whereas those significantly affected by chitosan concentrations and the interaction between the two factors (electrical conductivity of the irrigation water and chitosan concentrations) were analyzed using polynomial regression analysis (linear and quadratic), using SISVAR 5.6 computer software (Ferreira, 2019).
Results and Discussion
The individual factors, as well as the interaction between the levels of electrical conductivity of irrigation water and the chitosan concentrations, influenced (p ≤ 0.01) all the variables of photosynthetic pigments of cowpea at 45 days after sowing (Table 3).
Cowpea plants (Figure 1A) irrigated with water of 0.6 dS m-1 at chitosan concentration of 0.53 g L-1 obtained the highest value of chlorophyll a (1890.63 μg mL-1), corresponding to an increase of 64.05% (738.13 μg mL-1) compared to those irrigated with the same ECw level and without application of chitosan (0 g L-1). There was also no difference between plants irrigated with ECw of 0.6 and 4.0 dS m-1 when subjected to chitosan concentrations of 0 and 1.0 g L-1.

Chlorophyll a (A), chlorophyll b (B), total chlorophyll (C), and carotenoids (D) of cowpea plants, as a function of the electrical conductivity of irrigation water (ECw) and foliar applications of chitosan, 45 days after sowing
For plants cultivated under irrigation using water with electrical conductivity of 4.0 dS m-1, the regression models adopted (y (4.0 dS m -1 ) = 1125.3 - 1676nsx + 1752.1**x2 R2 = 0.33) did not fit satisfactorily (R2 < 0.60) to the data of chlorophyll a (Figure 1A).
Knowing that chitosan is a natural amino polysaccharide, Zou et al. (2018) discovered that exogenous polysaccharides are able to increase the Chl a content in leaves of wheat seedlings grown under salt stress. However, the results obtained in this study reveal that the application of chitosan did not attenuate the effects of salt stress on the chlorophyll content in cowpea leaves. However, the beneficial effect of chitosan was obtained up to the estimated concentration of 0.53 g L-1 in plants irrigated with ECw of 0.6 dS m-1. According to Zou et al. (2018), it has been suggested that exogenous application of chitosan could relieve abiotic stress by increasing chlorophyll concentration, decreasing stomatal and non-stomatal transpiration, as well as improving water use efficiency. Zhang et al. (2021), in a study evaluating lettuce (Lactuca sativa L.) under salt stress (100 mM NaCl), observed that foliar application of chitosan at concentration of 100 mg L-1 resulted in an increase in Chl a content of 10.09% (0.75 μg mL-1) when compared to plants without chitosan application. However, for cowpea plants, it was not possible to obtain such promising results.
Chitosan up to the concentration of 0.61 g L-1 increased the synthesis of Chl b (974.67 μg mL-1) in plants irrigated with ECw of 0.6 dS m-1 (Figure 1B), corresponding to an increase of 141.73% (571.47 μg mL-1) compared to plants irrigated with the same salinity level (0.6 dS m-1) and without the application of chitosan.
However, for the ECw level of 4.0 dS m-1 the highest value was observed at the concentration of 1.0 g L-1 (867.99 μg mL-1). It is worth mentioning that there was no difference between plants irrigated with ECw of 0.6 and 4.0 dS m-1 when subjected to chitosan concentrations of 0.75 and 1.00 g L-1 (Figure 1B).
For total chlorophyll (Figure 1C), the highest value observed with ECw of 0.6 dS m-1 was obtained at the concentration of 0.56 g L-1 (2858.6 μg mL-1), while for ECw of 4.0 dS m-1, the highest value was obtained at the concentration of 1.00 g L-1. Also, there was no difference in tChl at the chitosan concentrations of 0 (without application) and 1.0 g L-1 between the two ECw levels.
For plants cultivated under irrigation using water with electrical conductivity of 4.0 dS m-1, the regression models adopted (y (4.0 dS m -1 ) = 1808.7 - 2272.6**x + 2533.3**x2 R² = 0.56) did not fit satisfactorily (R2 < 0.60) to the data of tChl (Figure 1C).
Foliar spraying of chitosan at concentration of 1.0 g L-1 under ECw of 4.0 dS m-1 resulted in the highest Car content - 179.59 μg mL-1 (Figure 1D), which represents an increase of 9.25% (15.2 μg mL-1) compared to the value obtained in the control without chitosan application (164.39 μg mL-1). Also, there was no significant difference between ECw levels when plants were subjected to chitosan concentration of 1.0 g L-1, thus demonstrating the beneficial effect of chitosan when applied at adequate concentrations.
For plants cultivated under irrigation using water with electrical conductivity of 0.6 dS m-1, the regression models adopted (y (0.6 dS m -1 ) = 211.35 + 42.067nsx - 39.771**x2 R2 = 0.02) did not fit satisfactorily (R2 < 0.60) to the data of carotenoids (Figure 1D).
Chlorophyll degradation under salt stress is generally related to the increase in the activity of the enzyme chlorophyllase, as reported by Oliveira et al. (2018), who observed that, as ECw levels increase, the contents of chlorophyll a, chlorophyll b and total chlorophyll decreased in cowpea. However, in the present study, such a reduction was observed only for the values of Car.
Foliar application of chitosan at concentration of 1.0 g L-1 caused no significant effect on Chl a, Chl b, tChl, and Car contents between the two ECw levels; however, at other concentrations, under an ECw level of 4.0 dS m-1, there was no protective effect of chitosan, which may be due to the degradation of chlorophyll under salt stress, which is generally related to the accumulation of reactive oxygen species (ROS), which causes lipid peroxidation of chloroplast membranes (Zou et al., 2018).
The interaction between the levels of electrical conductivity of irrigation water and chitosan concentrations affected (p ≤ 0.01) the initial fluorescence (F0) and quantum efficiency of photosystem II (Fv/Fm) of cowpea leaves (Table 4). Similarly, chitosan concentrations alone had a significant effect on F0 and Fv/Fm, while ECw levels alone affected (p ≤ 0.01) all chlorophyll fluorescence variables studied.
Summary of the analysis of variance for initial fluorescence (F0), maximum fluorescence (Fm), variable fluorescence (Fv), and maximum quantum efficiency of photosystem II (Fv/Fm) of cowpea plants irrigated with water of different electrical conductivity levels and foliar application of chitosan, 45 days after sowing
Increase in chitosan concentrations caused a linear reduction in the initial fluorescence (F0) of 5.57% per unit increment (Figure 2A) for plants irrigated with ECw of 0.6 dS m-1. On the other hand, for plants irrigated with ECw of 4.0 dS m-1, the chitosan concentration of 1.0 g L-1 stood out negatively for promoting the highest value of F0 (93.49). When comparing plants subjected to ECw levels of 0.6 and 4.0 dS m-1 under the same chitosan concentration (1.00 g L-1), a difference of 9.39% (8.79) is observed. Also, plants sprayed with 0.25 g L-1 did not differ significantly, regardless of the ECw levels, demonstrating the beneficial effect of chitosan at adequate concentrations.

Initial fluorescence - F0 (A) and quantum efficiency of photosystem II - Fv/Fm (D) of cowpea plants as a function of electrical conductivity of irrigation water (ECw) and chitosan concentrations, and maximum fluorescence - Fm (B) and variable fluorescence - Fv (C) of cowpea plants as a function of ECw, 45 days after sowing
However, for Fm (Figure 2B), there was a reduction of 6.55% (33.01) as the ECw level increased. Salt stress limited the absorption of energy in the light reaction centers, probably due to the excessive accumulation of specific ions, resulting in an imbalance in the metabolic activity of the plant, leading to the formation of reactive oxygen species, which in turn limit the energetic activity of photosynthetic pigments (Saddiq et al., 2021).
A similar effect was also observed by Fernandes et al. (2022), who found a 14.59% reduction in the Fm of sugar apple plants irrigated with ECw of 4.0 dS m-1 compared to those irrigated with ECw of 1.3 dS m-1. According to these authors, this reduction in Fm can be explained by the action of excess salts in the photoreduction of quinone and thylakoid membranes as a consequence of the entry of electrons into the photosystem.
Similarly, the increase in ECw level resulted in a reduction of 8.38% (34.91) in Fv (Figure 2C). As it is active potential energy in the photosystem, this reduction indicates a limitation in the activation of the electron transport chain, which is responsible for generating energy in the form of ATP and NADPH for the Calvin cycle, resulting in a decrease in the photosynthetic capacity of the plant (Lotfi et al., 2020). Similar results were observed by Silva et al. (2022) when analyzing the photochemical efficiency of soursop plants (Annona muricata L.) cv. Morada Nova irrigated with brackish waters, which showed a reduction of 17.41% in Fv when cultivated under ECw of 4.0 dS m-1 compared to those that received 0.8 dS m-1.
For the quantum efficiency of photosystem II (Fv/Fm) (Figure 2D), the increase in chitosan concentrations up to 0.71 g L-1 under ECw level of 0.6 dS m-1 stood out for promoting the highest value (0.83), representing an increase of 2.68% (0.02) when compared with plants in the control treatment (without application). On the other hand, for the ECw of 4.0 dS m-1, the highest value was observed in plants sprayed with a chitosan concentration of 0.45 g L-1 (0.78). At all chitosan concentrations, Fv/Fm values under ECw of 4.0 dS m-1 were lower than those obtained under ECw of 0.6 dS m-1.
The reduction in photochemical efficiency due to the increase in the electrical conductivity of irrigation water may be related to the inhibition of the breakdown of the water molecule to obtain the essential electrons in the photochemical phase of photosynthesis, besides reducing the concentration of photosynthetic pigments, such as chlorophyll (Oliveira et al., 2018).
Fv/Fm values between 0.75 and 0.85 are considered to be normal in non-stressed plants (Dias et al., 2018), so in the present study, there was no damage to the photosynthetic apparatus of cowpea plants with the increase in the salinity of the water used in irrigation, as the value obtained was on average 0.77.
Geng et al. (2020) reported that changes in photochemical efficiency (Fv/Fm) in leaves of creeping bentgrass (Agrostis stolonifera), evaluated under salt stress and chitosan concentrations (100, 200, 500, 1000, and 2000 mg L-1), caused a decline in Fv/Fm when the creeping bentgrass was subjected only to salt stress. However, there was a significant increase in Fv/Fm under treatment with chitosan, suggesting that creeping bentgrass is sensitive to salt stress, but the application of chitosan improves its tolerance.
According to the analysis of variance (Table 5), ECw, chitosan concentration, and the interaction between these factors influenced (p ≤ 0.01) the variables number of pods per plant (NPP), average pod length (APL), number of grains per pod (NGP), total grain production per plant (GP), and grain index (GI) (p ≤ 0.01 interaction, p ≤ 0.05 for chitosan and not affected by ECw) of cowpea plants, 60 days after sowing.
Summary of the analysis of variance for the number of pods per plant (NPP), average pod length (APL), number of grains per pod (NGP), total grain production per plant (GP), and grain index (GI) of cowpea plants under different levels of electrical conductivity of irrigation water and chitosan concentrations, 60 days after sowing
Increase in chitosan concentrations caused a linear reduction in the number of pods per plant (NPP), equal to 18.28% per unit increment (Figure 3A), when plants were irrigated with ECw of 0.6 dS m-1. While for the ECw of 4.0 dS m-1, the increase in chitosan concentrations resulted in a linear reduction in NPP, of 2.61% per unit increment.

Number of pods per plant (A), average pod length (B) and number of grains per pod (C) of cowpea plants as a function of the electrical conductivity of irrigation water (ECw) and foliar applications of chitosan, 60 days after sowing
For plants cultivated under irrigation using water with electrical conductivity of 4.0 dS m-1, the regression models adopted (y (4.0 dS m -1 ) = 5.0646 - 0.1316**x R2 = 0.41) did not fit satisfactorily (R2 < 0.60) to the data of NPP (Figure 3A).
There was also a reduction of 53.06% (5.72) in the NPP of plants irrigated with ECw of 4.0 dS m-1 when compared to plants subjected to the ECw of 0.6 dS m-1 and without chitosan application. This reduction may be related to the excess of salts, which inhibits leaf expansion, causing a reduction in leaf turgor, consequently, reducing net carbon assimilation and negatively affecting crop yield (Lima et al., 2022). The differences between the waters used in irrigation were significant for all concentrations of chitosan.
Bashandy & El-Shaieny (2016), when studying cowpea crop, observed that the number of pods per plant decreases with increasing salinity level of irrigation water. According to these authors, this reduction may be due to the high accumulation of salts at the cellular level, which consequently affects biochemical processes in plants, such as photosynthesis and the translocation of assimilates for organ regeneration.
Contrary to the results found in the present study with cowpea, Tabassum et al. (2024) studied the effect of foliar application of chitosan (0 and 120 mg L-1) in pea (Pisum sativum L.) crop under salt stress (0, 60 and 120 mM) and found that chitosan promoted an increase in the number of pods per plant, when subjected to salt stress (60 and 120 mM).
For the average pod length (Figure 3B), the highest value was observed at the chitosan concentration of 0.93 g L-1 (21.75 cm). It was also observed that plants irrigated with ECw 4.0 dS m-1 under chitosan concentrations of 1 g L-1 had higher APL value, of 19.19 cm. It should be noted that salt stress lowers osmotic potentials, reduces relative water content, and delays production aspects (Lima et al., 2022), which explains the lower values (12.1%) of APL under ECw 4.0 dS m-1. The results also indicate a beneficial effect of chitosan on APL, which may be related to its capacity to influence the production of phytohormones, such as auxins and cytokinins, which play an important role in stimulating cell growth, which may result in pod elongation (Balusamy et al., 2022).
The highest value observed in the number of grains per pod (NGP) at ECw of 0.6 dS m-1 (13.91) was obtained in the control plants (Figure 3C); however, the use of chitosan up to a concentration of 1 g L-1 caused a reduction in NGP (12.13). On the other hand, for ECw of 4.0 dS m-1, the highest value of NGP was observed at the chitosan concentration of 0.56 g L-1 (9.12), an increase of 16.24% (1.27) when compared to plants subjected to the concentration of 0 g L-1. There was also an increase of 6.37% (0.5) when comparing plants subjected to a concentration of 1 g L-1 with those in the control (0 g L-1), irrigated with ECw of 4.0 dS m-1.
The increase in ECw levels caused a 43.57% (6.06) reduction in NGP (Figure 3C) in plants without application of chitosan. This result may be related to the restriction of the photosynthetic process and the reduction of leaf area due to the availability of water, when cowpea plants were subjected to salt stress, which affected the production of photoassimilates necessary for grain production, leading to the reduction in NGP, as explained by Martins et al. (2017).
For grain production (GP), when using ECw of 0.6 dS m-1, the highest value (26.15 g per plant) was obtained at the chitosan concentration of 0.55 g L-1 (Figure 4A), which represents an increase of 9.14% (2.19 g per plant) when compared to plants subjected to a concentration of 0 g L-1. For the ECw of 4.0 dS m-1, the chitosan concentration of 0.68 g L-1 resulted in the highest value of GP (10.05 g per plant), and there was an increase of 43.06% (2.79 g per plant) when comparing plants subjected to the concentration of 1 g L-1 with the control plants (0 g L-1), irrigated with ECw of 4.0 dS m-1.

Total grain production per plant (A) and grain index (B) of cowpea plants as a function of the electrical conductivity of irrigation water (ECw) and foliar applications of chitosan, 60 days after sowing
The improvement in grain yield indicators attributed to the treatments can be explained by the positive influence of plant regulators on the composition of biostimulants, and this influence can be associated with the presence of auxin in the root system of plants, so plants with a more developed root system have a greater capacity to absorb water and mineral salts available in the soil, resulting in a more efficient allocation of substances to their preferential sinks, such as grains (Balusamy et al., 2022).
Regarding grain index (GI) (Figure 4B), for the ECw of 0.6 dS m-1, the highest value was found at the chitosan concentration of 0.38 g L-1 (82.66%), representing an increase of 1.52% when compared to plants subjected to the same ECw level and without chitosan application (0 g L-1) (81.14%). Cowpea plants irrigated with ECw of 4.0 dS m-1 and under chitosan concentration of 0.44 g L-1 obtained the highest value (81.78%), corresponding to an increase of 1.52% compared to plants irrigated with the same ECw level and without chitosan application (0 g L-1) (80.26%). It was also observed that the chitosan concentrations of 0.25, 0.75 and 1.00 g L-1 did not differ significantly from each other under ECw levels.
The Grain Index (GI) reflects the distribution of photoassimilates in the pods. In this context, in the present study, there was an increase in grain filling at the estimated chitosan concentrations of 0.38 and 0.44 g L-1 under ECw of 0.6 and 4.0 dS m-1, respectively; this is due to the fact that more than 77% of the photoassimilates were directed to the commercial product, that is, grains (Oliveira et al., 2015). According to the analysis of variance (Table 6), the interaction between the levels of electrical conductivity of irrigation water and chitosan concentrations influenced (p ≤ 0.01) water use efficiency.
Cowpea plants irrigated with ECw of 0.6 dS m-1 and subjected to chitosan concentration of 0.55 g L-1 had the highest value (1080.61 g m-3) of water use efficiency (Figure 5A). For the ECw of 4.0 dS m-1, the highest value (546.21 g m-3) was observed at chitosan concentration of 0.68 g L-1, highlighting an increase of 55.10% when compared with the control (352.16 g m-3), and an increase of 43.09% when comparing control plants with those subjected to a concentration of 1.00 g L-1 (503.9 g m-3). However, there was a reduction of 64.03% (633.98 g m-3) in the water use efficiency of cowpea plants cultivar BRS Tapaihum when irrigated under different ECw levels (0.6 and 4.0 dS m-1).

Water use efficiency (WUE) (A) of cowpea plants as a function of the electrical conductivity of irrigation water (ECw) and foliar applications of chitosan
Conclusions
-
Irrigation water with electrical conductivity of 4.0 dS m-1 inhibits the synthesis of photosynthetic pigments, chlorophyll a fluorescence, and grain production of cowpea plants cultivar BRS Tapaihum.
-
Foliar applications of chitosan at concentrations between 0.46 and 0.71 g L-1 mitigate the deleterious effects of salt stress on photochemical efficiency, grain production per plant, and grain index.
-
Chitosan applications under irrigation using water with electrical conductivity of 0.6 dS m-1 promote an increase in the mean pod length, grain production, and grain index of cowpea plants cv. BRS Tapaihum.
Literature Cited
-
Alfonso, E. T.; Rodríguez, A. F.; Padrón, J. R.; Sosa, Y. C.; Morales, H. M. Repuesta agronómica del cultivo de tomate al bioproducto QuitoMax® Cultivos Tropicales, v.38, p.147-154, 2017. http://dx.doi.org/10.13140/RG.2.2.16534.75843
» http://dx.doi.org/10.13140/RG.2.2.16534.75843 -
Arnon, D. I. Copper enzymes in isolates choroplasts. Polyphenoloxidade in Beta vulgaris Plant Physiology, v.24, p.1-15, 1949. http://dx.doi.org/10.1104/pp.24.1.1
» http://dx.doi.org/10.1104/pp.24.1.1 -
Balusamy, S. R.; Rahimi, S.; Sukweenadhi, J.; Sunderraj, S.; Shanmugam, R.; Thangavelu, L.; Mijakovic, I.; Perumalsamy, H. Chitosan, chitosan nanoparticles and modified chitosan biomaterials, a potential tool to combat salinity stress in plants. Carbohydrate Polymers, v.284, e119189, 2022. https://doi.org/10.1016/j.carbpol.2022.119189
» https://doi.org/10.1016/j.carbpol.2022.119189 -
Barbosa, I. J.; Sousa, H. C.; Schneider, F.; Sousa, G. G.; Lessa, C. I.; Sanó, L. Cobertura morta com bagaço de cana e palha de bambu atenua o estresse salino no cultivo do feijão-caupi. Revista Brasileira de Engenharia Agrícola e Ambiental, v.25, p.485-491, 2021. https://doi.org/10.1590/1807-1929/agriambi.v25n7p485-491
» https://doi.org/10.1590/1807-1929/agriambi.v25n7p485-491 -
Bashandy, T.; El-Shaieny, A. A. Screening of cowpea (Vigna unguiculata L. Walp) genotypes for salinity tolerance using field evaluation molecular analysis. Journal of Agricultural Chemistry and Biotechnology, v.7, p.249-255, 2016. https://doi.org/10.21608/jacb.2016.41126
» https://doi.org/10.21608/jacb.2016.41126 - Bernardo, S.; Soares, A. A.; Mantovani, E. C. Manual de irrigação. 8.ed., Viçosa: UFV, 2009. 625p.
-
CONAB. Acompanhamento da safra brasileira [de] grãos: Safra 2020/2021: Quarto Levantamento, v.8, p.41-52, jan. 2021. Available at: <Available at: https://www.conab.gov.br/info-agro/safras/graos/boletim-da-safra-de-graos?start=20 >. Access on: Aug. 21 2024.
» https://www.conab.gov.br/info-agro/safras/graos/boletim-da-safra-de-graos?start=20 -
Dias, A. S.; Lima, G. S. de; Sá, F. V. da S.; Gheyi, H. R.; Soares, L. A. dos A.; Fernandes, P. D. Gas exchanges and photochemical efficiency of West Indian cherry cultivated with saline water and potassium fertilization. Revista Brasileira de Engenharia Agrícola e Ambiental , v.22, p.628-633, 2018. https://doi.org/10.1590/1807-1929/agriambi.v22n9p628-633
» https://doi.org/10.1590/1807-1929/agriambi.v22n9p628-633 -
Fernandes, E. A.; Soares, L. A. dos A.; Lima, G. S. de; Gheyi, H. R.; Fernandes, P. D. Photosynthetic pigments, photochemical efficiency and growth of custard-apple under salt stress and potassium fertilization. Revista Brasileira de Engenharia Agrícola e Ambiental , v.26, p.365-373, 2022. http://dx.doi.org/10.1590/1807-1929/agriambi.v26n5p365-373
» http://dx.doi.org/10.1590/1807-1929/agriambi.v26n5p365-373 -
Ferreira, D. F. SISVAR: A computer analysis system to fixed effects split-plot type designs. Revista Brasileira de Biometria, v.37, p.529-535, 2019. https://doi.org/10.28951/rbb.v37i4.450
» https://doi.org/10.28951/rbb.v37i4.450 -
Ge, X.; Ding, J.; Teng, D.; Wang, J.; Huo, T.; Jin, X.; Wang, J.; He, B.; Han, L. Updated soil salinity with fine spatial resolution and high accuracy: The synergy of Sentinel-2 MSI, environmental covariates and hybrid machine learning approaches. Catena, v.212, p.106054, 2022. https://doi.org/10.1016/j.catena.2022.106054
» https://doi.org/10.1016/j.catena.2022.106054 -
Geng, W.; Li, Z.; Hassan, M. J.; Peng, Y. Chitosan regulates metabolic balance, polyamine accumulation, and Na+ transport contributing to salt tolerance in creeping bentgrass. BMC Plant Biology, v.20, e506, 2020. https://doi.org/10.1186/s12870-020-02720-w
» https://doi.org/10.1186/s12870-020-02720-w -
Lima, G. S. de; Pinheiro, F. W. A.; Gheyi, H. R.; Soares, L. A. dos A.; Sousa, P. F. N.; Fernandes, P. D. Saline water irrigation strategies and potassium fertilization on physiology and fruit production of yellow passion fruit. Revista Brasileira de Engenharia Agrícola e Ambiental , v.26, p.180-189, 2022. http://dx.doi.org/10.1590/1807-1929/agriambi.v26n3p180-189
» http://dx.doi.org/10.1590/1807-1929/agriambi.v26n3p180-189 -
Lotfi, R.; Ghassemi-Golezani, K.; Pessarakli, M. Salicylic acid regulates photosynthetic electron transfer and stomatal conductance of mung bean (Vigna radiata L.) under salinity stress. Biocatalysis and Agricultural Biotechnology, v.26, e101635, 2020. https://doi.org/10.1016/j.bcab.2020.101635
» https://doi.org/10.1016/j.bcab.2020.101635 -
Martins, C. A. S. D.; Reis, E. F. D.; Garcia, G. O. D.; Tomaz, M. A. Efeito do déficit hídrico na fase de enchimento de grãos do feijoeiro comum. Nativa, v.5, p.386-395, 2017. https://doi.org/10.31413/nativa.v5i6.4586
» https://doi.org/10.31413/nativa.v5i6.4586 -
Mulaudzi, T.; Nkuna, M.; Sias, G.; Doumbia, I. Z.; Njomo, N.; Iwouha, E. Antioxidant capacity of chitosan on sorghum plants under salinity stress. Agriculture, v.12, e1544, 2022. https://doi.org/10.3390/agriculture12101544
» https://doi.org/10.3390/agriculture12101544 -
Nascimento, I. de O.; Silva, B. S.; Almeida, B. S. de; Cunha, W. L.; Alencar Sobrinho, N.; Oliveira, J. D. de; Nobre, C. P.; Rodrigues, A. A. C. Eficiência simbiótica de fungos micorrízicos arbusculares do cerrado maranhense associados à cultura do feijão-caupi (Vigna unguiculata (L.) Walp.). Cuadernos de Educación y Desarrolho, v.16, p.1774-1791, 2024. http://dx.doi.org/10.55905/cuadv16n1-092
» http://dx.doi.org/10.55905/cuadv16n1-092 - Novais, R. F.; Neves, J. C. L.; Barros, N. F. Ensaio em ambiente controlado. In: Oliveira, A. J.; Garrido, W. E.; Araújo, J. D.; Lourenço, S. (eds.). Métodos de pesquisa em fertilidade do solo. Brasília, Embrapa-SEA, 1991. p.189-254.
-
Oliveira, F. A.; Medeiros, J. F.; Alves, R. C.; Lima, L. A.; Santos, S. T.; Régis, L. R. Produção de feijão caupi em função da salinidade e regulador de crescimento. Revista Brasileira de Engenharia Agrícola e Ambiental , v.19, p.1049-1056, 2015. https://doi.org/10.1590/1807-1929/agriambi.v19n11p1049-1056
» https://doi.org/10.1590/1807-1929/agriambi.v19n11p1049-1056 -
Oliveira, W. J.; Souza, E. R.; Santos, H. R. B.; Silva, E. F. F. E; Duarte, H. H. F.; Melo, D. V. M. Fluorescência da clorofila como indicador de estresse salino em feijão caupi. Revista Brasileira de Agricultura Irrigada, v.12, p.2592-2603, 2018. https://doi.org/10.7127/rbai.v12n300700
» https://doi.org/10.7127/rbai.v12n300700 -
Ramos, J. G.; Lima, V. L. A. de; Lima, G. S. de; Pereira, M. O.; Silva, A. A. R. da; Nunes, K. G. Growth and quality of passion fruit seedlings under salt stress and foliar application of H2O2 Comunicata Scientiae, v.13, e3393, 2022. https://doi.org/10.14295/cs.v13.3393
» https://doi.org/10.14295/cs.v13.3393 - Richards, L. A. Diagnosis and improvement of saline and alkali soils. Washington: U. S. Department of Agriculture, 1954. 160p.
-
Saddiq, M. S.; Iqbal, S.; Hafeez, M. B.; Ibrahim, A. M.; Raza, A.; Fatima, E. M.; Ciarmiello, L. F. Effect of salinity stress on physiological changes in winter and spring wheat. Agronomy, v.11, e1193, 2021. http://dx.doi.org/10.3390/agronomy11061193
» http://dx.doi.org/10.3390/agronomy11061193 -
Silva, A. A. R. da; Lima, G. S. de; Azevedo, C. A. V. de; Gheyi, H. R.; Soares, L. A. dos A.; Veloso, L. L. de S. A. Salicylic acid improves physiological indicators of soursop irrigated with saline water. Revista Brasileira de Engenharia Agrícola e Ambiental , v.26, p.412-419, 2022. https://doi.org/10.1590/1807-1929/agriambi.v26n6p412-419
» https://doi.org/10.1590/1807-1929/agriambi.v26n6p412-419 -
Silva Júnior, L. G. de A.; Gheyi, H. R.; Medeiros, J. F. de. Composição química de águas do cristalino do nordeste brasileiro. Revista Brasileira de Engenharia Agrícola e Ambiental , v.3, p.11-17, 1999. https://doi.org/10.1590/1807-1929/agriambi.v3n1p11-17
» https://doi.org/10.1590/1807-1929/agriambi.v3n1p11-17 -
Tabassum, M.; Noreen, Z.; Aslam, M.; Shoah, A. N.; Usman, S.; Wagas, A.; Alsherif, E. A.; Kprany, S. M.; Nazim, M. Chitosan modulated antioxidant activity, inorganic ions homeostasis and endogenous melatonin to improve yield of Pisum sativum L. accessions under salt stress. Scientia Horticulturae, v.323, e112509, 2024. https://doi.org/10.1016/j.scienta.2023.112509
» https://doi.org/10.1016/j.scienta.2023.112509 - Teixeira, P. C.; Donagemma, G. K.; Fontana, A.; Teixeira, W. G. Manual de métodos de análise de solo. 3.ed. Brasília: Embrapa Solos, 2017. 573p.
- United States - Department of Agriculture. Keys to soil taxonomy. Lincoln: Natural Resources Conservation Service, 2014. 372p.
-
Zhang, G.; Wang, Y.; Wu, K.; Zhang, Q.; Feng, Y.; Miao, Y.; Yan, Z. Exogenous application of chitosan alleviate salinity stress in lettuce (Lactuca sativaL.). Horticulturae, v.7, e342, 2021. https://doi.org/10.3390/horticulturae7100342
» https://doi.org/10.3390/horticulturae7100342 -
Zou, P.; Lu, X.; Jing, C.; Yuan, Y.; Lu, Y.; Zhang, C.; Meng, L.; Zhao, H.; Li, Y. Low-molecular-weight polysaccharides from Pyropia yezoensis enhance tolerance of wheat seedlings (Triticum aestivum L.) to salt stress. Frontier in Plant Science, v.9, e427, 2018. https://doi.org/10.3389/fpls.2018.00427
» https://doi.org/10.3389/fpls.2018.00427
Financing statement
Not applicable.

 ** and ns significant at p ≤ 0.01 and not significant by F test, respectively. For the same chitosan concentration, means followed by different letters indicate significant differences between water salinity (ECw) levels. Vertical error bars represent the standard error of the mean (n = 12)
 ** and ns - Significant at p ≤ 0.01 and not significant by F test, respectively. For the same chitosan concentration, means followed by different letters indicate significant differences between water salinity (ECw) levels; Vertical error bars represent the standard error of the mean (n = 12)
 ** and ns - Significant at p ≤ 0.01 and not significant by F test, respectively. For the same chitosan concentration, means followed by different letters indicate significant differences between water salinity (ECw) levels; Vertical error bars represent the standard error of the mean (n = 12)
 ** and ns - Significant at p ≤ 0.01 and not significant by F test, respectively. For the same chitosan concentration, means followed by different letters indicate significant differences between water salinity (ECw) levels. Vertical error bars represent the standard error of the mean (n = 12)
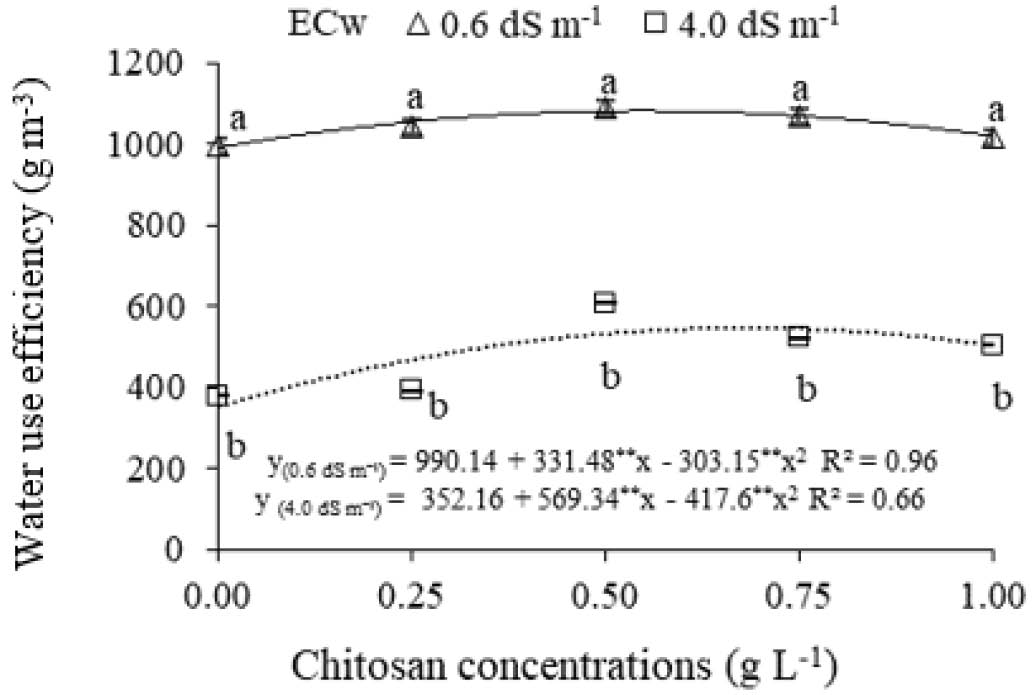 ** - Significant at p ≤ 0.01 by F test. For the same chitosan concentration, means followed by different letters indicate significant differences between water salinity (ECw) levels. Vertical error bars represent the standard error of the mean (n = 12)