
 El Niño-Southern Oscillation-driven rainfall pattern variability in the Plain of Reeds
ABSTRACT
The Plain of Reeds, a crucial agricultural region in the Vietnamese Mekong Delta, is experiencing rainfall pattern variability under the impacts of climate variability. It has shown substantial evidence of a demonstrable link between El-Niño Southern Oscillation (ENSO) and regional rainfall patterns in recent decades.This study investigates the influence of the ENSO on rainfall pattern variability within the Plain of Reeds by analyzing daily data series from 11 rainfall gauge stations, spanning from 1985 to 2020, based on non-parametric statistical methods and the rainfall anomaly index (RAI), examining rainfall pattern variation in relation to ENSO phases. The close links between ENSO events on rainfall pattern variability is verified. During dry periods, there is a decrease in annual rainfall, a delay in the onset of the rainy season (ORS), and an earlier end to the rainy season (DRS), resulting in fewer rainy days. In contrast, humid periods are marked by increased annual rainfall, an earlier ORS, and a later DRS, leading to more rainy days. Furthermore, rainfall intensity exhibited substantial inter-annual variability linked to ENSO. The findings reveal a complex interplay between ENSO and rainfall patterns in the Plain of Reeds. These results have critical implications for water resource management and agricultural planning in the region.
Key words:
drought; rainfall anomaly index; rainfed; ENSO; trend
HIGHLIGHTS:
Seasonal rainfall is strongly linked to El Niño-Southern Oscillation (ENSO) phenomena across the Plain of Reeds.
Significant variability in rainy season rainfall was detected during typical ENSO events.
Seasonal rainfall patterns trend exhibited a later onset and demise while shorter rainy season during the period 1985-2020.
RESUMO
A Planície de Reeds, uma região agrícola crucial no Delta do Mekong vietnamita, está experimentando variabilidade do padrão de precipitação sob os impactos da variabilidade climática. Tem sido verificada evidências substanciais de uma ligação demonstrável entre a Oscilação Sul El-Niño (ENSO) e os padrões regionais de precipitação nas últimas décadas. Este estudo investiga a influência do ENSO na variabilidade dos padrões de precipitação na Planície de Reeds. Neste estudo, foram avaliadas séries de dados diários de 11 estações pluviométricas, abrangendo de 1985 a 2020, com base em métodos estatísticos não paramétricos e no índice de anomalia de precipitação (RAI) para examinar a variação dos padrões de precipitação em relação às fases do ENSO. Verificou-se ligações estreitas entre os eventos do ENSO na variabilidade dos padrões de precipitação. Durante o período seco, houve diminuição na precipitação anual, um atraso no início da estação chuvosa (ORS) e um fim mais precoce da estação chuvosa (DRS), resultando em menos dias chuvosos. Em contraste, os períodos úmidos foram marcados por aumento da precipitação anual, um ORS mais cedo e um DRS mais tarde, levando a mais dias chuvosos. Além disso, a intensidade da precipitação exibiu variabilidade interanual substancial ligada ao ENSO. As descobertas revelam uma interação complexa entre o ENSO e os padrões de precipitação na Planície de Reeds. Esses resultados têm implicações críticas para o gerenciamento de recursos hídricos e planejamento agrícola na região.
Palavras-chave:
seca; índice de anomalia de precipitação; sequeiro; ENSO; tendência
Introduction
El Niño-Southern Oscillation (ENSO) is known as an ocean-atmosphere phenomenon characterised by fluctuating sea surface temperatures and air pressure in the equatorial Pacific Ocean; ENSO triggers a complex chain of atmospheric responses that extend far beyond the equatorial region (Aggarwal et al., 2010; Cai et al., 2021). These climate anomalies are characterized by significant alterations in rainfall regimes, temperature anomalies, and atmospheric circulation patterns across vast geographical areas (Cai et al., 2021). Numerous studies have documented the substantial influence of ENSO on local weather patterns in diverse regions, including Africa, India, the Americas, and various parts of Asia (Tao et al., 2011; Sazib & Bolten, 2020; Supriyasilp & Pongput, 2021; Athira et al., 2023). These impacts are not merely climatic; they have profound socioeconomic consequences, particularly within agricultural sectors, which are often the most vulnerable to climate variability (Li et al., 2020).
Among the key drivers of regional climate variability, the ENSO stands out as a dominant force, exerting a profound influence on weather patterns across the globe (Asadi et al., 2017; Li et al., 2020). Studies across diverse geographical regions have confirmed ENSO’s profound influence on the local weather (Bogale & Temesgen, 2021; Cai et al., 2021). While the impacts of ENSO phases on rainfall distribution and intensity are well-documented (Chen et al., 2014; Han et al., 2016), cold periods are often associated with increased rainfall in south-eastern regions, while warm periods of drought are associated with eastern tropical areas (Lengaigne & England, 2015; Ayarzagüena et al., 2019). Studies have shown rainfall reductions during warm phases, leading to reductions of crop yield (4.5%) in Brazil, 3.7% in Indonesia, 2.9% in Bangladesh, and up to 10.7% in Nicaragua (Sazib & Bolten, 2020; Cherian et al., 2021). The most severe drought in over 90 years struck Vietnam from 2014 to 2016, prompting the Vietnam Government to declare a state of emergency in 18 provinces (Dinh & Dang, 2022). This devastating drought had a profound impact on the agricultural sector, resulting in substantial losses and far-reaching consequences for the region’s farmers (Lee & Dang, 2020; Dinh & Dang, 2022). The prolonged dry spell had a particularly dire effect on the Plain of Reeds, a fertile and vital agricultural area, exacerbating crop failures and severely affecting the livelihoods of rural communities (Dinh & Dang, 2022). In contrast, cold phases have been associated with increased rainfed, resulting in rice (Oryza sativa) yield increase in countries such as the Philippines (4.9%), Cambodia (14.7%), and Vietnam (5.6%) (Lengaigne & England, 2015; Cherian et al., 2021).
Within the context of the Plain of Reeds, one of the two critical deltas in the Vietnamese Mekong Delta, understanding the intricate climate-agriculture interactions is paramount (Dinh & Dang, 2022; Phung, 2024). However, the Plain of Reeds is highly vulnerable to climate change impacts. Severe typical El-Niño events, such as those of 2014-2016 and 2018-2019, have caused significant droughts in the Plain of Reeds, highlighting the urgent need for a detailed understanding of ENSO’s influence on local rainfall patterns (Dang, 2021; Dinh & Dang, 2022). This study addresses this gap by investigating the relationship between ENSO events and rainfall variability in the Plain of Reeds of the Vietnamese Mekong Delta, focusing on its implications for agricultural land area of approximately 700,000 hectares, with an average annual rice yield of up to 5.60 tons per hectare.
Material and Methods
The Plain of Reeds, a crucial delta in the Vietnam’s Mekong Delta, spans Dong Thap, Tien Giang, and Long An Provinces (10° 04’ to 11° 00’ N latitude and 105° 03’ to 106° 09’ E longitude). This low-lying floodplain, with elevations ranging from 0.5-3.5 m above sea level, plays a vital role in the region’s hydrology and agriculture (Figure 1).

Map of the Plain of Reeds with rainfall gauge stations marked in red color (Source: authors)
The study area is affected by a tropical monsoon climate with two distinct seasons (Köppen, 1936; Lee & Dang, 2020). The Southwest monsoon (May to mid-November) brings abundant rainfall, while the Northeast monsoon (late November to April) introduces drier conditions (Figure 2).
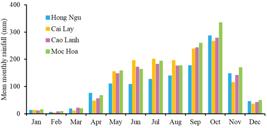
This dichotomy results in a rainy season accounting for approximately 85% of the annual precipitation, crucial for agricultural activities (Figures 3A and B). Temperatures in the Plain of Reeds remain relatively stable year-round, averaging between 26.0 to 28.2 °C (Dang, 2021). The region experiences significant spatial variation in rainfall patterns, with annual precipitation ranging from 1467.4 mm in the southwest (Cao Lanh station) to 1650.8 mm in the northeast (Moc Hoa station) (Figure 3). Hydrologically, the Plain of Reeds is influenced by both the Mekong River’s flow regimes, local precipitation and tides from the east and west seas (Nguyen & Dang, 2024). This unique combination of factors contributes to the area’s importance as a major rice-growing region.

Spatial distribution of dry season rainfall (A) and rainy season rainfall (B) across the Plain of Reeds in the period of 1985- 2020
The Plain of Reed’s distinct geographical and climatic characteristics make it particularly susceptible to the impacts of climate change, especially concerning rainfall patterns and water resource management (Dang, 2021). This study used a dataset of daily rainfall records from 11 observation stations across the Plain of Reeds between 1985 and 2020, (Table 1). The dataset provides comprehensive coverage of the area’s diverse microclimates.
To ensure the quality of input data series, a rigorous quality control process was implemented. Each station’s data underwent thorough examination for homogeneity, employing statistical techniques to identify and address any inconsistencies (Nguyen et al., 2022). This process involved detecting abrupt changes, gradual shifts, and outliers in the time series (Nguyen et al., 2022).
The Mann-Kendall test and Sen’s slope estimator have been widely employed to identify trends in rainfall characteristics (Lee & Dang, 2020). These tests offer several advantages, such as being non-parametric, straightforward to implement, not requiring the assumption of normality, being robust against outliers, and capable of handling missing values (Lee & Dang, 2020). One notable advantage of the Mann-Kendall test is its ability to handle abrupt breaks in data series, making it less sensitive to inhomogeneous data (Nguyen et al., 2022). Additionally, the Mann-Kendall test is considered to be highly reliable when multiple points are tested within a single data series.
The Mann-Kendall test can be defined by Eq. 1.
where:
S - the test statistic;
n - the total of observed annual rainfall variable, and
Xj, Xi - the observated data series of annual rainfall variables.
With sgn (Xj-Xi) is defined based on Eq. 2
If n ≥ 10, sign (Xj-Xi) is considered as a standard distribution
When the statistics of the standard test, denoted as Zs and given by Eq. 3.
If ZS is a standard normal distribution. To assess the significance of the trend, a comparison can be made between the value of ZS and the critical value α associated with the specified significance level. This approach, founded on the premise of independence, is known as the original Man-Kendall trend test.
When tied ranks occur, the variance of the sum of ranks (S) in Eq. 3 is defined by Eq. 4.
where:
m - the number of groups of ties;
tj - the number of tied observations of each group, and
S - distribution of the sum of data ranks.
The Zs test is commonly employed to evaluate the significance of trends. If the Zs value is positive, the considered data series expresses an upward trend, while the Zs value is negative, the considered data series shows a downward trend (Lee & Dang, 2020).
Researchers across various fields, including meteorology, hydrology and environmental science, frequently employ Sen’s slope to analyze trends and make decisions based on trend analysis (Lee & Dang, 2020; Nguyen et al., 2022). Sen’s slope is computed by determining the median of all possible pairwise slopes between data points, providing a more reliable estimate of the trend’s direction and magnitude (Lee & Dang, 2020). By focusing on the relative differences between data points rather than the actual values, Sen’s slope offers a more stable and accurate representation of the trend present in the dataset (Nguyen et al., 2022).
Sen’s slope is calculated based on Eq. 5:
where:
β - Sen’s slope, and
xi and xj - data series at time scales ti and tj, respectively.
The null hypothesis indicating no trend is dismissed if the absolute ZS value surpasses 1.96, at p ≤ 0.05 (Lee & Dang, 2020).
The rainfall anomaly index (RAI) was developed by Van Rooy (1965). RAI considers two anomalies, i.e., positive and negative anomaly (Asadi et al., 2017). First, the rainfall data series are arranged in descending order (Nguyen et al., 2022). The ten highest values are averaged to form a threshold for positive anomaly and the ten lowest values are averaged to form a threshold for negative anomaly (Asadi et al., 2017; Alamgir, 2022). Where the thresholds are defined by Eq. 6.
where:
p and p̅ - rainfall value and the average value of the observed rainfall data series, and
x̅ - average value of the 10 highest or lowest rainfall data samples
Table 2 shows the rainfall anomaly index classification used in the present study (Nguyen et al., 2022).
Results and Discussion
Analysis of the statistical characteristics of rainfall at four representative stations across the Plain of Reeds, are presented in Table 3. The minimum annual rainfall (MIR) exhibits notable variation across stations, ranging from 717.0 mm (at Hong Ngu) to 1046.5 mm (at Moc Hoa). In contrast, the maximum annual rainfall (MAR) shows great differentiation, spanning from 1854.0 mm (at Hong Ngu) to 2420.9 mm (at Moc Hoa), indicating moderate overall rainfall variation in the study area. The standard deviation (SD) of MER ranges from 238.3 mm to 335.3 mm, suggesting considerable inter-annual variability. This variability is further quantified by the coefficient of variation (CV), which ranges from 0.163 at Cai Lay to 0.227 at Hong Ngu, indicating strong differentiation in rainfall distribution across the Plain of Reeds.
The distribution of rainfall data shows interesting spatial patterns. Hong Ngu and Cai Lay stations exhibit negative skewness (-0.019 and -0.697, respectively), indicating a left-skewed distribution with a tendency towards lower extreme values. Conversely, Cao Lanh and Moc Hoa stations display positive skews (0.975 and 0.317, respectively), suggesting a right-skewed distribution with a propensity for higher extreme values. The kurtosis values provide insights into the shape of the rainfall distribution. Hong Ngu and Moc Hoa stations show negative kurtosis (-0.465 and -0.506, respectively), indicating a relatively flat distribution with a lower likelihood of extreme values. In contrast, Cao Lanh and Cai Lay stations exhibit positive kurtosis (1.883 and 1.220, respectively), suggesting a more peaked distribution with a higher probability of extreme events. A study results on extreme rainfall trends in the Mekong Delta by Lee & Dang Lee (2019) recorded that Cao Lanh and Cai Lay stations are increasing extreme rainfall events in recent decades. The results highlight the spatial heterogeneity of rainfall patterns across the study area.
The negative values of both Kendall’s tau and Sen’s slope at Moc Hoa station (τ = -0.133, β = -6.386) and Hong Ngu station (τ = -1.645, β = -1.738) indicate a decreasing trend in rainfall over time. The magnitude of Sen’s slope reveals that the trend of decrease is more pronounced at Moc Hoa station compared to Hong Ngu station (Table 3). The positive values of Kendall’s tau and Sen’s slope vary from 0.041 to 0.160 and 1.133 to 4.300 at Cao Lanh and Cai Lay stations, respectively, suggesting an upward trend in rainfall (Table 3). This implies that the rainfall at Cao Lanh and Cai Lay is increasing over time.
Figure 4 illustrates the simulated results of the weather patterns, across four representative stations in the study area during the period 1985-2020, as represented by the RAI. Throughout this period, the study area experienced 15.3 episodes of weather ranging from dry to extreme dry, with RAI values varying from -0.51 to -8.16 across the study area. For Cao Lanh station, the result recorded seven instances of dryness, six instances of very dryness and two instances of extreme dryness. For Moc Hoa station, it recorded eight instances of dry, eight very dry and one of extreme dryness. For the western part (Hong Ngu station), there were seven instances of dry, six very dry and one of extreme dryness. For the southeast part, Cai Lay station showed 11 instances of dry, three very dry and three of extreme dryness (Table 4). Notably, during the strong El-Niño event of 2015, the RAI values were consistently negative, ranging from -0.98 to -4.14, with specific values of -0.98 at Cai Lay, -2.08 at Hong Ngu, -3.37 at Cao Lanh, and -4.14 at Moc Hoa (Figure 5A). These results imply that there is a significant change, towards a decline of both seasonal and annual rainfall in the study area and this has led to the more frequent occurrence of dry to extremely dry weather. A study on rainfall trends in the Vietnamese Mekong Delta under the impacts of climate change by Lee and Dang (2019) also confirmed the results presented above.

Results of rainfall anomaly index at Cao Lanh station (A), Moc Hoa station (B), Hong Ngu station (C) and Cai Lay station (D) during the period 1985-2020

Timing of the onset of the rainy season, length of the rainy season and cessation of the rainy season during the 2015 El-Niño event (A) and the 2020 La-Niña event (B) across the Plain of Reeds in the Vietnamese Mekong Delta
In the period of 1985-2020, the study area experienced 15.8 instances of excess moisture, ranging from humid to extremely humid during the same period (Table 4). At the Cao Lanh station, the results detected four instances of humidity, ten of humidity conditions, four very humid and four extremely humid. Moc Hoa station defined 10 humid, six very humid and three extremes humid. Hong Ngu station exhibited 13 humid, five very humid and two extremes humid. Cai Lay station had 10 instances of humidity, five very humid and four extremes humid. The La-Niña year of 2020 was particularly noteworthy, as it exhibited positive RAI values across all stations, ranging from 5.04 to 7.69, indicating above-average rainfall (Figure 6B) that may be due to the impact of climate change.

Temporal distribution of rainy season patterns across the study area during the period 1985-2020
In overall, the findings revealed a significant imbalance in weather patterns over the 36-year study period (1985-2020), with a marked prevalence of both dry and humid weather conditions. Specifically, years controlled by dry and humid weather conditions significantly outnumber those with near normal weather conditions, highlighting the region’s vulnerability to climatic extremes.
Of the 36 years studied, 19.25 years exhibited humid to extremely humid weather conditions, indicating that, for the majority of the time, the Plain of Reeds experienced humid weather conditions. This pattern underscores the necessity of enhancing adaptive solutions to address the impacts of such variability on agricultural practices in the region. The analysis of the relationship between rainfall patterns (ORS, DRS and length of the rainy season) and the RAI is illustrated in Figure 6 and detailed in Table 5. The results indicate a strong correlation between the ORS and ENSO phases, where a delayed ORS is associated with negative RAI values.
During dry years, the ORS was delayed by an average of 5.9 days compared to the long-term average from 1985 to 2020. Because of the El-Niño event of 2015, the ORS was delayed by 27.8 days relative to the long-term average (Figure 6). Conversely, in years characterized by excess humidity, the ORS occurred earlier, averaging 4.3 days ahead of the long-term average, with the La-Niña year of 2020 seeing an early onset of 12.3 days. Similarly, the DRS also demonstrated a significant relationship with ENSO phases, where a later DRS correlated with negative RAI values. In dry weather years, the DRS occurred earlier by an average of 3.1 days compared to the long-term average. During the El-Niño event in 2015, the DRS ended 5.9 days earlier than the long-term average (Figure 6). In contrast, during years of excess humidity, the DRS was delayed by an average of 3.9 days, with the La-Niña year of 2020 showing an early onset of 4.7 days compared to the long-term average. Regarding the length of the rainy season, the analysis revealed that during dry weather periods, the length of the rainy season was generally 9.3 days shorter than the long-term average. Conversely, in years with abundant humidity, the length of the rainy season extended by an average of 8.6 days beyond the long-term average.
Overall, these results reveal that weather conditions have a direct influence on rainfall patterns across the Plain of Reeds, although the impact varies across different areas within the study region. These results demonstrate a clear influence of ENSO phases on rainfall patterns across the Plain of Reeds. During El-Niño events, characterized by negative RAI values, the rainy season generally onsets later, demise earlier, and has a shorter duration. Conversely, La-Niña events, associated with positive RAI values, tend to bring an earlier onset, later demise, and longer duration of the rainy season.
Conclusions
-
Over the past 36 years (1985-2020), the Plain of Reeds has experienced significant imbalance in its weather patterns, with a marked prevalence of both dry and humid weather conditions.
-
The frequency of ENSO increases has been recorded in recent years. Typically, the 2015-2016 period saw an extremely serious El-Niño event in Vietnam’s 92-year history, while the 2019-2020 period continued to record an extreme El-Niño event.
-
This study contributes to improving our understanding of the impacts of ENSO events on agriculture, the environment, and society in the Plain of Reeds. The findings can be applied to develop early warning systems for farmers, policymakers, and other stakeholders to prepare for and respond to ENSO-related events as well as promoting sustainable development in the region.
Acknowledgments
The author would like to sincerely thank the reviewers as well as the editorial board for reviewing and providing feedback to help improve the manuscript.
Literature Cited
-
Aggarwal, P. K.; Singh, A. K. Implications of global climatic change on water and food security. Water Resources Development and Management, v.1, p.49-63, 2010. https://doi.org/10.1007/978-3-642-04615-5_3
» https://doi.org/10.1007/978-3-642-04615-5_3 -
Alamgir, K. Space-time characterization of droughts in the Mae Klong River Basin, Thailand, using rainfall anomaly index. Water Supply, v.22, p.7352-7374, 2022. https://doi.org/10.2166/ws.2022.306
» https://doi.org/10.2166/ws.2022.306 -
Aryal, A.; Maharjan, M.; Talchabhadel, R.; Thapa, B.R. Characterizing meteorological droughts in Nepal: A comparative analysis of standardized precipitation index and rainfall anomaly index. Earth, v.3, p.409-432, 2022. https://doi.org/10.3390/earth3010025
» https://doi.org/10.3390/earth3010025 -
Asadi, Z. M. A.; Sivakumar, B.; Sharma, A. Droughts in a warming climate: a global assessment of SPI and RDI. Journal of Hydrology, v.526, p.183-195, 2017. https://doi.org/10.1016/j.jhydrol.2014.09.071
» https://doi.org/10.1016/j.jhydrol.2014.09.071 -
Athira, K. S.; Roxy, M. K.; Dasgupta, P.; Saranya, J. S.; Singh, V. K.; Attada, R. Regional and temporal variability of Indian summer monsoon rainfall in relation to El-Niño southern oscillation. Scientific Reports, v.13, e12643, 2023. https://doi.org/10.1038/s41598-023-38730-5
» https://doi.org/10.1038/s41598-023-38730-5 -
Ayarzagüena, B.; López-Parages, J.; Iza, M.; Calvo, N.; Rodríguez-Fonseca, B. Strato-spheric role in interdecadal changes of El-Niño impacts over Europe. Climate Dynamics, v.52, p.1173-1186, 2019. https://doi.org/10.1007/s00382-018-4186-3
» https://doi.org/10.1007/s00382-018-4186-3 -
Bogale, G. A.; Temesgen, T. Impacts and challenges of seasonal variabilities of El Niño and La Niña on crop and livestock production in the central rift valley of Ethiopia: a re-view. Environment Pollution and Bogale and Temesgen. Environment Pollution and Climate Change, v.5, e199, 2021. https://doi.org/10.4172/2573-458X.1000199
» https://doi.org/10.4172/2573-458X.1000199 -
Cai, W.; Santoso, A.; Collins, M. Changing El Niño-Southern Oscillation in a warming climate. Nature Reviews Earth & Environment, v.2, p.628-644, 2021. https://doi.org/10.1038/s43017-021-00199-z
» https://doi.org/10.1038/s43017-021-00199-z -
Chen, Z.; Wen, Z.; Wu, R.; Zhao, P.; Cao, J. Influence of two types of El-Niños on the East Asian climate during boreal summer: a numerical study. Climate Dynamics , v.43, p.469-481, 2014. https://doi.org/10.1007/s00382-013-1943-1
» https://doi.org/10.1007/s00382-013-1943-1 -
Cherian, S.; Sridhara, S.; Manoj, K. N.; Gopakkalia, P.; Ramesha, N.; Alrajhi, A. A.; Dewidar, A. Z.; Mattar, M. A. Impact of El-Niño Southern Oscillation on rainfall and rice production: a micro-level analysis. Agronomy, v.11, e1021, 2021. https://doi.org/10.3390/agronomy11061021
» https://doi.org/10.3390/agronomy11061021 -
Dang, T. A. Grain yield optimization in the Plain of Reeds in the context of climate variability. Revista Brasileira de Engenharia Agrícola e Ambiental, v.25, p.591-596, 2021. https://doi.org/10.1590/1807-1929/agriambi.v25n9p591-596
» https://doi.org/10.1590/1807-1929/agriambi.v25n9p591-596 -
Dinh, T. K. H.; Dang, T. A. Potential risks of climate variability on rice cultivation regions in the Mekong Delta, Vietnam. Revista Brasileira de Engenharia Agrícola e Ambiental , v.26, p.348-355, 2022. http://dx.doi.org/10.1590/1807-1929/agriambi.v26n5p348-355
» http://dx.doi.org/10.1590/1807-1929/agriambi.v26n5p348-355 -
Freund, M. B.; Henley, B. J.; Karoly, D. J.; McGregor, H. V.; Abram, N. J.; Dommenget, D. Higher frequency of Central Pacific El Niño events in recent decades relative to past centuries. Nature Geoscience, v.12, p.1-6, 2021. https://doi.org/10.1038/s41561-019-0353-3
» https://doi.org/10.1038/s41561-019-0353-3 -
Han, R.; Wang, H.; Hu, Z. An assessment of multimoded simulations for the variability of western North Pacific tropical cyclones and its association with ENSO. Journal of Climate, v.29, p.6401-6423, 2016. https://doi.org/10.1175/JCLI-D-15-0720.1
» https://doi.org/10.1175/JCLI-D-15-0720.1 -
Hidayat, A. M.; Efendi, U.; Agustina, L.; Winarso, P. A. Correlation of the Niño 3.4 index and the Southern Oscillation Index (SOI) with rainfall variations in Semarang (in Bahasa Indonesia). Journal of Sains Teknologi Modifikasi Cuaca, v.19, p.75-819, 2018. https://doi.org/10.29122/jstmc.v19i2.3143
» https://doi.org/10.29122/jstmc.v19i2.3143 - Köppen, W. In Köppen, Wladimir; Geiger (publisher), Rudolf (eds.). Das geographische System der Klimate [The geographic system of climates] (PDF). Vol. 1. Berlin: Borntraeger. Archived (PDF) from the original 1936 on 4 March 2016. Retrieved 2 September 2016.
-
Lee, S. K.; Dang, T. A. Extreme rainfall trends over the Mekong Delta under the impacts of climate change. International Journal of Climate Change Strategies and Management, v.12, p.639-652, 2020. https://doi.org/10.1108/IJCCSM-04-2020-0032
» https://doi.org/10.1108/IJCCSM-04-2020-0032 -
Lengaigne, M.; England, M. H. Increased frequency of extreme La Niña events under greenhouse warming. Nature Climate Change, v.5, p.132-137, 2015. https://doi.org/10.1038/nclimate2492
» https://doi.org/10.1038/nclimate2492 -
Li, X. F.; Blenkinsop, S.; Barbero, R.; Yu, J.; Lewis, E.; Lenderink, G.; Guerreiro, S.; Chan, S.; Li, Y.; Ali, H.; Villalobos, H. R. Global distribution of the intensity and frequency of hourly precipitation and their responses to ENSO. Climate Dynamics , v.54, p.4823-4839, 2020. https://doi.org/10.1007/s00382-020-05258-7
» https://doi.org/10.1007/s00382-020-05258-7 -
Nguyen, C. T.; Dang, T. A. Assessing water level variability in the Mekong Delta under the impacts of anthropogenic and climatic factors. Journal of Environmental & Earth Sciences, v.75, p.33-40, 2024. https://doi.org/10.30564/jees.v7i1.7238
» https://doi.org/10.30564/jees.v7i1.7238 -
Nguyen, T. T. T.; Hoang, P. H. Y.; Dang, T. A. Climate variability induced drought across the coastal fringes of the Mekong Delta, Vietnam. Mausam, v.73, p.525-36, 2022. https://doi.org/10.54302/mausam.v73i3.5373
» https://doi.org/10.54302/mausam.v73i3.5373 -
Phung, T. D. Climate change impacts on rice cultivation paddies in the Plain of Reeds, Vietnam. Research on Crops, v.25, p.247-252, 2024. https://doi.org/10.31830/2348-7542.2024.ROC-1086
» https://doi.org/10.31830/2348-7542.2024.ROC-1086 -
Sazib, N.; Bolten, J. D. Assessing the impact of ENSO on agriculture over Africa using earth observation data. Front. Frontiers in Sustainable Food Systems, v.4, e509914, 2020. https://doi.org/10.3389/fsufs.2020.509914
» https://doi.org/10.3389/fsufs.2020.509914 -
Supriyasilp, T.; Pongput, K. El Niño-Southern Oscillation and rainfall characteristics in Northern Thailand: implications for adaptation in rainfed farms. Regional Environmental Change, v.21, e123, 2021. https://doi.org/10.1007/s10113-021-01852-5
» https://doi.org/10.1007/s10113-021-01852-5 -
Tao, Z.; Martin, P. H.; Judith, P.; De-Zheng, S.; Donald, M. Physics of U.S. surface temperature response to ENSO. Journal of Climate , v.24, p.4874-4887, 2011. https://doi.org/10.1175/2011JCLI3944.1
» https://doi.org/10.1175/2011JCLI3944.1
Author confirms that there is no supplementary research data.


