 Prevalence of sarcopenia in socially active older adults and its association with sex and nutritional risk: an analysis of Bayesian networks
Abstract
Objective To verify the prevalence of sarcopenia and its relationship with sociodemographic and clinical factors, including nutritional risk, in socially active older adults, as well as to investigate sex differences in factors associated with sarcopenia.
Method A cross-sectional study included 400 older adults (342 women, 58 men) attending community groups in the city of Santa Maria, RS, Brazil. Participants were diagnosed according to EWGSOP2 (2019) criteria, and nutritional status was assessed using the Mini Nutritional Assessment (MNA®). Bayesian network models with total sample and stratified by sex were used to explore the relationship between sarcopenia and sociodemographic and clinical factors. A resampling process was conducted to assess the statistical performance of the network models.
Results The prevalence of sarcopenia was 10.2%. In the network model for the total sample, the probability of sarcopenia was higher among men with nutritional risk. In the female network, the probability of being sarcopenic was higher in the subgroup of long-lived individuals aged 80 years or older. In contrast, in the male network only nutritional risk increased the probability of sarcopenia. All network models reached good performance, with an area under the ROC curve (AUC) above 0.89.
Conclusion This study was the first to use Bayesian networks to investigate factors associated with sarcopenia in socially active older adults, which differ by sex. This study highlights the importance of diagnosing sarcopenia and incorporating MNA® in clinical practice.
Keywords
Aging; Grip Strength; Muscle Mass; Nutritional Status; Probabilistic Inference; Network Analysis.
Resumo
Objetivo Verificar a prevalência de sarcopenia e sua relação com fatores sociodemográficos e clínicos incluindo risco nutricional em pessoas idosas socialmente ativas, bem como investigar as diferenças entre os sexos nos fatores associados a sarcopenia.
Método Estudo transversal com 400 idosos (342 mulheres e 58 homens) frequentadores de grupos de convivência do município de Santa Maria, RS, Brasil. Os participantes foram diagnosticados conforme critérios do EWGSOP2 (2019) e o estado nutricional avaliado por meio do <italic>Mini Nutritional Assessment </italic>(MNA®). Modelos de redes Bayesianas com amostra total e estratificada por sexo foram utilizados para explorar a relação entre sarcopenia e fatores sociodemográficos e clínicos. Para verificar o desempenho estatístico dos modelos de redes, foi realizado o processo de reamostragem.
Resultados A prevalência de sarcopenia foi de 10,2%. No modelo de redes com a amostra total, a probabilidade de ser sarcopênico foi maior entre os homens com risco nutricional. Na rede do sexo feminino, a probabilidade para o desfecho sarcopenia foi maior no subgrupo longevo com idade superior a 80 anos ou mais. Por outro lado, na rede do sexo masculino, somente o risco nutricional aumentou a probabilidade de sarcopenia. Todos os modelos de redes alcançaram bom desempenho, com área sob a curva ROC (AUC) superior a 0,89.
Conclusão Esse estudo foi o primeiro a utilizar redes Bayesianas na investigação dos fatores associados à sarcopenia em pessoas idosas socialmente ativas, os quais diferem por sexo. O estudo destaca a importância do diagnóstico de sarcopenia e do uso do MNA® na prática clínica.
Palavras-chave
Envelhecimento; Força de Preensão; Massa Muscular; Estado Nutricional; Inferência Probabilística; Análise de Redes.
INTRODUCTION
Aging is characterized by modifications in the musculoskeletal system, which undergoes quantitative and functional decline as age progresses. Indeed, low muscle strength and mass are losses of physiological and structural functioning, clinically defined as sarcopenia, a syndrome associated with adverse outcomes such as functional disability, falls, fractures, and high mortality in older adults1,2.
Sarcopenia is an undesirable condition, although it is explained by age-related changes, and its prevalence may vary according to the definition used in studies and the healthcare context in which the older adult is situated. Recently, a systematic review and meta-analysis of studies involving community-dwelling older adults, evaluated according to the definition proposed by the European Working Group on Sarcopenia - EWGSOP2 (2019) and the Asian Working Group on Sarcopenia, concluded that the prevalence of sarcopenia was 10%3. In addition, in older adults receiving care in high-complexity healthcare services and evaluated using the EWGSOP2 (2019) definition, the prevalence of sarcopenia was 29.5%4.
Different factors are associated with sarcopenia, such as advanced age, sex, lower socioeconomic status, presence of chronic diseases, higher medication use, physical inactivity, overweight, and obesity5,6. In addition to obesity, which acts through pro-inflammatory and metabolic mechanisms that impair muscle function7, nutritional risk and malnutrition are also related to reduced muscle strength in groups of older adults attending outpatient clinics and/or hospitals8.
Although there is evidence of a relationship between sarcopenia, nutritional risk and malnutrition9 in community-dwelling older adults receiving care in a day hospital service8 or geriatric outpatient clinic9, as well as on the relationship between sarcopenia5,6 or nutritional risk10 with sociodemographic and clinical factors, little is known about these associations in a group of socially active older adults. These individuals participate in activities that promote integration and social interaction11, such as dancing, walking, aerobic exercises, and muscle-strengthening exercises in community groups. Participation in these groups not only fosters social inclusion but also contributes to a better quality of life by enhancing autonomy, motivation, functional capacity, and overall health status.
Furthermore, social interaction, integration among participants, and social education within these groups can encourage a healthier lifestyle and consequently provide better physical and mental health, including eating habits12. However, it is worth noting that health education topics such as nutritional education actions and physical exercise are collective in nature, and dietary and/or diet therapy plans are not prescribed, as well as individualized physical exercise. Thus, even while socially active, participants may experience health vulnerabilities, including sarcopenia and nutritional risk.
Given the complexity of sarcopenia and nutritional risk in older adults, this study aimed to verify the prevalence of sarcopenia and its relationship with sociodemographic and clinical factors, including nutritional risk, in socially active older adults, as well as to investigate sex differences in factors associated with sarcopenia. Therefore, Bayesian network models were used, a statistical method suitable for studying multifactorial conditions such as sarcopenia and nutritional risk. This method has advantages over regression models, as it allows intuitive examination of the hierarchical relationship between all variables in the model, as well as the simultaneously interaction between two or more factors in increasing the probability of the studied outcome, in this case sarcopenia13.
METHOD
This cross-sectional study was conducted with socially active older adults, randomly recruited from Community Groups in the city of Santa Maria, RS, linked to the Integrated Center for Studies and Support for Older Adults (NIEATI) at the Federal University of Santa Maria (UFSM).
Inclusion criteria for the study were socially active older adults aged ≥60 years, of both sexes, who were participants of community groups in Santa Maria, Rio Grande do Sul, Brazil. These community groups engage on average twice a week in physical activities such as dance, stretching, walking, aerobics, and muscle-strengthening exercises for the upper limbs. Participants engage in various types and contexts of activities, with the primary characteristic of uniformity is socialization and joint exercises with other community members.
Participants who presented acute infectious disease, had limb amputations and/or a history of upper limb surgery in the three months prior to the data collection period (preventing the record anthropometric measurements and/or handgrip strength), were unable to perform the gait speed evaluation, or had a pacemaker fitted (impossible to perform electrical bioimpedance) were excluded from the study.
The estimated sample size for the study was 239 individuals, considering a sarcopenia prevalence of 15.4% found in São Paulo, Brazil14, 95% confidence level, 4% margin of error, and population of approximately 1000 older adults who regularly attended these groups. The data collection exceeded the estimated number of older adults for the study (n=400). All participants in this study signed an informed consent form, and the study was approved by the ethics and research committees of Research Ethics Committee (REC) of the Pontifical Catholic University of Rio Grande do Sul (PUCRS) with CAAE registration: 39822114.7.0000.5336, number 1.054.583 and by the REC of the co-participant Franciscan University (UFN) with CAAE registration: 39822114.7.3001.5306, number 1.080.249.
Data collection was conducted from May to November 2015 by properly trained researchers: a doctoral student, university professors, undergraduate students with research scholarship, and nutrition students. Data collection was performed at the locations where the community groups were held, such as parish halls, schools, and others, as well as in the rooms of the Anthropometry Laboratory at UFN, both located in the city of Santa Maria, RS.
The instruments used for data collection included a research questionnaire, the Mini Nutritional Assessment (MNA®), and the International Physical Activity Questionnaire (IPAQ) - short version, all administered through individual interviews. The evaluation of the diagnostic criteria for sarcopenia was also conducted individually. The following variables were collected:
Sociodemographic variables: age groups (60-69 years and ≥70 years); sex (female or male); education level (7 years or more, 4-7 years, and 0-3 years); income (a categorical variable based on the value in reais of the minimum wage at the time of the study, with categories of greater than or equal to 3 minimum wages and less than 3 minimum wages); living alone (no or yes).
Clinical variables: multimorbidity (no or yes), defined as the simultaneous presence of 2 or more self-reported chronic diseases, including stroke, rheumatoid arthritis, asthma, peripheral atherosclerosis, cancer, diabetes mellitus, heart disease, chronic obstructive pulmonary disease, systemic arterial hypertension, obesity, and osteoarthritis; polypharmacy (no or yes), defined as the self-reported use of five or more chronic medications per day15,16; nutritional risk (without risk or at risk) using the MNA®, a multidimensional and validated instrument composed of 18 questions grouped into 4 sections: 1) anthropometric measurements (body mass index [BMI], weight loss in recent months, arm and calf circumference), 2) clinical status (medications, mobility, skin lesions, lifestyle, psychological stress, or neuropsychological problems), 3) dietary assessment (autonomy of eating, quality and number of meals, fluid intake), and 4) personal perception of health and nutrition (the total MNA® score classifies nutritional status as: <17 points [malnourished], 17–23.5 points [risk of malnutrition], and ≥24 points [normal nutritional status])17.
Sarcopenia: as defined by the criteria outlined by the European Working Group on Sarcopenia in Older People 2 - EWGSOP2 (2019)2. Muscle strength was assessed using handgrip strength (HGS), measured with a Jamar® dynamometer through three trials. Maximum HGS was used to classify low muscle strength, defined as HGS <27kg for men and <16kg for women18. Appendicular Muscle Mass (AMM) in kg was assessed using Biodynamics model 310e® bioelectrical impedance analysis. The resistance and reactance values were inserted into the equation by Barbosa-Silva et al.19, with low AMM defined as <20 kg for men and <15kg for women20. Physical performance was evaluated using gait speed (GS) in a habitual walk, performed twice over a 4-meter course. The best time was used to classify GS, with low physical performance defined as GS ≤0.8m/s20. Initially, participants with adequate muscle strength were considered non-sarcopenic. Additionally, participants with low muscle strength were classified as having probable sarcopenia, while those with low muscle strength and low quantity and/or quality of muscle mass were classified as having sarcopenia. Individuals with low muscle strength, low quantity and/or quality of muscle mass, and low physical performance were classified as having severe sarcopenia.
For statistical analysis, the sarcopenia variable was categorized into two groups: "absence," representing non-sarcopenic participants or those with probable sarcopenia, and "presence," which included participants previously classified as having sarcopenia and severe sarcopenia. This classification was adopted since few participants were classified as having severe sarcopenia, leading to unbalanced data. This phenomenon representes a challenge for learning models such as Bayesian networks, as machine learning algorithms are unable to accurately calculate probabilities in this context13.
Imputation and Association Tests: the maximum value of missing data in the variables under study was 0.1%. Therefore, prior to conducting statistical inference procedures, the non-parametric Random Forest imputation method was performed, as it is suitable for both categorical and numerical variables21. Following this, association tests were conducted. Categorical variables were compared using Fisher's exact test and Pearson's chi-square test, while numerical variables were compared using the Student's t-test and Wilcoxon-Mann-Whitney tests, considering the statistical significance level of p<0.05.
Bayesian Networks and Probabilistic Associations: Bayesian network analysis was used to analyze the associations between sarcopenia and other factors studied in the sample. Bayesian networks structures consist of nodes, which represent the variables under study, connected by directed arcs that demonstrate probabilistic associations and influence between nodes. It is important to note that if node A influences node B, the former is termed the "parent" and the latter the "child" (A→B), with the thickness of the arc indicating the strength of the association between A and B. For the network model of this study, the Machine Learning algorithm based on scoring called hill-climbing (HC) was selected. Additionally, the Akaike Information Criterion (AIC) method for selecting the best model was used. These statistical tools enable the associations to be learned from the data and adjusted in the best possible manner. Subsequently, the Maximum Likelihood estimator was used to assess the conditional probability of the variable of interest, sarcopenia, considering its "parents," i.e., the variables that influenced this outcome in the model. This approach allowed for the quantification of the probability of sarcopenia based on associated prior events, a concept grounded in Bayes' theorem, mathematically expressed as: P(Xi| pa(Xi)), where P represents the conditional probability, Xi represents a child node, and pa(Xi) represents the parent node of Xi22.
Accuracy and Stability of the Network Model: a non-parametric resampling test was performed to assess the accuracy of the network model concerning the direction of the estimated associations. To this end, the original dataset was resampled 2500 times, and multiple network models were estimated based on the randomly generated samples. If the arcs between nodes appeared more frequently during the resampling procedure, higher probability values were assigned to the direction, indicating greater accuracy of the associations22.
Finally, the ROC (Receiver Operating Characteristic) curve was estimated to verify the stability of the network model in this study, specifically regarding the ability of the hill-climbing algorithm to detect arcs, compared to the network models derived from the resampling analysis. At this stage, the arcs of the network model estimated from the original sample of this study were used as the reference, and the probability of each arc remaining in the network structure during the resampling procedure was calculated. This allowed for measuring how well the HC learning algorithm detected individual arcs through the ROC curve and the Area Under the ROC Curve (AUC) value. A good ROC curve performance with high AUC values indicates that the network model has good stability and that the algorithm's learning process is not affected by noise23.
All analyses in the present study were conducted using the RStudio statistical software, version 1.1.463, Boston, MA, USA.
DATA AVAILABILITY
The dataset is not publicly available due to concerns about compromising the privacy of the participants.
RESULTS
Table 1 presents the distribution of sociodemographic and clinical variables according to the total sample, sex, and sarcopenia classification. Of the total, most aged between 60 and 69 years (50.5%), female (85.5%), and reporting an income below three minimum wages (62.3%). Additionally, 10.2% were sarcopenic, and the proportion of sarcopenia was statistically higher among those aged 70 years or older (15.2%), with an income below three minimum wages (12.0%), and those with high nutritional risk (20.5%). The averages of muscle strength and mass were lower among sarcopenic individuals, while the average gait speed was higher in this group (p<0.05). Notably, 50% of the male sarcopenic sample had nutritional risk, and the average muscle strength in this group was lower than in the non-sarcopenic group. Among sarcopenic women, muscle strength and mass values were lower; however, gait speed was higher than in non-sarcopenic older women.
Distribution of sociodemographic and clinical variables according to the total sample, sex, and sarcopenia classification. Rio Grande do Sul, RS, Brazil.
In Figure 1, item A shows the Bayesian network model according to the total sample with the variables under study. Sociodemographic factors are in the upper region of the network structure, interacting with each other and with clinical factors such as multimorbidity, polypharmacy, nutritional risk, and sarcopenia. Education was more strongly related to income. Conversely, clinical factors such as multimorbidity, polypharmacy, nutritional risk, and physical activity level were positioned in the lower parts of the network structure. Multimorbidity had a stronger influence on polypharmacy within this set of clinical variables. Additionally, sarcopenia was influenced by the variables of sex and nutritional risk; however, it did not influence any other variable.

Bayesian networks of factors associated with sarcopenia in socially active older adults according to the total sample (A) and by sex, male (B) and female (C). Rio Grande do Sul, RS, Brazil.
Itens B and C display the Bayesian network models according to male and female. In both network models, age is positioned at the top of the network structure, influencing education, which strongly influenced income. Furthermore, sarcopenia was influenced by other nodes but did not affect any other node in the network models. Interestingly, in the male network, nutritional risk was strongly related to sarcopenia, whereas in the female network model, age was moderately related to sarcopenia.
In Figure 2, itens A, B, and C illustrate the conditional probability of sarcopenia according to the total sample by sex. In the total sample, men with nutritional risk had a higher probability of sarcopenia, whereas older women showed a higher probability for the studied outcome. Stratifying the sample by sex confirmed these results, as nutritional risk and advanced age were significant factors increasing the probability of sarcopenia in men and women, respectively.
Conditional probability of sarcopenia in socially active older adults individuals according to the total sample (A), and by sex, male (B) and female (C). Rio Grande do Sul, RS, Brazil.
The results of the resampling test by the total sample and by sex are shown in Table 2. Specific associations were more frequent in the network models estimated during this test, meaning that certain arcs appeared more frequently during resampling and thus had higher probabilities. In the model with the total sample, the arcs with the highest probability were between the nodes of age and living alone (68.9), income and nutritional risk (70.5), polypharmacy and nutritional risk (68.7), and nutritional risk and sarcopenia (76.5). The network models stratified by sex did not show arcs with high probability values. However, the arcs between multimorbidity and income, polypharmacy and living alone, nutritional risk and sarcopenia for men, as well as age and sarcopenia, polypharmacy and nutritional risk, and living alone and polypharmacy, had probabilities greater than 60.0% (Table 2).
Probability of arc direction in the network models estimated in the resampling analysis, according to the total sample and by sex. Rio Grande do Sul, RS, Brazil.
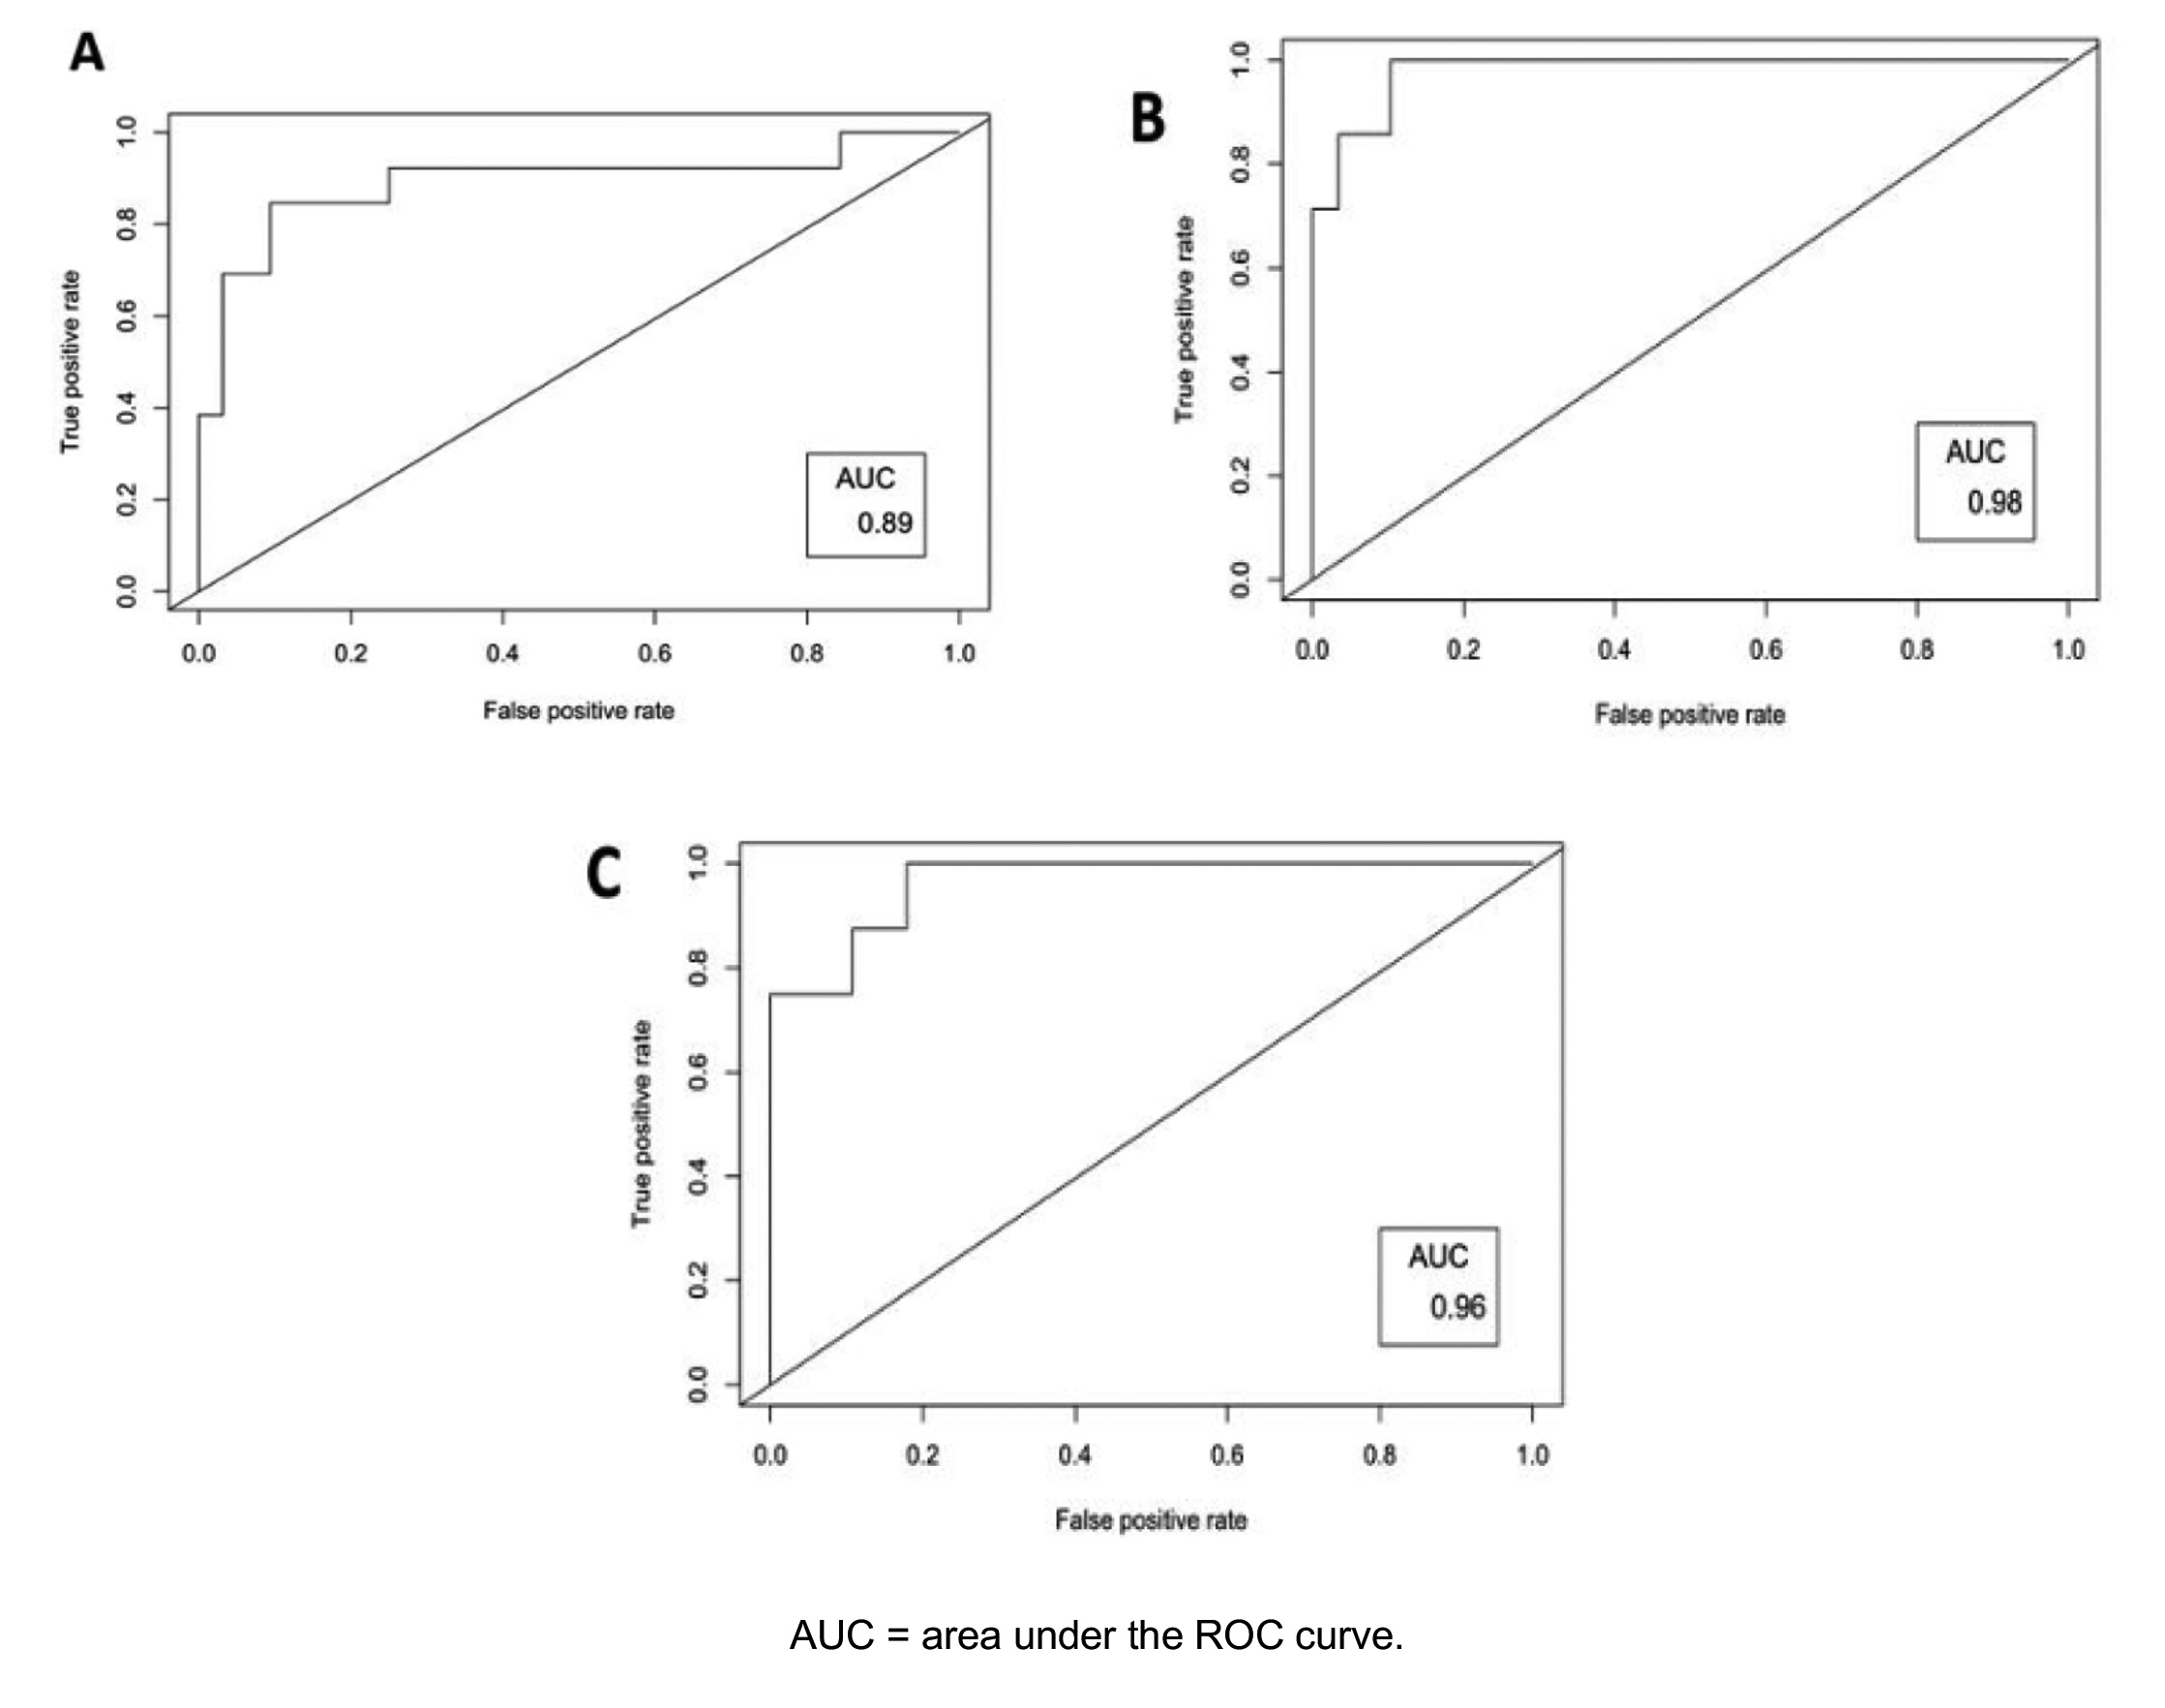
The HC algorithm achieved good performance in detecting arcs in the network models according to the original samples, both with and without sex stratification. When these models were compared with the network models estimated during the resampling process, as observed by the good performance of the ROC curve approaching the upper left corner of the graphs, and the AUC values of 0.89 for the total sample network model, 0.98 for the male network model, and 0.96 for the female network model, suggesting that the algorithm had a good capacity to distinguish between older adults with and without sarcopenia across all models (Figure 3).

ROC curves of the model performance according to the total sample (A) and by sex, male (B) and female (C). Rio Grande do Sul, RS, Brazil.
DISCUSSION
This study found that 10.2% of the older adutls participants had sarcopenia or severe sarcopenia, with the probability of this outcome was higher among male participants and those with nutritional risk, as observed in the Bayesian network model. Two significant sets of interactions were observed within the networks: the first comprised variables such as age, education, income, multimorbidity, and polypharmacy, common to both sexes; the second set involved nutritional status and sarcopenia, with notable differences between men and women.
The first axis represents events related to the health-disease process within the socioeconomic context, where education is linked to income, followed by the presence of multimorbidities and polypharmacy. In this study, the higher prevalence of female participants aligns with the greater participation of women in social groups. This result is expected, considering that after fulfilling their roles as caregivers within the family and home, women seek activities outside their home. Among the older adults, social groups are often seen as spaces for feminine activities such as dance, exercise classes, and crafts. The lower participation of men in collective and educational health activities, such as social groups, can be attributed to enduring gender cultural influences during aging, where men are perceived as family providers and participate less frequently in activities involving self-care in health24.
Regarding the prevalence of sarcopenia found in this study, the findings were not in agreement with previous literature. Using the same diagnostic criteria, Pillatt et al.25 evaluated older adults using primary care services in a city in southern Brazil and found a sarcopenia prevalence of 23.9%25. Otherwise, a recent study showed that 6.8% of Brazilian older adults residents in the community were classified as sarcopenic using same sarcopenia consensus. The authors emphasized the importance of studying sarcopenia as classified by the current European consensus and highlighted the variability in the prevalence of this clinical condition, as observed in previous studies, resulting from differences in the populations studied and levels of healthcare services26.
In both sexes, there was a higher proportion of sarcopenic individuals in the older age groups, corroborating the findings of Petermann-Rocha et al., who observed that advanced age was associated with sarcopenia in a representative sample of community-dwelling older adults27. Peak muscle mass is achieved between 30 and 40 years of age, followed by a progressive physiological decline. By the age of 70 to 80, some individuals may lose more than 40% of their muscle mass and strength28.
Regarding the total sample network model, relationship between sex and sarcopenia was observed. Specifically, there was a higher probability of sarcopenia in the group of men with nutritional risk. Indeed, there is still a scarcity of studies on the probabilistic relationships between male sex and sarcopenia. However, epidemiological studies have demonstrated differences in sarcopenia prevalence between males and females, with evidence suggesting a higher risk of sarcopenia among men compared to women29,30. Specifically, a recent study with community-dwelling older adults showed that sarcopenia prevalence was 13.1% in men and 7.9% in women. Moreover, men exhibited greater changes in body composition compared to women, and the majority of sarcopenic participants had poor nutrition. However, unlike the present study, the authors only observed the association between nutritional status and sarcopenia in the total sample, without considering sex differences31.
Regarding the association between nutritional risk and sarcopenia in the network model considering the total sample, Liguori et al., analyzed data from 473 older adults individuals and found that the prevalence of sarcopenia, sarcopenic obesity, lower physical performance, and lower muscle strength and mass significantly increased with decreasing MNA® scores9. Therefore, these results underscore the importance of using the MNA®, considered the gold standard instrument for assessing nutritional risk in older adults.
Still considering the total sample, socioeconomic factors, including income and education, influence diet quality. In a review study by Nazri et al.10, which analyzed the prevalence of malnutrition and diet quality considering low socioeconomic status, it was observed that poor diet quality is associated with low socioeconomic status10. Additionally, low income hinders the acquisition of protein-rich foods, which are costly in less developed regions. Pérez-Sousa et al.32 found that the intake of proteins, fiber, vitamins, and minerals was positively associated with the income and education level of the evaluated older adults. Furthermore, in the Colombian National Study of Health, Wellbeing, and Aging (SABE - Saúde, bem-estar e envelhecimento), 76.2% of older adults individuals with low socioeconomic status had probable sarcopenia32.
The behavior of the networks formed is quite peculiar after the stratification of the sample according to male and female sex, with sarcopenia being directly influenced by nutritional status in men, while in women, sarcopenia was independently associated with age. The difference in life expectancy between men and women, characterized by greater longevity, a higher accumulation of morbidities, and greater functional dependence in advanced age among women compared to men, may explain this finding. Functional impairment and reduced activities contribute to the loss of skeletal muscle and sarcopenia. Conversely, previous studies demonstrate that loss of vitality and a decline in metabolic functions have a significant impact on the progression of older adults men, often leading to early mortality in this group. These findings support that older adult male population is more vulnerable to changes in intrinsic capacity, particularly vitality, and environmental circumstances, such as nutritional risk, contributing to clinical decline and the development of sarcopenia.
Endogenous factors may also be related to the increased prevalence of sarcopenia among men. Although men physiologically have greater muscle mass than women, the decrease in growth hormone (GH), insulin-like growth factor-1 (IGF-1), and especially testosterone, which has anabolic effects, can lead to a greater decline in muscle mass in males and may influence a poorer adaptation to muscle mass loss compared to women33,34. Data from the 2019 Brazilian National Health Survey reinforce that women, compared to men, seek healthcare services more often for preventive consultations and exams35. This behavior among men may hinder the early diagnosis of chronic diseases, which are associated with the development of sarcopenia. A potential criticism of sex comparisons may be the higher prevalence of women compared to men, which could affect the analyses; however, the bootstrap resampling model supported the results.
Another interesting finding is that physical activity level was not directly related to sarcopenia in either sex, being more strongly influenced by income and age. This may indicate that preventive or reversal actions for sarcopenia should not solely focus on physical exercise but rather adopt a comprehensive approach that considers the multiple aspects of an individual's life.
This study has some limitations. First, it is a cross-sectional study, which hinders the ability to establish a causal association between the variables studied. Although Bayesian networks are also known as causal networks, a longitudinal study is necessary for any conclusion of causality. Thus, the results should be interpreted only as associations between the factors studied. Furthermore, the sample size limits the generalization of the findings. Another limitation refers to the higher proportion of women compared to men, which may affect the results. However, all models, including those stratified by male sex, achieved good performance after the resampling process (AUC greater than 0.89), suggesting that the network algorithm was able to differentiate sarcopenic and non-sarcopenic individuals based on other variables in the model. In addition, the fact that the sample consists of socially active older adults individuals who participate in community groups with activities such as health education lectures, blood pressure monitoring, recreational activities such as games and crafts, and physical activities as dancing and gymnastics, may have influenced the absence of malnutrition, as these older adults are active and seek health-related information, contributing to a healthy lifestyle. Finally, during the collection there was no information about how long each participant had been part of the social group and, therefore, carrying out social activities.
As a positive aspect, this study employed a robust analysis to examine the association between covariates and the outcome of sarcopenia. To our knowledge, this is the first study to address this topic using the Bayesian network model. In addition to its robustness, the estimated Bayesian network model is straightforward to interpret, intuitive, and demonstrates probabilistic associations in a hierarchical manner, which can assist in decision-making for the prevention and treatment of sarcopenia by addressing factors that may precede this common clinical condition in older adults. The findings of this study confirm the association between nutritional risk and the presence of sarcopenia, highlighting the importance of incorporating the MNA® as an indispensable tool in clinical practice during the assessment process of older adults individuals.
CONCLUSION
In conclusion, this study assessed the prevalence of sarcopenia in socially active older adults and found that sarcopenia was associated with both malnutrition and sex in the studied sample. These findings are relevant for early detection, prevention, and treatment of sarcopenia and nutritional risk among more active older adults. Therefore, the inclusion of the Mini Nutritional Assessment (MNA®) and routine sarcopenia evaluation for older adults group programs is recommended. Finally, this research highlighted important aspects regarding the differences in the characterization of sarcopenia and nutritional risk between sexes. Specifically, our findings may reinforce the need for screening for nutritional risk and sarcopenia, particularly among men. Future investigations could explore the relationship between sarcopenia, nutritional risk, and health outcomes such as falls and disabilities in this population, using a Network Analysis approach in a longitudinal study design.
ACKNOWLEDGMENTS
We would like to thank our fellow researchers at NIEATI of UFSM for facilitating access to the community groups in Santa Maria/RS, the presidents and members of these groups for their warm welcome and receptivity, the participants of this study for their immense and valuable collaboration, UFN for their support, the professors at UFN for the training provided, and the students and professors of the UFN Nutrition Program for their commitment and dedication in conducting the data collection and organizing the data.
References
- 1 Rezus E, Burlui A, Cordoneanu A, Ciobanu D, Tamba BI, Rezus C. Inactivity and skeletal muscle metabolism: a vicious cycle in old age. Int J Mol Sci. 2020;21(2):1-21. doi: 10.3390/ijms21020592.
- 2 Cruz-Jentoft AJ, Bahat G, Bauer J, Boirie Y, Bruyère O, Cederholm T, et al. Sarcopenia: revised European consensus on definition and diagnosis. Age Ageing, 2019;48(1):16-31. doi: 10.1093/ageing/afy169
-
3 Petermann-Rocha F, Balntzi V, Gray SR, Lara J, Ho FK, Pell JP, et al. Global prevalence of sarcopenia and severe sarcopenia: a systematic review and meta-analysis. J Cachexia Sarcopenia Muscle. 2022;13(1):86-99. doi: 10.1002/jcsm.12783.
» https://doi.org/ 10.1002/jcsm.12783. -
4 Remelli F, Maietti E, Abete P, Veronese N, Noale M, Maggi S, et al. Prevalence of obesity and diabetes in older people with sarcopenia defined according to EWGSOP2 and FNHI criteria. Aging Clin Exp Res. 2022;34(1):113-120. doi: 10.1007/s40520-021-01949-1.
» https://doi.org/ 10.1007/s40520-021-01949-1. - 5 Sazlina SG, Lee PY, Chan YM, A Hamid MS, Tan NC. The prevalence and factors associated with sarcopenia among community living elderly with type 2 diabetes mellitus in primary care clinics in Malaysia. PLoS One. 2020;15(5):e0233299. doi: 10.1371/journal.pone.0233299
- 6 Swan L, Warters A, O'Sullivan M. Socioeconomic Inequality and Risk of Sarcopenia in Community-Dwelling Older Adults. Clin Interv Aging. 2021;16:1119-1129. doi: 10.2147/CIA.S310774
-
7 Ellulu MS, Patimah I, Khaza'ai H, Rahmat A, Abed Y. Obesity and inflammation: the linking mechanism and the complications. Arch Med Sci. 2017;13(4):851-863. doi: 10.5114/aoms.2016.58928
» https://doi.org/ 10.5114/aoms.2016.58928 - 8 Connolly K, Cunningham C, Murphy N, Romero-Ortuno R, Horgan F. Prevalence of sarcopenia and associated factors in older adults attending a day hospital service in Ireland. Eur Geriatr Med. 2021;12(4):851-862. doi: 10.1007/s41999-021-00463-x
- 9 Liguori I, Curcio F, Russo G, et al. Risk of malnutrition evaluated by Mini Nutritional Assessment and sarcopenia in noninstitutionalized elderly people. Nutr Clin Pract. 2018;33(6):879-886. doi: 10.1002/ncp.10022
- 10 Nazri NS, Vanoh D, Leng SK. Malnutrition, low diet quality and its risk factors among older adults with low socio-economic status: a scoping review. Nutr Res Rev. 2021 Jun;34(1):107-116. doi: 10.1017/S0954422420000189
- 11 Thomas PA. Trajectories of Social Engagement and Limitations in Late Life. J Health Soc Behav. 2011;52(4):430–443. doi: 10.1177/0022146511411922
- 12 Toscano JJO, Oliveira ACC. Qualidade de vida em idosos com distintos níveis de atividade física. Rev Bras Med Esporte. 2009;15(3):169-173. doi: 10.1590/S1517-86922009000300001
- 13 Leevy JL, Khoshgoftaar TM, Bauder RA, Seliya N. A survey on addressing high‑class imbalance in big data. J Big Data. 2018;5:42. doi: 10.1186/s40537-018-0151-6
- 14 Alexandre TDS, Duarte YADO, Santos JLF, Lebrão ML. Prevalence and associated factors of sarcopenia among elderly in Brazil: Findings from the SABE study. J Nutr Health Aging. 2014;18(3):284–90. doi: 10.1007/s12603-013-0413-0
- 15 Ramos LR, Tavares NUL, Bertoldi AD, et al. Polypharmacy and polymorbidity in older adults in Brazil: A public health challenge. Rev Saúde Pública. 2016;50 (suppl 2):9s. doi: 10.1590/s1518-8787.2016050006145
- 16 Secoli SR. Polifarmácia: interações e reações adversas no uso de medicamentos por idosos. Rev Bras Enferm. 2010;63(1):136–40. doi: 10.1590/S0034-71672010000100023
- 17 Guigoz Y. The Mini Nutritional Assessment (MNA®) review of the literature – What does it tell us? J Nutr Health Aging. 2006;10(6):466–87, discussion 485-7. PMID: 17183419.
- 18 Dodds RM, Syddall HE, Cooper R, et al. Grip strength across the life course: normative data from twelve British studies. Plos One. 2014;9:(12):e113637. doi: 10.1371/journal.pone.0113637
- 19 Barbosa-Silva TG, Gonzalez MC, Bielemann RM, et al. 2 + 2 (+ 2) = 4: A new approach for appendicular muscle mass assessment by ultrasound. Nutrition. 2021;83:111056. doi: 10.1016/j.nut.2020.111056
- 20 Studenski SA, Peters KW, Alley DE, et al. The FNIH sarcopenia project: rationale, study description, conference recommendations, and final estimates. J Gerontol A Biol Sci Med Sci. 2014;69(5):547-558. doi: 10.1093/gerona/glu010
-
21 Stekhoven DJ. missForest: Nonparametric missing value imputation using random forest. R package version 1.5. 2011. Disponível em: http://cran.r-project.org/
» http://cran.r-project.org/ - 22 Caravagna G, Ramazzotti D. Learning the structure of Bayesian Networks via the bootstrap. Neurocomputing. 2021; 448: 48-59. doi: 10.1016/j.neucom.2021.03.071
- 23 Sing T, Sander O, Beerenwinkel N, Lengauer T. ROCR: visualizing classifier performance in R. J. Bioinformatics. 2005; 21(20): 3940-3941. doi: 10.1093/bioinformatics/bti62
- 24 Lima Filho BF, Patrício ÍF, Dantas DD, Oliveira LP, Sá FD. Perfil dos idosos participantes de grupos de convivência em unidades básicas de saúde do município de Santa Cruz, RN, Brasil. Rev Kairós. 2019;22(1):273-290. doi: 10.23925/2176-901X.2019v22i1p273-290
- 25 Pillatt AN, Berlezi EM, De Jesus LB, Schneider RH, Franz LBB. Influência da obesidade nos critérios de classificação de sarcopenia em idosos. Rev Bras Geriatr Gerontol. 2020;23(3):e200083. doi: 10.1590/1981-22562020023.200083
- 26 Pereira CC, Pagotto V, de Oliveira C, Silveira EA. Sarcopenia and mortality risk in community-dwelling Brazilian older adults. Sci Rep. 2022;12:17531. doi: 10.1038/s41598-022-22153-9
- 27 Petermann-Rocha F, Chen M, Gray SR, Ho FK, Pell JP, Celis-Morales C. Factors associated with sarcopenia: A cross-sectional analysis using UK Biobank. Maturitas. 2020;133:60-67. doi: 10.1016/j.maturitas.2020.01.004
- 28 Ilich JZ, Kelly OJ, Inglis JE, Panton LB, Duque G, Ormsbee MJ. Interrelationship among muscle, fat, and bone: connecting the dots on cellular, hormonal, and whole body levels. Ageing Res Rev. 2014;15:51-60. doi: 10.1016/j.arr.2014.02.007
- 29 Landi F, Liperoti R, Fusco D, et al. Prevalence and risk factors of sarcopenia among nursing home older residents. J Gerontol A Biol Sci Med Sci. 2012;67(1):48-55. doi: 10.1093/gerona/glr035.
- 30 Patel HP, Syddall HE, Jameson K, et al. Prevalence of sarcopenia in community-dwelling older people in the UK using the European Working Group on Sarcopenia in Older People (EWGSOP) definition: findings from the Hertfordshire Cohort Study (HCS). Age Ageing. 2013;42(3):378-84. doi: 10.1093/ageing/afs197.
- 31 Murawiak M, Krzymińska-Siemaszko R, Kaluźniak-Szymanowska A, et al. Sarcopenia, Obesity, Sarcopenic Obesity and Risk of Poor Nutritional Status in Polish Community-Dwelling Older People Aged 60 Years and Over. Nutrients. 2022;14(14):2889. doi: 10.3390/nu14142889.
- 32 Pérez-Sousa MÁ, Pozo-Cruz JD, Cano-Gutiérrez CA, Izquierdo M, Ramírez-Vélez R. High Prevalence of Probable Sarcopenia in a Representative Sample From Colombia: Implications for Geriatrics in Latin America. J Am Med Dir Assoc. 2021;22(4):859-864.e1. doi: 10.1016/j.jamda.2020.10.021
- 33 Santos JL, Trennepohl C, Rosa CB, Garces SBB, Myskiw J de C, Costa DH. Impact of sarcopenia, sedentarism and risk of falls in older people’s health self-perception. Fisioter Mov. 2019; 32:e003217. doi: 10.1590/1980-5918.032.ao17
- 34 Hai S, Cao L, Wang H, et al. Association between sarcopenia and nutritional status and physical activity among community-dwelling Chinese adults aged 60 years and elderly. Geriatr Gerontol Int. 2017;17(11):1959-1966. doi: 10.1111/ggi.13001
-
35 Instituto Brasileiro de Geografia e Estatística (IBGE). Pesquisa nacional de saúde: 2019: informações sobre domicílios, acesso e utilização dos serviços de saúde: Brasil, grandes regiões e unidades da federação. Rio de Janeiro: IBGE; 2019. Disponível em: https://biblioteca.ibge.gov.br/visualizacao/livros/liv101748.pdf
» https://biblioteca.ibge.gov.br/visualizacao/livros/liv101748.pdf
Edited by
-
Edited by
Cristian Arnecke Schröder