 Derivation of frequency factors for Probable Maximum Precipitation (PMP) estimation through stochastic simulation of annual precipitation maxima in tropical convective regions
ABSTRACT
This study presents a probabilistic approach for estimating the point Probable Maximum Precipitation (PMP) in a tropical region of northern Brazil, improving the representation of variability and uncertainty associated with extreme rainfall events. Annual maximum precipitation series were stochastically simulated using the Monte Carlo Method, combined with extreme value distributions based on a selection of historical records from 52 rainfall stations. From the resulting synthetic annual maxima series, frequency factors were derived and subsequently employed for PMP estimation. The results revealed temporal and spatial patterns consistent with the convective dynamics of the region, notably a marked intensification of PMP estimates for short-duration events. This probabilistic framework complements the deterministic Regional Upper Envelopes addressed by Martins & Pinto (2026), offering a flexible and robust tool for hydrological risk assessment in tropical environments in a portion of the state of Pará.
Keywords:
Probable Maximum Precipitation; Synthetic frequency factors; Monte Carlo method; Hydrological uncertainty; Extreme distribution
RESUMO
Este estudo apresenta uma abordagem probabilística para a estimativa pontual da Precipitação Máxima Provável (PMP) em uma região tropical do norte do Brasil, aprimorando a representação da variabilidade e incerteza associadas a eventos extremos de precipitação. As séries de precipitação máxima anual foram simuladas estocasticamente utilizando o Método Monte Carlo, combinadas com distribuições de valores extremos com base em uma seleção de registros históricos de 52 postos pluviométricos. A partir das séries sintéticas de máximos anuais resultantes, foram derivados fatores de frequência e posteriormente utilizados para a estimativa do PMP. Os resultados indicaram padrões temporais e espaciais coerentes com a dinâmica convectiva regional, notadamente uma intensificação acentuada das estimativas de PMP em eventos de curta duração. Esta estrutura probabilística complementa as envoltórias regionais determinísticas apresentadas por Martins & Pinto (2026), oferecendo uma ferramenta flexível e robusta para avaliação de risco hidrológico em ambientes tropicais em uma porção do estado do Pará.
Palavras-chave:
Precipitação Máxima Provável; Fatores de frequência sintéticos; Método de Monte Carlo; Incerteza hidrológica; Distribuição extrema
INTRODUCTION
Estimating the Probable Maximum Precipitation (PMP) is a critical task for hydrological safety assessments and infrastructure design, particularly in regions exposed to intense convective storms. PMP serves as a theoretical upper bound of precipitation, often used in dam safety studies, flood risk analysis, and regulatory frameworks (Szymanski & Davies, 2004; World Meteorological Organization, 2009; International Commission on Large Dams, 2011, 2022; CBDB apud Pinheiro, 2011; ABNT, 2017; Agência Nacional de Mineração, 2022, Eletrobras, 2003; Agência Nacional de Águas e Saneamento Básico, 2016; Salgado et al., 2025). Traditionally, the Hershfield Statistical Method (Hershfield, 1961a; 1961b; 1965), has been one of the most widely applied techniques to statistically estimate PMP (there is another method called hydrometeorological/physical), using a deterministic formulation that involves a frequency factor derived from historical series of maximum annual precipitation.
However, this approach has limitations when applied to tropical climates, especially in equatorial regions dominated by localized, high-intensity rainfall generated by Mesoscale Convective Complexes (MCCs) and the Intertropical Convergence Zone (ITCZ) (Salio et al., 2007; Reboita et al., 2010; Lyra et al., 2020; Martins, 2024). The deterministic upper envelope constructed by Hershfield was based on data from temperate and cold climates in the Northern Hemisphere, which do not reflect the physical and statistical behavior of precipitation in tropical regions.
In response to these limitations, Martins & Pinto (2026) developed a deterministic Regional Upper Envelope for the frequency factor () based on 52 rainfall stations in northern Brazil, within a tropical/equatorial, hot, and humid region. Their study demonstrated that values decrease with increasing duration and differ significantly from the classical upper envelope proposed by Hershfield. However, despite improving regional representativeness, the deterministic nature of the method still limits its capacity to incorporate uncertainty and probabilistic behavior associated with extremes.
In this context, the present study aims to propose a probabilistic framework based on stochastic simulation in which annual maximum precipitation series are stochastically simulated using the Monte Carlo Method (MCM), based on fitted extreme value distributions. From these synthetic annual maxima series, frequency factors are subsequently derived and employed for the estimation of point Probable Maximum Precipitation (PMP) across multiple rainfall durations.
One of the comparative bases for this research is the work of Burger (2014), who analyzed frequency factor variation across rainfall stations in the state of Paraná (Brazil) and developed a synthetic simulation of maximum annual precipitation using MCM combined with a multivariate autoregressive model of order one (AR(1)), assuming a Log-Normal-3P distribution and a 99.9% probability of non-exceedance.
Even so, the present work departs from Burger’s methodology by proposing a simplified and more appropriate framework for annual precipitation extremes, based on the assumption of statistical independence between annual maxima. Instead of using an autoregressive structure, this study combines MCM, pseudo-random number generation, and quantile estimation via extreme values distributions, reflecting the independent nature of extreme rainfall observations and facilitating wider applicability across regions with limited data.
More recently, Feliciano (2025) proposed a stochastic framework for rainfall simulation aimed at deriving synthetic frequency factors, based on the generation of daily precipitation series using a two-part (occurrence–amount) modeling approach. The study relied on data from 481 rainfall stations distributed across the state of Minas Gerais, Brazil, and explicitly accounted for climatic heterogeneity by distinguishing semi-arid, temperate, and tropical sub-regions. The highest synthetic frequency factors for 24 hours were obtained in the tropical sub-region, with maximum values of = 14.04 and = 14.62.
This paper, therefore, represents the second part of a two-part research effort. While the first study (Martins & Pinto, 2026) constructed a deterministic regional framework for PMP estimation in tropical regions, the present work introduces a stochastic simulation framework for maximum annual precipitation series and subsequent extraction of frequency factors based on sample percentiles, offering a flexible and robust alternative to fixed-envelope methods.
It is worth noting that this initiative aligns with recent international recommendations. According to National Academies of Sciences Engineering and Medicine (2024), future methodologies for PMP estimation should move away from deterministic upper envelopes and embrace probabilistic approaches informed by climate models, such as Global Climate Models (GCMs), particularly under a non-stationary climate regime. In this context, Hiraga et al. (2025) proposed a novel dynamical model-based method to estimate Probable Maximum Precipitation (PMP) under climate change and presented a case study of the developed methodology across three watersheds in central Chile. Although the present study does not integrate GCM outputs, it represents an intermediate and essential step toward such advancements, as it introduces a probabilistic methodology that accounts for the natural variability and uncertainty of extremes.
THEORETICAL BASIS
The stochastic simulation of hydrological series presents an opportunity to generate alternative trajectories of annual maximum precipitation beyond those historically observed. This approach enables the stochastic selection of representative values for each rainfall station, enhancing robustness, particularly in contexts where the historical record is limited, as is often the case for stations with short monitoring periods.
In this study, it is assumed that annual maximum precipitation values are statistically independent and stationary. This assumption is supported by the nature of extreme hydrological events, which are typically governed by isolated atmospheric phenomena. This premise implies that no observation in the time series exerts influence over subsequent ones, consistent with the behavior of annual maxima resulting from convective processes. The use of non-parametric tests, such as the Wald–Wolfowitz test (Wald & Wolfowitz, 1943), can assist in verifying the plausibility of the independence hypothesis, as well as the Mann-Kendall test (Mann, 1945; Kendall, 1975; Kendall & Gibbons, 1990) to test for possible trends.
Under these conditions, the Monte Carlo Method (MCM) is a suitable tool for simulating synthetic annual maximum precipitation values. MCM employs pseudo-random numbers uniformly distributed in the interval to represent non-exceedance (or exceedance) probabilities associated with a given distribution. These random probabilities are then transformed into quantiles using the inverse cumulative distribution functions fitted to the observed data of annual maximum precipitation values. Based on the descriptive statistics of the historical time series, it is possible to estimate parameters of extreme value distributions and generate synthetic series of length , where is equal to the length of the original series. For each synthetic series of length , the frequency factor is calculated using Equation 1. Thus, frequency factors will be generated for each rain gauge. This process allows the extraction of a set of frequency factors (K values), from which upper quantiles (e.g., 95th or 99th percentiles) can be derived to represent extreme behavior at each station.
where is the local frequency factor; is the maximum value of the time series; is the mean of the series excluding the value of maximum annual rainfall (); is the standard deviation of the series excluding the value of maximum annual rainfall ().
A prior attempt to obtain synthetic K values under a different framework was proposed by Burger (2014), who analyzed rainfall stations in the state of Paraná, Brazil. The author applied MCM combined with a first-order multivariate autoregressive model (AR(1)) under the assumption of a three-parameter log-normal distribution to synthetically simulate maximum annual precipitation series. This simulation aimed to estimate PMP values associated with the 99.9th percentile of the simulated set of K values. However, the use of AR(1) models requires verifying assumptions of stationarity, autocorrelation, and normally distributed residuals (Box & Jenkins, 1970; Box et al., 1994; Chatfield, 2001). These presuppositions are not always valid for extreme precipitation data, which frequently exhibit positive skewness and heavy tails, typically better captured by distributions such as GEV, Gumbel, or Log-Normal.
Departing from Burger's methodology, this study proposes a simpler and more widely applicable framework. It dispenses with AR(1) modeling, and instead, simulates series of maximum annual precipitation using extreme value probability distributions. From these series, it is possible to conceive a set of K values, as defined in Equation 1. This approach involves the assumption of independence among the annual maximum and avoids the need for transformations or corrections inherent in autoregressive models. It also aligns with the physical understanding of convective rainfall dynamics in tropical regions, where extreme events are typically temporally isolated.
The combination of MCM and extreme value theory offers not only modeling flexibility but also improved representation of upper-bound PMP estimates under uncertainty. By extracting percentile-based synthetic values, this method provides a practical alternative to deterministic upper envelopes, enabling probabilistic interpretation and adaptation to varying data conditions.
MATERIAL AND METHODS
Study area and dataset
This study was conducted in the same tropical/equatorial region of northern Brazil previously analyzed in Martins & Pinto (2026), encompassing a radius of 200 km centered around the municipality of Barcarena, in the state of Pará (geographic coordinates: latitude -1.5058°, longitude -48.6271°, EPSG: SIRGAS 2000). The region is fully located within the Amazon biome and is predominantly influenced by convective atmospheric mechanisms such as the Intertropical Convergence Zone (ITCZ) and Mesoscale Convective Complexes (MCCs), which favor short-duration, high-intensity rainfall events (Salio et al., 2007; Reboita et al., 2010; Lyra et al., 2020; Martins, 2024).
The study area is mainly located in zone 2 of homogeneous climate risk as defined by Lima et al. (2025). The authors mention that zone 2 is a region “directly influenced by the ITCZ and, in its coastal part, by the Easterly Wave Disturbances. There is an out-of-phase relationship with the ONI, PDO, and AMO climate indices, influencing its interannual (ONI) and decadal/multidecadal (PDO/AMO) variability”. Lima et al. (2025) divided the Brazilian territory into 7 zones to facilitate the design of a climate risk management strategy.
A total of 52 rainfall stations were selected for the analysis, based on criteria of data availability and spatial coverage within the defined radius. The stations are managed by national and regional meteorological agencies, and the historical precipitation records range from 1949 to 2023, with an average time series length of 34 years per station.
The temporal aggregation of the data followed six rainfall durations: 24 hours, 3 days, 5 days, 10 days, 15 days, and 30 days. For each station and duration, annual maximum precipitation values were extracted, forming the basis for the empirical frequency factor upper envelope method, formulated by Hershfield (1961a; 1961b; 1965) from the general frequency equation of Chow (1951), and later adapted by Martins & Pinto (2026) for tropical environments. The purpose of these frequency factor upper envelopes is to maximize the values.
The referenced adaptation consisted fundamentally in constructing regional upper envelopes of frequency factors () based on the 52 rainfall stations in the study region, thereby capturing the distinct climatic behavior of convective systems typical of equatorial areas, in contrast to the temperate and cold climatological characteristics of the North American stations that underpinned Hershfield’s classical upper envelope.
It is important to note that, while Martins & Pinto (2026) focused on constructing a deterministic regional upper envelope of frequency factors, the present study utilizes the same dataset to implement a probabilistic simulation for the annual maximum precipitation series based on the MCM, with the aim of extracting synthetic frequency factors () associated with percentile “” and to quantify uncertainty in PMP estimation. The geographic distribution of the stations can be found in Martins & Pinto (2026).
Methodological framework
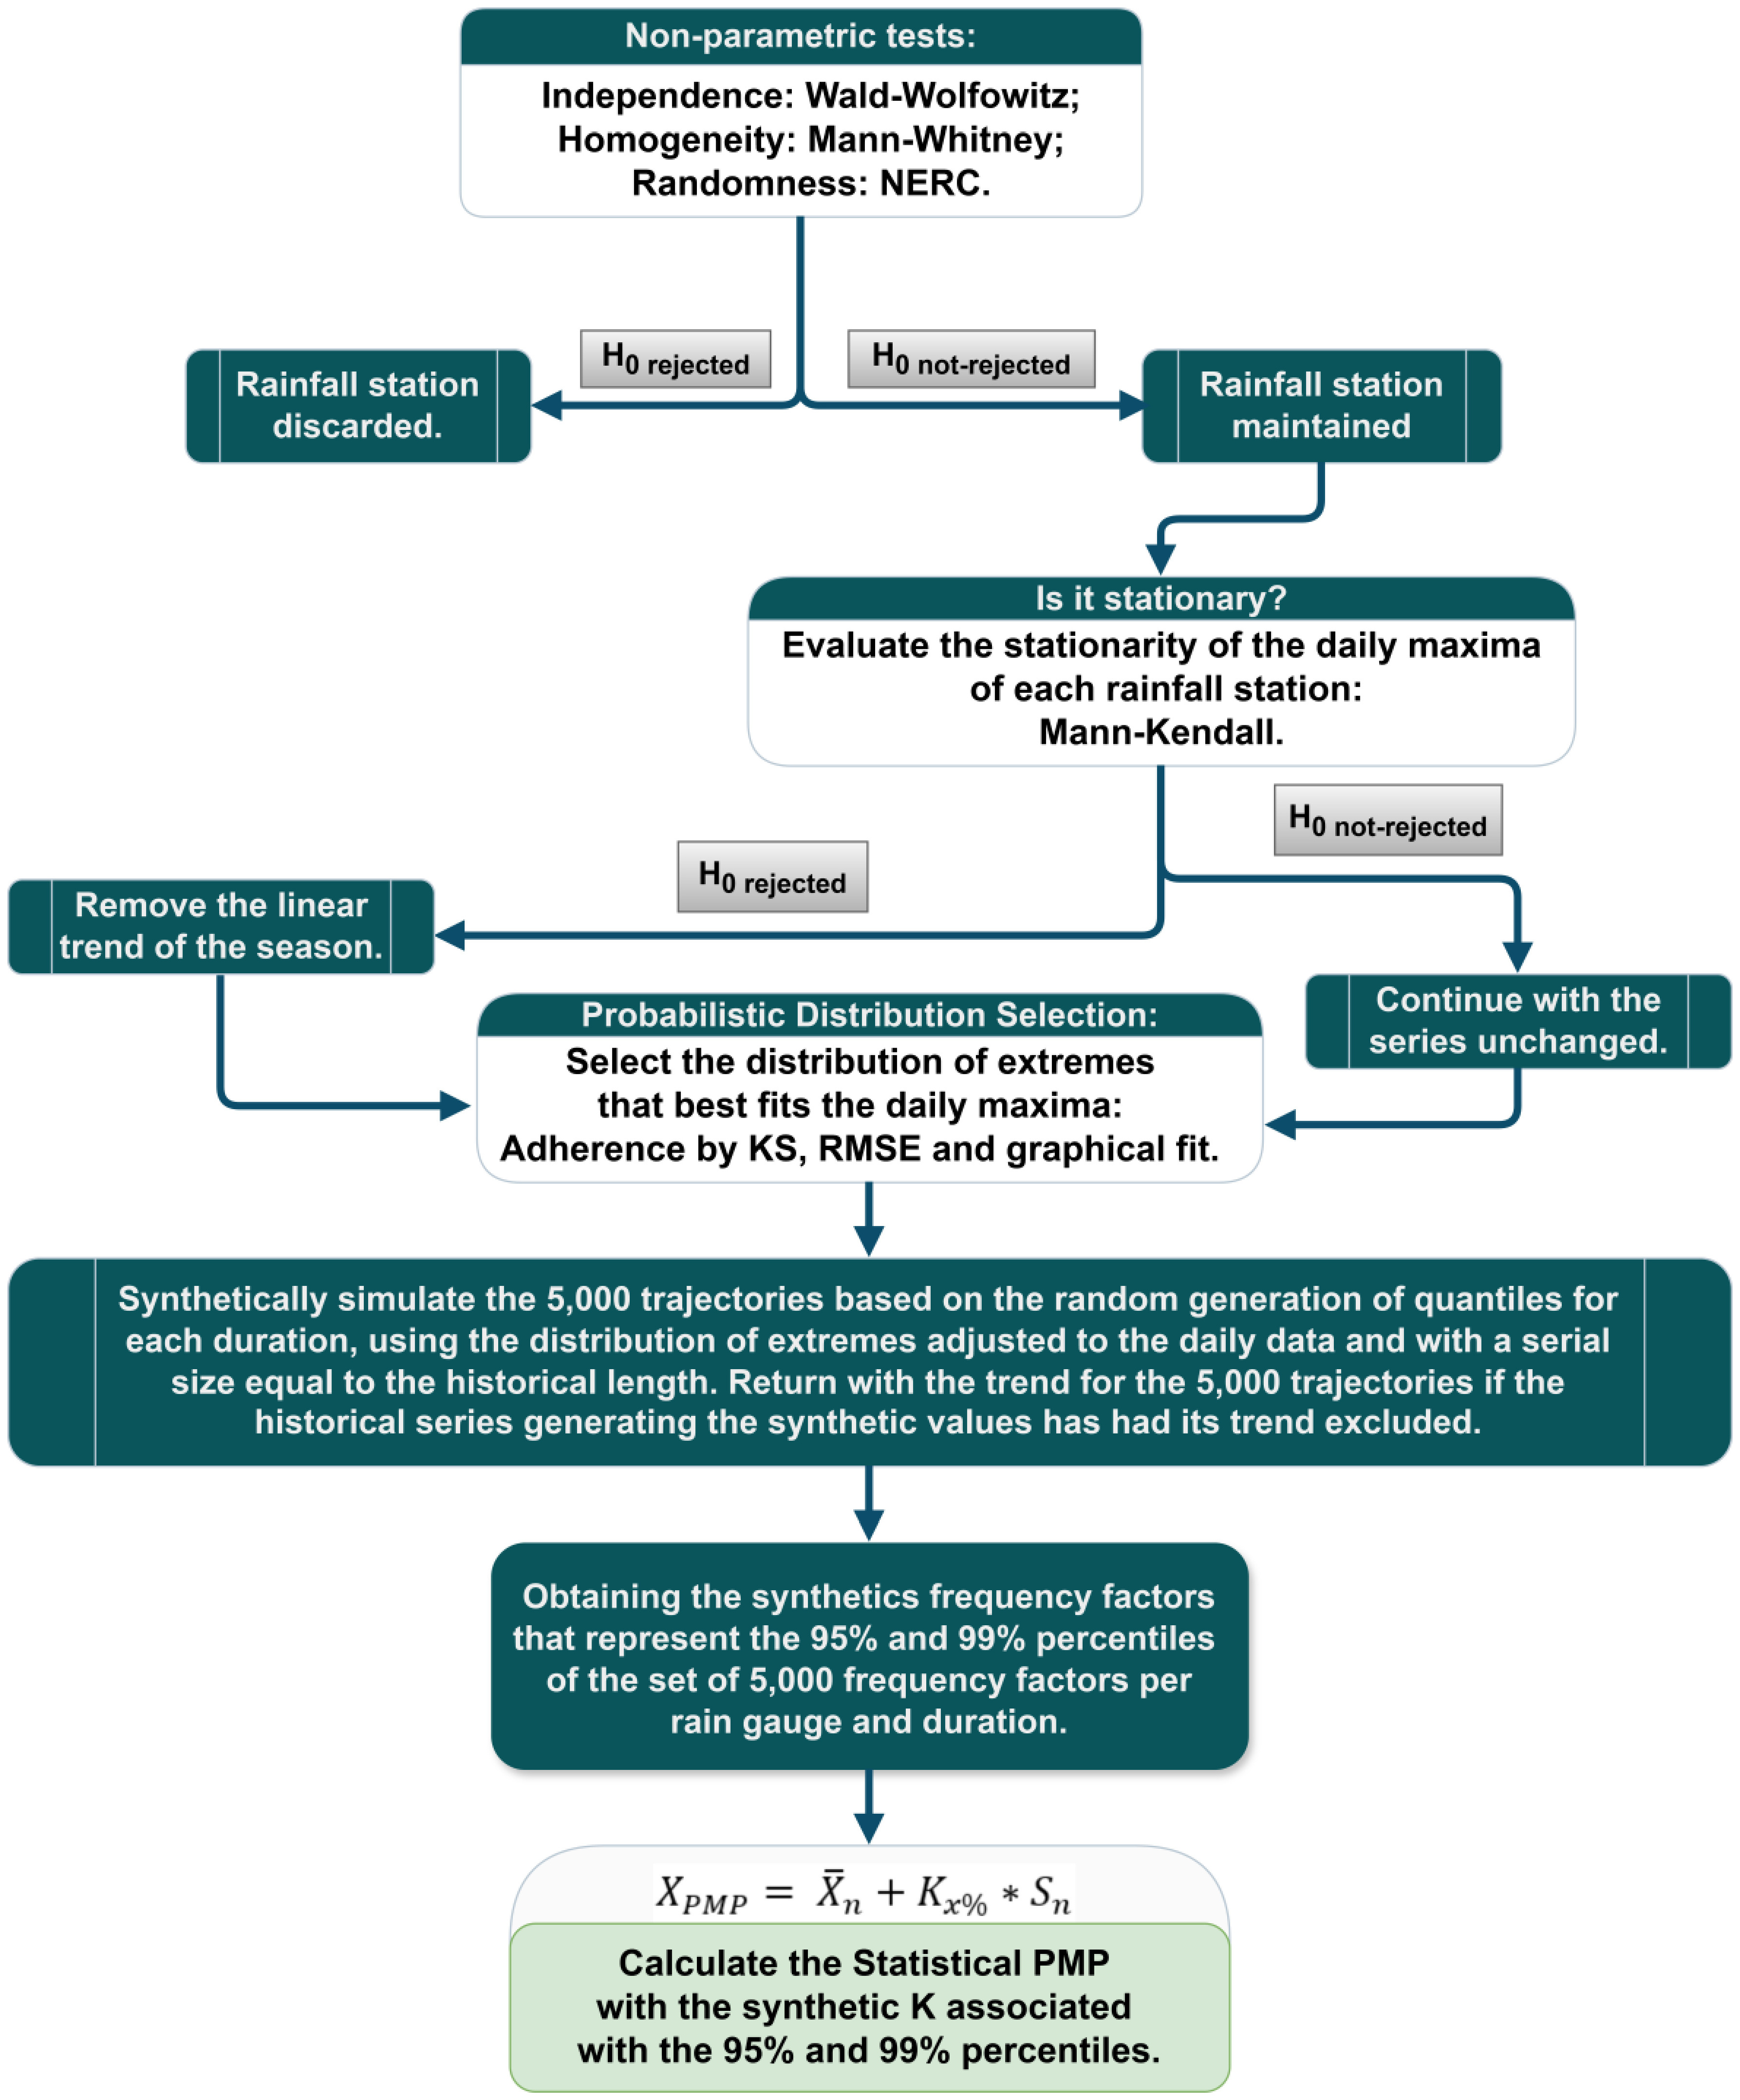
The methodology developed in this study employs a stochastic simulation approach using the Monte Carlo Method (MCM) to generate synthetic series, calculate the frequency factors and derive Probable Maximum Precipitation (PMP) estimates. The framework consists of six key stages: 1) statistical pre-screening of time series; 2) distribution fitting; 3) random sampling of exceedance probabilities; 4) generation of synthetic series and calculation of their respective synthetic K values; 5) extraction of percentile-based frequency factors, and; 6) PMP estimation using synthetic K values. The overall process is summarized in the flowchart shown in Figure 1.

Prior to simulation, each rainfall station’s annual maximum precipitation series was subjected to a sequence of statistical hypothesis tests to ensure that the assumptions of the frequency analysis were satisfied. These assumptions — independence, homogeneity, randomness, and stationarity — were verified through the following non-parametric tests, as recommended by Naghettini & Pinto (2007): Wald-Wolfowitz test (Wald & Wolfowitz, 1943) to assess independence; Mann-Whitney test (Mann & Whitney, 1947) to evaluate homogeneity; NERC test (Natural Environment Research Council, 1975) to verify randomness, and; Mann-Kendall test (Mann, 1945; Kendall, 1975; Kendall & Gibbons, 1990) to test for trends and stationarity.
A significance level of 2.5% was adopted for all tests, instead of the conventional 5%. This stricter threshold was selected to reduce the probability of Type I errors (false positives) when applying multiple statistical tests to the same time series, an important consideration in regional hydrological analyses. Although a formal Bonferroni correction was not applied, the underlying principle was respected: when several hypotheses are tested simultaneously, the probability of incorrectly rejecting at least one true null hypothesis increases. Lowering the significance level therefore serves as a conservative adjustment to mitigate this risk (Wilks, 2011; Andrade, 2019; Herzog et al., 2019; Cortés et al., 2020).
At the same time, care was taken to avoid a threshold so restrictive that it would excessively increase the probability of Type II errors (false negatives), which could lead to retaining stations with potentially invalid statistical properties. The selected 2.5% level thus represents a compromise between statistical caution and the practical need to preserve spatial coverage, allowing 42 out of the previously considered 52 rainfall stations to be included in the simulation process. This balance is consistent with hydrological studies that adopt conservative thresholds to control false-positive/false-negative rates in trend and homogeneity testing (Zhang et al., 2001; Wilks, 2011).
In addition to the significance criteria, minimum sample size conditions were also adopted to validate the results of each test. For the Mann-Whitney test (homogeneity), the sample was split into two sub-samples ( and ), both with sizes greater than 20 ( + = ), which implies a minimum total sample size of . Stations that failed this criterion or had p-values below the threshold were excluded. For the NERC test (randomness), a minimum sample size of was required to ensure the test's reliability. In contrast, the Mann–Kendall test (stationarity) was applied without a specific constraint on the number of observations.
Although the Wald-Wolfowitz test (independence) was also applied, no stations were excluded solely based on this criterion. This decision is grounded in the hydrological rationale that annual precipitation maxima, obtained from alternating wet and dry periods, tend to be inherently independent. Nonetheless, stations with questionable results in the independence test were flagged for manual data consistency review and validation prior to simulation.
For each rainfall station and precipitation duration (24 hours, 3 days, 5 days, 10 days, 15 days, and 30 days), the best-fitting probability distribution was selected based on the non-parametric Kolmogorov-Smirnov test (available in Naghettini & Pinto, 2007), at 5% significance level, RMSE between the empirical and theoretical quantiles (Equation 2), as well as a visual analysis of the graphical fit.
where: is the theoretical quantile associated with rainfall station; is the empirical quantile associated with rainfall station; is the total number of observations of the rainfall station.
The candidate probability distributions for the fit were Exponential (exp), Gamma (gam), Generalized Pareto (gpa), Generalized Logistic (glo), GEV (gev), Gumbel (gum), Log-Normal (ln2), Log-Normal-3P (ln3), Log-Pearson-III (lp3) and Pearson-III (pe3). The parameters of the theoretical candidate probability distributions were calculated using the L-moments method described in Hosking & Wallis (1997) and Naghettini & Pinto (2007). Finally, the number of stations adjusted for each probabilistic distribution are shown in Table 1.
Number of rainfall stations associated with each of the probabilistic distributions included in the study.
Using the lmom package in the R programming language, the inverse functions of the selected probability distributions were computed from the parameters estimated for each station. A total of 5,000 pseudo-random values were generated from a uniform distribution between 0 and 1. These values were fed into the inverse CDFs to generate 5,000 synthetic time series of annual maxima, each with the same length as the historical record.
For stations identified as non-stationary in the Mann–Kendall test, the original linear trend was estimated and later reintroduced to the synthetic series, preserving the pattern of non-stationarity for the subsequent stages of analysis.
Next, based on Equation 1, frequency factors () were calculated for each of the 5,000 synthetic time series, resulting in a sample of 5,000 K values per station and duration. From these simulated distributions, the and percentiles were extracted, denoted as and .
Finally, the synthetic PMP estimates were computed using Equation 3, replacing with the simulated percentile-based factors. This methodology enables the incorporation of uncertainty into PMP estimation and provides a probabilistic alternative to deterministic methods.
where is the estimate of the Probable Maximum Precipitation (PMP) for a given location and duration; is the mean of the series of n values of maximum annual rainfall, for a given duration; is the standard deviation of the series of n values of maximum annual rainfall; is the synthetic frequency factor at the selected percentile .
It is important to emphasize that the proposed Monte Carlo framework does not aim to explicitly reproduce the physical dynamics of mesoscale convective systems. Instead, it operates under the premise that the observed annual maximum precipitation series inherently embed the statistical signature of convective rainfall regimes characteristic of the study region. By preserving the marginal distributions and extreme-value behavior derived from these observed records, the synthetic simulations extrapolate the probabilistic structure associated with convective extremes, rather than explicitly modeling the underlying atmospheric processes.
RESULTS AND DISCUSSIONS
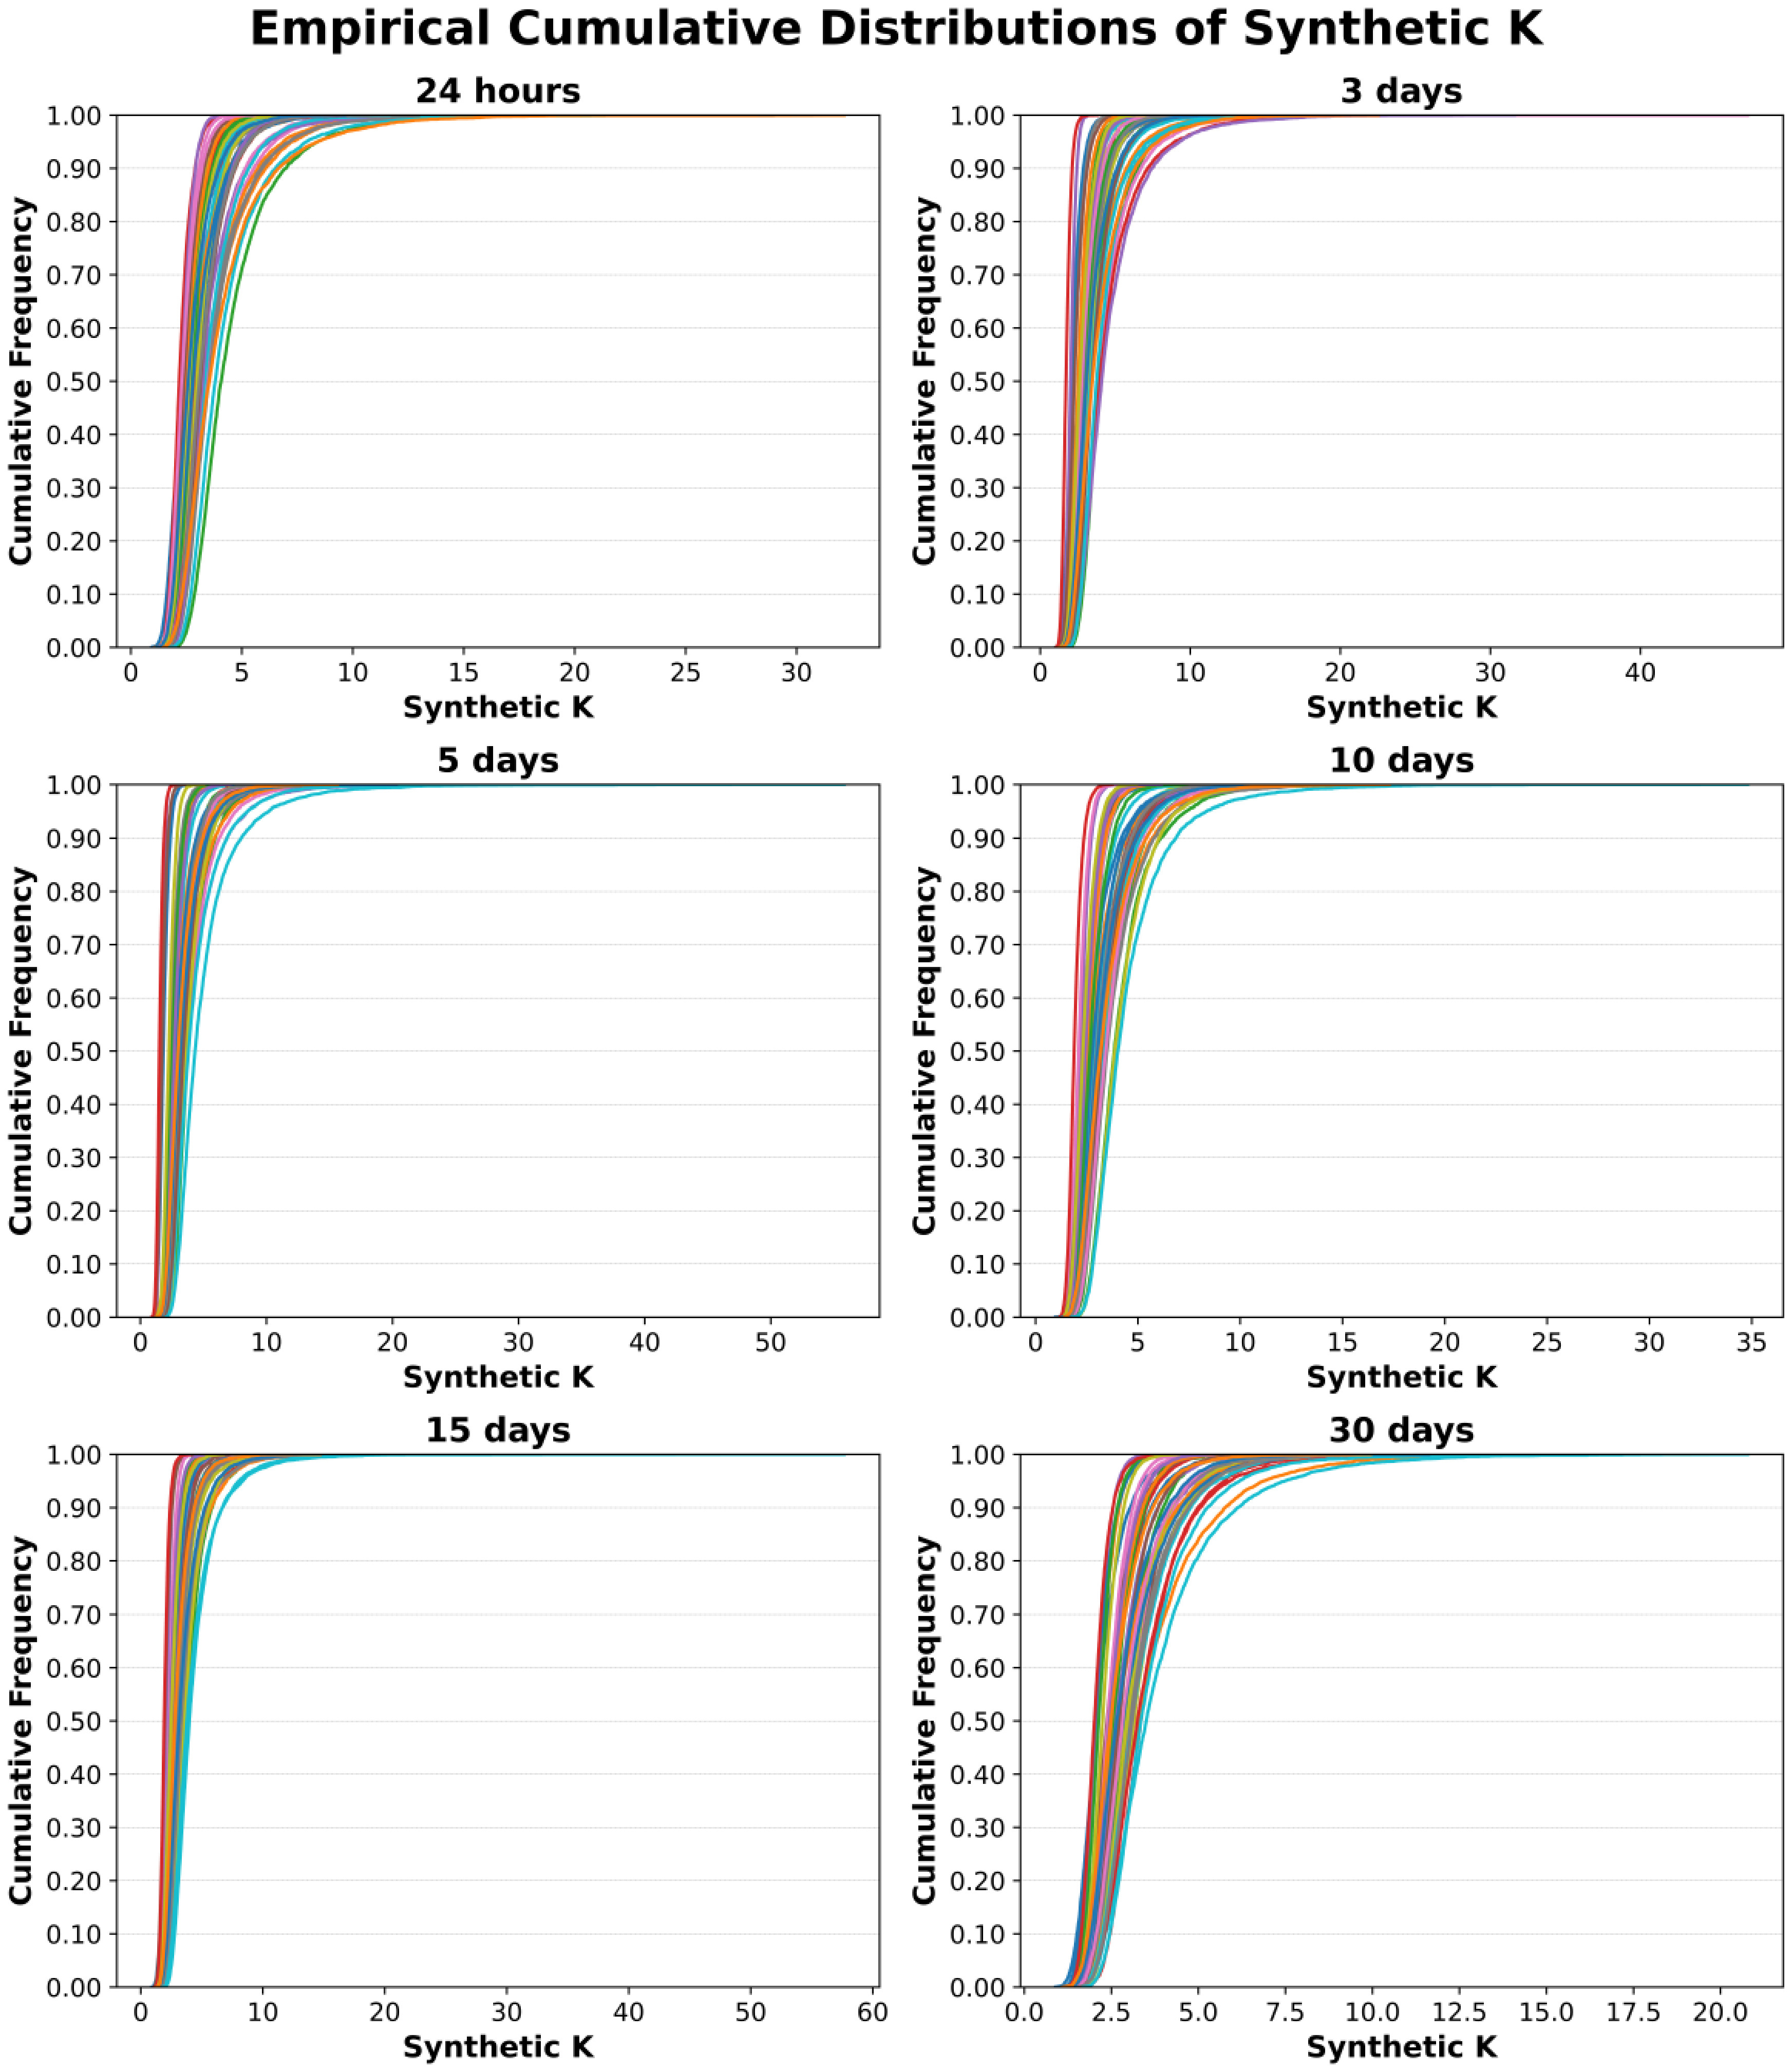
The cumulative distribution curves presented in Figure 2 portray the empirical behavior of the 5,000 synthetic frequency factors () generated for each of the 42 rainfall stations and six precipitation durations. Each line in the plots corresponds to one rainfall station and shows the cumulative distribution of the synthetic values obtained from the Monte Carlo simulation. These curves confirm the internal consistency of the selected rainfall stations. It is precisely between the 90th and 100th percentiles that the greatest variations in frequency factors occur, justifying the choice of and in this paper.
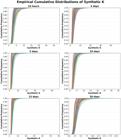
Notably, the curves exhibit a clear positive skewness, indicating the presence of high-magnitude outliers, an expected feature in extreme value analyses. This skewed behavior is aligned with the empirical findings presented in Martins & Pinto (2026), where similar asymmetric patterns were detected in the observed data.
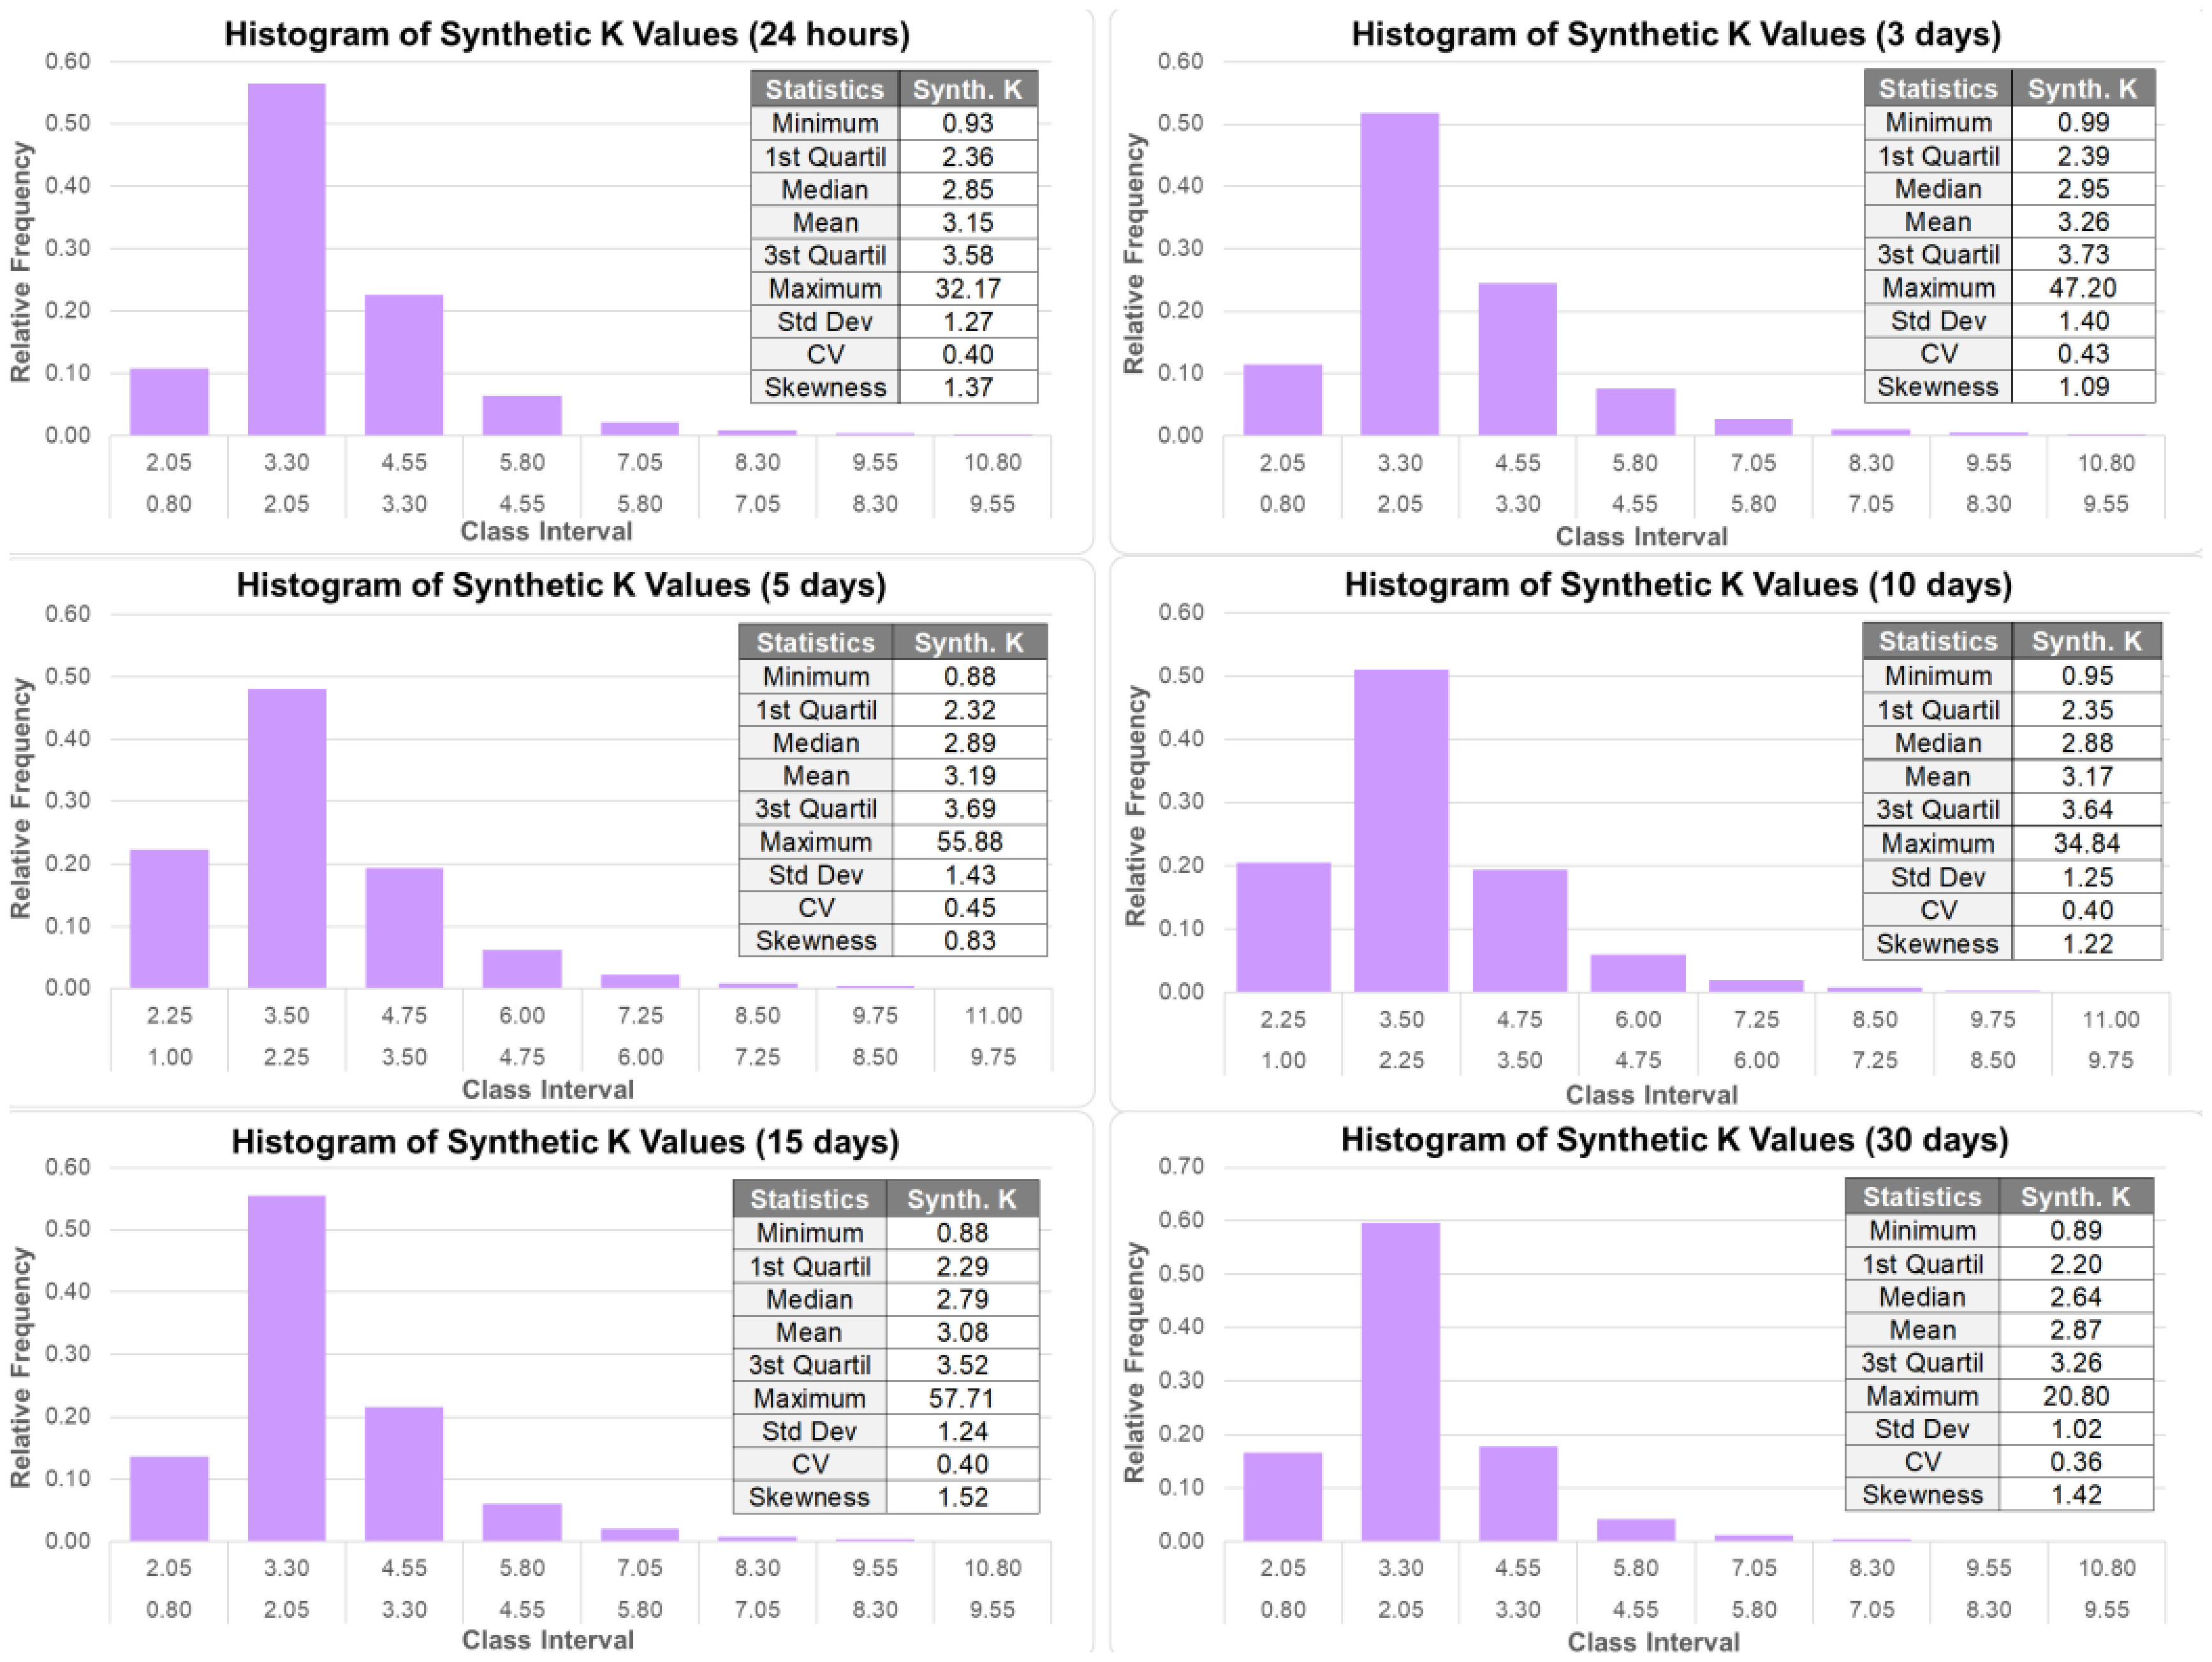
Similarly, Figure 3 provides histograms of the entire set of synthetic values for the 42 rainfall stations. Across all durations, the frequency distributions show a unimodal shape with positive skewness, reinforcing the trend observed in the empirical CDFs. However, the skewness values did not follow a monotonic trend, instead showing a non-linear variation across durations.
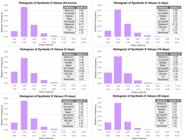
For the shortest duration (24-h), the skewness was 1.37, decreasing to 0.83 for the 5-day duration, and subsequently increasing again to 1.42 for the 30-day duration. This behavior suggests the presence of distinct precipitation regimes. For shorter durations, the dominance of isolated convective events tends to generate heavier tails. As the accumulation period increases to around 5 days, the aggregation of rainfall smooths these extremes, leading to lower skewness. However, for durations exceeding 10 days, the reemergence of long-lasting rainfall episodes, such as those associated with persistent synoptic systems or the ITCZ, appears to increase the skewness again.
The coefficient of variation (CV) also exhibited non-uniform behavior. It was 0.40 for 24 hours, peaked at 0.45 for the 5-day duration, and gradually declined to 0.36 in 30 days. These results indicate that, while the variability relative to the mean remains consistently high, it is influenced by the interaction between isolated extremes and prolonged rainfall events, depending on the aggregation window.
Such detail, which may be obscured in deterministic methods, supports the adequacy of the probabilistic approach in representing the complexity of rainfall in tropical regions.
The empirical distributions validate the probabilistic approach, as they demonstrate that the simulated values reproduce key features expected from extreme value theory, including asymmetry and randomness (Naghettini & Pinto, 2007). Moreover, the diversity among curves across stations underscores the importance of adopting a stochastic framework rather than fixed deterministic upper envelopes, allowing the model to capture both the average behavior and the tail risk associated with low-probability, high-impact events.
These results also support the contributions of Martins & Pinto (2026), which highlighted the influence of spatial heterogeneity and local climatological dynamics in shaping the magnitude of frequency factors. The synthetic simulations thus build upon that prior work by incorporating uncertainty explicitly and offering a robust statistical representation of extreme rainfall patterns in the studied equatorial region.
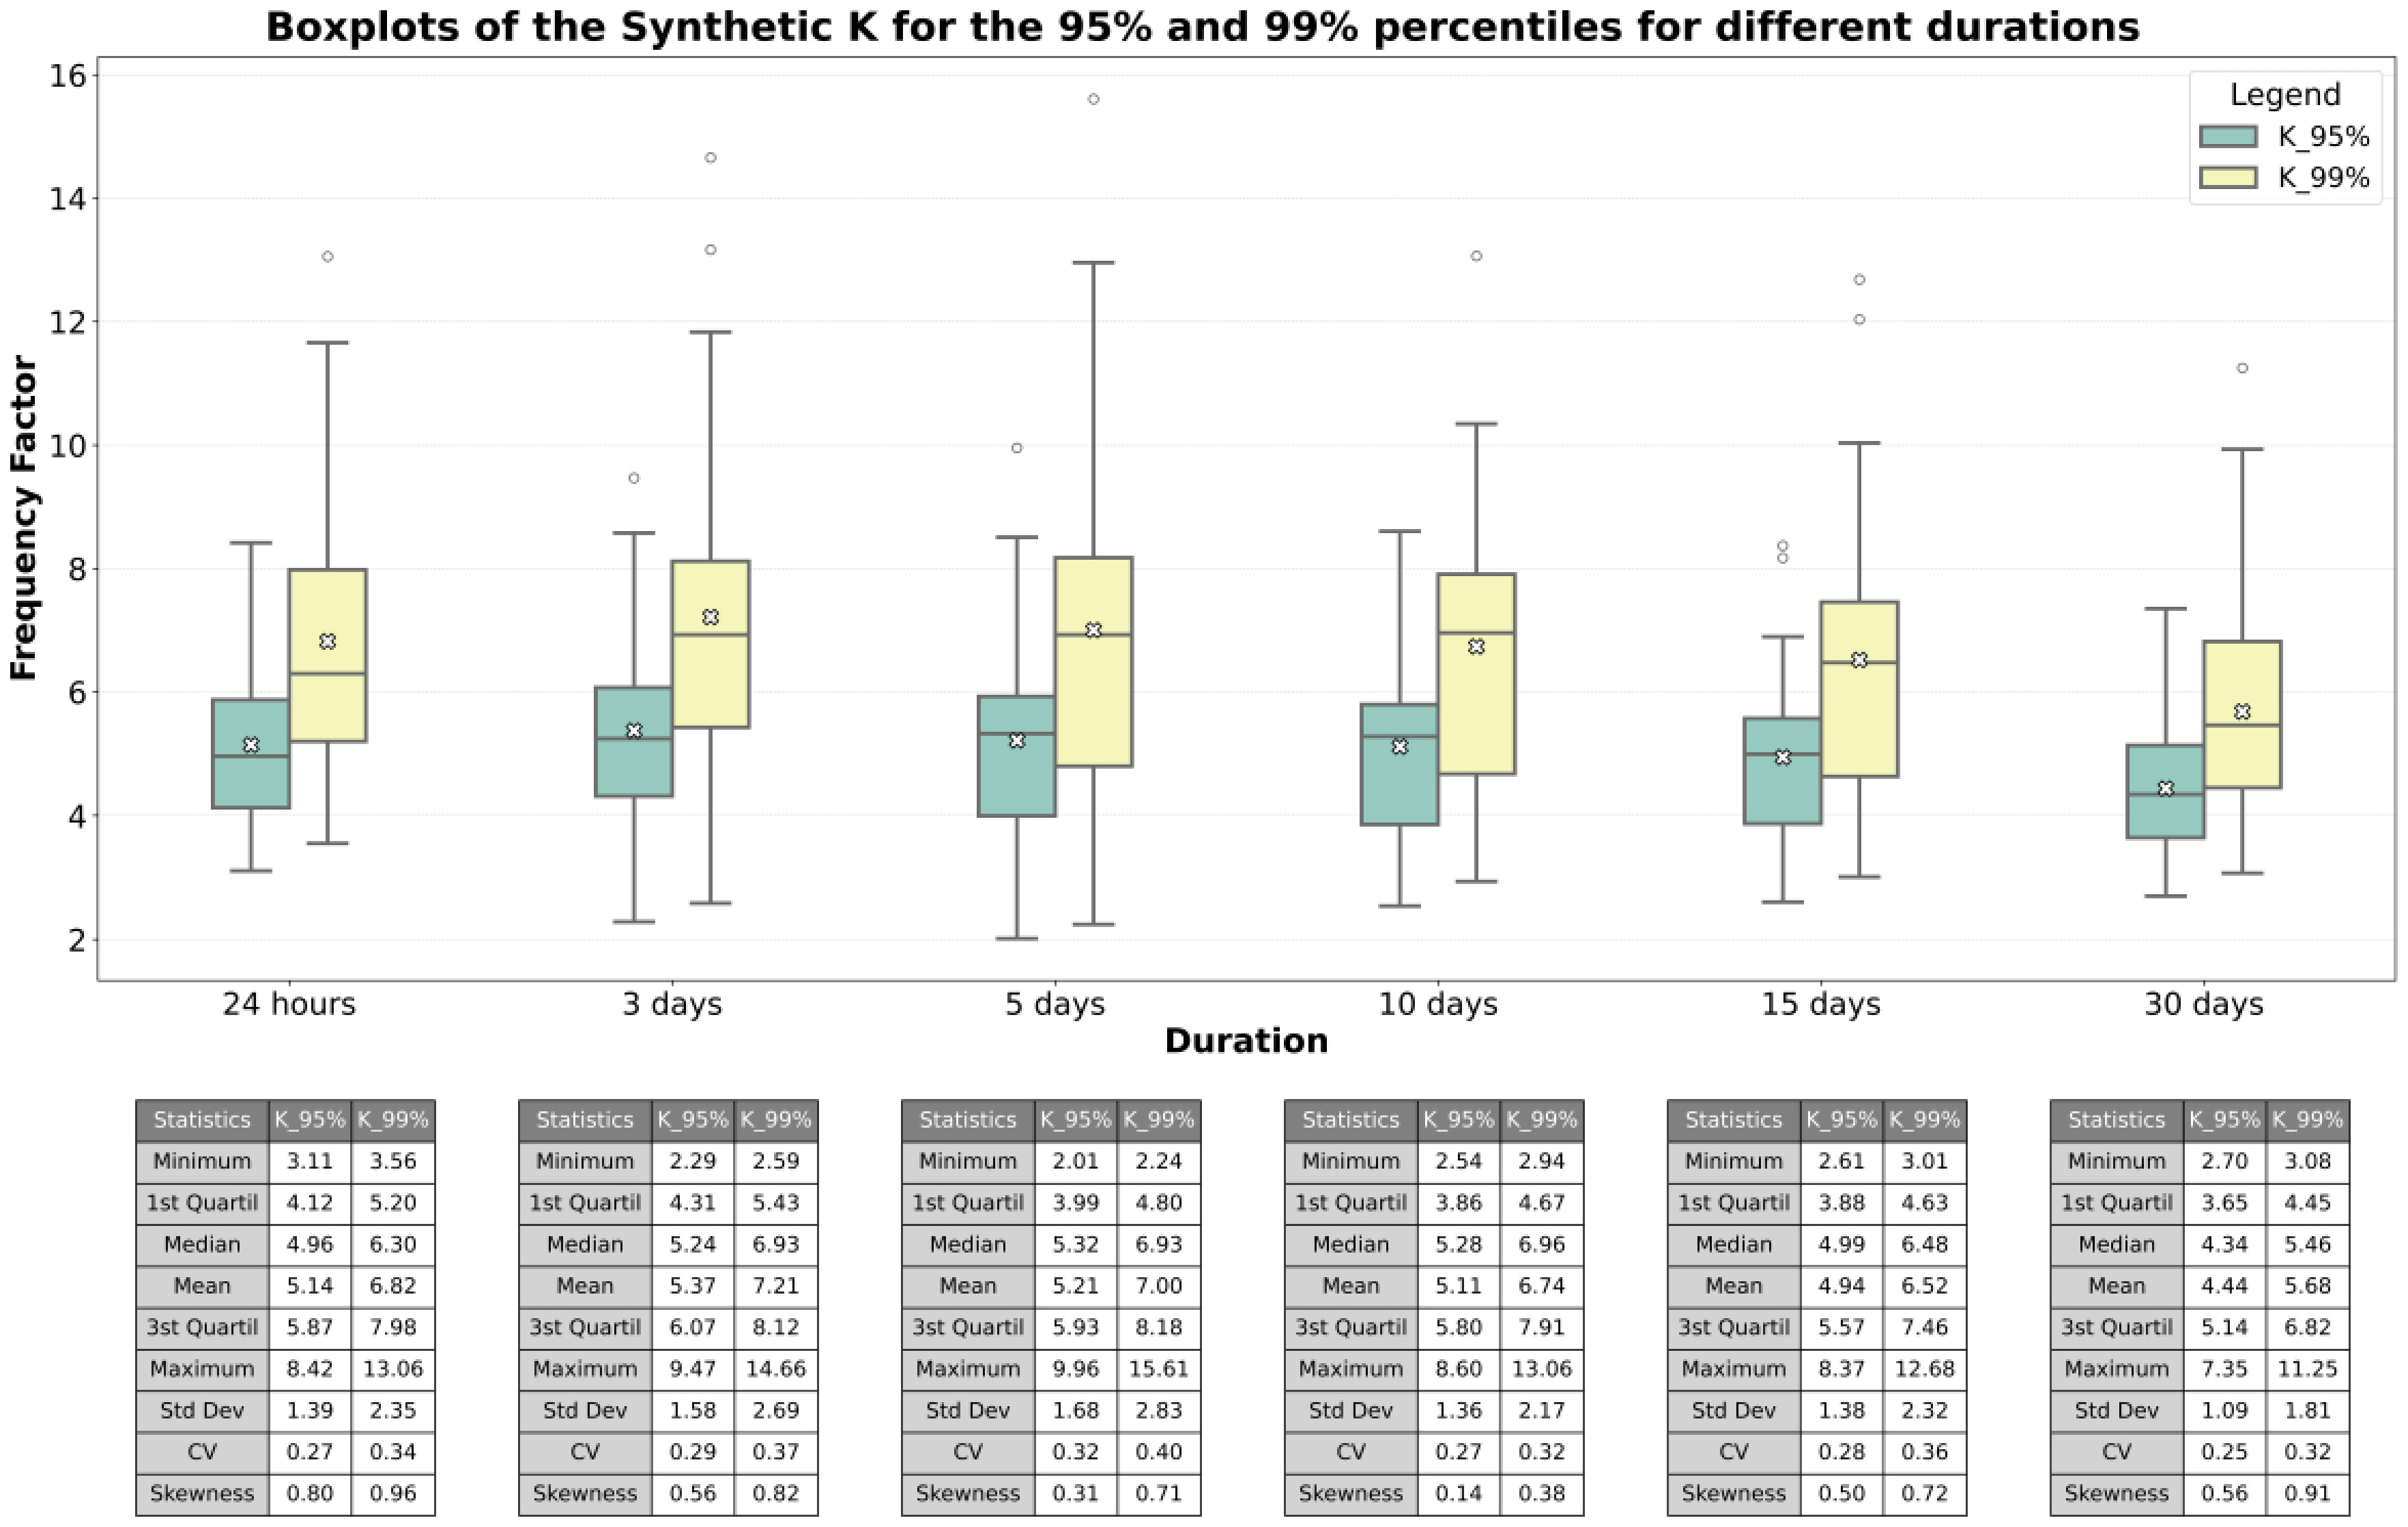
Figure 4 presents boxplots of the synthetic frequency factors corresponding to the 95th and 99th percentiles across the 42 rainfall stations and for each of the six durations analyzed. These values were extracted from the cumulative distribution of synthetic , representing conservative thresholds for use in Probable Maximum Precipitation (PMP) estimation under uncertainty.
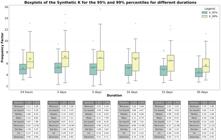
As expected, the median values of are systematically higher than those of for all durations. For the 24-hour duration, the median reaches 6.30, while for the 30-day duration, it decreases to 5.46. This decreasing trend of both percentiles with increasing duration is coherent with physical rainfall behavior in tropical regions, which reflects the dominance of fast, localized convective mechanisms in shorter durations, whereas longer accumulations tend to moderate peak intensities due to temporal averaging effects. The maximum for 24 hours do not exceed the maximum theorized by Hershfield for 24 hours (. In this study, would be associated with 99,99% percentile.
Despite the decline in central tendency, the interquartile ranges and whiskers remain relatively broad, particularly for shorter durations. This reflects the inherent variability of local precipitation regimes and the sensitivity of upper-tail behavior in extreme value distributions. The presence of outliers in both and , especially for durations of 3 and 5 days, indicates that even among stations with similar climatic settings, stochastic simulations can produce wide-ranging outcomes depending on the statistical distribution fitted to each dataset.
In this study, for the 24-hour duration, maximum synthetic frequency factors of 8.42 for and 13.96 for were obtained. These values are substantially lower than those reported by Burger (2014), who adopted a more restrictive 99.9th percentile threshold in Monte Carlo simulations coupled with an autoregressive structure. In that study, simulations based on automatic rainfall stations in the state of Paraná yielded a maximum daily synthetic value as high as 89.14. When conventional rainfall stations with record lengths of approximately 30 and 40 years were considered, the maximum synthetic values decreased to 21.64 and 15.46, respectively.
The results obtained in the present study indicate that the adoption of the 99th percentile, combined with extreme value distributions and without the use of autoregressive models, leads to maximum frequency factors that are considerably less extreme and more consistent with values commonly reported in the literature. In particular, the maximum value of approximately 14 is of the same order of magnitude as the classical upper limit proposed by Hershfield (K = 20) for 24-hour precipitation, as well as values reported in other regional and international studies.
This comparison highlights the strong sensitivity of synthetic frequency factors to the selected percentile threshold and reinforces that the use of very high percentiles, such as the 99.9th percentile, may produce frequency factors that are difficult to reconcile with physically plausible precipitation mechanisms. By contrast, the percentile levels adopted in this study provide a balance between statistical conservatism and physical realism, yielding frequency factors that remain extreme yet comparable to those historically used in PMP estimation.
Compared to the deterministic regional upper envelope developed in Martins & Pinto (2026), which employed a fixed value of for each duration, the percentile-based values derived from the Monte Carlo simulations offer greater flexibility. They allow each station to retain its individual statistical characteristics, while enabling the risk level to be explicitly assumed. This allows professionals to select the appropriate risk threshold according to project demands, reinforcing the flexibility of the probabilistic framework.
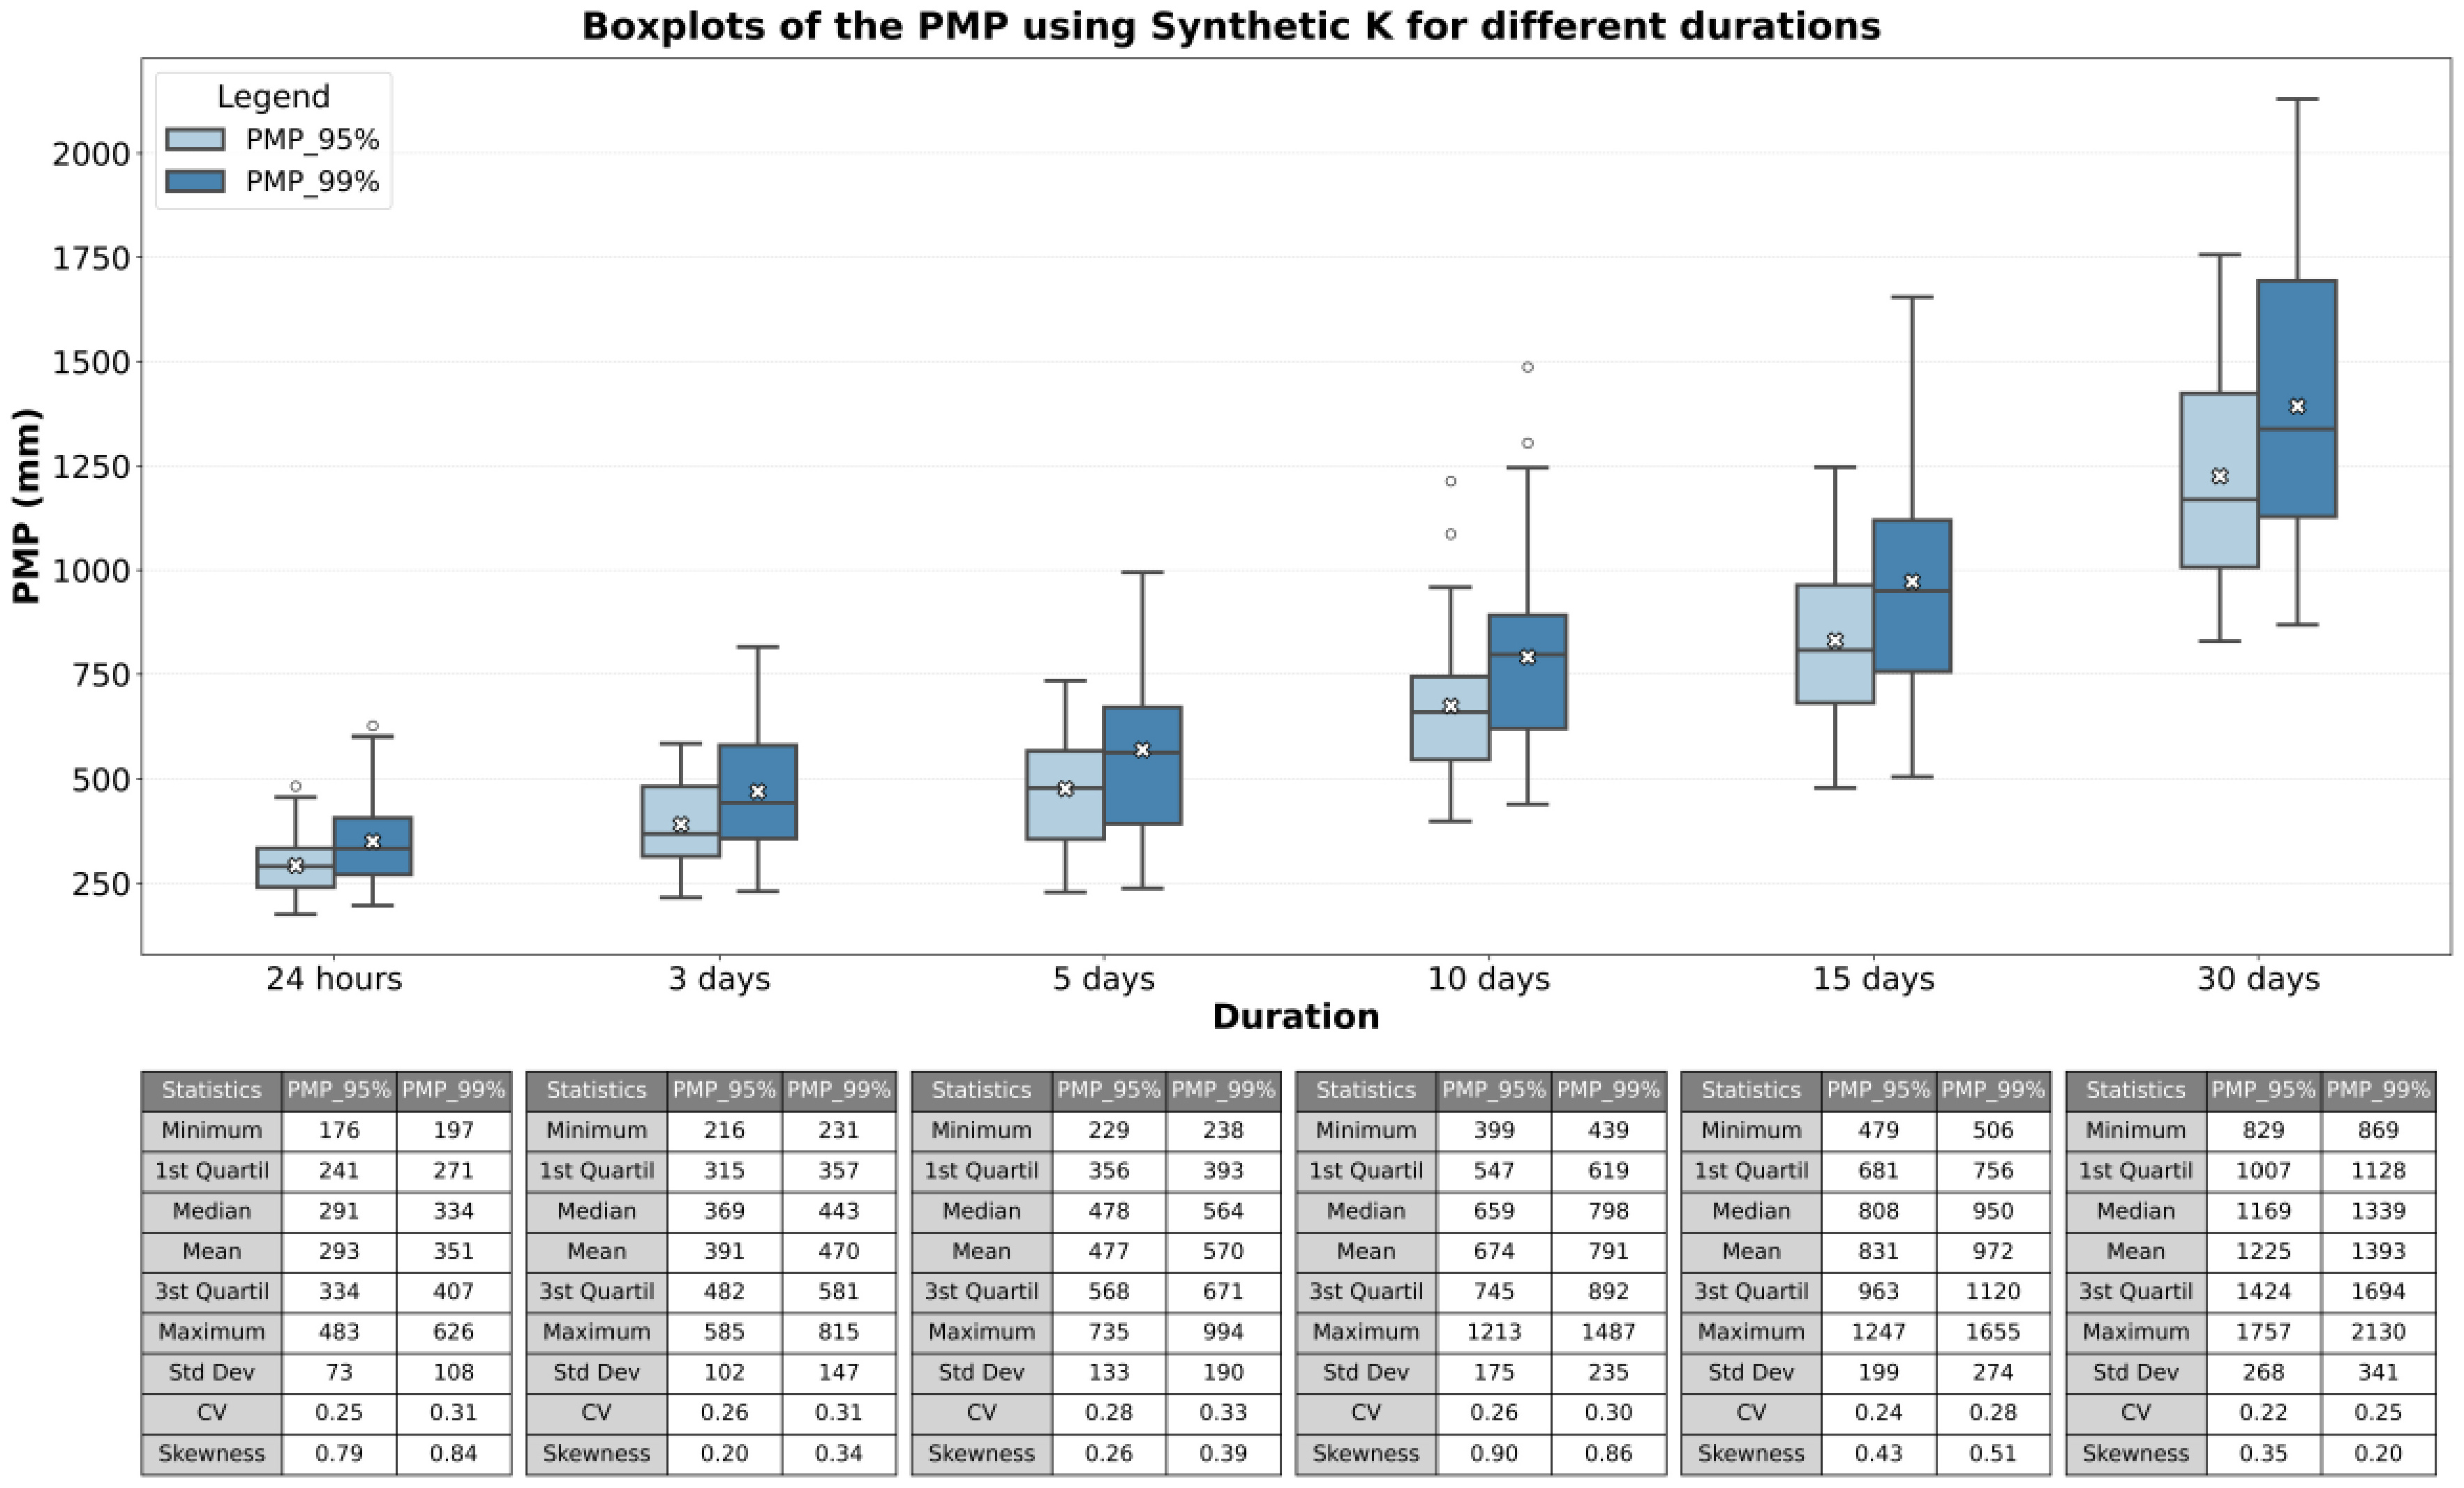
Figure 5 presents the PMP estimates for the six durations, calculated using and for the six durations across the 42 rainfall stations.
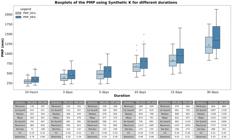
The boxplots demonstrate an expected and coherent pattern: PMP estimates increase with duration, as cumulative rainfall naturally rises over longer time windows. Median PMP values range from approximately 334 mm (24-h, ) to over 1,339 mm (30 days, ). This progression is consistent with the statistical properties of the underlying precipitation data and corroborates findings reported in Martins & Pinto (2026), although now incorporating explicit probabilistic thresholds.
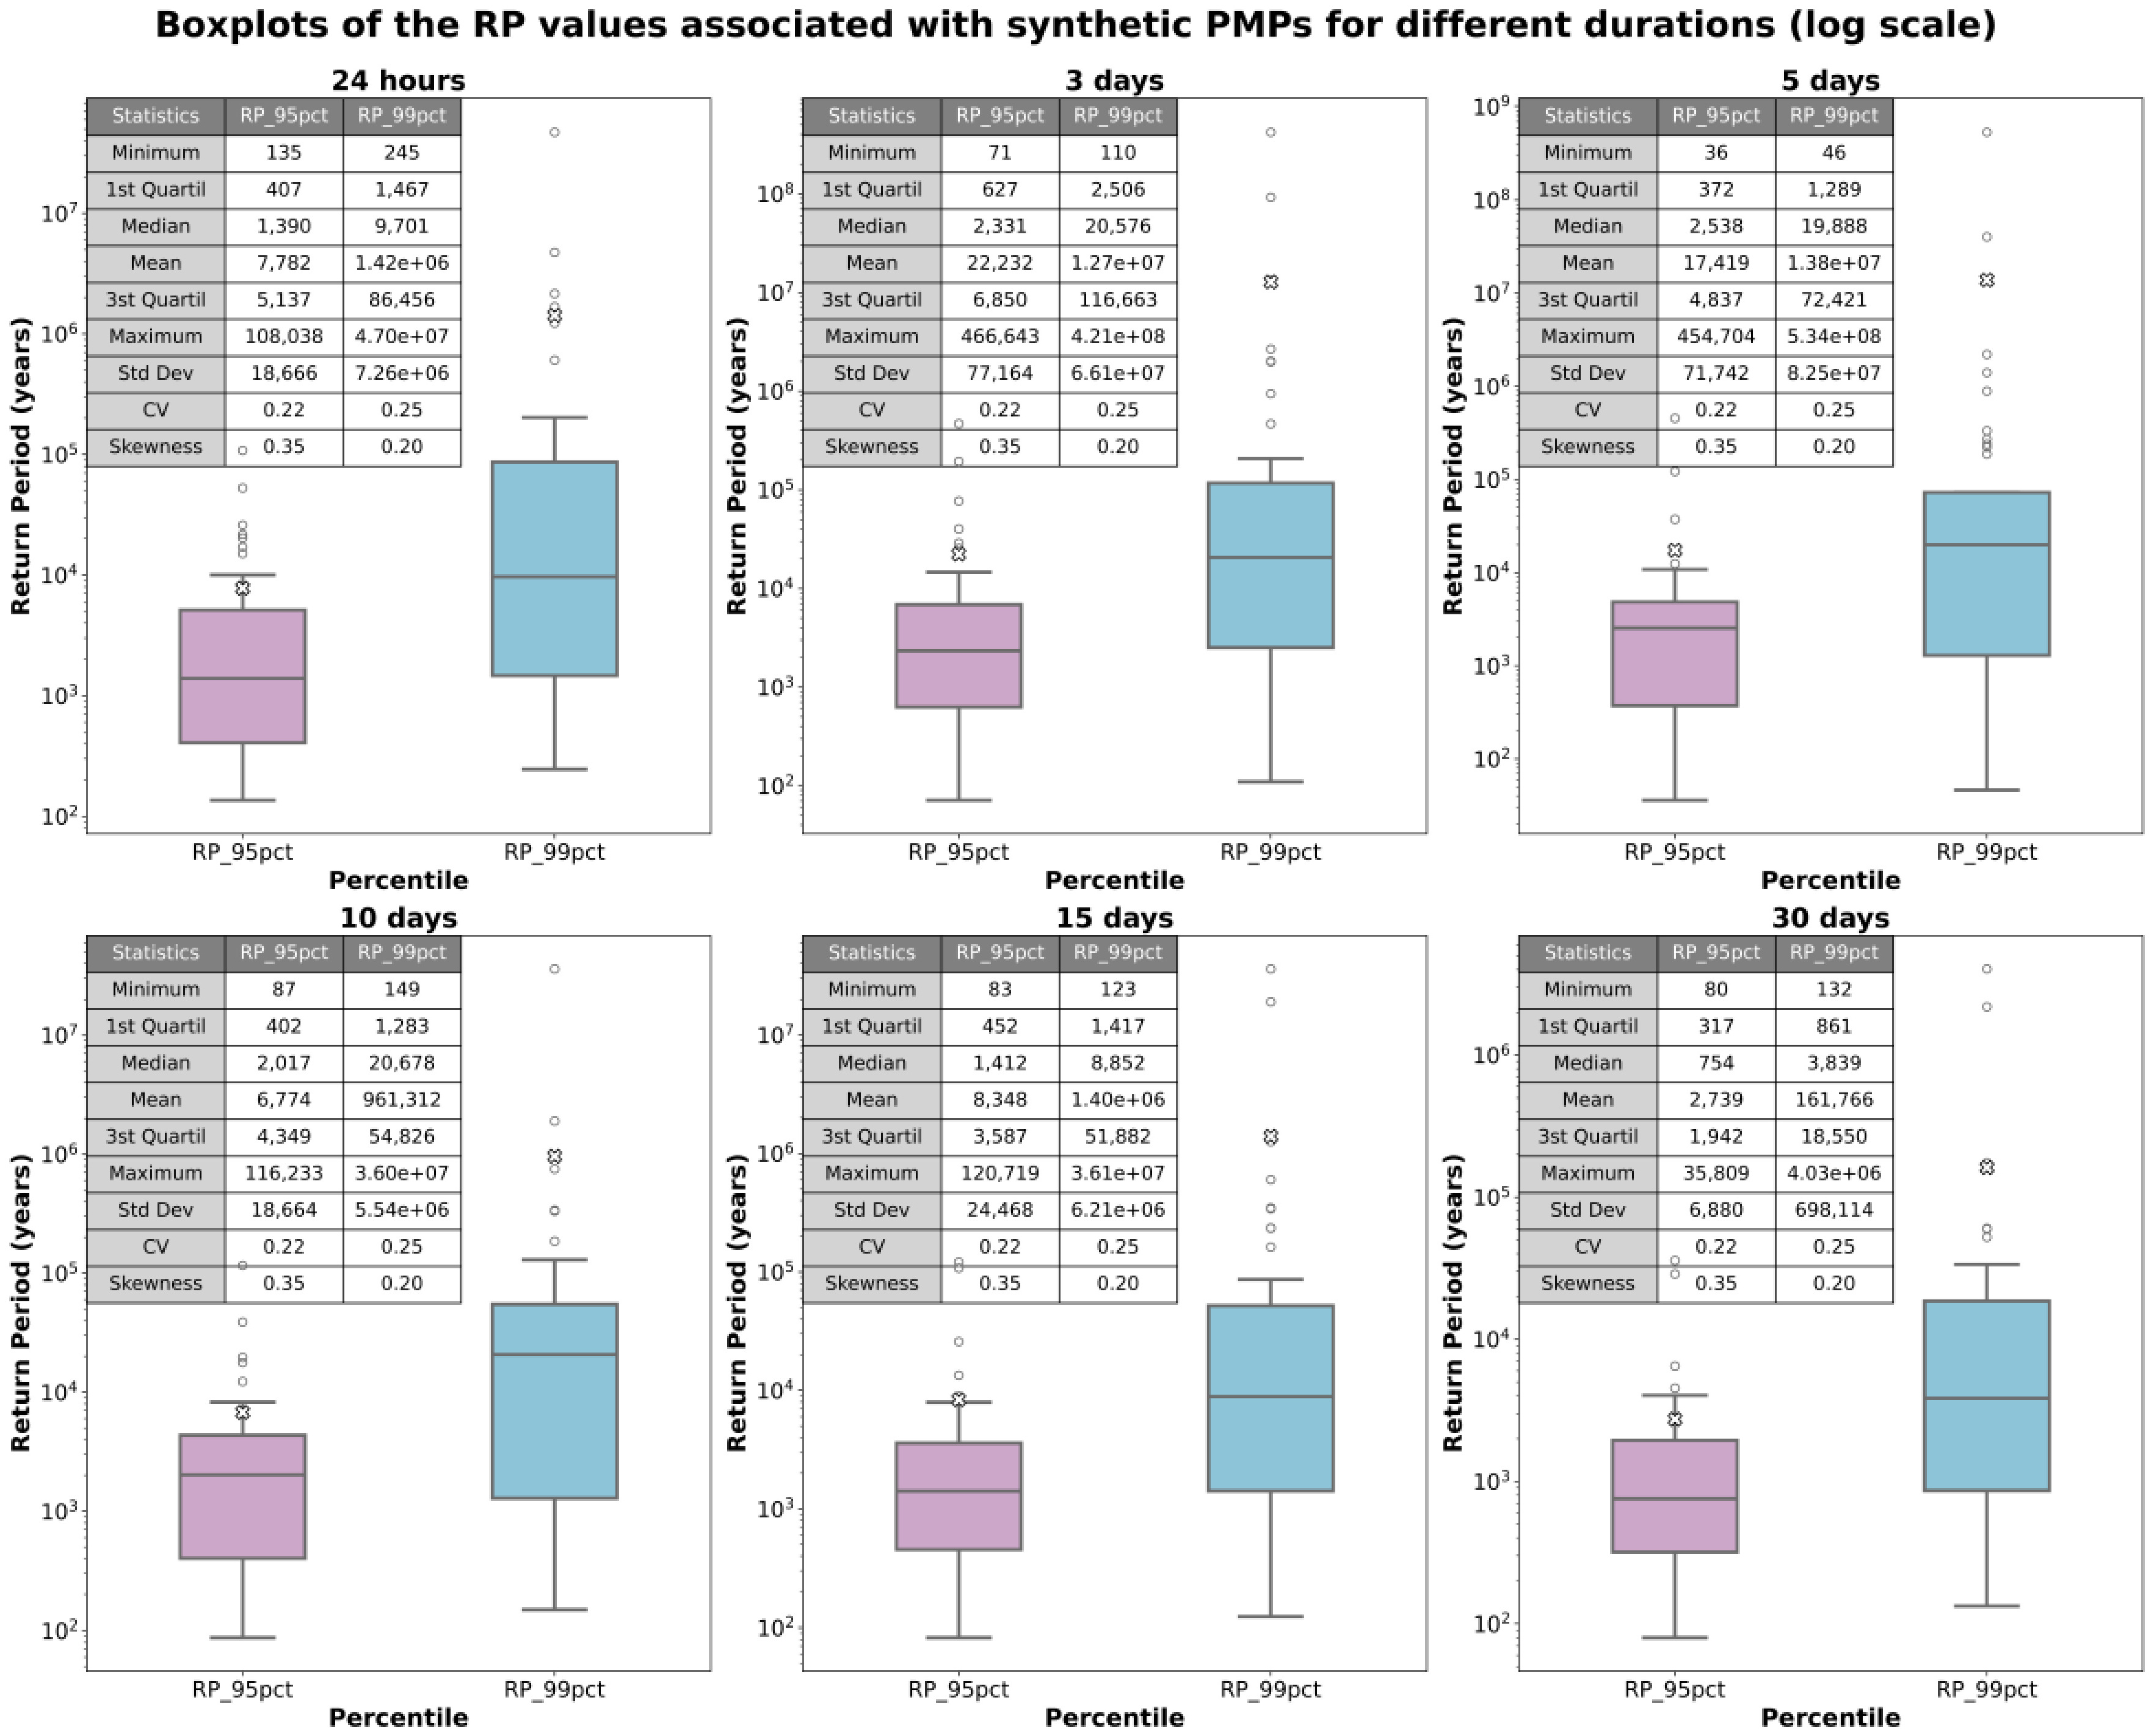
Figure 6 presents the estimated return periods (RP) associated with the Probable Maximum Precipitation (PMP) values obtained from the synthetic frequency factors and , using the Gumbel distribution fitted to each rainfall station and duration, following the same methodological framework discussed in Martins & Pinto (2026). The return periods were computed by associating the synthetic PMP to its cumulative non-exceedance probability in the fitted distribution.
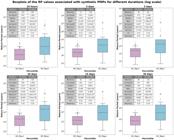
Boxplots of the RP values associated with synthetic PMPs for different durations (log scale).
From a methodological standpoint, the adoption of the Gumbel distribution for RP estimation is justified by its analytical simplicity, unbounded upper tail, and consistent empirical performance across all evaluated stations and durations, reinforcing its suitability for extrapolating extreme precipitation values within the proposed synthetic framework.
As expected, PMP values associated with correspond to substantially longer return periods when compared to those associated with . For the 24-hour duration, median RP values are approximately 10,000 years for and 2,000 years for . For the 30-day duration, these values are approximately 4,000 and 800 years, respectively. The mean varied between and years for and between and for .
These results indicate that PMPs estimated using the 95% percentile are associated with relatively short return periods, particularly for shorter durations, which may be inconsistent with the conceptual definition of PMP as an event of extremely low exceedance probability. In contrast, PMPs derived from the 99% quartile yield return periods that fall within ranges widely reported and accepted in the literature for PMP estimation.
In this regard, there is strong agreement between the values obtained in this study and those reported by previous investigations. The National Research Council (1994) suggests PMP return periods on the order of to years in the United States, while Nathan and Weinmann (2001, apud Fernandes, 2009) indicate ranges between and years. Ball et al. (2019) reported recurrence intervals of approximately 2,000 years, and Kappel et al. (2024), in hydrometeorological PMP estimates for the Wasatch–Uinta Mountains region, obtained median return periods of about years for 24-hour PMP and years for 72-hour PMP, with variations spanning from to years. In southern Brazil, Sugai (1989) found average and median return periods of approximately 140,000 and 270,000 years, respectively, for 24-hour PMP estimates.
Therefore, the 99th percentile emerges as the most appropriate level of restriction among those tested, as it produces PMP estimates associated with return periods that are consistent with the ranges mentioned in the references of the previous paragraph, while avoiding excessively conservative values that could lead to disproportionate hydraulic design costs. From a practical perspective, this level provides a more balanced compromise between minimizing the probability of exceedance and ensuring feasible and economically justified design, thereby offering more useful guidance for hydrologic risk prevention and infrastructure planning.
The general trend indicates a decrease in RP magnitude as the rainfall duration increases, reflecting the climatological behavior of the region, where short-duration, high-intensity events are more prone to producing extreme values than prolonged rainfall accumulations.
This inverse relationship between duration and return period, as previously discussed, reflects the dominance of convective processes in shorter durations. It also reinforces the interpretation that return periods derived from PMP estimates are not fixed constants, but statistical constructs sensitive to both the chosen frequency factor and the distribution fitted to the data.
It is worth noting that the spread of return periods across stations is substantial, particularly at the 99th percentile. For example, for the 3-day duration, values span from less than years to over years.
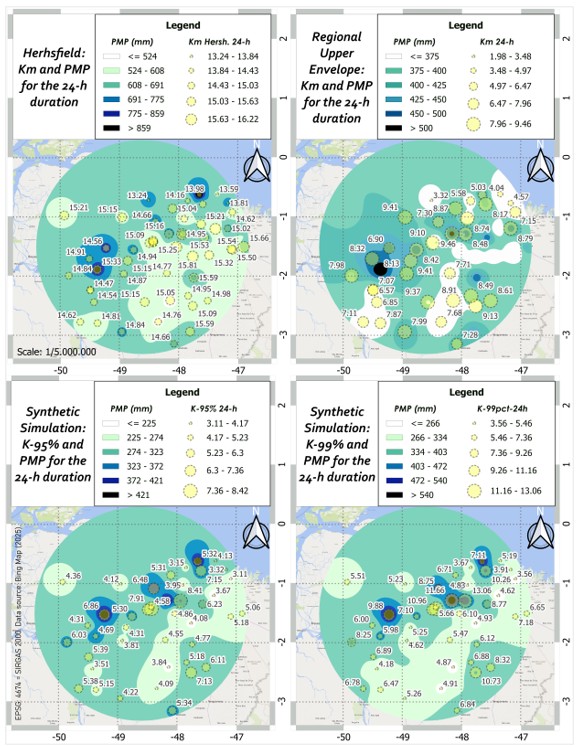
Figure 7 illustrates the spatial distribution of 24-hour PMP estimates across the study area under four different approaches: (1) Hershfield’s classical Upper Envelope; (2) the deterministic Regional Upper Envelope from Martins & Pinto (2026); (3) the synthetic PMP associated with ; and (4) . The comparison provides a visual assessment of how deterministic and probabilistic methodologies affect spatial variability and magnitude of PMP values in a tropical rainfall context.
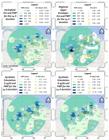
Spatial distribution of the 24-hour point PMP using Hershfield's method, Regional Upper Envelope method and synthetic PMP associated with and .
To derive the spatial distribution of the PMP estimates, we employed the Inverse Distance Weighting (IDW) interpolation method with a power parameter of 2. This decision follows the findings of Ly et al. (2013), whose comparative analysis of various interpolation approaches for hydrological applications concluded that IDW is well-suited for daily precipitation fields.
As expected, the PMP map based on Hershfield’s upper envelope presents the highest values across the region, with several locations exceeding 500 mm and overall values ranging from 440.0 to 959.1 mm. This reflects the conservative nature of Hershfield’s original formulation, which was developed from datasets in temperate and cold climates and tends to overestimate PMP in tropical environments due to its generalized upper-bound assumptions.
In contrast, the Deterministic Regional Upper Envelope developed in Martins & Pinto (2026) results in more moderate PMP estimates, with spatial variability more attuned to the climatological features of northern Brazil. The spatial transition from high to low values is more gradual and better aligned with local rainfall dynamics, particularly the influence of mesoscale convective systems and the Intertropical Convergence Zone (ITCZ) (Salio et al., 2007; Reboita et al., 2010; Lyra et al., 2020; Martins, 2024).
As expected, the map based on is consistently higher than that based on , with both surfaces showing smoother gradients compared to the classical method. This spatial smoothness reflects the capacity of the probabilistic simulation to account for site-specific variability without abrupt transitions, resulting in more realistic rainfall patterns.
Figure 7 also reveals consistent spatial patterns across the four panels, highlighting both methodological differences and physically meaningful regional contrasts. Stations exhibiting higher PMP values are predominantly located in areas historically associated with intense convective activity, such as the coastal zone of Salgado (northeastern coast of Pará, which includes Marapanim, Magalhães Barata, Maracanã, among others), the Pará River estuary (Belém Metropolitan Area, Barcarena, Santo Antônio do Tauá, among others), as well as regions near the confluence of the Pará and Tocantins rivers (Muaná, Limoeiro do Ajuru, Ponta de Pedras, among others), collectively outlining a northeast–southwest-oriented corridor.
This spatial configuration is consistent with the prevailing atmospheric circulation over northern Brazil. The trade winds, acting at an average inclination of approximately 30° relative to the equatorial line, favor the advection of moisture from the Atlantic Ocean toward these regions. This process is further enhanced by Amazonian evapotranspiration, the combined influence of the Hadley–Walker circulation cells, and the seasonal positioning of the Intertropical Convergence Zone (ITCZ), with the occasional occurrence of Mesoscale Convective Complexes (MCCs) acting as triggering mechanisms for extreme rainfall events. Additionally, the natural thalweg of the Pará River — and Marajó Bay —, whose NE–SW orientation is consistent with the prevailing trade-wind direction, may contribute to the persistence of inland moisture transport by acting as a low-roughness surface and a continuous source of atmospheric humidity, thereby favoring convective development in adjacent areas.
As a result, these spatial concentrations reflect the statistical behavior of the underlying annual maximum precipitation series, which exhibit both a higher frequency and greater magnitudes of extreme rainfall events in these locations. These regions typically record average annual rainfall totals ranging from approximately 2,500 to 3,100 mm, with particularly high values observed in the Belém Metropolitan Area (Companhia de Pesquisas de Recursos Minerais, 2011). According to Instituto Brasileiro de Geografia e Estatística (2002), the Belém Metropolitan Area, Barcarena, and surrounding municipalities are embedded within a quasi-circular climatic core, with a radius of about 25 km, classified as Hot/Super-humid Equatorial, characterized by the absence of a dry season. Surrounding this core, a climatic belt with an approximate radius of 50 km is classified as Hot/Super-humid Equatorial sub-dry. This hierarchical climatic configuration helps explain the inherent susceptibility of the region to extreme precipitation events.
A comparison between the Hershfield envelope and the Regional Upper Envelope proposed by Martins & Pinto (2026) shows that, while both approaches preserve similar large-scale spatial gradients, the classical Hershfield method amplifies local extremes more uniformly across the region. In contrast, the regional upper envelope produces a more heterogeneous and climatically coherent spatial pattern, with localized maxima better aligned with known rainfall regimes in northern Brazil.
All PMP estimation results, as well as the corresponding frequency factor values for all rainfall stations and durations, are available in the following public repository: https://doi.org/10.5281/zenodo.15103909.
These results reinforce that the fitting of statistical distributions, particularly their upper-tail behavior, plays a critical role in determining both the percentile-based values and the associated PMP estimates. As such, careful evaluation of distributional adequacy is essential to ensure consistency and physical plausibility across stations and durations.
It is important to note that the Monte Carlo simulations were conducted independently for each rainfall station, without explicitly modeling spatial dependence or cross-correlation among stations. This assumption is consistent with the primary objective of the present study, which focuses on the probabilistic estimation of point PMP values derived from the statistical behavior of frequency factors at individual stations.
It is recognized that spatial rainfall structure and inter-station dependence can influence areal PMP estimates, particularly at the basin scale, and that neglecting spatial correlation may lead to under or overestimation of spatially aggregated extremes. Addressing this issue would require the adoption of multivariate or geostatistical simulation frameworks capable of explicitly representing spatial dependence, which is beyond the scope of the present study. Nevertheless, the incorporation of spatial correlation in PMP estimation is recognized as an important topic for future research.
Finally, it is important to note that, in the context of PMP estimation, the term “error” does not refer to a measurable deviation from a known true value, since PMP represents a theoretical upper bound and cannot be directly observed. Instead, uncertainty in PMP estimation is inferred indirectly from the probabilistic dispersion of the synthetic frequency factors derived by the Monte Carlo simulation and, consequently, from the resulting PMP estimates.
The use of different percentiles (For example, and as presented in this paper) provides a practical measure of uncertainty, reflecting sampling limitations, distributional assumptions, and variability in extreme rainfall behavior. The difference between these percentiles is therefore interpreted as an uncertainty range rather than as a formal statistical error. Within this framework, the use of higher percentiles represents a more restrictive and risk-averse estimate. Thus, the method presented in this paper will allow designers to assume higher percentiles/quantiles (>=99th) in PMP applications associated with critical hydraulic infrastructures.
CONCLUSIONS
The present study proposed and implemented a stochastic framework for the simulation of synthetic series and derivation of frequency factors associated with Probable Maximum Precipitation (PMP) estimation in a tropical, equatorial region of northern Brazil. By employing the Monte Carlo Method (MCM) combined with extreme value distributions, it was possible to incorporate uncertainty explicitly into the estimation of PMP across multiple durations and stations, offering a probabilistic alternative to deterministic methods traditionally used in hydrological design.
The results demonstrated that the synthetic values, derived from percentiles (For example, and as presented in this paper), provide a flexible approach to account for the inherent variability of extreme precipitation in tropical climates. The probabilistic PMP estimates revealed consistent spatial and temporal patterns with those observed in deterministic analyses, while introducing a more nuanced characterization of risk levels associated with extreme rainfall events. Moreover, the integration of the simulation process preserved key statistical attributes of the historical series, including asymmetry and variability, enhancing the robustness of PMP estimates.
The methodology adopted achieved the initial objective of expanding the deterministic regional approach previously developed for the study area into a probabilistic context, providing more comprehensive tools for hydrological risk assessment and infrastructure safety planning. While the provides a moderately conservative estimate that may be suitable for preliminary assessments, the emerges as the most appropriate percentile for PMP estimation associated with critical infrastructure, as it yields return periods consistent with values commonly reported in literature. Hence, in this study, when comparing the two percentiles, the K99% percentile is considered more appropriate when the objective is to minimize hydrological risk.
However, it is recognized that, despite the methodological robustness, further refinements could enhance the estimation of frequency factors and associated quantiles. Specifically, the application of Regional Frequency Analysis (RFA), particularly the Index-Flood method using L-moments as proposed by Hosking & Wallis (1997), emerges as promising avenue. Grouping the rainfall stations into homogeneous clusters and adjusting probability distributions regionally could optimize the statistical fitting process, reduce parameter estimation uncertainty, and improve the consistency of quantile estimates across the region.
Thus, future research could consider incorporating regionalization techniques to further enhance the reliability and efficiency of PMP estimation in tropical regions, supporting more effective water resources management and climate resilience strategies.
Variations of the synthetic methodology that incorporate upper envelopes of synthetic frequency factors could provide more conservative estimates, thereby reducing design risk.
DATA AVAILABILITY STATEMENT
Research data is available in a repository: https://doi.org/10.5281/zenodo.15103909
ACKNOWLEDGEMENTS
The authors are grateful to the Postgraduate Program in Sanitation, Environment and Water Resources of the Universidade Federal de Minas Gerais (UFMG), where this research was developed. The authors also thank the reviewers and the editorial board for their constructive comments, which contributed to improving the quality of the manuscript.
REFERENCES
- Agência Nacional de Águas e Saneamento Básico – ANA. (2016). Manual do empreendedor sobre segurança de barragens – volume V: diretrizes para a elaboração de projeto de barragens Brasília, DF: Ministério do Meio Ambiente e Mudança do Clima.
- Agência Nacional de Mineração – ANM. (2022). Resolução ANM nº 95, de 07 de fevereiro de 2022. Consolida os atos normativos que dispõem sobre segurança de barragens de mineração. Brasília, DF, Ministério de Minas e Energia.
-
Andrade, C. (2019). Multiple testing and protection against a type 1 (false positive) error using the Bonferroni and Hochberg corrections. Indian Journal of Psychological Medicine, 41(1), 99-100. http://dx.doi.org/10.4103/IJPSYM.IJPSYM_499_18.
» https://doi.org/10.4103/IJPSYM.IJPSYM_499_18 - Associação Brasileira de Normas Técnicas – ABNT. (2017). NBR 13028: Mineração — Elaboração e apresentação de projeto de barragens para disposição de rejeitos, contenção de sedimentos e reservação de água — Requisitos Rio de Janeiro: ABNT. 16 p.
- Ball, J., Babister, M., Nathan, R., Weeks, W., Weinmann, E., Retallick, M., & Testoni, I. (2019). Australian rainfall and runoff: a guide to flood estimation Canberra: Geoscience Australia.
- Box, G. E. P., & Jenkins, G. M. (1970). Time-series analysis, forecasting and control (1st ed.). San Francisco: Holden-Day.
- Box, G. E. P., Jenkins, G. M., & Reinsel, G. C. (1994). Time series analysis, forecasting and control (3rd ed.). Englew Wood Cliffs, NJ: Prentice-Hall.
-
Burger, L. C. (2014). Adaptação e análise do método de Hershfield para estimativa da precipitação máxima provável (PMP) (Dissertação de Mestrado). Pós-graduação em Engenharia Hidráulica, Universidade Federal do Paraná, Curitiba. Disponível em https://acervodigital.ufpr.br/handle/1884/37050
» https://acervodigital.ufpr.br/handle/1884/37050 - ELETROBRAS. (2003). Critérios de projeto civil de usinas hidrelétricas. Rio de Janeiro: ELETROBRAS.
- Chatfield, C. (2001). Time-series forecasting Boca Raton: Chapman & Hall/CRC.
-
Chow, V. T. (1951). A general formula for hydrologic frequency analysis. Transactions - American Geophysical Union, 32, 231-237. http://dx.doi.org/10.1029/TR032i002p00231.
» https://doi.org/10.1029/TR032i002p00231 - Companhia de Pesquisas de Recursos Minerais – CPRM. (2011). Levantamento da geodiversidade: projeto atlas pluviométrico do Brasil: isoietas anuais médias: período 1977 a 2006 Brasília: CPRM.
-
Cortés, J., Mahecha, M., Reichstein, M., & Brenning, A. (2020). Accounting for multiple testing in the analysis of spatio-temporal environmental data. Environmental and Ecological Statistics, 27, 293-318. http://dx.doi.org/10.1007/s10651-020-00446-4.
» https://doi.org/10.1007/s10651-020-00446-4 - Feliciano, F. C. S. (2025). Estimativa de curvas envoltórias para os fatores de frequência da PMP estatística em diferentes climas de Minas Gerais a partir de séries históricas e sintéticas de precipitações diárias (Dissertação de Mestrado). Pós-graduação em Saneamento, Meio Ambiente e Recursos Hídricos, Universidade Federal de Minas Gerais, Belo Horizonte.
-
Fernandes, W. S. (2009). Método para a estimação de quantis de enchentes extremas como o emprego conjunto de análise bayesiana, de informações não sistemáticas e de distribuições limitadas superiormente (Tese de Doutorado). Pós-graduação em Saneamento, Meio Ambiente e Recursos Hídricos, Universidade Federal de Minas Gerais, Belo Horizonte. Disponível em https://www.smarh.eng.ufmg.br/tese_defesas_detalhes.php?aluno=109
» https://www.smarh.eng.ufmg.br/tese_defesas_detalhes.php?aluno=109 - Hershfield, D. M. (1961a). Rainfall frequency atlas of the united states (Technical Paper, No. 40). Washington, DC: Department of Commerce; Weather Bureau.
-
Hershfield, D. M. (1961b). Estimating the probable maximum precipitation. Journal of Hydraulics Division: Proceedings of the American Society of Civil Engineers, 87, 99-106. http://dx.doi.org/10.1061/JYCEAJ.0000651.
» https://doi.org/10.1061/JYCEAJ.0000651 -
Hershfield, D. M. (1965). Method for estimating probable maximum rainfall. American Water Works Association, 57(8), 965-972. https://doi.org/10.1002/j.1551-8833.1965.tb01486.x.
» https://doi.org/10.1002/j.1551-8833.1965.tb01486.x -
Herzog, M. H., Francis, G., & Clarke, A. (2019). The multiple testing problem. In Herzog, M. H., Francis, G., & Clarke, A., Understanding statistics and experimental design (Learning Materials in Biosciences). Springer, Cham. https://doi.org/10.1007/978-3-030-03499-3_5.
» https://doi.org/10.1007/978-3-030-03499-3_5 -
Hiraga, Y., Tahara, R., & Meza, J. (2025). A methodology to estimate probable maximum precipitation (PMP) under climate change using a numerical weather model. Journal of Hydrology (Amsterdam), 652, 132659. http://dx.doi.org/10.1016/j.jhydrol.2024.132659.
» https://doi.org/10.1016/j.jhydrol.2024.132659 -
Hosking, J. R. M., & Wallis, J. R. (1997). Regional Frequency Analysis - an approach based on L-moments. Cambridge: Cambridge University Press. 224 p. https://doi.org/10.1017/CBO9780511529443.
» https://doi.org/10.1017/CBO9780511529443 - Instituto Brasileiro de Geografia e Estatística – IBGE. (2002). Mapa de Clima do Brasil, Escala 1:5.000.000. Rio de Janeiro: IBGE.
- International Commission on Large Dams – ICOLD. (2011). Tailings Dam Safety (Bulletin, No. 194). Paris: ICOLD.
- International Commission on Large Dams – ICOLD. (2022). Improving tailings dam safety: critical aspects of management, design, operation and closure (Bulletin, No. 139). Paris: ICOLD.
- Kappel, B., Hultstrand, D., & Small, A. (2024). Meteorological Inputs to Tailings Storage Facility Assessments and Risk Assessments – Experience and Lessons Learned. In Proceedings of Tailings and Mine Waste 2024, November 10–13, 2024. Colorado.
- Kendall, M. G. (1975). Rank correlation methods (4th ed.). Glasgow: Charles Griffin.
- Kendall, M. G., & Gibbons, J. D. (1990). Rank correlation methods (5th ed.). Oxford: Oxford University Press.
-
Lima, C. E. S., Souza Filho, F. A., & Rocha, R. V. (2025). Homogeneous climate risk zones in Brazil. Revista Brasileira de Recursos Hídricos, 30, e36. https://doi.org/10.1590/2318-0331.302520240102.
» https://doi.org/10.1590/2318-0331.302520240102 - Ly, S., Charles, C., & Degre, A. (2013). Different methods for spatial interpolation of rainfall data for operational hydrology and hydrological modeling at watershed scale: a review. Biotechnologie, Agronomie, Société et Environnement, 17(2), 392-406.
-
Lyra, M. J. A., Federova, N., Levit, V., & Freitas, I. G. F. (2020). Características dos Complexos Convectivos de Mesoescala no Nordeste Brasileiro. Revista Brasileira de Meteorologia, v. 35, n. spe, p. 727–734. https://doi.org/10.1590/0102-7786355000001.
» https://doi.org/10.1590/0102-7786355000001 - Mann, H. B. (1945). Nonparametric tests against trend. Econometrica, 13(3), 245-259.
- Mann, H. B., & Whitney, D. R. (1947). On a test of whether one of two random variables is stochastically larger than the other. Annals of Mathematical Statistics, 18(1), 50-60.
- Martins, V. M. P. (2024). Emprego da simulação de Monte Carlo na estimativa do fator de frequência adotado no cálculo da Precipitação Máxima Provável (PMP) pontual em uma região de clima equatorial sujeita a atuação convectiva (Dissertação de Mestrado). Pós-graduação em Saneamento, Meio Ambiente e Recursos Hídricos, Universidade Federal de Minas Gerais, Belo Horizonte. Disponível em https://www.smarh.eng.ufmg.br/diss_defesas_detalhes.php?aluno=1575
-
Martins, V. M. P., & Pinto, E. J. A. (2026). Development of an upper envelope curve of frequency factors for Probable Maximum Precipitation (PMP) estimation in tropical regions under convective regimes: a deterministic approach. Revista Brasileira de Recursos Hídricos, 31, e23. https://doi.org/10.1590/2318-0331.312620250147.
» https://doi.org/10.1590/2318-0331.312620250147 -
Naghettini, M., & Pinto, E. J. A. (2007). Hidrologia estatística Belo Horizonte: CPRM. Disponível em https://rigeo.sgb.gov.br/handle/doc/454
» https://rigeo.sgb.gov.br/handle/doc/454 -
National Academies of Sciences Engineering and Medicine – NASEM. (2024). Modernizing probable maximum precipitation estimation Washington, DC: The National Academies Press. https://doi.org/10.17226/27460.
» https://doi.org/10.17226/27460 - National Research Council – NRC. (1994). Estimating bounds on extreme precipitation events – a brief assessment, report of the committee on meteorological analysis, prediction and research. Washington, DC: National Academy Press. 28 p.
- Natural Environment Research Council – NERC. (1975). Flood Studies Report (Vol. 1). London: NERC.
- Pinheiro, M. C. (2011). Diretrizes para elaboração de estudos hidrológicos e dimensionamentos hidráulicos em obras de mineração (1. ed.). Porto Alegre: ABRH. 171 p.
-
Reboita, M. S., Gan, M. A., Da Rocha, R. P., & Ambrizzi, T. (2010). Regimes de precipitação na América do Sul: uma revisão bibliográfica. Revista Brasileira de Meteorologia, 25(2), 185-204. http://dx.doi.org/10.1590/S0102-77862010000200004.
» https://doi.org/10.1590/S0102-77862010000200004 -
Salgado, S. R. T., Carvalho, E., Viseu, M. T., & Oliveira, O. F. (2025). Evaluating dam safety in Brazil: a comparative analysis of international classification systems. Revista Brasileira de Recursos Hídricos, 30, e46. https://doi.org/10.1590/2318-0331.302520250024.
» https://doi.org/10.1590/2318-0331.302520250024 -
Salio, P., Nicolini, M., & Zipser, E. J. (2007). Mesoscale convective systems over southeastern South American low-level jet. Monthly Weather Review, 135(4), 1290-1309. http://dx.doi.org/10.1175/MWR3305.1.
» https://doi.org/10.1175/MWR3305.1 - Sugai, M. R. von B. (1989). Tempo de Recorrência associado a Precipitação Máxima Provável na Região Sul do Brasil (Dissertação de Mestrado). Centro de Hidráulica e Hidrologia Prof. Parigot de Souza, Universidade Federal do Paraná, Curitiba.
-
Szymanski, M. B., & Davies, M. P. (2004). Tailings dams design criteria and safety evaluations at closure. In British Columbia Mine Reclamation Symposium, Cranbrook, Canada. https://doi.org/10.14288/1.0042456.
» https://doi.org/10.14288/1.0042456 -
Wald, A., & Wolfowitz, J. (1943). An exact test for randomness in the non-parametric case based on serial correlation. Annals of Mathematical Statistics, 14(4), 378-388. http://dx.doi.org/10.1214/aoms/1177731358.
» https://doi.org/10.1214/aoms/1177731358 - Wilks, D. S. (2011). Statistical methods in the atmospheric sciences (3rd ed.). Academic Press.
- World Meteorological Organization – WMO. (2009). Manual on estimation of probable maximum precipitation (PMP) (3rd ed., WMO-No. 1045). Geneva: WMO, 257 p.
-
Zhang, X., Harvey, K. D., Hogg, W. D., & Yuzyk, T. R. (2001). Trends in Canadian streamflow. Water Resources Research, 37(4), 987-998. http://dx.doi.org/10.1029/2000WR900357.
» https://doi.org/10.1029/2000WR900357
Edited by
-
Editor in-Chief:
Adilson Pinheiro
-
Associated Editor:
Carlos Henrique Ribeiro Lima