 Probabilistic dam-breach flood mapping using full and truncated hydrodynamic models
ABSTRACT
Flood modeling and mapping involve considerable uncertainties, particularly in dam-breach studies. To better account for these uncertainties, probabilistic flood-mapping approaches have been increasingly adopted as alternatives to traditional deterministic methods. This study aims to evaluate and compare two probabilistic flood-mapping approaches applied to dam-breach modeling: truncated hydrodynamic models, widely used due to their lower computational demand, and full 2D hydrodynamic models, commonly employed in natural flood mapping. Python scripting and Monte Carlo simulations in HEC-RAS were used to propagate uncertainties in breach parameters (side slope, height, width, and formation time). In a well-established benchmark case study, results revealed significant differences in flood depths (1%–15%) and arrival times (3%–36%), despite minor variations in inundated areas (<2%). Spatially, full 2D models provided greater detail and accuracy, especially in potentially affected residential and commercial zones. Overall, the study provides a clearer basis for selecting the most appropriate probabilistic approach in dam safety analyses and emergency planning, contributing to more reliable and computationally efficient flood-risk assessments.
Keywords:
Probabilistic flood mapping; Dam breach; Truncated models; Python; HEC-RAS; Equifinality
RESUMO
O mapeamento de inundações envolve diversas incertezas, especialmente em estudos de rompimento de barragens. Para representar melhor essas incertezas, abordagens probabilísticas têm sido cada vez mais adotadas como alternativas aos métodos determinísticos tradicionais. Este trabalho compara duas abordagens probabilísticas de mapeamento de inundações: modelos hidrodinâmicos truncados, amplamente utilizados devido à menor demanda computacional, e modelos hidrodinâmicos completos 2D, comumente empregados em estudos de inundações naturais. Embora os modelos truncados reduzam os custos computacionais, apresentam limitações na representação da equifinalidade — situação em que diferentes combinações de parâmetros de ruptura resultam em vazões de pico semelhantes. Com a utilização de rotinas em Python e simulações de Monte Carlo no HEC-RAS para propagar incertezas nos parâmetros de ruptura, a comparação revelou diferenças significativas nas profundidades de inundação (1%–15%) e nos tempos de chegada (3%–36%), em comparação com as variações de área inundada (<2%). Espacialmente, os modelos completos 2D ofereceram maior detalhamento e precisão, sobretudo em áreas residenciais e comerciais potencialmente afetadas. De forma geral, o estudo fornece uma base mais clara para a escolha da abordagem probabilística mais adequada em análises de segurança de barragens e planejamento de emergências, contribuindo para avaliações de risco de inundação mais confiáveis e computacionalmente eficientes.
Palavras-chave:
Mapeamento probabilístico de inundações; Rompimento de barragens; Modelos truncados; Python; HEC-RAS; Equifinalidade
INTRODUCTION
Flood risk assessments play a pivotal role in dam safety and risk management, as they encompass the fundamental capacity to comprehend, quantify, and forecast flood areas and their associated impacts (Mohanty & Simonovic, 2022; Williams & Buchanan, 2013). In the context of natural floods, such assessment traditionally adopts a deterministic approach to analyze impacts based on predefined scenarios, typically reliant on probabilities associated with natural hydrological phenomena (Beven et al., 2015; Kheradmand et al., 2018). Similarly, deterministic methodologies are frequently used for dam failures flood assessments (Bello et al., 2022). However, deterministic approaches frequently fall short in adequately capturing the complexities of hydraulic structure failures due to the exclusion of inherent uncertainties associated with various process parameters (Tsai et al., 2019).
In a deterministic approach, which assesses the impact of a single risk scenario, it becomes challenging to directly correlate the damages incurred by a single flood to infrastructure costs (Kheradmand et al., 2018). This approach can also lead to less extreme scenarios compared to probabilistic approaches, as it does not account for uncertainty. In certain proposed developments situated on flood plains, there might be a need to consider varying degrees of risk tolerance or aversion. This could involve decisions regarding the location of development or the level of defense measures, for example. Different likelihoods might be more or less appropriate for different types of use (Beven et al., 2015).
Among the deterministic methodologies employed in modeling dam failure floods, the majority of studies has focused on developing prediction equations for breach parameters such as height, width, and breach formation time, using statistical regressions based on historical records of dam failures (Froehlich, 1995, 2008, 2016; Von Thun & Gillette, 1990; Xu & Zhang, 2009). While these methodologies have demonstrated advances in predicting breach parameters, thanks to the expansion of historical databases and optimization of statistical regressions, they neglect inherent uncertainty associated with this complex process.
With respect to the sources of uncertainties related to hydrodynamic modeling of dam breaches, recent investigations underscore the prominent role played by parameters associated with breach formation, placing specific emphasis on geometric attributes such as height, width, lateral slopes, as well as breach formation time (Bello et al., 2022; Bellos et al., 2020; Silva & Eleutério, 2023; El Bilali et al., 2022; Kim & Sanders, 2016; Tsai et al., 2019; Von Ahn & Manica, 2024; Yu et al., 2015). Other investigations have focused on uncertainties linked to parameters that characterize the valley downstream of the dam, including topobathymetric data and Manning roughness coefficients (Altinakar et al., 2013; Candela & Aronica, 2017; Silva et al., 2024; Tsai et al., 2019).
As an alternative to deterministic approaches, probabilistic flood mapping aims to address these uncertainties by introducing probabilities of flooding in the mapping process (Kheradmand et al., 2018; Papaioannou et al., 2017). By employing probabilistic methods, hydraulic outcomes associated with different exceedance probabilities can be generated, providing a more comprehensive understanding of the potential range of flood events resulting from dam failures. Hence, these methods allow for a more robust assessment of flood risks and support decision-making processes in dam safety and risk management. The integration of flood probabilities into the mapping process holds the potential to enhance outcomes, as different probabilities can be more or less suitable for different decision-making purposes (Beven et al., 2015).
Recent studies (Bellos et al., 2020; Silva & Eleutério, 2023; El Bilali et al., 2022; Goodell et al., 2018) predominantly indicate the use of truncated models to reduce computational demands in dam-breach probabilistic flood mapping. An alternative approach used in probabilistic flood mapping considers only full hydraulic models. Although this strategy has been widely applied in probabilistic natural flood studies (Beven et al., 2015; Candela & Aronica, 2017; Oubennaceur et al., 2018; Papaioannou et al., 2017; Stephens & Bledsoe, 2020), it remains rarely implemented in dam-breach probabilistic flood mapping (Melo & Eleutério, 2023).
In spite of the computational demand reduction associated with Indirect Probabilistic Flood Mapping (I-PFM) approach, the determination of probabilistic dam-breach outflow hydrographs through the association of exceedance probabilities with peak outflow is limited, as it has been observed that hydrographs with completely different characteristics, such as peak time and runoff volume, can be generated for a similar peak outflow (Silva & Eleutério, 2023). In contrast, we may consider that the Direct Probabilistic Flood Mapping (D-PFM) approach achieves more details over the whole hydrodynamic parameters, with a high computational associated cost.
Despite the advances achieved by previous studies employing either truncated or full hydrodynamic models, applications of the D-PFM approach to dam-breach scenarios remain scarce. Furthermore, comparative analyses between the I-PFM and D-PFM approaches within the same case study are rarely reported in the literature. This study addresses this research gap by testing whether the outcomes of both approaches diverge significantly when uncertainty is propagated through the full hydrodynamic domain.
Accordingly, the study hypothesizes that while I-PFM can reproduce flood extents comparable to those obtained with D-PFM—due to the dominance of peak discharge in defining inundation areas—it tends to under- or overestimate local flood depths and arrival times as a result of equifinality effects inherent to the truncated modeling framework. The analysis aims to identify the main limitations, advantages, and domains of applicability of both probabilistic approaches. The methods are tested in a well-established benchmark case study (Altinakar et al., 2013; Silva & Eleutério, 2023; McVan et al., 2013; Melo & Eleutério, 2023; Saberi et al., 2013; Thames & Kalyanapu, 2013; Williams & Buchanan, 2013).
CONCEPTUAL BACKGROUND
To provide the theoretical basis for the comparison between the Indirect and Direct Probabilistic Flood Mapping approaches (I-PFM and D-PFM), this section presents a conceptual overview of probabilistic dam-breach flood mapping. It begins with the physical and empirical principles governing breach formation, then addresses the probabilistic characterization of breach parameters, and concludes by outlining the conceptual framework of the Direct and Indirect Probabilistic Flood Mapping approaches, emphasizing how their structural differences influence the representation and propagation of uncertainty. In synthesis, these aspects define the conceptual basis supporting the methodological comparison undertaken in this study.
Breach formation modeling
Breach formation modeling has been extensively explored in the literature through various methodologies, including physical models (Davison et al., 2013; Kocaman et al., 2020; Mancusi et al., 2013; Saberi et al., 2013; Wu, 2013), comparative analyses (Wahl, 2004), and regression equations (Froehlich, 1995, 2008, 2016; Von Thun & Gillette, 1990; Xu & Zhang, 2009). Physical models are developed based on numerical and experimental analyses of the characteristics of the dam and downstream valley. However, these models are limited by their conduction under controlled and specific conditions, leading to uncertainties when applying their findings to other study cases (El Bilali et al., 2022). Otherwise, regression equations have been developed using historical dam failure records to establish generalized relationships for estimating breach parameters. These equations are based on specific dam and reservoir characteristics, such as storage volume and failure mode (Froehlich, 2016; MacDonald & Langridge‐Monopolis, 1984; Von Thun & Gillette, 1990; Xu & Zhang, 2009).
Regression equations for breach parameters are frequently employed within a deterministic framework for modeling breach formation, where the parameters are assumed to be fixed without considering the associated uncertainties (Bello et al., 2022). Despite the ease of application, this approach is affected by multiple sources of uncertainty, as regression equations are developed based on a limited database and specific dam configurations (El Bilali et al., 2022).
To address this uncertainty related to breach parameters, the probabilistic approach gained prominence as a viable alternative. By employing techniques such as Monte Carlo Simulation (Bello et al., 2022; Bellos et al., 2020; Silva & Eleutério, 2023; El Bilali et al., 2022; Goodell et al., 2018), Perturbation Methods (Tsai et al., 2019) and Latin Hypercube Sampling (Altinakar et al., 2013), along with empirically estimated probability distributions (e.g., Normal, Gumbel, Gamma) (Silva & Eleutério, 2023), variations in breach parameters can be comprehensively accounted for.
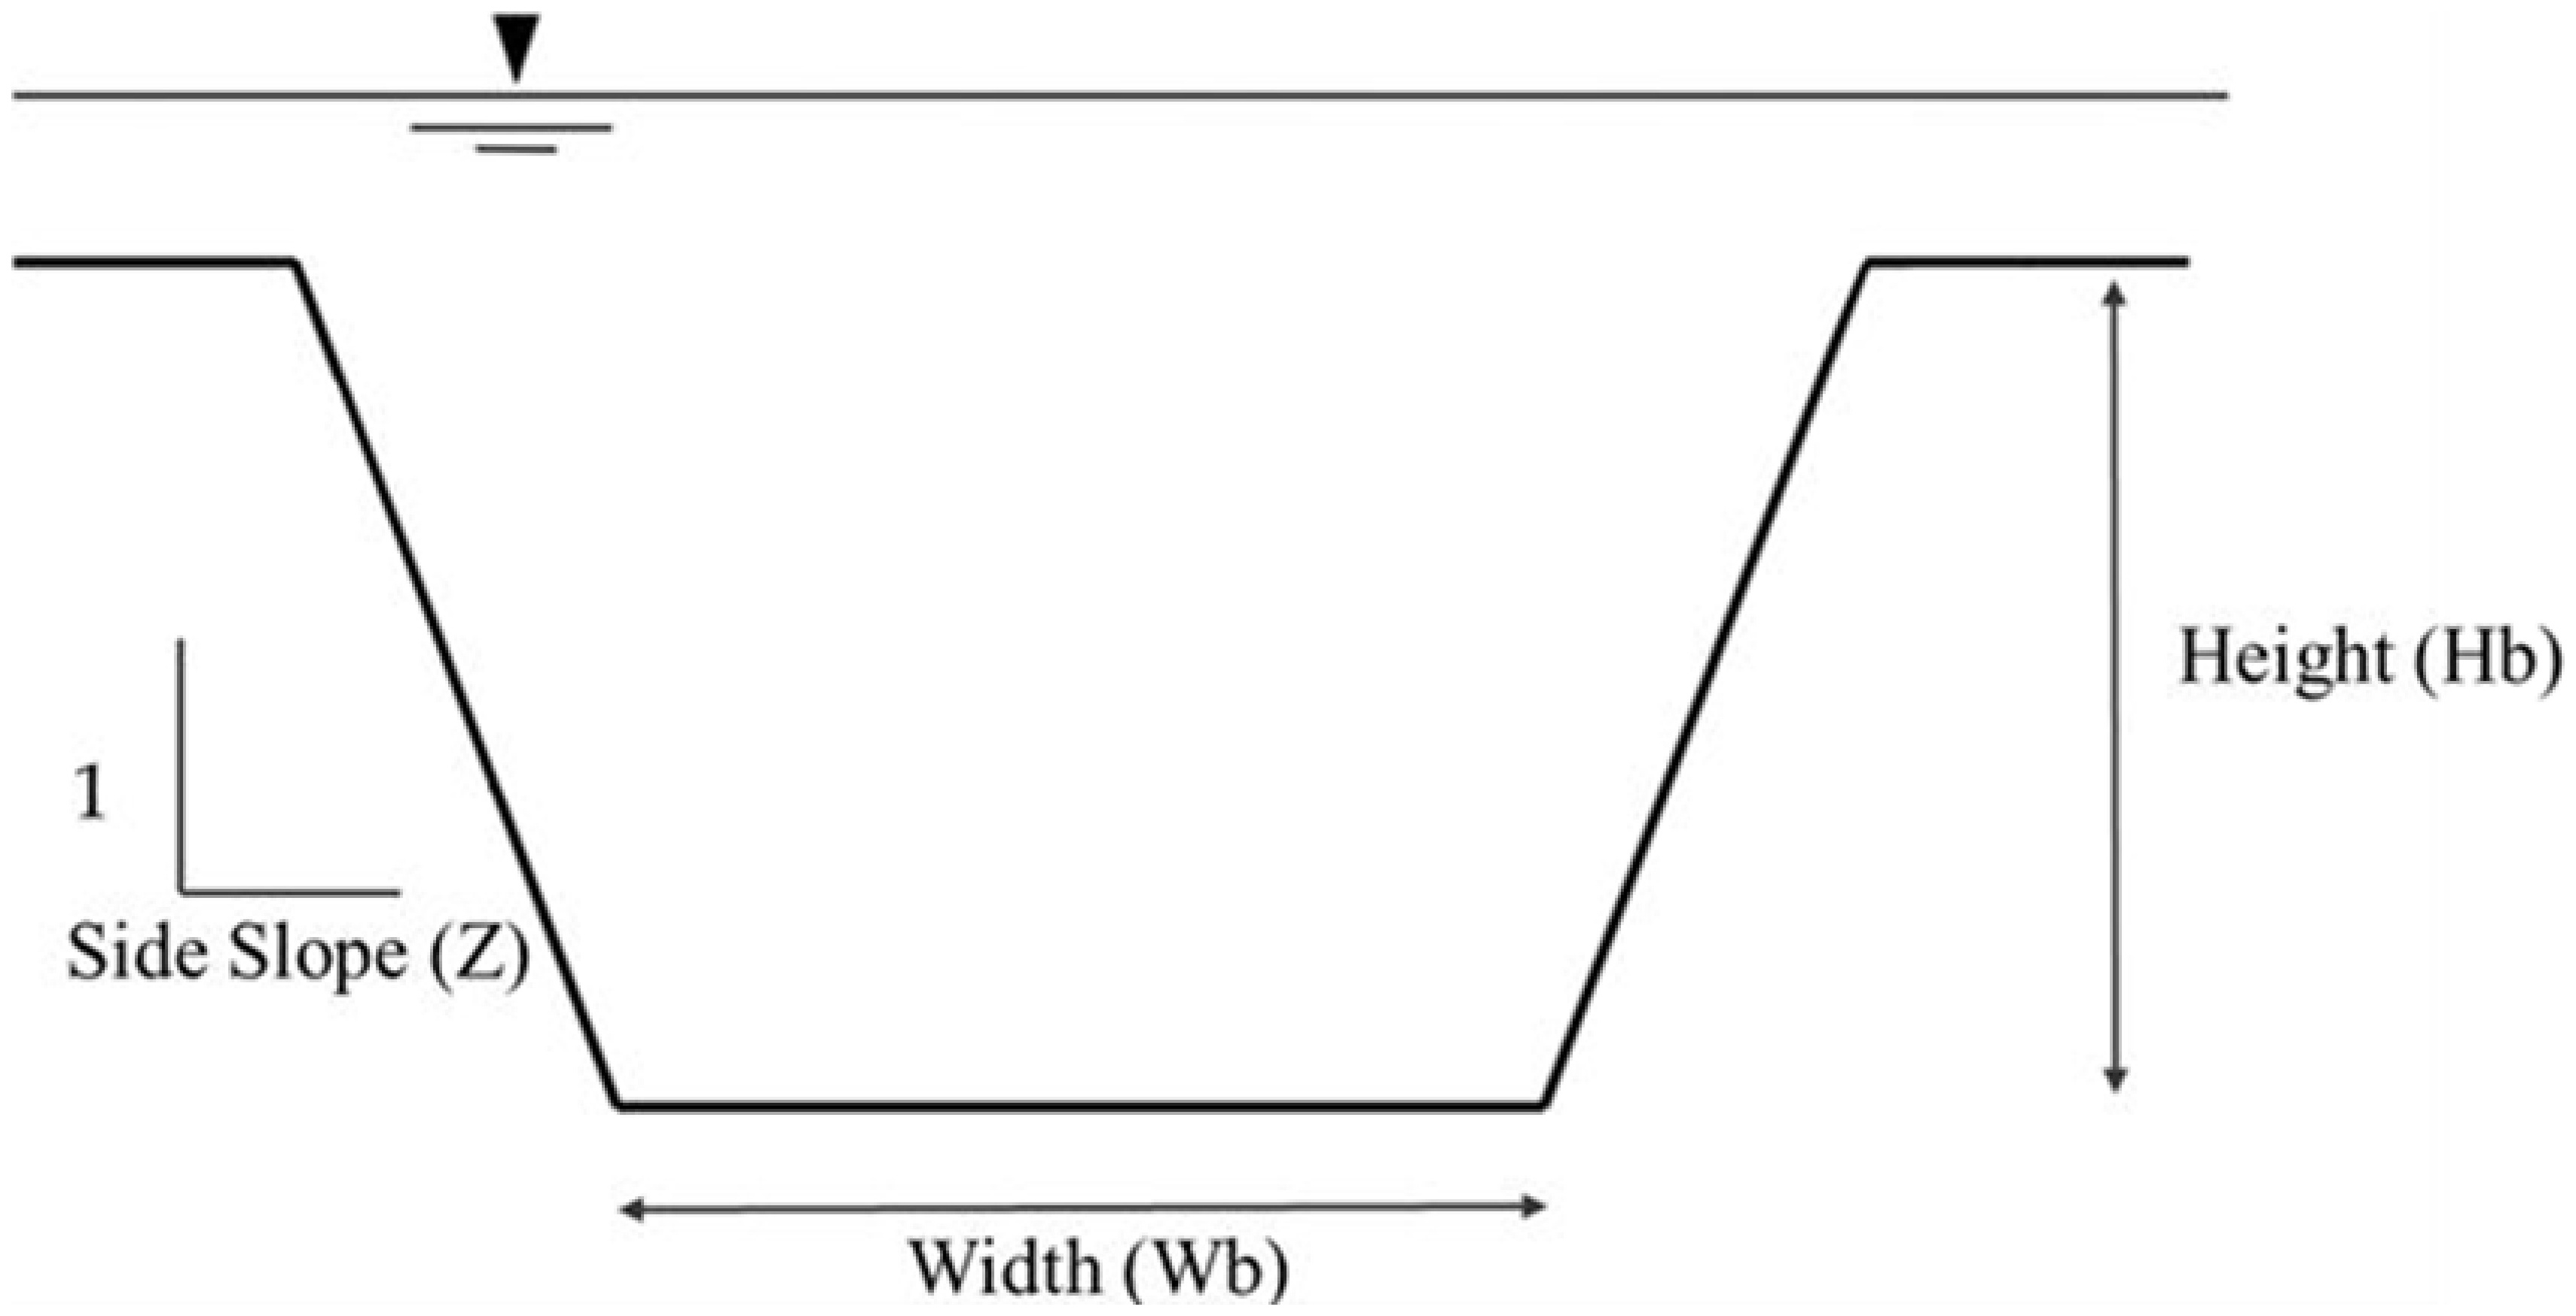
The parameters of the breach can be divided into geometric characteristics, breach formation time, and hydraulic parameters (Bellos et al., 2020). The estimation of the location, geometry, and breach formation time is crucial for accurately determining the breach-outflow hydrograph and downstream inundation characteristics (Brunner, 2021a). As described by Wahl (2004), the breach can be defined by four main parameters Figure 1, which are: height (Hb), width (Wb), side slope factor (z), and breach formation time (Tf).
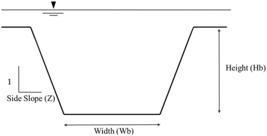
Height (Hb) is the difference between the crest of the dam and the elevation of the bottom of the breach, indicating a vertical erosion limitation due to the presence of a rocky surface or other non-erodible materials. Width (Wb) is the horizontal distance between the walls of the breach formed by vertical erosion measured at the bottom of the breach. Z represents side slope of the surface and can be related to the friction slope and cohesion of the dam material. Finally, breach formation time (Tf) represents the time interval between the beginning of the failure and the complete formation of the breach.
Consistent with the findings of recent comparable studies that have focused on characterizing uncertainties associated with breach parameters (Bello et al., 2022; Bellos et al., 2020; Silva & Eleutério, 2023; El Bilali et al., 2022; Tsai et al., 2019), the present study addresses these uncertainties by considering these four critical parameters.
Dam-breach parameters probability distributions
The determination of probability distributions associated with different uncertainty parameters is crucial for the probabilistic modeling of dam failures. Several studies have explored the use of various probability distributions. Altinakar et al. (2013) employed the empirical equation proposed by Froehlich (1995) with errors following a lognormal distribution. Goodell et al. (2018) considered variations following a normal distribution using Monte Carlo Simulation (MCS) and HEC-RAS software.
Bellos et al. (2020) employed a uniform distribution to adjust breach parameters in an application of MCS with 10,000 repetitions of the one-dimensional module of HEC-RAS. El Bilali et al. (2022) used the uniform distribution with limits based on Federal Energy Regulatory Commission (2015) to vary the breach parameters using McBreach software. Similarly, Bello et al. (2022) also employed the uniform distribution in McBreach.
More recently, Silva & Eleutério (2023) analyzed 3,861 historical dam-failure records compiled by Bernard-Garcia & Mahdi (2020) and proposed probability distributions that best represent earth-fill dam-breach parameters. To identify the most suitable distributions, the authors applied correlation and comparative analyses across groups of dam and failure characteristics—such as dam type, material erodibility, magnitude, and failure mode. Their results indicated that the Gamma distribution provided the best fit for side-slope factor, breach width, and breach-formation time, whereas the Asymmetric Laplace distribution was most appropriate for breach height.
Overview of the direct and indirect probabilistic flood mapping approaches
In the context of probabilistic flood analysis, two conceptual frameworks have emerged for dam-breach modeling: the Indirect Probabilistic Flood Mapping (I-PFM) and the Direct Probabilistic Flood Mapping (D-PFM) approaches. Although both aim to represent uncertainty in flood extent and intensity, they differ substantially in how this uncertainty is propagated through the hydrodynamic system.
In the I-PFM approach, a truncated hydrodynamic model is used to simulate only the dam-breach outflow hydrographs. By excluding the downstream valley from the computational domain, this configuration considerably reduces simulation time and computational demand, allowing for a larger number of Monte Carlo realizations and faster statistical convergence. The resulting set of hydrographs is analyzed to estimate exceedance probabilities for peak discharge, which are subsequently routed through a complete hydrodynamic model of the downstream reach. In this framework, probabilistic flood maps are obtained indirectly, as uncertainty is first represented at the dam outlet and only then transferred downstream through deterministic flood routing.
The D-PFM approach, in contrast, applies the probabilistic analysis directly to the full two-dimensional hydrodynamic model. Each sampled set of breach parameters generates a complete simulation of both the dam-breach process and the resulting flood propagation, producing a series of flood maps that can be directly associated with specific exceedance probabilities. This configuration captures the probabilistic behavior of multiple hydraulic variables—such as depth, velocity, and arrival time—across the entire floodplain. However, the comprehensive treatment of uncertainty in D-PFM comes at a substantial computational cost, as it requires a large number of full-domain simulations.
In recent years, I-PFM has been predominantly applied to dam-breach studies because of its computational efficiency (Bellos et al., 2020; Silva & Eleutério, 2023; El Bilali et al., 2022; Goodell et al., 2018), whereas D-PFM has been more frequently employed in natural flood studies (Beven et al., 2015; Candela & Aronica, 2017; Oubennaceur et al., 2018; Papaioannou et al., 2017; Stephens & Bledsoe, 2020). The two frameworks thus represent distinct strategies for uncertainty propagation: I-PFM transfers uncertainty indirectly through breach-outflow hydrographs, while D-PFM propagates it explicitly throughout the hydrodynamic domain. Understanding these conceptual differences is essential for assessing their relative performance, computational efficiency, and applicability to dam-breach flood-risk analysis.
These conceptual distinctions guided the methodological design presented in the following section, where both approaches were implemented and compared within a common dam-breach case study.
MATERIAL AND METHODS
Direct Probabilistic Flood Mapping (D-PFM) algorithm
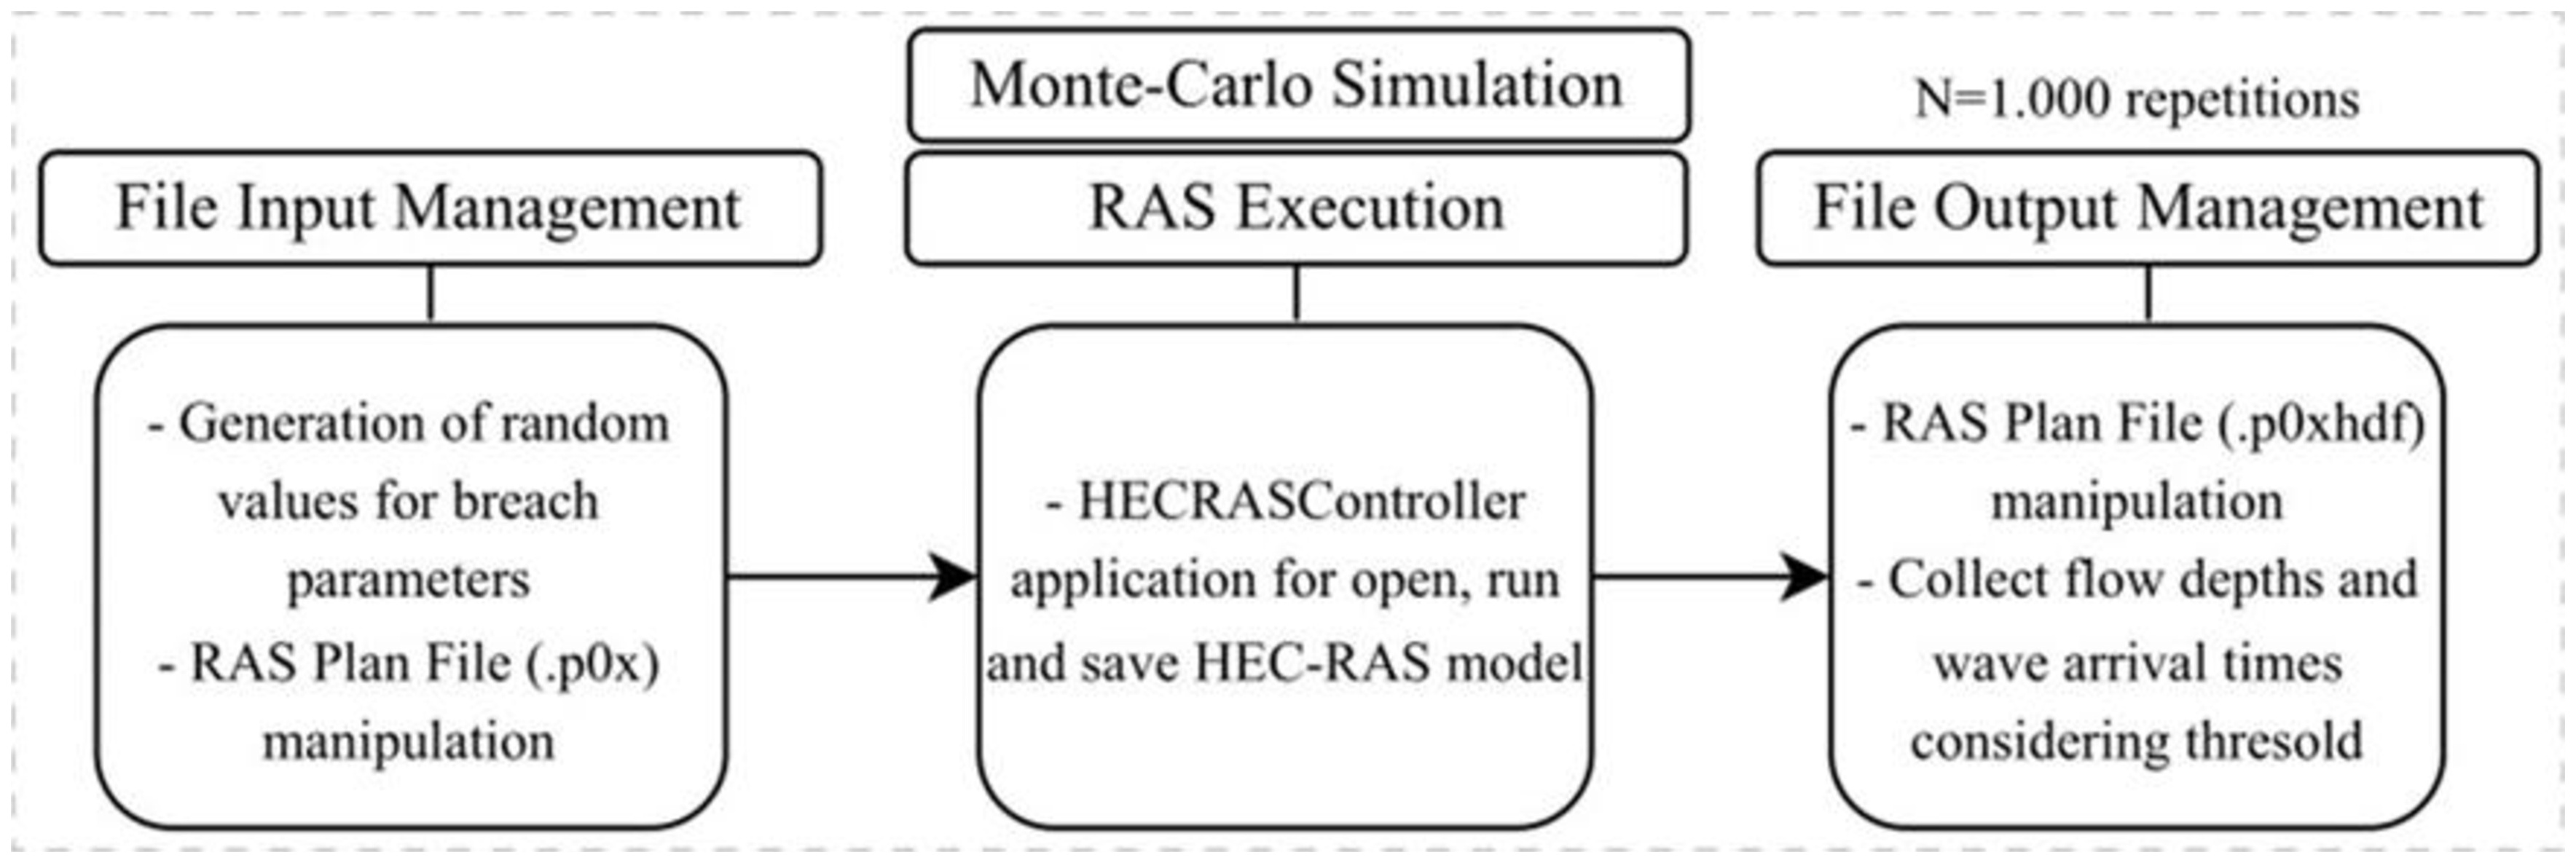
The D-PFM algorithm developed enables the (i) manipulation of breach parameters in the model considering selected probability distributions, (ii) automatic execution of simulations through the HEC-RASController API, and (iii) extraction of results from multiplee model simulations Figure 2. The complete algorithm is available at https://github.com/MCGI-UFMG/BreachRASProb/DPFM.
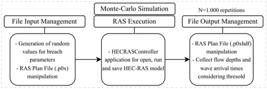
The first step involves manipulation of dam-breach parameters stored in the simulation plan files (.p0X), which contain data related to breach formation time, progression, method (e.g., overtopping, internal erosion), and breach geometry, as described in Goodell (2014). The second step utilizes the HECRASController tool (Goodell, 2014), which is part of the HEC-RAS Application Programming Interface (API). This tool consists of specific functions and subroutines that facilitate the automation of the HEC-RAS process.
Finally, the algorithm manipulates hierarchical formatting output files (HDF5), which contain information related to the model's geometry, boundary conditions, and the results generated in each computational grid cell. Dam-breach outflow, maximum flow depths and flood arrival time were collected. The last one was computed by considering the threshold of 0.61 meters (2 feet) as suggested by Federal Emergency Management Agency (2013).
Indirect Probabilistic Flood Mapping (I-PFM) algorithm
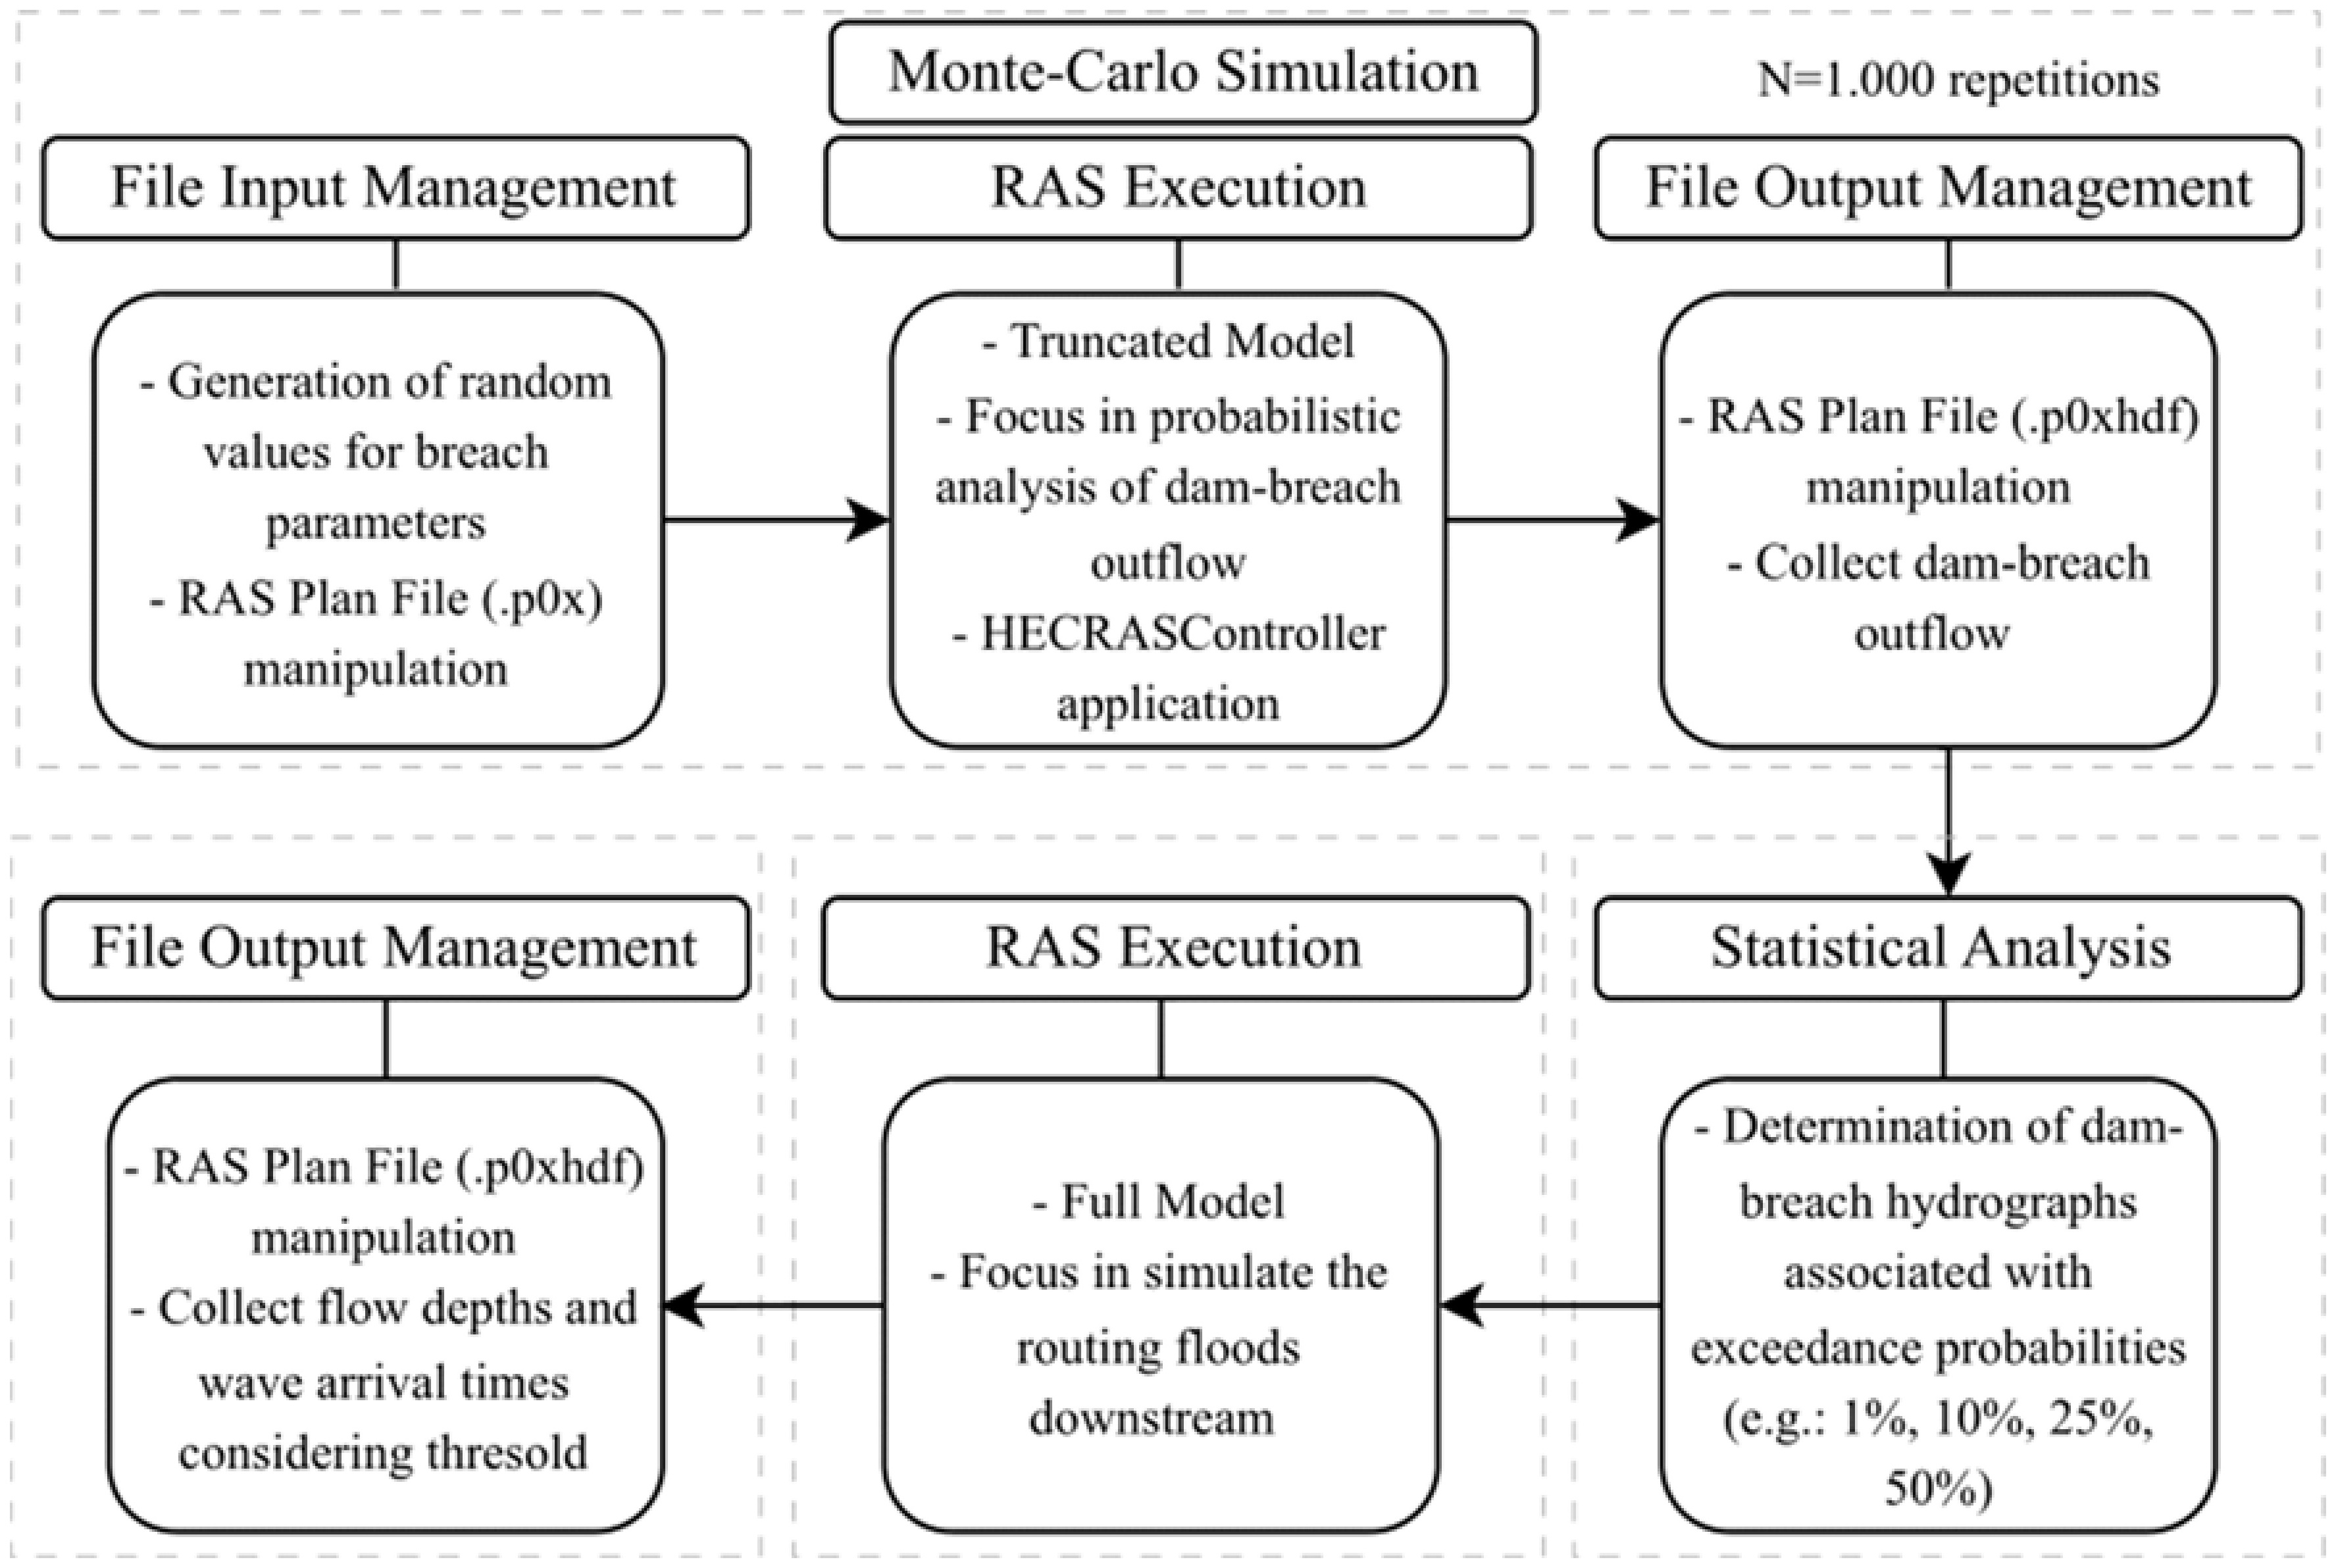
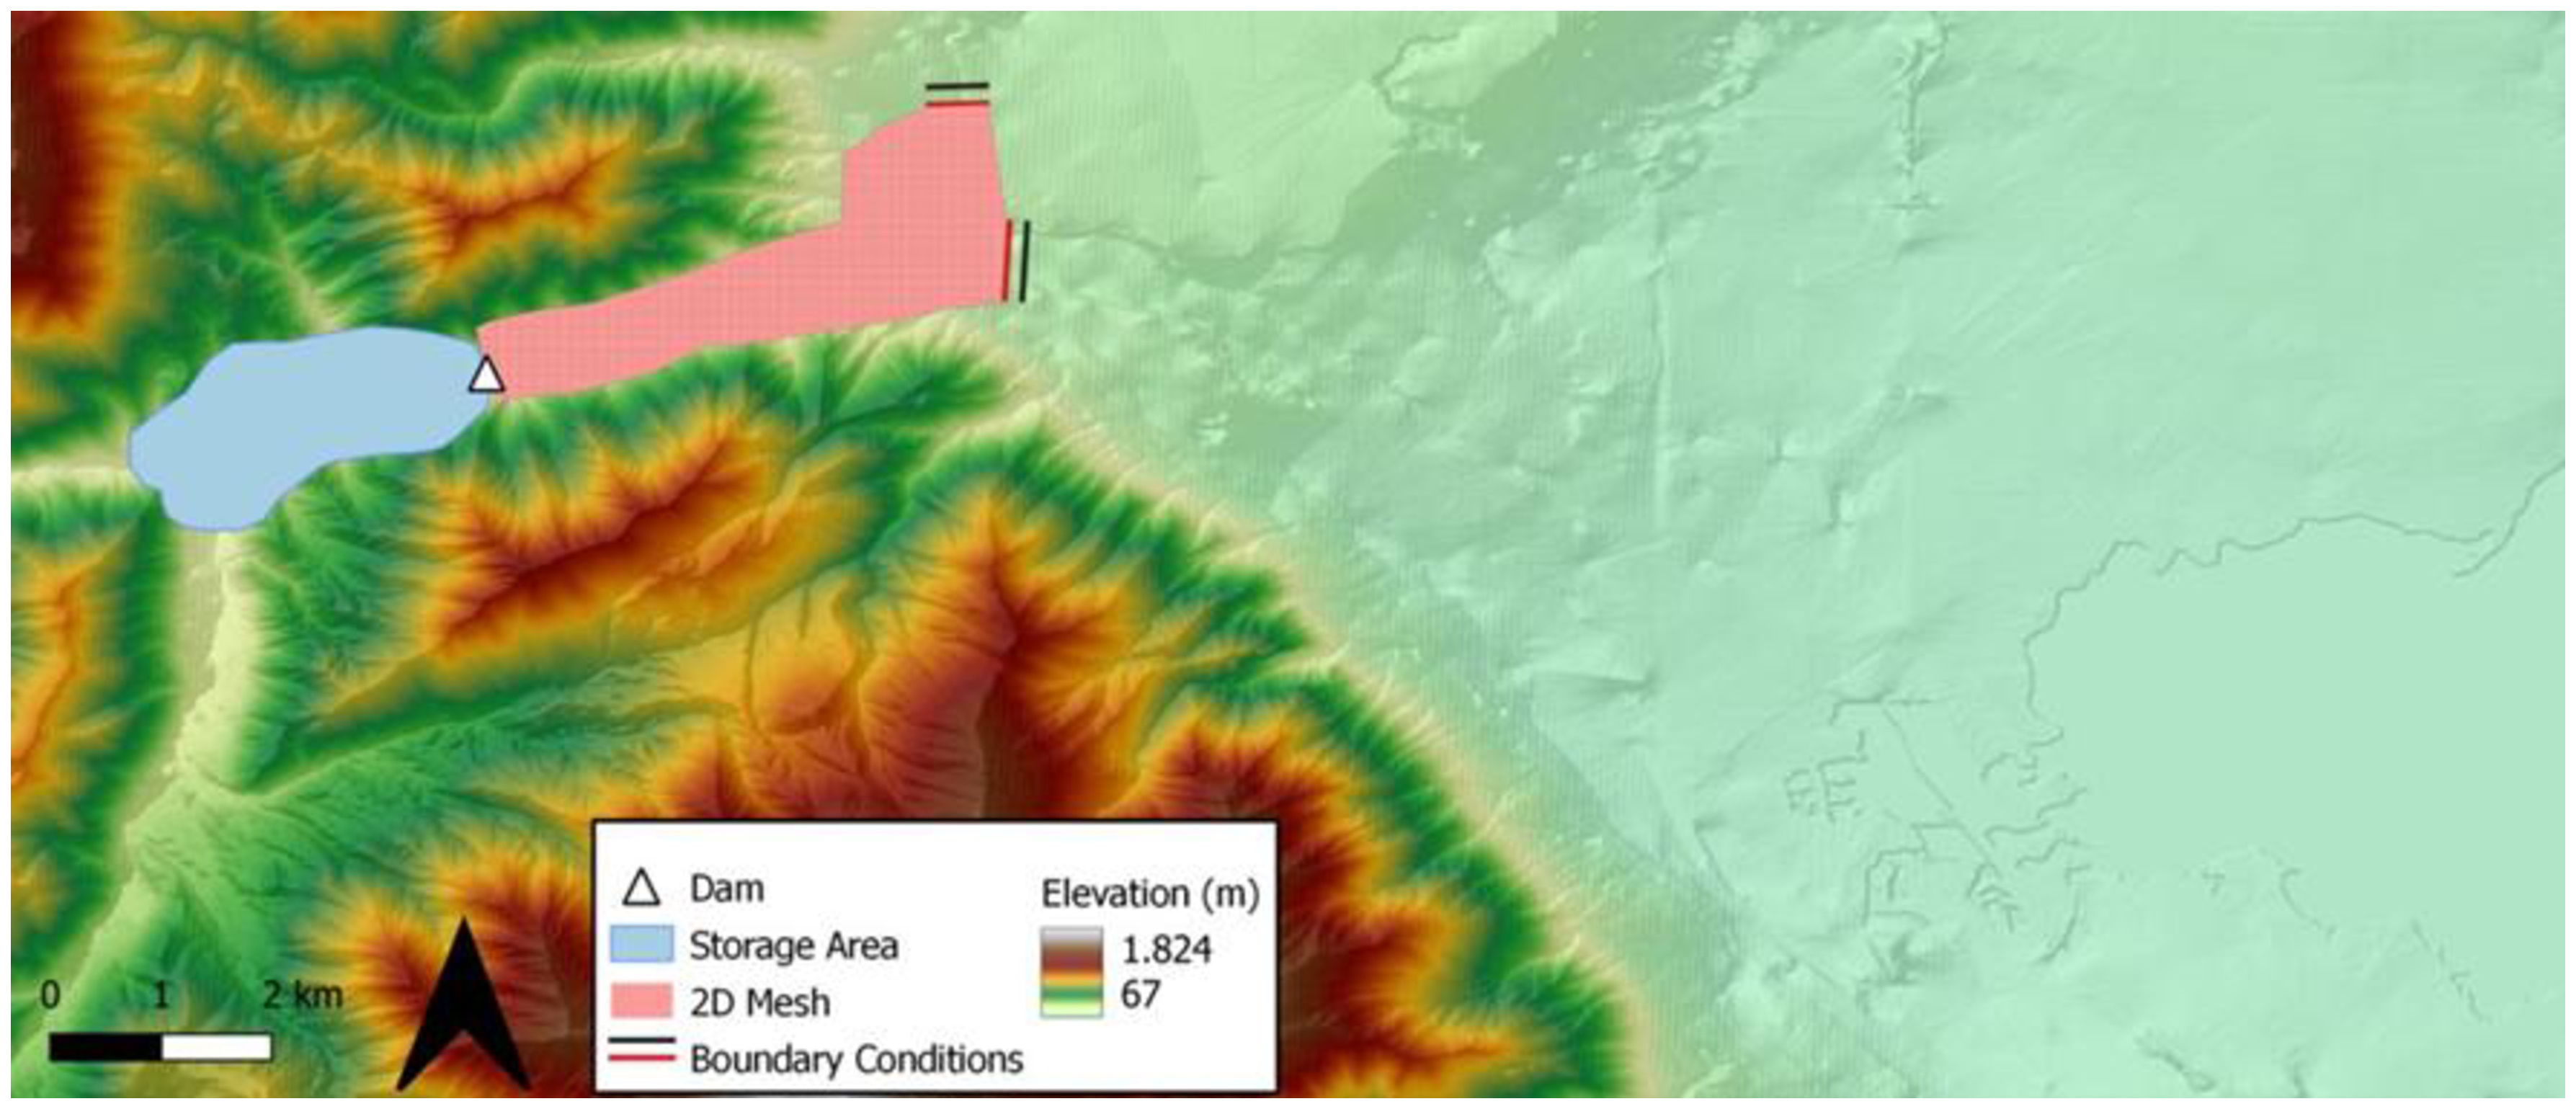
The I-PFM algorithm was developed using the same concept as D-PFM with the only difference being that, instead of performing MCS with a computational mesh that includes the downstream valley, MCS is performed using a truncated computational mesh Figure 3. This approach focuses exclusively on analyzing dam-breach outflow, thereby reducing computational demand. The complete algorithm is available at https://github.com/MCGI-UFMG/BreachRASProb/IPFM.
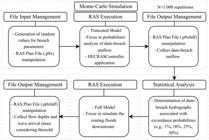
In this step, the computational mesh excludes the downstream valley to concentrate on the probabilistic analysis of dam-breach outflow. With the peak flow results associated with exceedance probabilities, further simulations are conducted considering dambreach outflow at specific exceedance probabilities (e.g.: 10%, 25%, 50%, 75%). In this subsequent step, the computational mesh includes the downstream valley to indirectly perform probabilistic flood mapping.
Case study
The study focused on the hypothetical breach of an earth dam due to overtopping failure. The selected case for analysis is based on the study conducted by ICOLD during the 12th International Benchmark Workshop in 2013, which focused on numerical analyses related to dam-breaches. For this purpose, this study used data from (Zenz & Goldgruber, 2013), which was also considered to various simulations in different studies (Altinakar et al., 2013; Silva & Eleutério, 2023; Davison et al., 2013; Mancusi et al., 2013; McVan et al., 2013; Melo & Eleutério, 2023; Saberi et al., 2013; Thames & Kalyanapu, 2013; Williams & Buchanan, 2013). The study area includes a hypothetical dam constructed in a mountainous region to mitigate flood events.
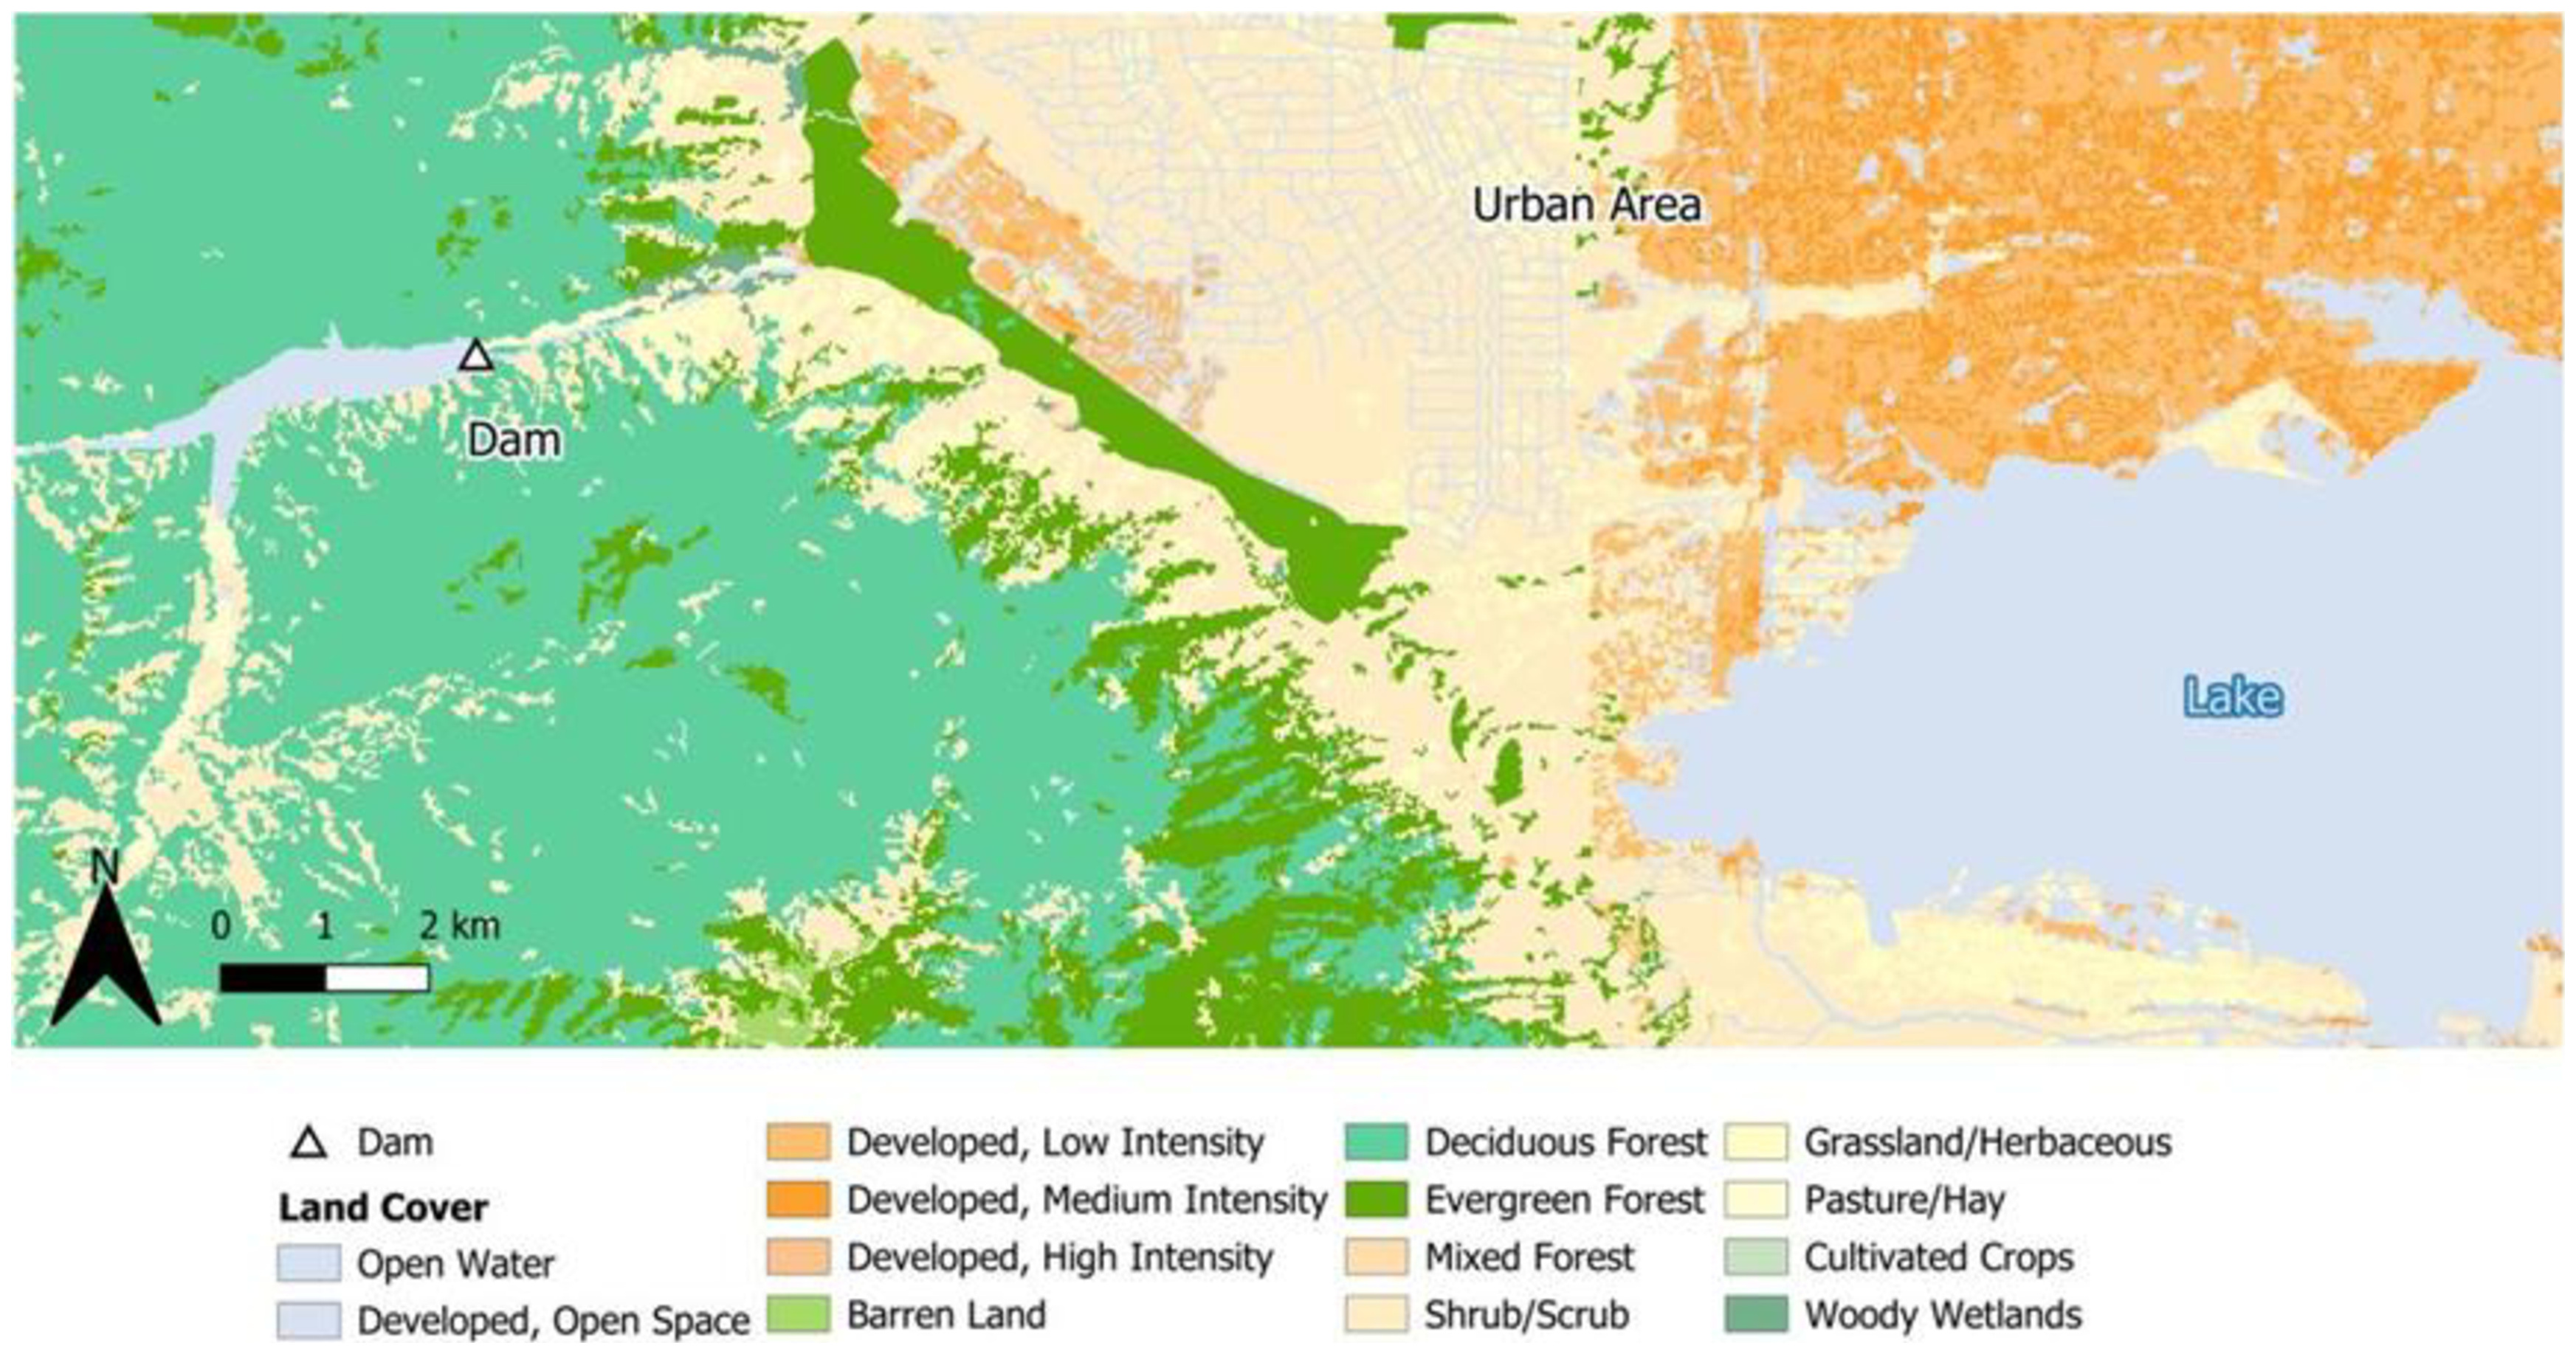
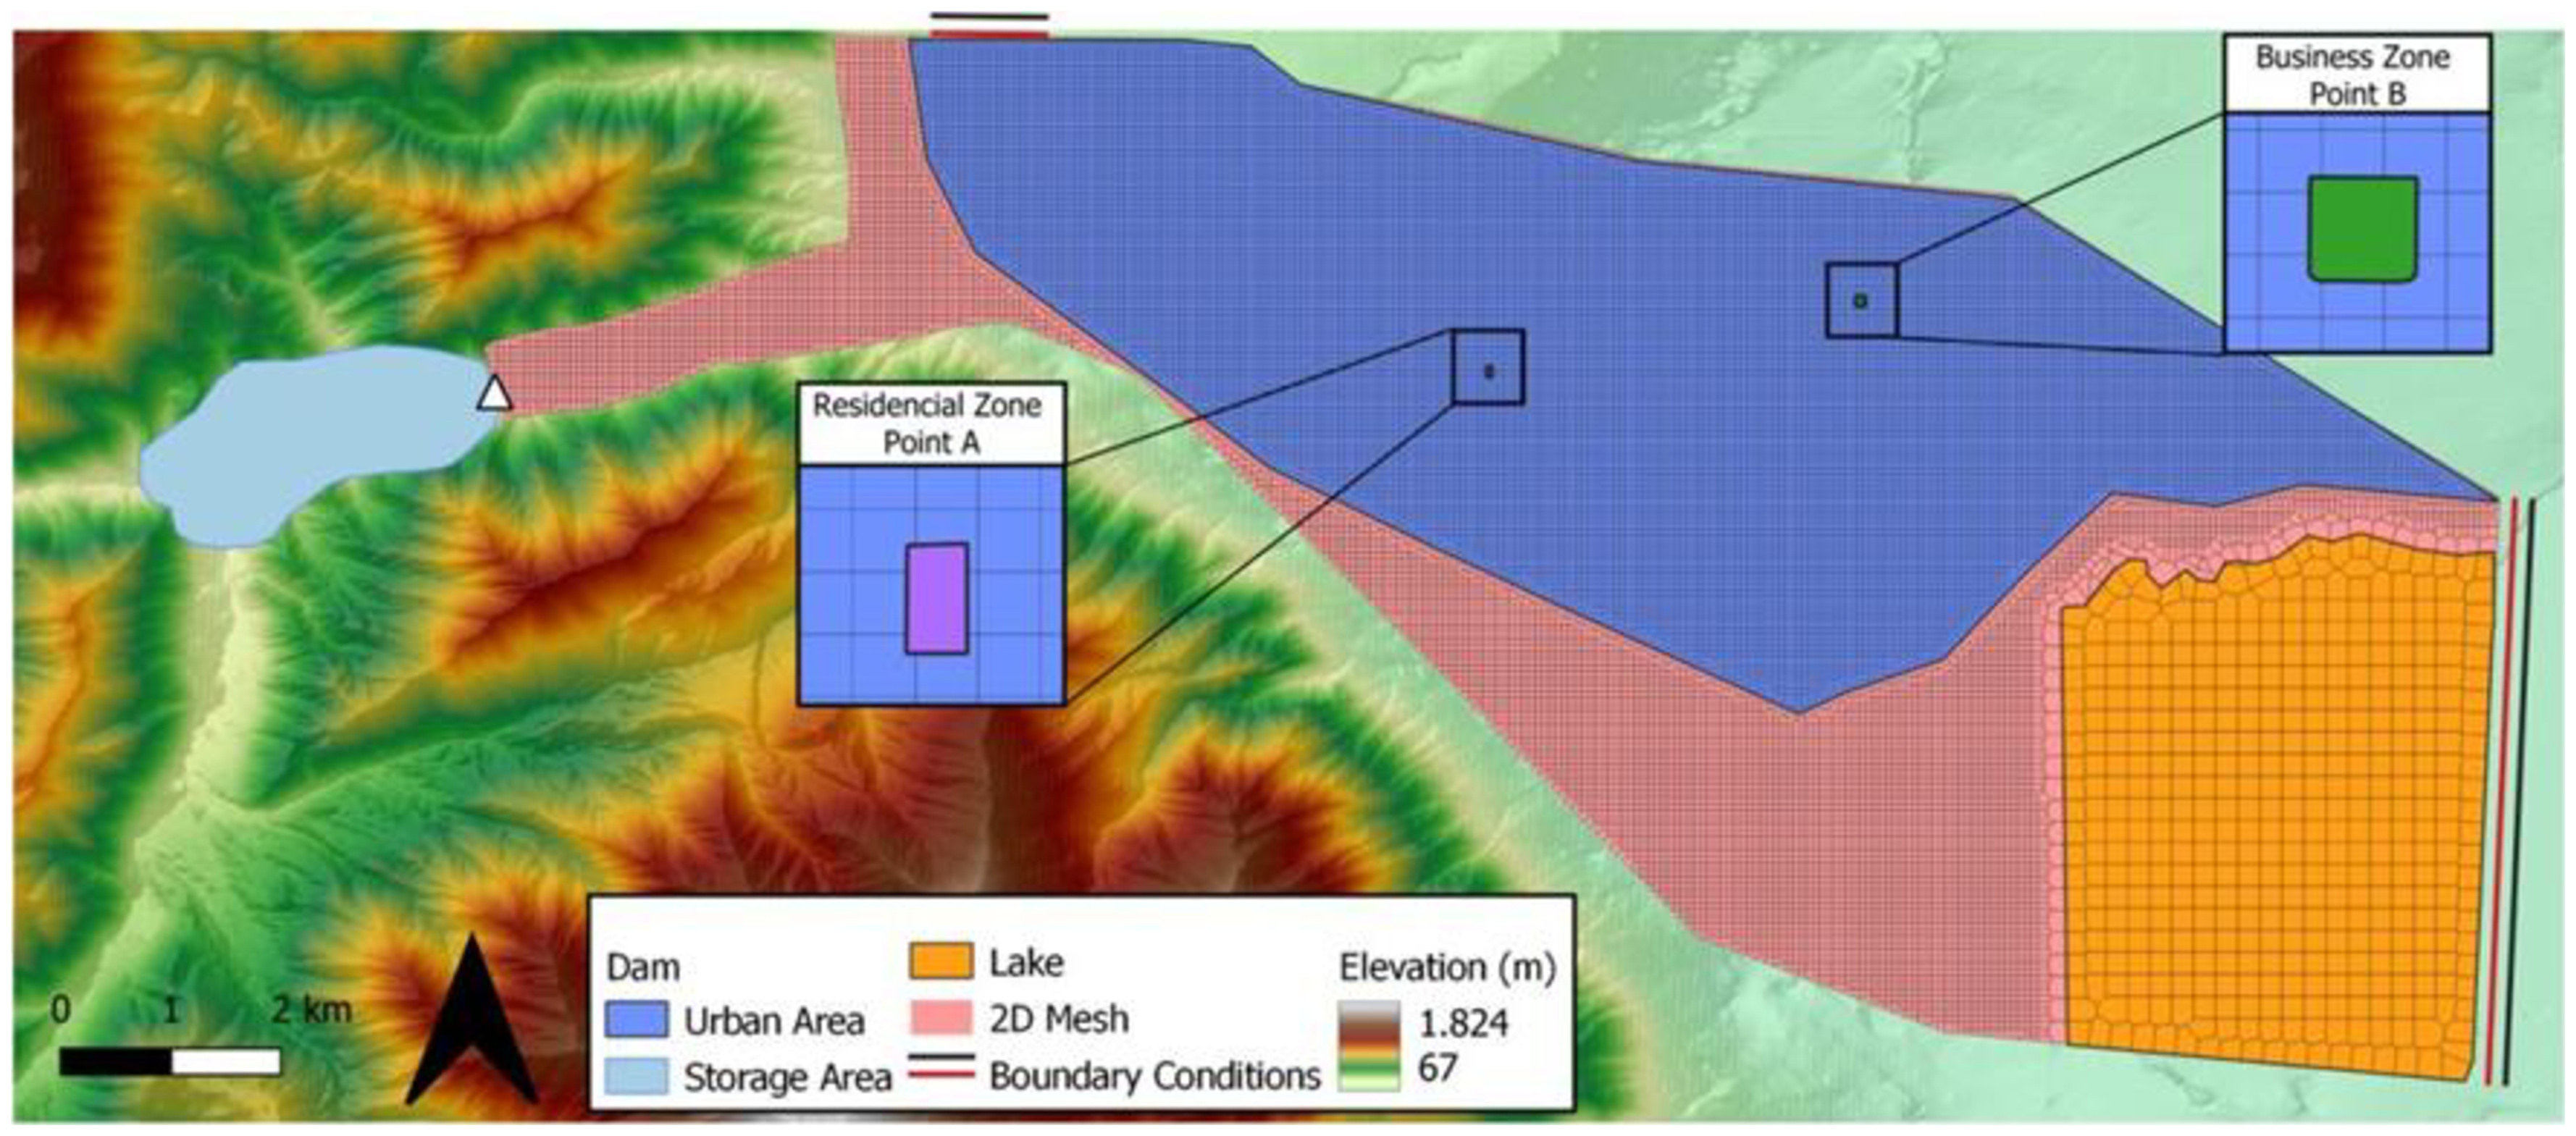
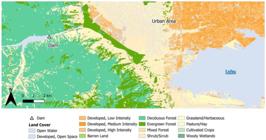
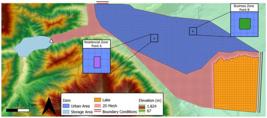
The analyzed dam would have a significant potential for damage as it is located approximately 3.5 km upstream of an urbanized area representing the hypothetical municipality of Hydropolis. The study area is characterized by the presence of a dam in a steep valley region, upstream of the potentially affected urban area, and a lake at the downstream boundary of the study area (Figure 4).
The hypothetical dam predominantly consists of clayey-sandy and sandy-clayey soils, with a height of 61 meters. Table 1 provides detailed information on the geometric characteristics of the structure. The reservoir has a maximum capacity of around 38 million cubic meters, considering the water level equals to the dam crest elevation at 272 meters a.s.l (above sea level).
Considering the overtopping failure mode, the breach location was set as the central point of the dam crest, hypothetically considering that it is the lowest topographic level on the dam crest. Finally, Manning's roughness coefficients considered in the hydrodynamic models for each land use and land cover category (Table 2) were determined based on the average values suggested by Brunner (2021a).
Dam-breach parameters probabilistic distributions
In this study, probabilistic distributions for dam-breach parameters were adopted from Silva & Eleutério (2023), which provide empirically derived representations of uncertainty for earth-fill dams. Following the approach of previous studies (Bello et al., 2022; Bellos et al., 2020; Silva & Eleutério, 2023; El Bilali et al., 2022), Monte Carlo simulations (MCS) were performed to randomly sample parameter values from the defined probability distributions and to propagate uncertainty through multiple hydrodynamic simulations.
Parameterization was defined for the overtopping failure mode and a narrow dam shape, as summarized in Table 3.
Hydrodynamic modelling
The two-dimensional module of HEC-RAS v. 5.0.7 was employed for hydrodynamic modeling configuration considering the full model (D-PFM) and the truncated model (I-PFM). When considering the full model, the computational mesh covered an area of 84.36 km2. For optimizing computational resources during the numerous simulations conducted, a computational mesh was designed over this area with three different resolutions (Figure 5): a default resolution of 60 m x 60 m cells was used for nonurbanized areas; a resolution of 50 m x 50 m was used for the highly urbanized portion of the study area, where high spatial accurate were required; a resolution of 200 m x 200 m was employed for the lake region, which is located further away from the urban area.
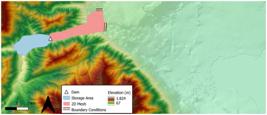
When considering the truncated model, the computational mesh covered an area of 5.14 km2 with a resolution of 50 m x 50 m cells, represented only the first 5 km downstream the dam (Figure 6).
The reservoir routing was modeled using the Modified Puls method (Brunner, 2021b), while the propagation of the flood wave was simulated using the Shallow Water Equations (Full Momentum). For the upstream boundary condition, the reservoir was assumed to have a volume up to the crest of the dam, and for the downstream boundary condition, the normal flow depth was considered (i=0.01 m/m). For practical purposes related to the hypothetical case study, and considering it is out of the scope of this research, no natural flood hydrograph was considered downstream the dam.
A simulation time of 5 hours was chosen to capture the relevant flooding dynamics. To ensure numerical stability and accuracy, an automatic adjustment method was employed to define the time step considering the Courant number limits equal to 0.5 and 1.0. The base and minimum time steps were set as 1.0 second and the maximum value was set to 64.0 seconds. The automatic adjustment method implemented in HEC-RAS considers that for each simulation time, time step can be adjusted considering predefined ranges of time steps and Courant number values. As presented in USACE (Brunner, 2021a), this option leads to the best numerical solution.
The simulations were conducted on a computer equipped with an AMD Ryzen 5 processor clocked at 3.90 GHz, 16 GB of RAM, and running Windows 11 64-bit.
Definition of scenarios
Monte Carlo Simulations considering D-PFM and I-PFM were performed with 1,000 repetitions, using the selected parameters from the probabilistic distributions (Table 3) and the joint variation of the breach parameters. To evaluate the convergence of the MCS, variations in the statistical indices (mean, standard deviation and skewness) related to dam-breach peak outflow were analyzed. MCS were stopped when the statistical indices from different simulations varied less than 0.5%.
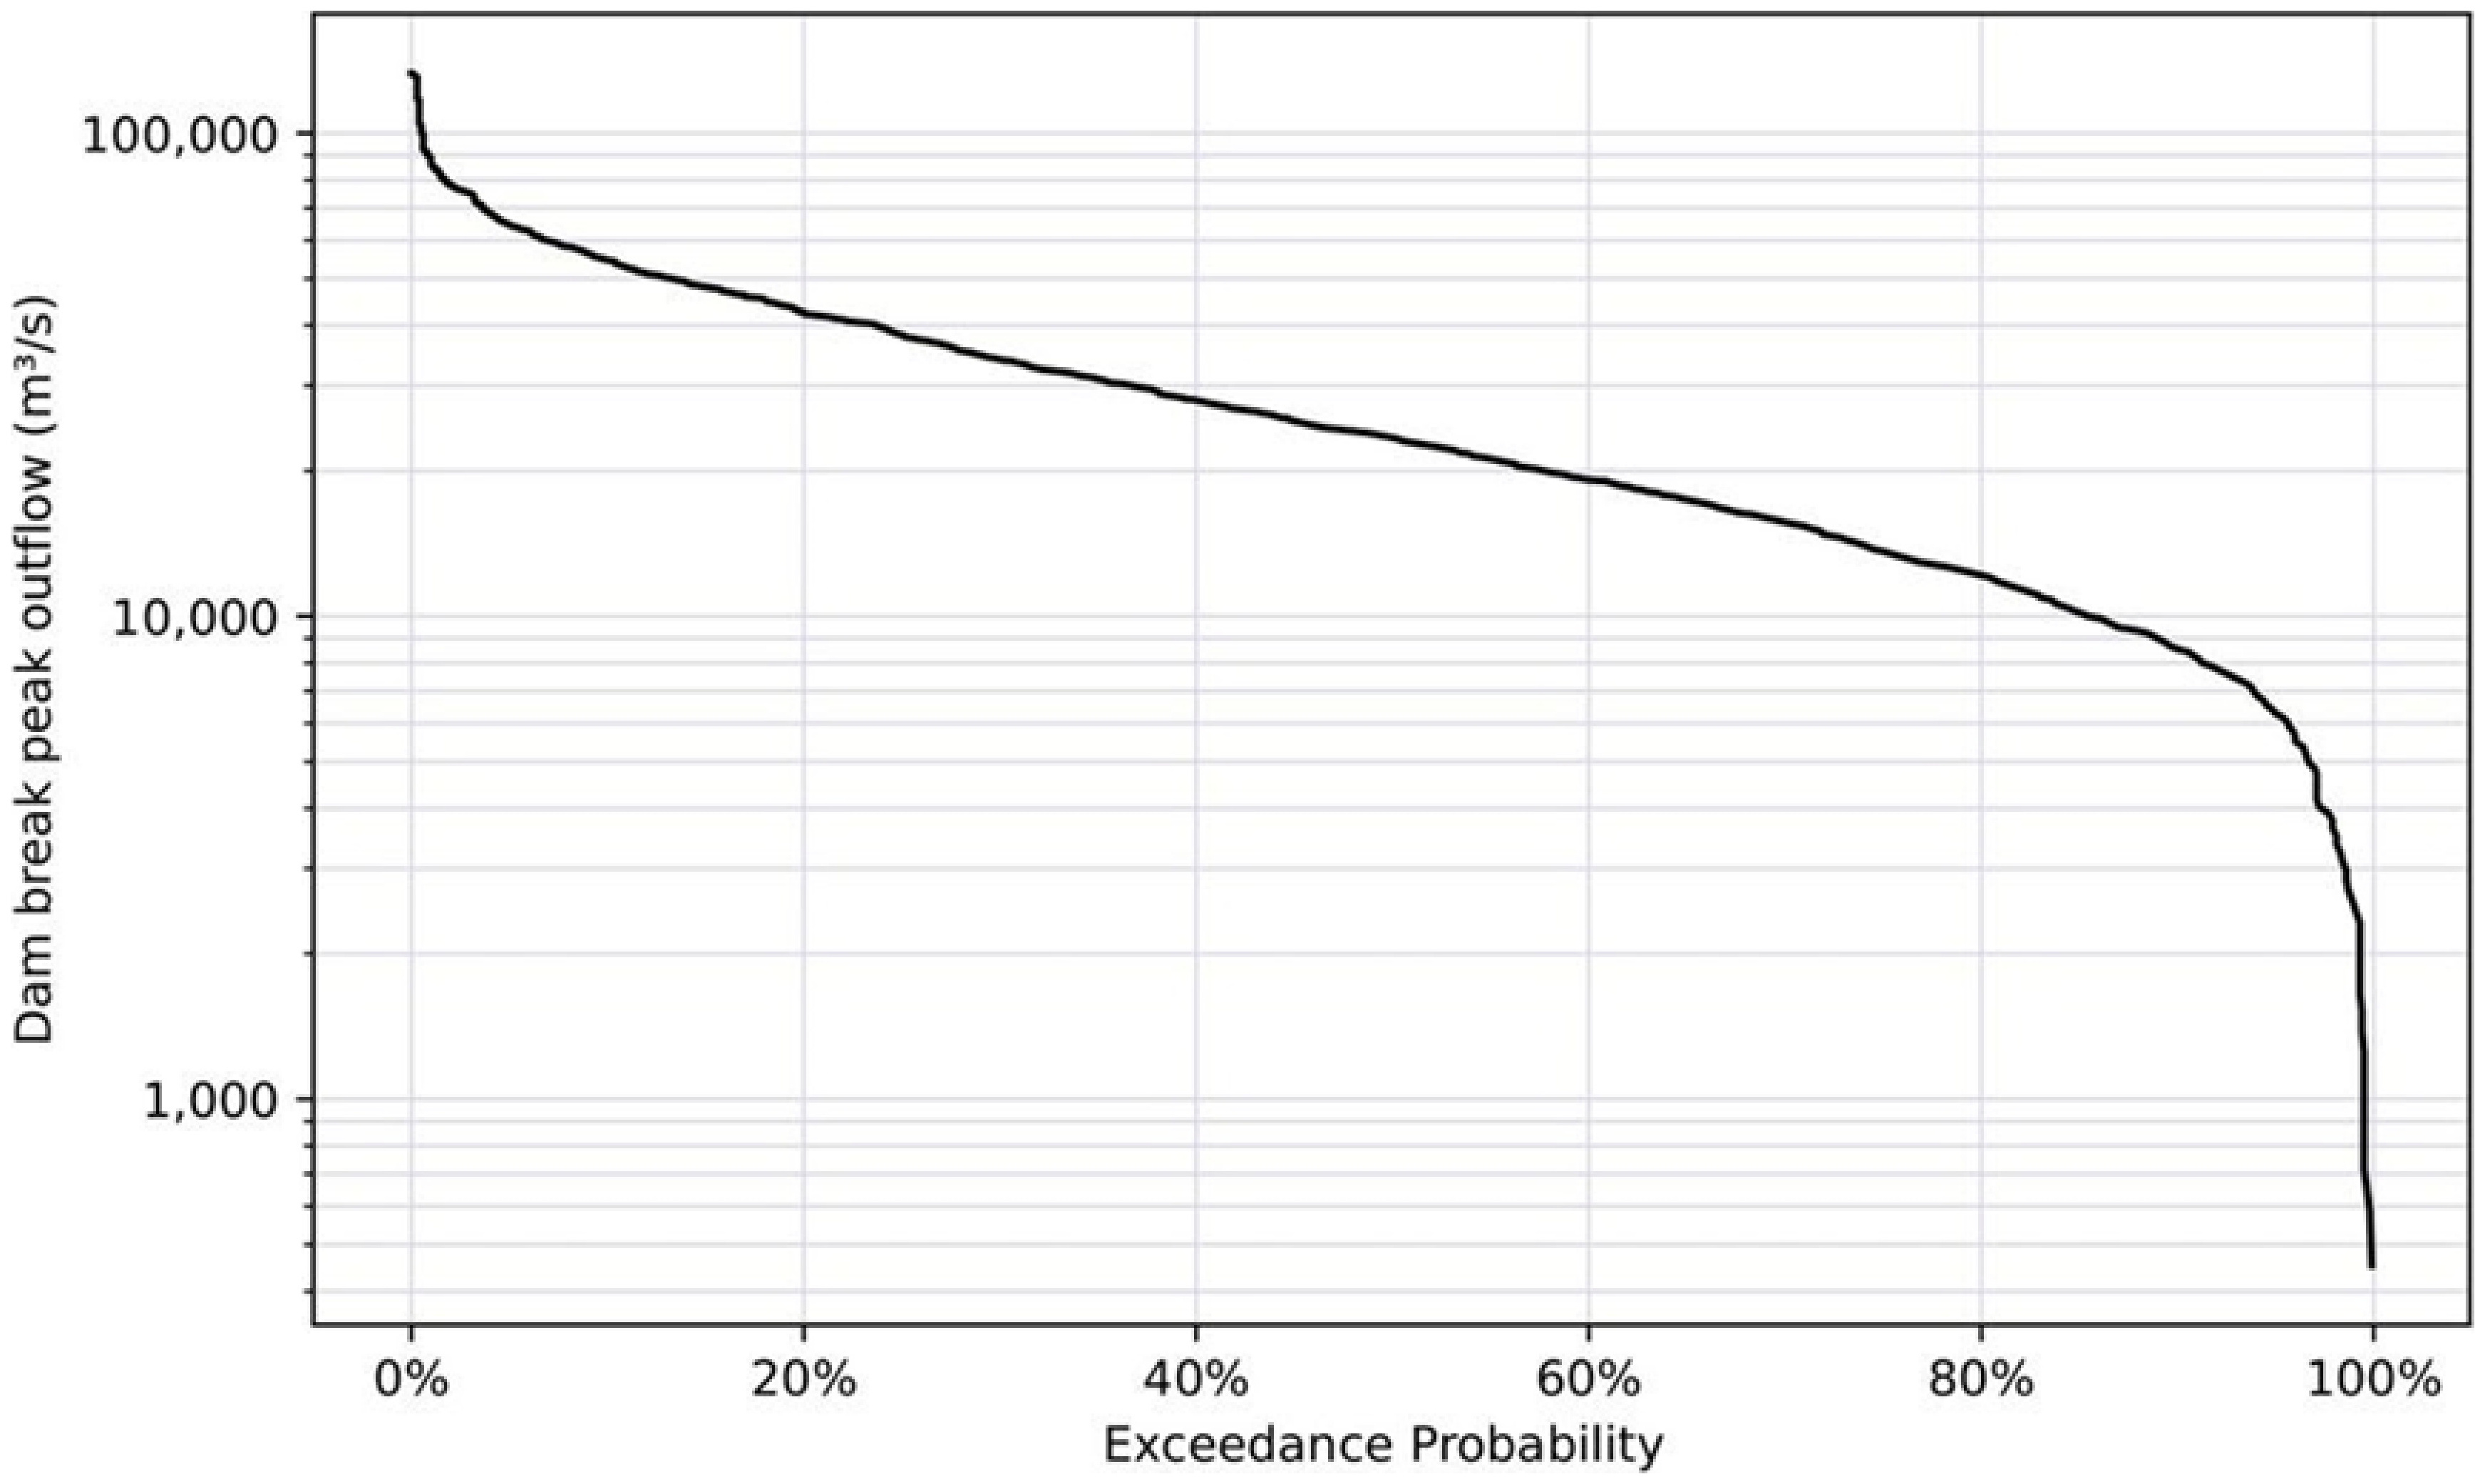
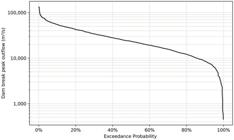
In I-PFM, peak outflow exceedance probabilities were estimated over the 1,000 dambreach hydrographs simulated using the truncated model (Figure 7). Dam-breach hydrographs related to 1%, 10%, 25%, 50%, 75% and 90% exceedance probabilities were selected for the hydrodynamic propagation and flood map in the downstream valley. These hydrographs were chosen based exclusively on the dam-breach peak outflow, as demonstrated in studies applying I-PFM (Silva & Eleutério, 2023; El Bilali et al., 2022; Goodell et al., 2018; McCann Junior & Paxson, 2016).
In D-PFM, the probability of flooding in each cell of the study area was determined by applying Equation 1 over the 1,000 flood maps directly simulated considering the full hydrodynamic model:
in which i represents the model cell index, n is the MCS total number, f(i,j) represents the simulation result (i.e., 1 = inundated cell, 0 = dry cell) for cell i and j simulation.
Evaluation and comparison metrics
To ensure a consistent and objective comparison between the probabilistic flood-mapping approaches, the results obtained with I-PFM and D-PFM were evaluated using both spatially distributed and local-based analyses. The evaluation considered three primary hydraulic variables: flood extent, water depth, and arrival time.
At the spatial scale, flood extents and water depths derived from both approaches were compared for each exceedance probability using the relative difference in inundated area () and by computing cell-by-cell differences between the corresponding D-PFM and I-PFM maps. These comparisons allowed the identification of systematic spatial patterns and discrepancies between the two probabilistic frameworks.
At the local scale, the analysis focused on selected reference points distributed along the floodplain to provide a more detailed assessment of how both methods reproduced the temporal and hydraulic characteristics of flooding. For these points, relative differences in flow depth and arrival time were computed for all selected exceedance probabilities, enabling a direct comparison of the probabilistic outcomes generated by each approach.
Finally, to investigate the influence of hydrograph equifinality observed in the I-PFM results, a dedicated analysis was conducted using the D-PFM simulations as reference. The D-PFM results were first ranked according to dam-breach peak outflow. When the correlation between a hydraulic variable (e.g., water depth or arrival time) and peak discharge is strong, the corresponding scatter plot tends to be narrow and well-defined; conversely, weaker correlations result in more dispersed plots, indicating reduced predictive consistency. Based on this principle, D-PFM simulations with peak discharges within ±2.5% of the I-PFM reference values were selected, and descriptive statistics (minimum, maximum, mean, standard deviation, range, and coefficient of variation) were computed. Greater dispersion in these statistics reflects the inherent limitation of I-PFM in probabilistically representing downstream hydraulic responses, particularly under conditions affected by equifinality.
This comprehensive evaluation framework enabled the identification of systematic deviations between the two probabilistic approaches and provided a robust basis for assessing their relative consistency and computational efficiency.
RESULTS AND DISCUSSION
Spatial analysis
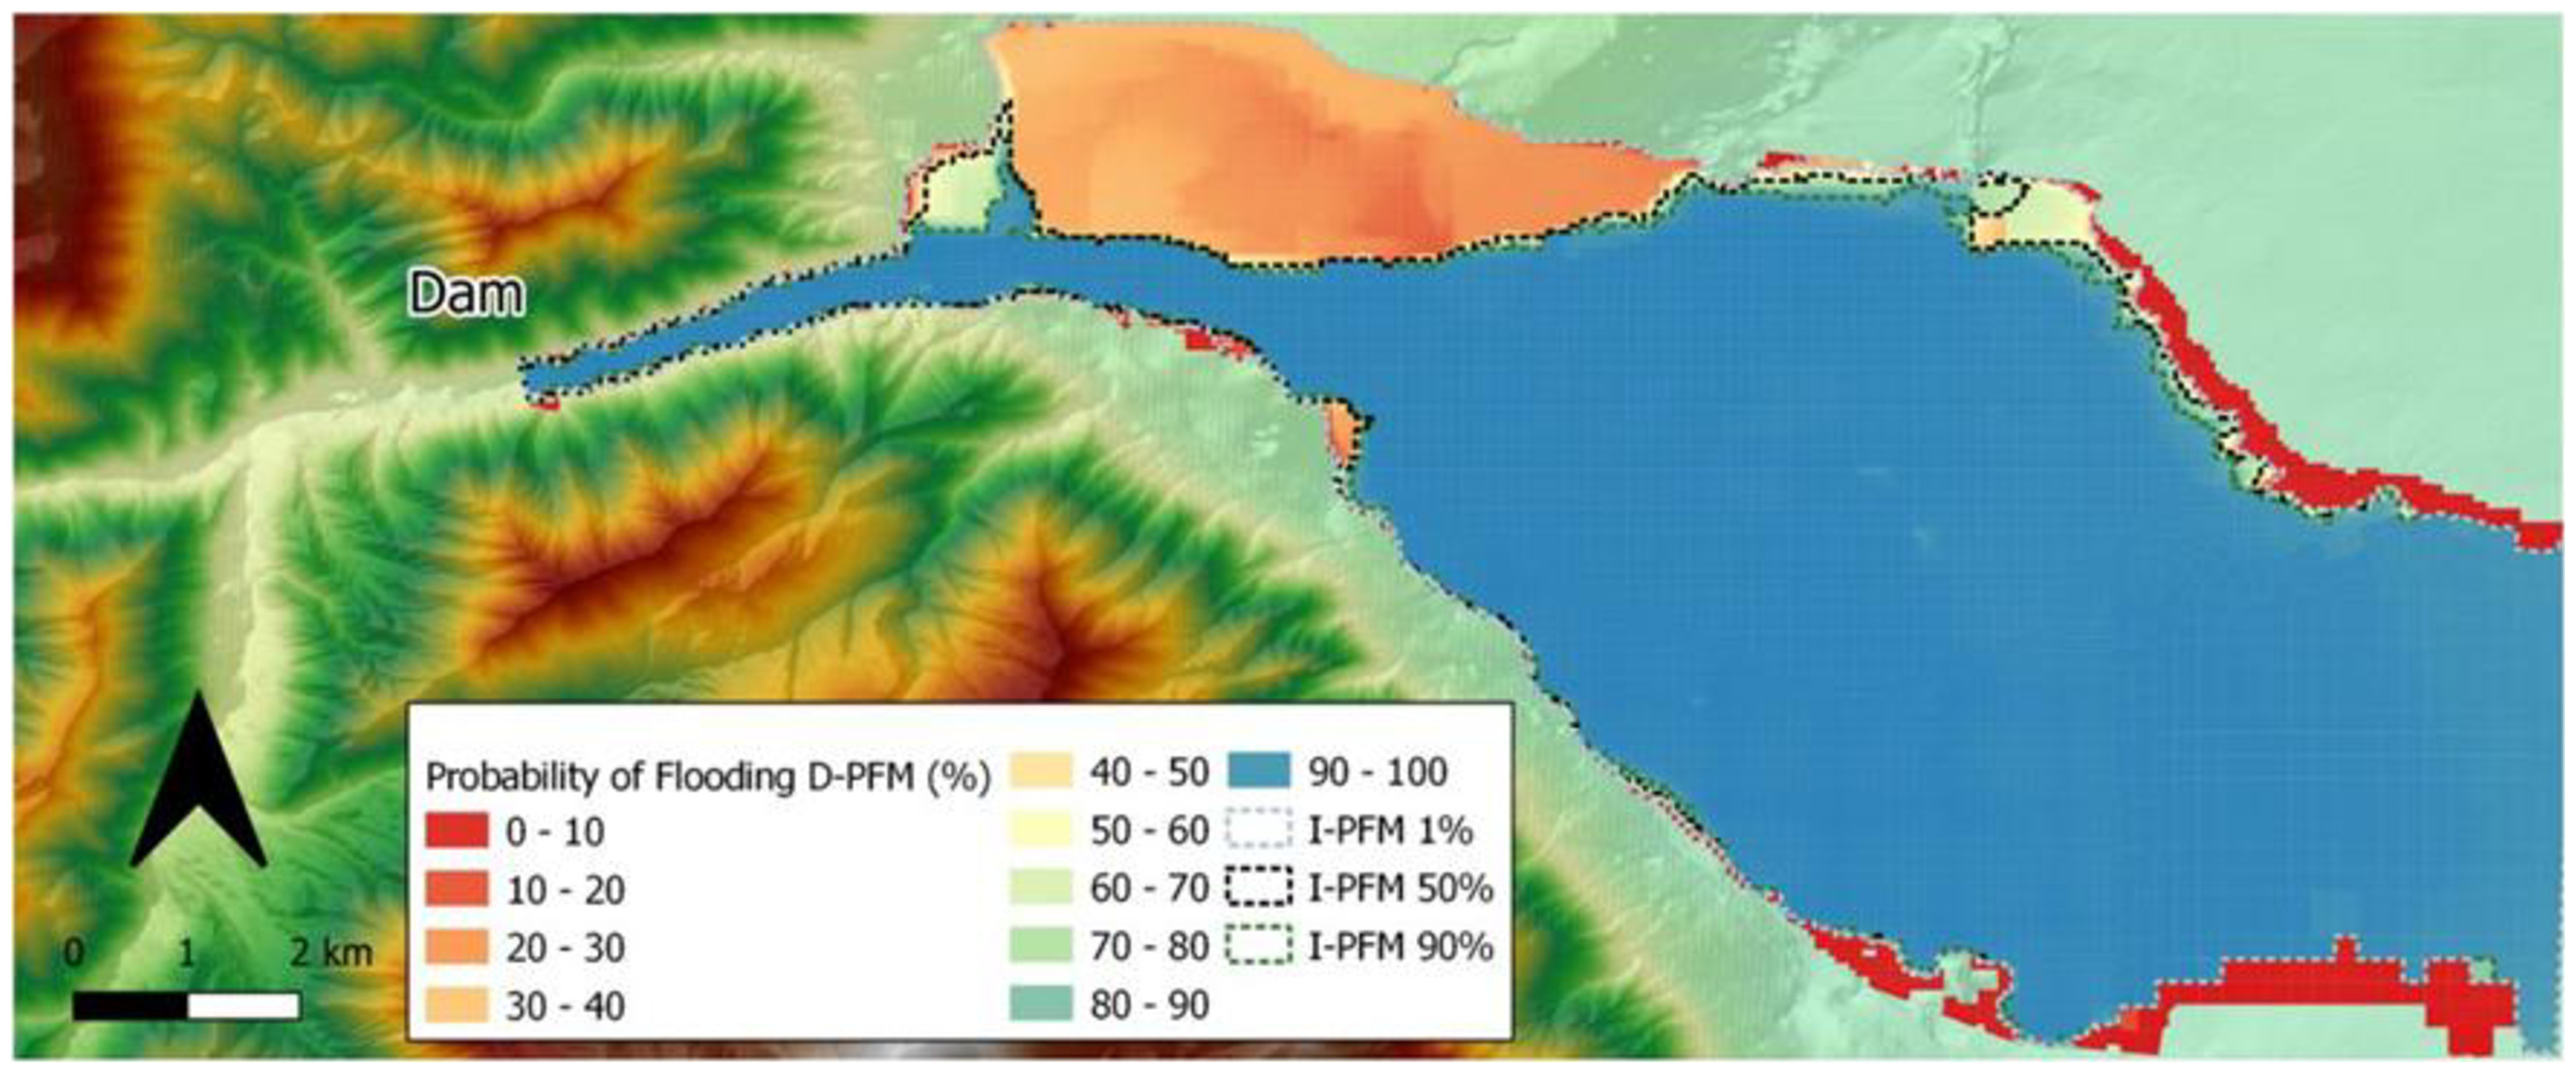
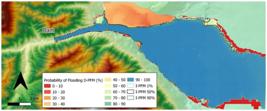
Firstly, flood maps produced with both methods, D-PFM and I-PFM, were compared thorough spatial analyses. They were performed for investigating the differences over the whole flooded areas associated with different exceedance probabilities, by comparing flood extents. The probabilistic flood map (Figure 8) determined using D-PFM shows a large flood area with probabilities ranging from 80% to 100%. A portion of the urban area, located on the left bank floodplain, exhibits reduced flood probabilities (0-50%), indicating that this area is less likely to flood. This result is similar to the findings of Altinakar et al. (2013), which conducted 120 simulations combining variations of Manning's roughness coefficient, breach width and breach formation time using base scenarios estimated through Froehlich's equations (Froehlich, 1995).
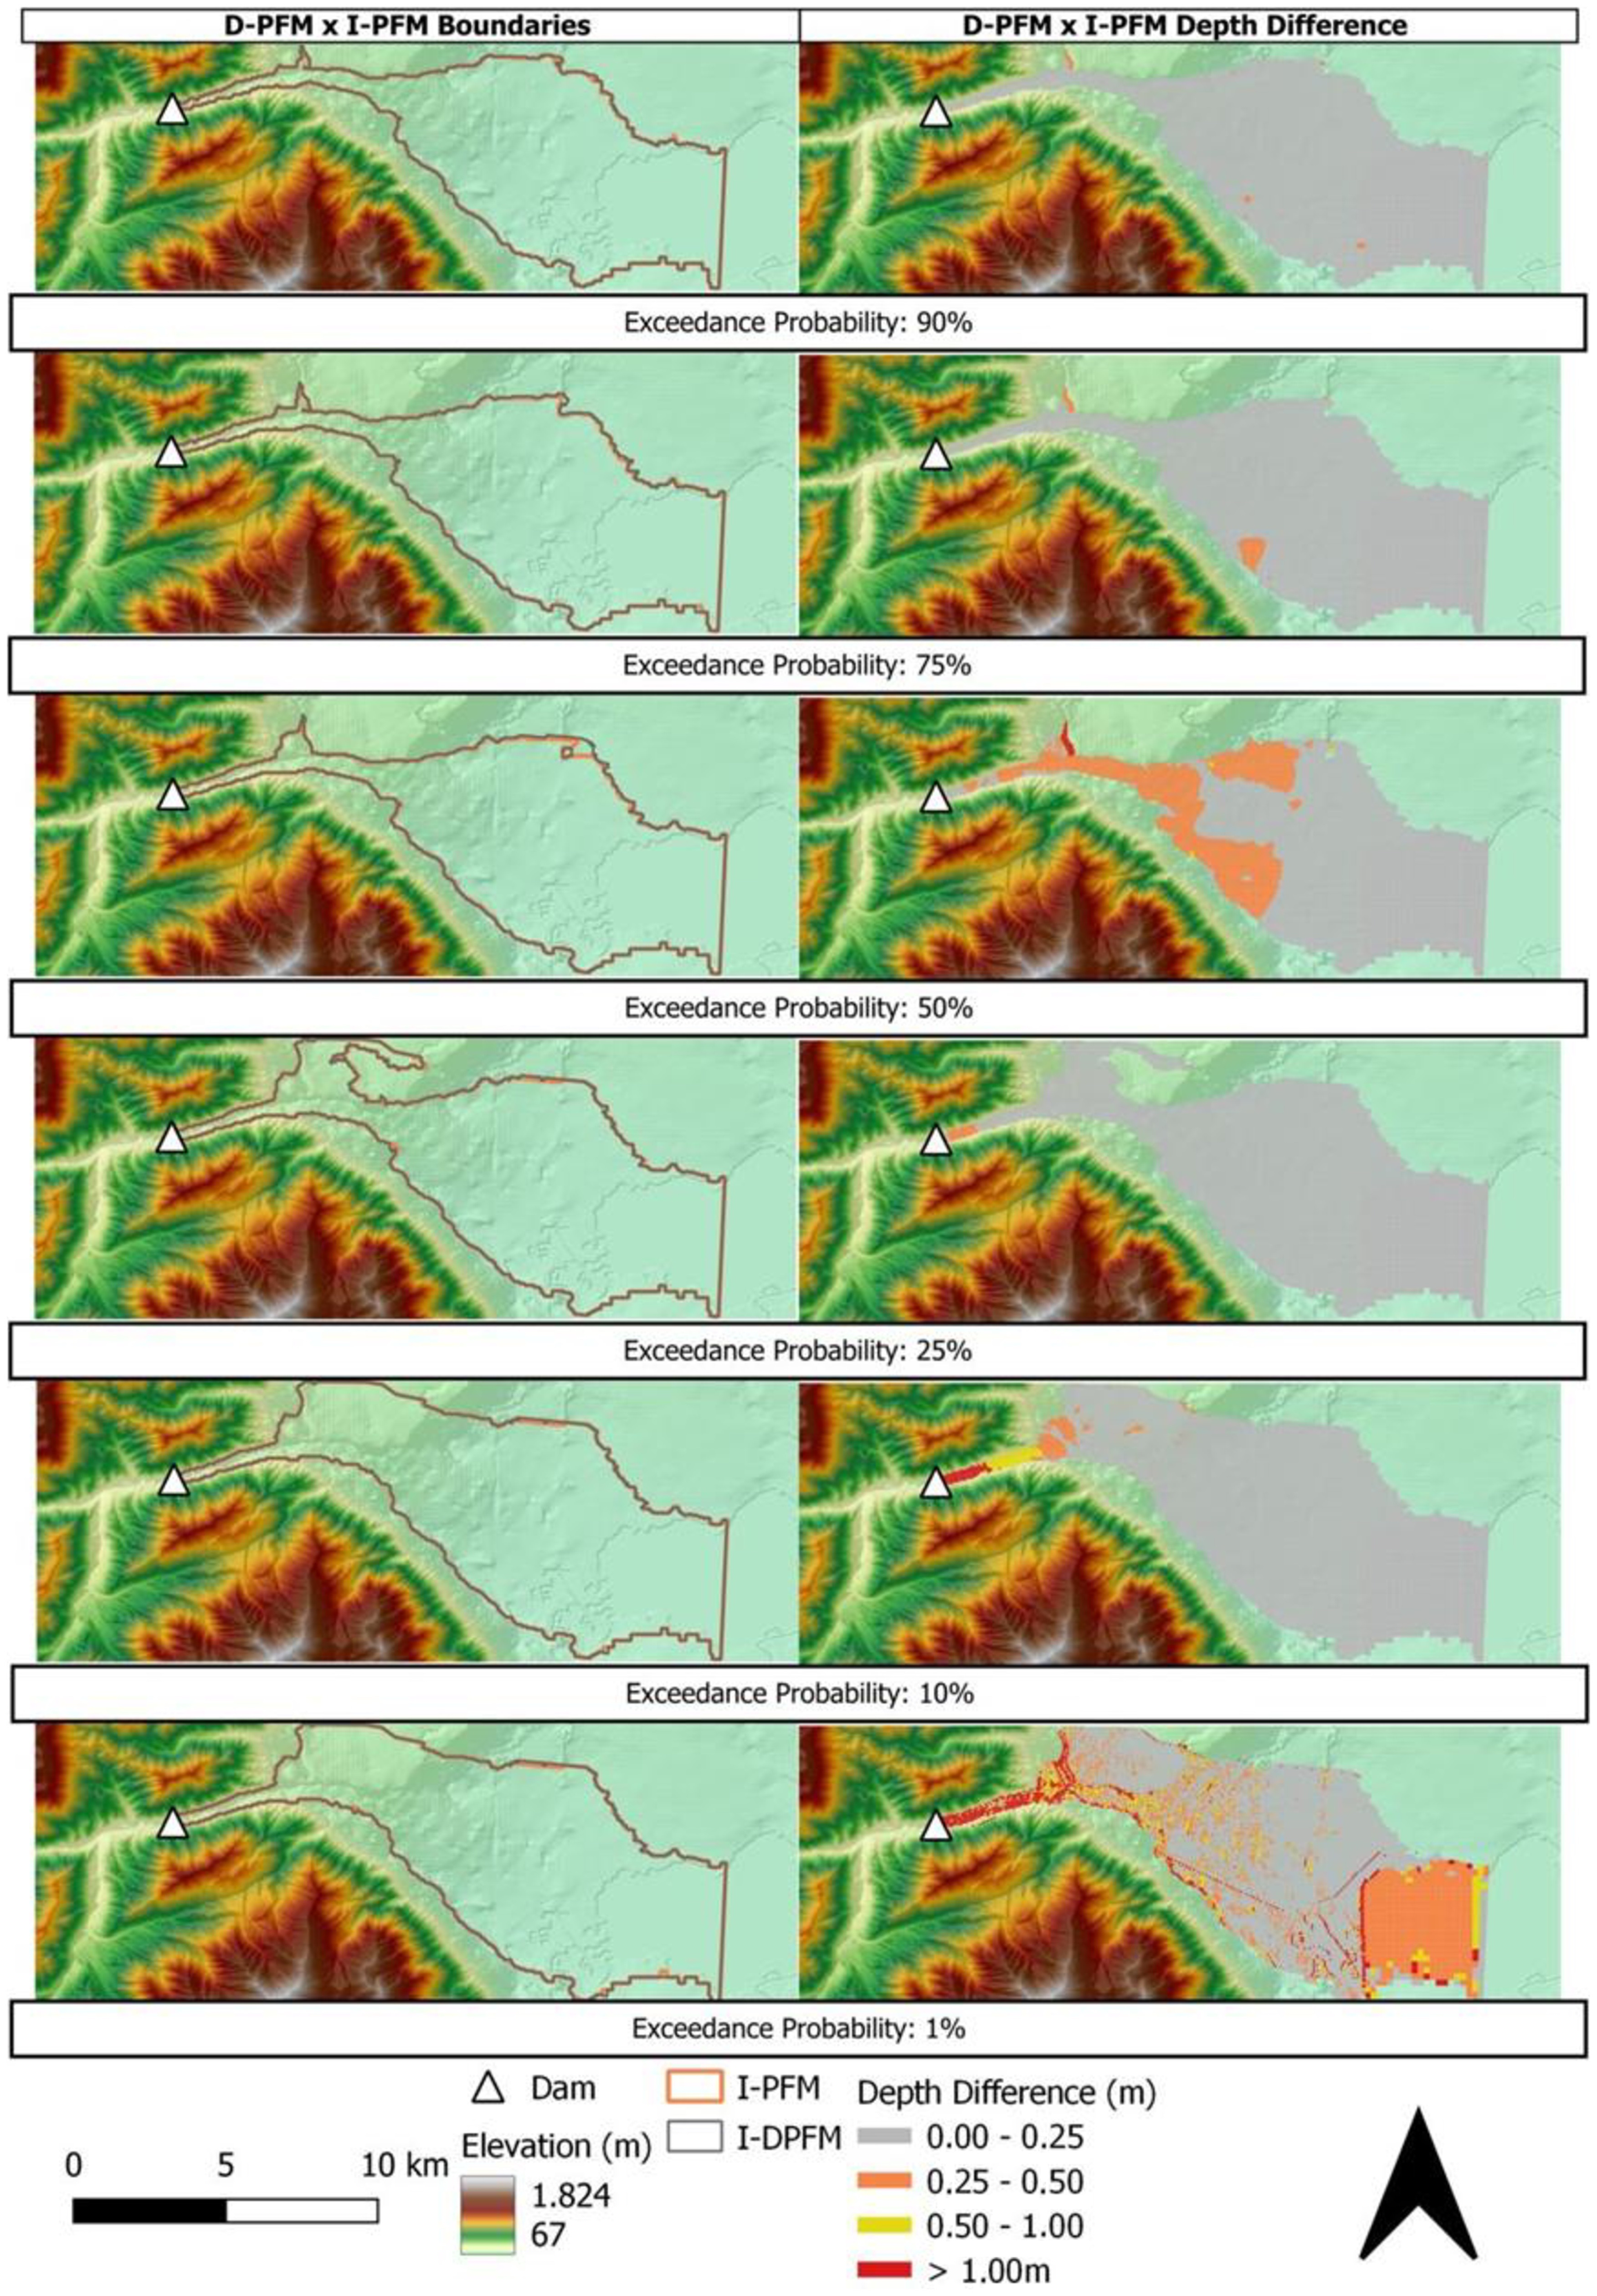
Despite the fact that I-PFM does not enable the full construction of a probabilistic flood map once frequency distributions are not known in each mesh cell, the flood areas simulated by each method were compared considering the exceedance probabilities of 90%, 50% and 1% (Figure 9). Small variations were observed by comparing the inundated areas obtained through both methodologies, I-PFM and D-PFM (Figure 9). In I-PFM, simulated flood areas ranged from 59.93 to 69.98 km2, while in D-PFM, simulated flood areas ranged from 59.17 to 69.70 km2. The comparison indicated variations ranging from 0.05 km2 (0.07%) to 0.76 km2 (1.27%). The greatest variation was identified in simulated flood areas associated with a 50% exceedance probability.
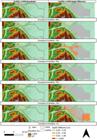
Inundated areas corresponding to exceedance probabilities of 1%, 10%, 25%, 50%, 75% and 90% (left), depth difference between D-PFM and I-PFM (right).
Both probabilistic frameworks showed strong agreement in reproducing flood extents, with differences in total inundated area remaining below 2% (Figure 9). Therefore, both methods can be considered equally effective for mapping flood extents across varying exceedance probabilities. From a computational perspective, simulations performed using the truncated configuration (I-PFM) were on average 5.5 times faster than those using the full hydrodynamic domain (D-PFM).
Nonetheless, local discrepancies were observed, particularly for events with exceedance probabilities of 10% and 1%, where differences in maximum water depth exceeded 1 m within the confined valley immediately downstream of the dam (Figure 9). Since the I-PFM method relies solely on a probabilistic hydrograph based on dam-breach peak outflow, identifying the main causes of these discrepancies is challenging, as other factors such as peak timing and mobilized volume are not considered.
Local analysis
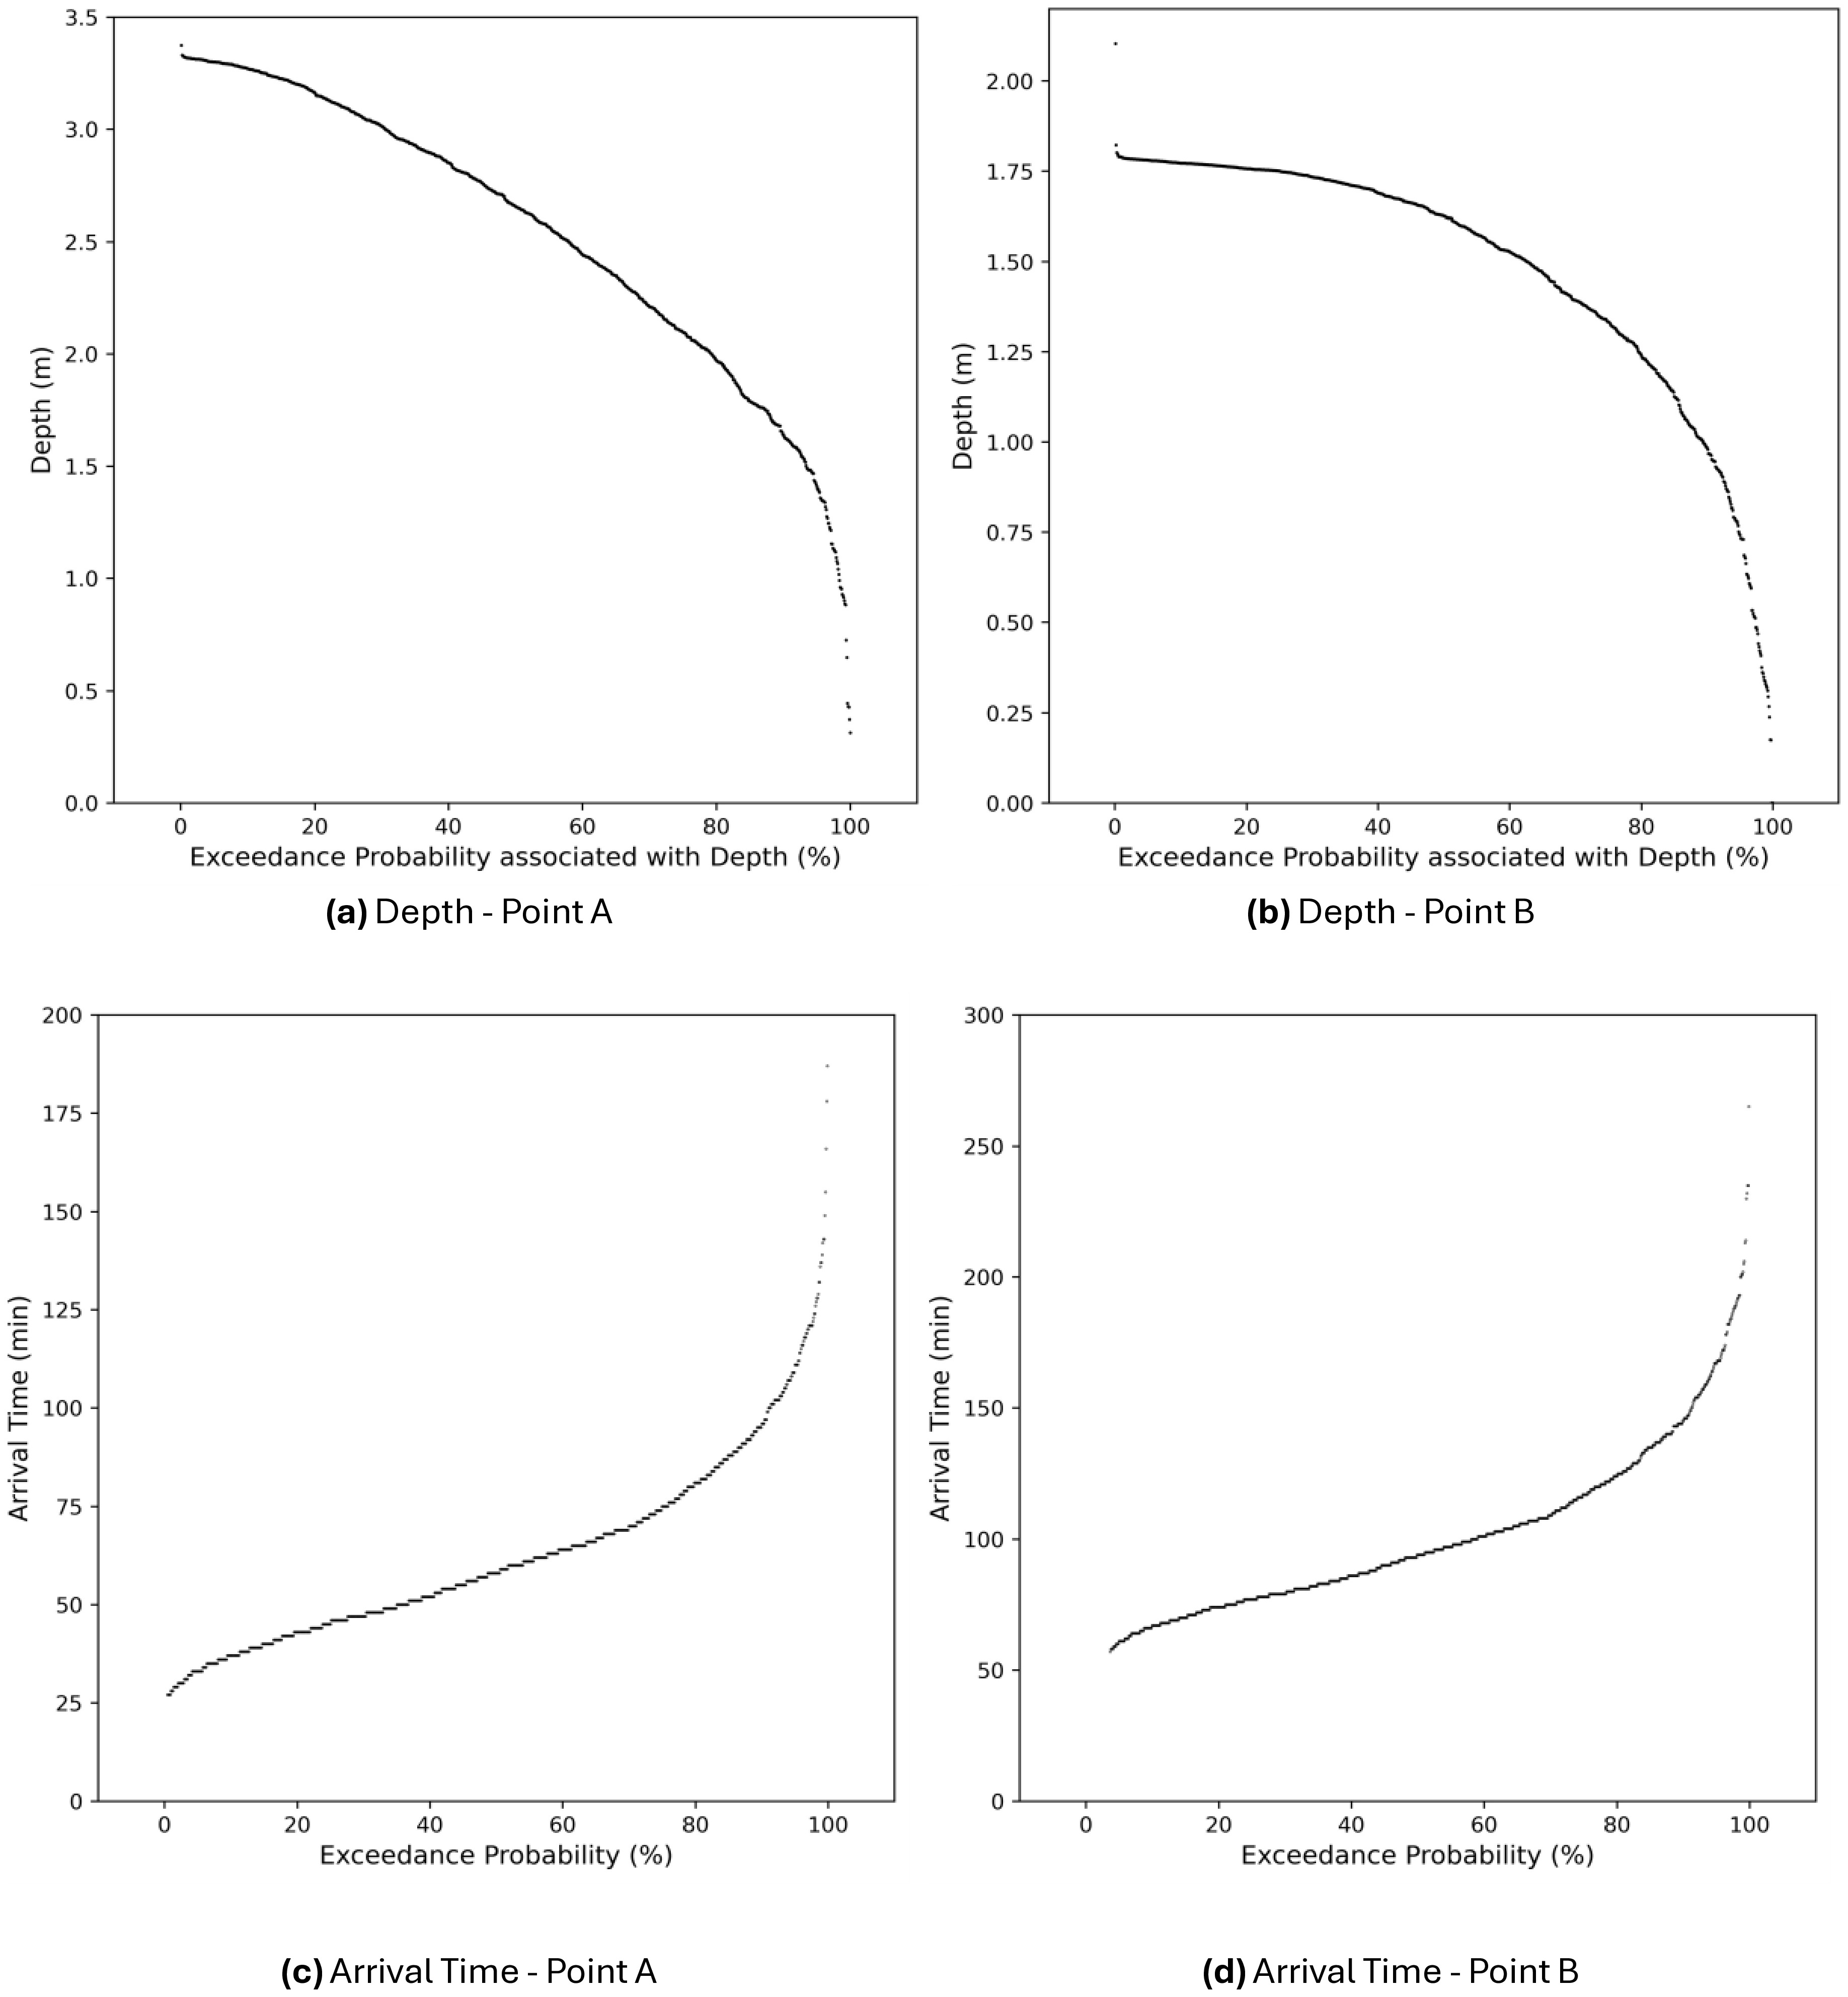
The findings obtained for D-PFM at Point A, highlight the extensive variability of results when considering different combinations of breach parameters (Figure 10). Point A displayed flow depths ranging from 0.31 to 3.37 m (CV=24.80%), and flood wave arrival times varying from 27 to 187 minutes (CV=38.27%). At Point B, variations in flow depth ranged from 0.00 to 2.10 m (CV=23.70%), and flood wave arrival times ranged from 57 to 265 minutes (CV=31.63%).

Flood depths and arrival time associated with exceedance probabilities: Point A and Point B.
Comparing flood depths and arrival times obtained from D-PFM with results from I-PFM under equivalent exceedance probabilities, variations range from 0.02 m (1%) to 0.24 m (14.7%) in flood depths, and from 2 min (3%) to 34 min (36%) in arrival times (Table 4). The greatest variations were associated with the intermediate exceedance probabilities, between 50% and 90%. In most cases, I-PFM tends to underestimate flood depths and arrival times compared to D-PFM, which provides a more comprehensive understanding of parameter variability.
Despite these great differences, variations between I-PFM and D-PFM flood depths were significantly lower (<3%) for exceedance probabilities of 1% and 10% compared to higher variations (<15%) for exceedance probabilities of 50% and 90%. Therefore, I-PFM may serve as a practical tool for more restrictive risk management approaches but may not be suitable for comprehensive risk management where results across different exceedance probability ranges are needed.
The hydrograph equifinality issue previously noted by Silva & Eleutério (2023) was further investigated in this study. In their work, the authors briefly identified the occurrence of similar dam-breach peak outflows generated from different breach geometries, based on a few isolated examples of simulated hydrographs, and emphasized the need for a more comprehensive analysis of this phenomenon. Based on that preliminary evidence, the present study expands the analysis to systematically assess equifinality across all exceedance probabilities and to evaluate how such uncertainty propagates to downstream hydrodynamic results.
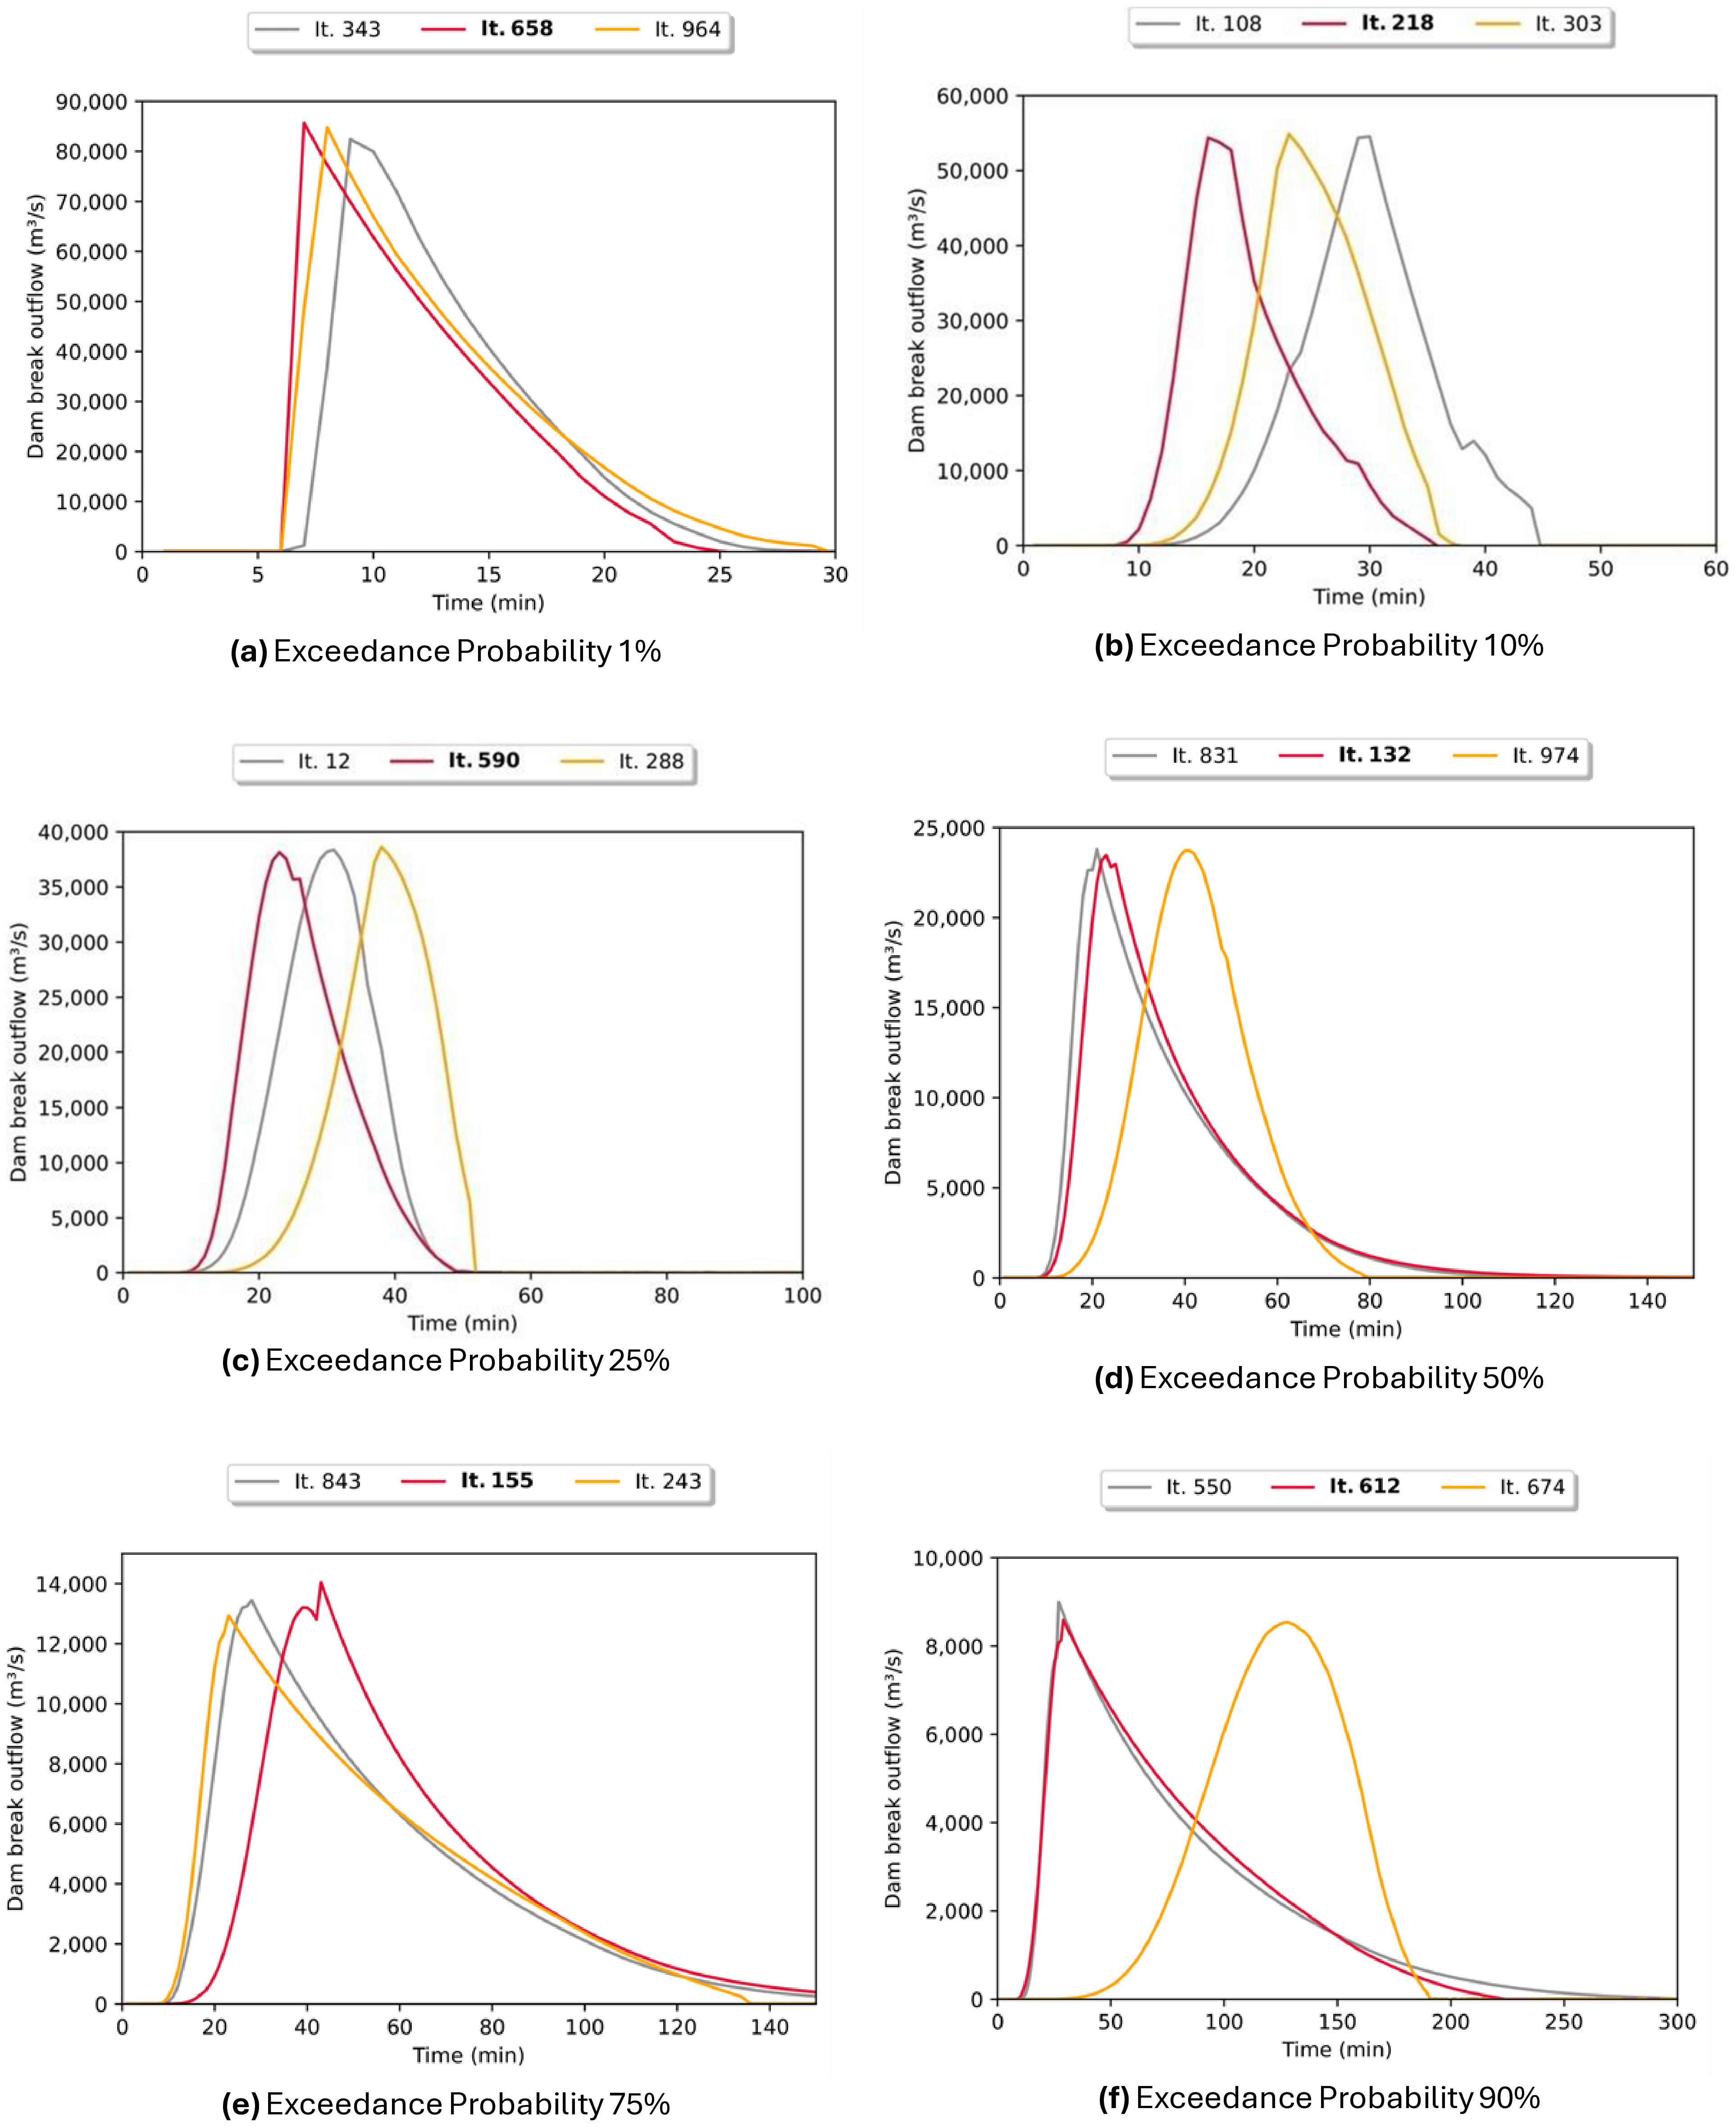
The results revealed that dam-breach hydrographs with substantial differences in peak time (36%–218%) but similar peak outflows (0.5%–2.5%) were generated from different combinations of breach parameters for the six reference exceedance probabilities analyzed (90%, 75%, 50%, 25%, 10%, and 1%) (Figure 11). In each graph, the reference hydrograph used in the I-PFM is shown in red, and the corresponding iteration label is highlighted in bold.
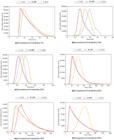
Equifinality issue illustrated by different hydrographs with similar dam-breach peak outflow resulting from different iterations (it.). Bold labels indicate iterations selected in I-PFM.
This behavior can be explained by the compensatory influence of different breach parameters on the resulting hydrograph. For instance, a combination characterized by a shorter breach formation time (e.g., 30 min) and a smaller final breach area (i.e., narrower width, lower height, and steeper side slopes) may produce a similar peak discharge to that generated by a slower breach development (e.g., 2 h) associated with a larger final breach area. When such compensating relationships occur, distinct hydrograph shapes can yield nearly identical peak discharges. The consistent manifestation of this behavior across all exceedance-probability ranges—from low to extreme events— highlights one of the main limitations of the I-PFM approach: its reliance on peak discharge as the sole variable linking probabilistic exceedance to downstream flood response. Consequently, this framework does not capture the temporal variability of dam-breach hydrographs, limiting its ability to accurately propagate probabilistic uncertainty to hydrodynamic results in the downstream valley.
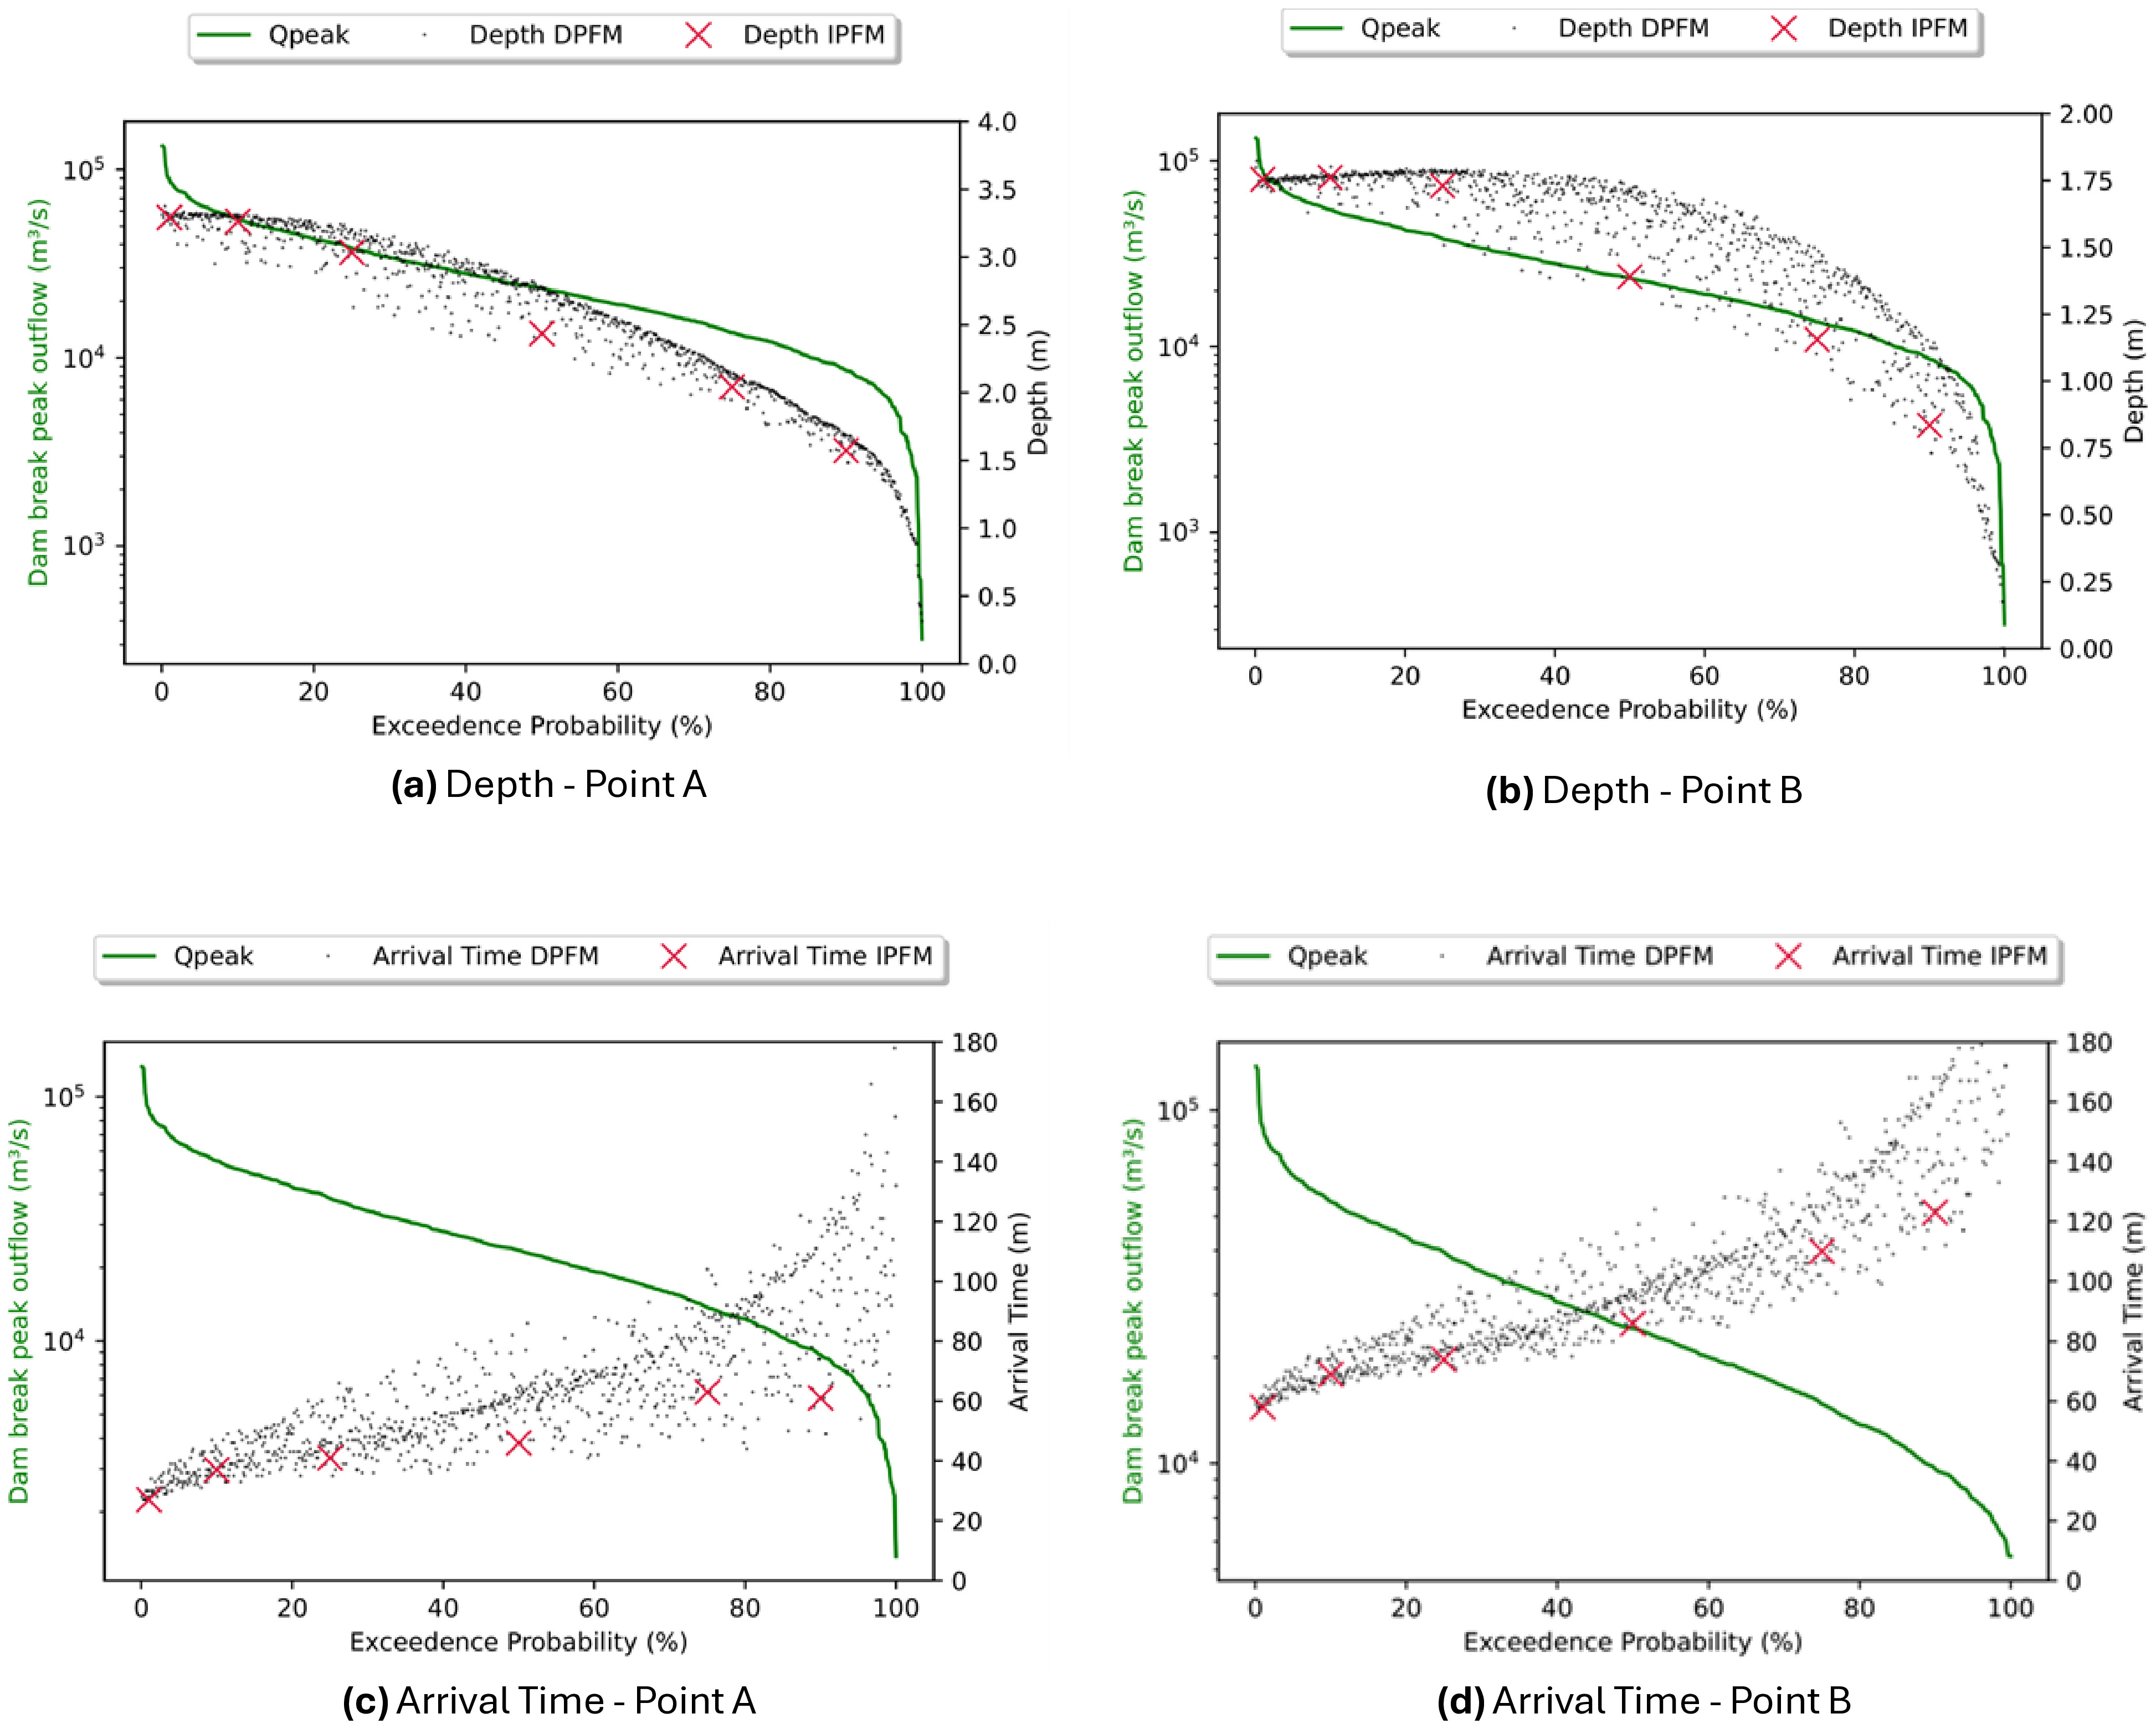
To compare flood depths and flood arrival times obtained with both methodologies, the frequency curve of dam-breach peak outflow (Figure 7) was plotted alongside its respective flood depths and flood arrival times simulated at Point A and Point B (Figure 12). In Figure 12, a narrower scatter plot indicates that similar dam-breach peak outflows lead to similar results in the downstream valley for flood depths and arrival times.
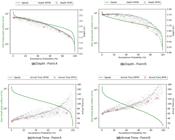
Flood depths and flood wave arrival time associated with exceedance probabilities for Point A and Point B.
Conversely, a wider scatter plot suggests that other variables, such as dam-breach peak time, should also be considered to evaluate probabilistic results in the downstream valley. Additionally, red marks in Figure 12 represent the results obtained from I-PFM for the exceedance probabilities of 50%, 25%, 10% and 1%. We highlight that, in some cases, I-PFM results (red marks) fall within regions where D-PFM shows greater variation, while in other cases, I-PFM results are situated where D-PFM exhibits less variation.
To examine more precisely the variation in flow depths and flood arrival times at Points A and B, considering dam-breach peak outflows similar to those used in I-PFM, a range of dam-breach peak outflows varying ±2.5% from the I-PFM values was selected. The respective flood depths and flood arrival times were collected to produce descriptive statistics shown in Table 5.
As presented in Table 5, the data dispersion was greater for the more frequent exceedance probabilities (50%, 75%, and 90%), with coefficient of variation (CV) values ranging from 4% to 13% for flow depths and from 8% to 23% for the arrival time. For the more extreme exceedance probabilities (1% and 10%), the degree of dispersion was lower, limited to 4% for flow depths and 12% for arrival times.
CONCLUSIONS
This study presented a comparative analysis between two probabilistic flood-mapping approaches applied to dam-breach scenarios: the Indirect Probabilistic Flood Mapping (I-PFM), which relies on truncated hydrodynamic models, and the Direct Probabilistic Flood Mapping (D-PFM), which uses full-domain hydrodynamic simulations. Both algorithms developed in this research are freely available on GitHub, promoting accessibility and reproducibility.
The two probabilistic approaches produced very similar flood extents, with differences in total inundated area remaining below 2% across the analyzed exceedance probabilities. This indicates that both frameworks are capable of consistently representing the spatial limits of flooding under dam-breach conditions.
However, relevant differences emerged in the representation of local hydraulic variables. By propagating uncertainty throughout the entire hydrodynamic domain, the D-PFM simulations showed that uncertainties associated with dam-breach parameters lead to variations of approximately 25% in flow depth and 40% in flood-wave arrival time at the analyzed locations. In contrast, the I-PFM approach, which represents this uncertainty only indirectly, showed limitations in capturing the variability of hydraulic conditions at specific locations. Differences of up to 14% in flow depth and 35% in flood-wave arrival time were observed when comparing the two approaches.
These findings highlight a clear trade-off between computational efficiency and hydraulic detail. The I-PFM approach represents a computationally efficient alternative for probabilistic mapping of flood extents, making it suitable for regional flood-hazard assessments or preliminary risk zoning. Conversely, the D-PFM framework is more appropriate for applications that require detailed hydraulic information, such as evacuation planning, damage estimation, and loss-of-life assessments, where accurate representation of flood depth and arrival time is critical.
Future research should focus on improving the I-PFM framework by incorporating additional dam-breach parameters beyond peak outflow in order to better represent breach-formation variability while maintaining computational efficiency.
DATA AVAILABILITY STATEMENT
Research data is only available upon request.
ACKNOWLEDGEMENTS
The authors thank the Brazilian research foundations and agencies CAPES.
REFERENCES
- Altinakar, M., McGrath, M., Ramalingam, V., Seda-Sanabria, Y., & Matheu, E. (2013). Uncertainty in two-dimensional dam-break flood modeling and consequence analysis. In 12th International Benchmark Workshop on Numerical Analysis of Dams (pp. 255-270), Graz, Austria. International Commission on Large Dams.
-
Bello, D., Alcayaga, H., Caamaño, D., & Pizarro, A. (2022). Influence of dam breach parameter statistical definition on resulting rupture maximum discharge. Water, 14(11), 1776. https://doi.org/10.3390/w14111776
» https://doi.org/10.3390/w14111776 -
Bellos, V., Tsakiris, V. K., Kopsiaftis, G., & Tsakiris, G. (2020). Propagating dam breach parametric uncertainty in a river reach using the HEC-RAS software. Hydrology, 7(4), 4. https://doi.org/10.3390/hydrology7040072
» https://doi.org/10.3390/hydrology7040072 - Bernard-Garcia, M., & Mahdi, T.-F. (2020). A worldwide historical dam failures database Montréal: Borealis. https://doi.org/10.5683/SP2/E7Z09B.
-
Beven, K., Lamb, R., Leedal, D., & Hunter, N. (2015). Communicating uncertainty in flood inundation mapping: a case study. International Journal of River Basin Management, 13(3), 3. https://doi.org/10.1080/15715124.2014.917318
» https://doi.org/10.1080/15715124.2014.917318 - Brunner, G. W. (2021a). HEC-RAS 2D modeling user’s manual, CPD-68A. Washington, D.C.: U.S. Army Corps of Engineers.
- Brunner, G. W. (2021b). HEC-RAS 6.0 hydraulic reference manual. Washington, D.C.: U.S. Army Corps of Engineers.
-
Candela, A., & Aronica, G. T. (2017). Probabilistic flood hazard mapping using bivariate analysis based on copulas. ASCE-ASME Journal of Risk and Uncertainty in Engineering Systems. Part A, Civil Engineering, 3(1), 1. https://doi.org/10.1061/AJRUA6.0000883
» https://doi.org/10.1061/AJRUA6.0000883 - Davison, M., Hassan, M., Gimeno, O., Van Damme, M., & Goff, C. (2013). Risk assessment for hypothetical dam break a method for the rapid and consistent evaluation. In ICOLD - 12th International Benchmark Workshop on Numerical Analysis of Dams (pp. 241-254). International Commission on Large Dam.
-
El Bilali, E. L., Taleb, I., Nafii, A., & Taleb, A. (2022). A practical probabilistic approach for simulating life loss in an urban area associated with a dam-break flood. International Journal of Disaster Risk Reduction, 76, 103011. https://doi.org/10.1016/j.ijdrr.2022.103011
» https://doi.org/10.1016/j.ijdrr.2022.103011 - Federal Emergency Management Agency – FEMA. (2013). Federal guidelines for inundation mapping of flood risks associated with dam incidents and failures. Washington, D.C.
- Federal Energy Regulatory Commission – FERC. (2015). Engineering guidelines for the evaluation of hydropower projects: selecting and accommodating inflow design floods for dams (Chap. 2). Washington, D.C.
-
Froehlich, D. (1995). Peak outflow from breached embankment dam. Journal of Water Resources Planning and Management, 121(1), 1. https://doi.org/10.1061/(ASCE)0733-9496(1995)121:1(90)
» https://doi.org/10.1061/(ASCE)0733-9496(1995)121:1(90) -
Froehlich, D. (2008). Embankment dam breach parameters and their uncertainties. Journal of Hydraulic Engineering, 134(12), 12. https://doi.org/10.1061/(ASCE)0733-9429(2008)134:12(1708)
» https://doi.org/10.1061/(ASCE)0733-9429(2008)134:12(1708) -
Froehlich, D. (2016). Empirical model of embankment dam breaching. River Flow, 2016, 1821-1826. https://doi.org/10.1201/9781315644479-285
» https://doi.org/10.1201/9781315644479-285 - Goodell, C. (2014). Breaking the HEC-RAS code: a user’s guide to automating HEC-RAS. Portland: H2ls.
- Goodell, C., Raeburn, R., Karki, A., Johnson, A., Monk, S., & Lee, A. (2018). Probabilistic dam breach modeling using HEC-RAS and MCBreach (11 p.). Miami: United States Society on Dams.
-
Kheradmand, S., Seidou, O., Konte, D., & Barmou Batoure, M. B. (2018). Evaluation of adaptation options to flood risk in a probabilistic framework. Journal of Hydrology. Regional Studies, 19, 1-16. https://doi.org/10.1016/j.ejrh.2018.07.001
» https://doi.org/10.1016/j.ejrh.2018.07.001 -
Kim, B., & Sanders, B. F. (2016). Dam-break flood model uncertainty assessment: case study of extreme flooding with multiple dam failures in Gangneung, South Korea. Journal of Hydraulic Engineering (New York, N.Y.), 142(5), 5. https://doi.org/10.1061/(ASCE)HY.1943-7900.0001097
» https://doi.org/10.1061/(ASCE)HY.1943-7900.0001097 -
Kocaman, S., Güzel, H., Evangelista, S., Ozmen-Cagatay, H., & Viccione, G. (2020). Experimental and numerical analysis of a dam-break flow through different contraction geometries of the channel. Water, 12(4), 1124. https://doi.org/10.3390/w12041124
» https://doi.org/10.3390/w12041124 -
MacDonald, T. C., & Langridge‐Monopolis, J. (1984). Breaching charateristics of dam failures. Journal of Hydraulic Engineering, 110(5), 5. https://doi.org/10.1061/(ASCE)0733-9429(1984)110:5(567)
» https://doi.org/10.1061/(ASCE)0733-9429(1984)110:5(567) - Mancusi, L., Giosa, L., Cantisani, A., Sole, A., & Albano, R. (2013). Risk assessment for hypothetical dam break a method for the rapid and consistent evaluation. In ICOLD - 12th International Benchmark Workshop on Numerical Analysis of Dams (pp. 271-281). International Commission on Large Dam.
-
McCann Junior, M. W., & Paxson, G. (2016). Uncertainty in dam failure consequence estimates. E3S Web of Conferences, 7, 11003. https://doi.org/10.1051/e3sconf/20160711003
» https://doi.org/10.1051/e3sconf/20160711003 - McVan, D., Ellis, J., Savant, G., & Jourdan, M. (2013). Risk assessment analysis of a hypothetical dam breach using adaptive finite element methods Adaptive Hydraulic Model, ADH (pp. 293-307). In ICOLD - 12th International Benchmark Workshop on Numerical Analysis of Dams (pp. 309-323). International Commission on Large Dam.
-
Melo, M., & Eleutério, J. (2023). Probabilistic analysis of floods from tailings dam failures: a method to analyze the impact of rheological parameters on the HEC-RAS Bingham and Herschel-Bulkley models. Water, 15(16), 2866. https://doi.org/10.3390/w15162866
» https://doi.org/10.3390/w15162866 -
Mohanty, M. P., & Simonovic, S. P. (2022). A comprehensive approach for floodplain mapping through identification of hazard using publicly available data sets over Canada. Water, 14(14), 2280. https://doi.org/10.3390/w14142280
» https://doi.org/10.3390/w14142280 -
Oubennaceur, K., Chokmani, K., Nastev, M., Tanguy, M., & Raymond, S. (2018). Uncertainty analysis of a two-dimensional hydraulic model. Water, 10(3), 3. https://doi.org/10.3390/w10030272
» https://doi.org/10.3390/w10030272 -
Papaioannou, G., Vasiliades, L., Loukas, A., & Aronica, G. T. (2017). Probabilistic flood inundation mapping at ungauged streams due to roughness coefficient uncertainty in hydraulic modelling. Advances in Geosciences, 44, 23-34. https://doi.org/10.5194/adgeo-44-23-2017
» https://doi.org/10.5194/adgeo-44-23-2017 - Saberi, O., Dorfmann, C., & Zenz, G. (2013). 2-D hydraulic modelling of a dam break scenario (pp. 283-292). Vienna: Austrian National Committee on Large Dams.
-
Silva, A. A. C. L., & Eleutério, J. C. (2023). Identifying and testing the probability distribution of earthfill dam breach parameters for probabilistic dam breach modeling. Journal of Flood Risk Management, 1(3), e12900. https://doi.org/10.1111/jfr3.12900
» https://doi.org/10.1111/jfr3.12900 -
Silva, I. T. C. E., Santos, H. A., Pereira, L. C. O., & Nascimento, K. S. D. (2024). Global sensitivity analysis in flood mapping using HEC-RAS 2D: effects of the floodplain manning coefficient for a dam-break case. Revista Brasileira de Recursos Hídricos, 29, e38. https://doi.org/10.1590/2318-0331.292420240032
» https://doi.org/10.1590/2318-0331.292420240032 -
Stephens, T. A., & Bledsoe, B. P. (2020). Probabilistic mapping of flood hazards: depicting uncertainty in streamflow, land use, and geomorphic adjustment. Anthropocene, 29, 100231. https://doi.org/10.1016/j.ancene.2019.100231
» https://doi.org/10.1016/j.ancene.2019.100231 - Thames, B., & Kalyanapu, J. (2013). Assessment of ICOLD benchmark case study using Flood2D-GPU and HEC-FIA. In ICOLD - 12th International Benchmark Workshop on Numerical Analysis of Dams (pp. 309-323). International Commission on Large Dams.
-
Tsai, C. W., Yeh, J.-J., & Huang, C.-H. (2019). Development of probabilistic inundation mapping for dam failure induced floods. Stochastic Environmental Research and Risk Assessment, 33(1), 91-100. https://doi.org/10.1007/s00477-018-1636-8
» https://doi.org/10.1007/s00477-018-1636-8 -
Von Ahn, B. D. S., & Manica, R. (2024). Dam-break due to overtopping failure: experiments in homogeneous earthfill dams. RBRH, 29, e10. https://doi.org/10.1590/2318-0331.292420230113
» https://doi.org/10.1590/2318-0331.292420230113 - Von Thun, L., & Gillette, D. (1990). Guidance on breach parameters. Denver: U.S. Department of the Interior, Bureau of Reclamation.
-
Wahl, T. L. (2004). Uncertainty of predictions of embankment dam breach parameters. Journal of Hydraulic Engineering, 130(5), 5. https://doi.org/10.1061/(ASCE)0733-9429(2004)130:5(389)
» https://doi.org/10.1061/(ASCE)0733-9429(2004)130:5(389) - Williams, D., & Buchanan, K. (2013). Dam failure and consequence assessment with standardized USACE MMC procedures. In 12th International Benchmark Workshop on Numerical Analysis of Dams (pp. 325-337), Vienna, Austria. International Commission on Large Dams.
-
Wu, W. (2013). Simplified physically based model of earthen embankment breaching. Journal of Hydraulic Engineering, 139(8), 837-851. https://doi.org/10.1061/(ASCE)HY.1943-7900.0000741
» https://doi.org/10.1061/(ASCE)HY.1943-7900.0000741 -
Xu, Y., & Zhang, L. M. (2009). Breaching parameters for earth and rockfill dams. Journal of Geotechnical and Geoenvironmental Engineering, 135(12), 12. https://doi.org/10.1061/(ASCE)GT.1943-5606.0000162
» https://doi.org/10.1061/(ASCE)GT.1943-5606.0000162 -
Yu, J. J., Qin, X. S., & Larsen, O. (2015). Uncertainty analysis of flood inundation modelling using GLUE with surrogate models in stochastic sampling: uncertainty analysis using surrogate model. Hydrological Processes, 29(6), 6. https://doi.org/10.1002/hyp.10249
» https://doi.org/10.1002/hyp.10249 - Zenz, G., & Goldgruber, M. (Eds.). (2013). Proceedings of the 12th International Benchmark Workshop on Numerical Analysis of Dams (pp. 211-338). Vienna: Austrian National Commission on Large Dams.
Edited by
-
Editor-in-Chief:
Adilson Pinheiro
-
Associated Editor:
Fernando Mainardi Fan