 Hydrodynamic and oil dispersion modeling in the coastal zone of Fortaleza, Northeastern Brazil: a support tool for environmental management and contingency planning
ABSTRACT
Oil spill accidents constitute a serious threat to coastal socio-ecological systems. This study assesses the applicability of computational modelling as a decision-support tool for port and environmental management and for the development of emergency response plans for spills in the coastal zone of Fortaleza (Ceará, Brazil). The hydrodynamic model SisBaHiA and the oil-weathering model ADIOS2 were implemented to simulate hydrodynamics, spill release, transport and weathering of oil. The modelling system was implemented, calibrated and validated against observational data from a tide gauge and an ADCP. Subsequently, a continuous spill of 1,000 m3 over a 24-hour period was simulated at the Mucuripe Port terminal under a higher-wind scenario, with mapping of areas of potential contamination. Validation results indicated high agreement for sea-surface elevations (R2 > 0.90; PBIAS < ±1%; RMSE ≈ 5-14 cm; CIM > 90%) and moderate skill for velocities (R2 ≈ 0.30-0.50; PBIAS < ±7%; RMSE ≈ 0.08 m s−1; CIM > 80%), reflecting the greater physical complexity involved in the spatial and temporal representation of coastal currents. Probabilistic contamination maps and deterministic trajectory forecasts were produced for the considered critical events. It is concluded that SisBaHiA can provide valuable inputs for local-scale risk assessment and response planning, although further refinements could enhance its predictive capability for oil behaviour in the marine environment.
Keywords:
ADIOS2; Hydodinamic modelling; Mucurip Port; Oil spill; SisBaHiA
RESUMO
Acidentes com derramamento de óleo constituem grave risco a sistemas socioecológicos costeiros. Este trabalho avalia a aplicabilidade da modelagem computacional como ferramenta de suporte à gestão portuária e ambiental e à elaboração de planos de ação emergencial para derrames na zona costeira de Fortaleza (CE). Foram implementados o modelo hidrodinâmico SisBaHiA e o modelo de intemperismo ADIOS2 para simular hidrodinâmica, derrame, transporte e intemperismo de óleo. O modelo foi implementado, calibrado e validado com dados de uma estação maregráfica e de um ADCP; em seguida, foi simulado um derrame contínuo de 1000 m3, com duração de 24 horas, no terminal do Porto do Mucuripe, considerando um cenário de ventos mais intensos, com mapeamento das áreas de potencial contaminação. A validação mostrou elevada concordância para elevações superficiais (R2 > 0,90; PBIAS < ±1%; RMSE ≈ 5-14 cm; CIM > 90%) e desempenho moderado para velocidades (R2 ≈ 0,30-0,50; PBIAS < ±7%; RMSE ≈ 0,08 m/s; CIM > 80%). Foram produzidos mapas probabilísticos e trajetórias determinísticas dos eventos críticos. Conclui-se que o SisBaHiA oferece insumos úteis para avaliação de risco e planejamento de resposta em escala local, embora refinamentos adicionais possam otimizar sua capacidade preditiva.
Palavras-chave:
ADIOS2; Modelagem hidrodinâmica; Porto do Mucuripe; Derrame de óleo; SisBaHiA
INTRODUCTION
Coastal zones are areas of high socioeconomic value and simultaneously high vulnerability to oil pollution, stemming both from port operations and coastal activities, as well as from offshore incidents whose residues are transported by currents and wind (Marta-Almeida et al., 2013; Chiau, 2005). Spills and operational emissions generate long-lasting environmental, economic, and social impacts, affecting biodiversity and critical infrastructure (Ventikos & Sotiropoulos, 2014; International Tanker Owners Pollution Federation, 2014).
Since the 1970s, significant technological and regulatory improvements have contributed to a substantial reduction in the number of oil spill accidents at sea (International Tanker Owners Pollution Federation, 2025). Despite these advances, the annual volumes of spilled oil remain strongly influenced by the occurrence of high-magnitude events. In 2024, six large spills (>700 t) and four medium-sized spills (7-700 t) were reported, totaling approximately 10,000 tonnes, predominantly consisting of fuel oil. The average annual frequency during the 2020s was around 7.4 incidents per year, compared to 6.3 in the 2010s, which indicates that, even with an overall reduction in frequency, the risk remains significant (International Tanker Owners Pollution Federation, 2025; Kontovas et al., 2010).
At the same time, chronic pollution resulting from small and repeated discharges, contaminated ballast water releases, machinery effluents, structural leaks, bunkering failures and ship-to-ship transfers has become increasingly relevant. Its cumulative impacts may potentially exceed those of individual large spills (Dong et al., 2022; Liubartseva et al., 2023; National Research Council, 2003).
In this context, recent events have revealed an increase in the frequency of oil pollution incidents within Brazilian jurisdictional waters (Zacharias et al., 2024). Between August 2019 and June 2021, more than 3,000 km of the Brazilian coastline, from the far northeast to the southeastern region, were affected by residues of a dark and viscous oil that reappeared intermittently during periods of stronger winds, higher wave heights, and spring tides (Reddy et al., 2022). Studies based on oil spill and transport modeling estimated volumes ranging from 5,000 to 12,500 m3, under the hypothesis of a slow discharge caused by structural or mechanical failures in an oil tanker (Zacharias et al., 2021).
Given the magnitude of the impacts and the large spatial extent affected, this incident is considered the largest oil spill ever recorded along the South American coastline and in tropical environments. The lack of effective coordination and leadership by the Brazilian Federal Government, combined with recent budget cuts in scientific research, hindered the implementation of a prompt and coordinated response. This situation highlights the urgent need for investments in research programs and the development of public policies capable of providing tools to support environmental emergency response (Azevedo et al., 2022; Soares et al., 2023).
In this scenario, the Port of Mucuripe, located in Fortaleza, northeastern Brazil, is a strategic maritime terminal operated by Transpetro. The port handles liquefied petroleum gas (LPG), petroleum derivatives, and bunker fuel operations, and has recorded a significant increase in ship-to-ship transfers (14 in 2024 compared to 2 in 2023), thereby heightening exposure to risks during maneuvering and bunkering activities. Furthermore, historical local incidents, such as the 2008 collision that resulted in an oil spill and the 2015 vegetable oil leak, demonstrate how low-magnitude events can cumulatively contribute to chronic pollution and sediment contamination (Dong et al., 2022).
Although analytical and geochemical studies have been conducted (Azevedo et al., 2022), as well as mapping of oil spills along Brazilian beaches, particularly during the 2019 and 2022 events (Zacharias et al., 2021, 2023, 2024; Lemos et al., 2024), no studies have been identified in the literature applying numerical modeling to the dispersion, trajectory, and fate of oil specifically in the coastal region of Fortaleza or at the Port of Mucuripe. In particular, there are no records of SisBaHiA being used for this purpose.
In light of the above, it becomes evident that expanding the range of response options to oil spill incidents requires a detailed understanding of the behavior and transport of contaminant plumes under varying environmental conditions of tides, winds, waves, and hydrodynamic currents. In this context, several studies on coastal hydrodynamic circulation in Fortaleza have been conducted in recent years using numerical modeling, with particular emphasis on the application of SisBaHiA (Base System of Environmental Hydrodynamics), a computational modeling system that employs finite elements and integrates Eulerian and Lagrangian modules to simulate water circulation and contaminant transport. Recent studies carried out in the coastal zone of Fortaleza have shown excellent agreement with observational data on tides and currents, validating the use of SisBaHiA for reproducing local hydrodynamic patterns (Pereira et al., 2015, 2021; Silva et al., 2017).
In this context, this study aims to evaluate hydrodynamic circulation and oil spill dispersion in the coastal region of Fortaleza, with particular emphasis on the Port of Mucuripe, through an integrated numerical modeling approach using the SisBaHiA computational system. The novelty of this study lies in the integration of the hydrodynamic model with local wave generation and Lagrangian transport modules to simulate different oil spill scenarios under varying tidal, wind, wave, and current conditions. Both deterministic and probabilistic analyses are performed to assess the model’s ability to reproduce hydrodynamic circulation patterns and oil transport pathways, as well as to provide technical support for the development and implementation of environmental emergency response strategies in the study area. The hydrodynamic model is calibrated and validated through comparison with in situ observations from a tide gauge station and an Acoustic Doppler Current Profiler (ADCP) deployed in the region.
MATERIAL AND METHODS
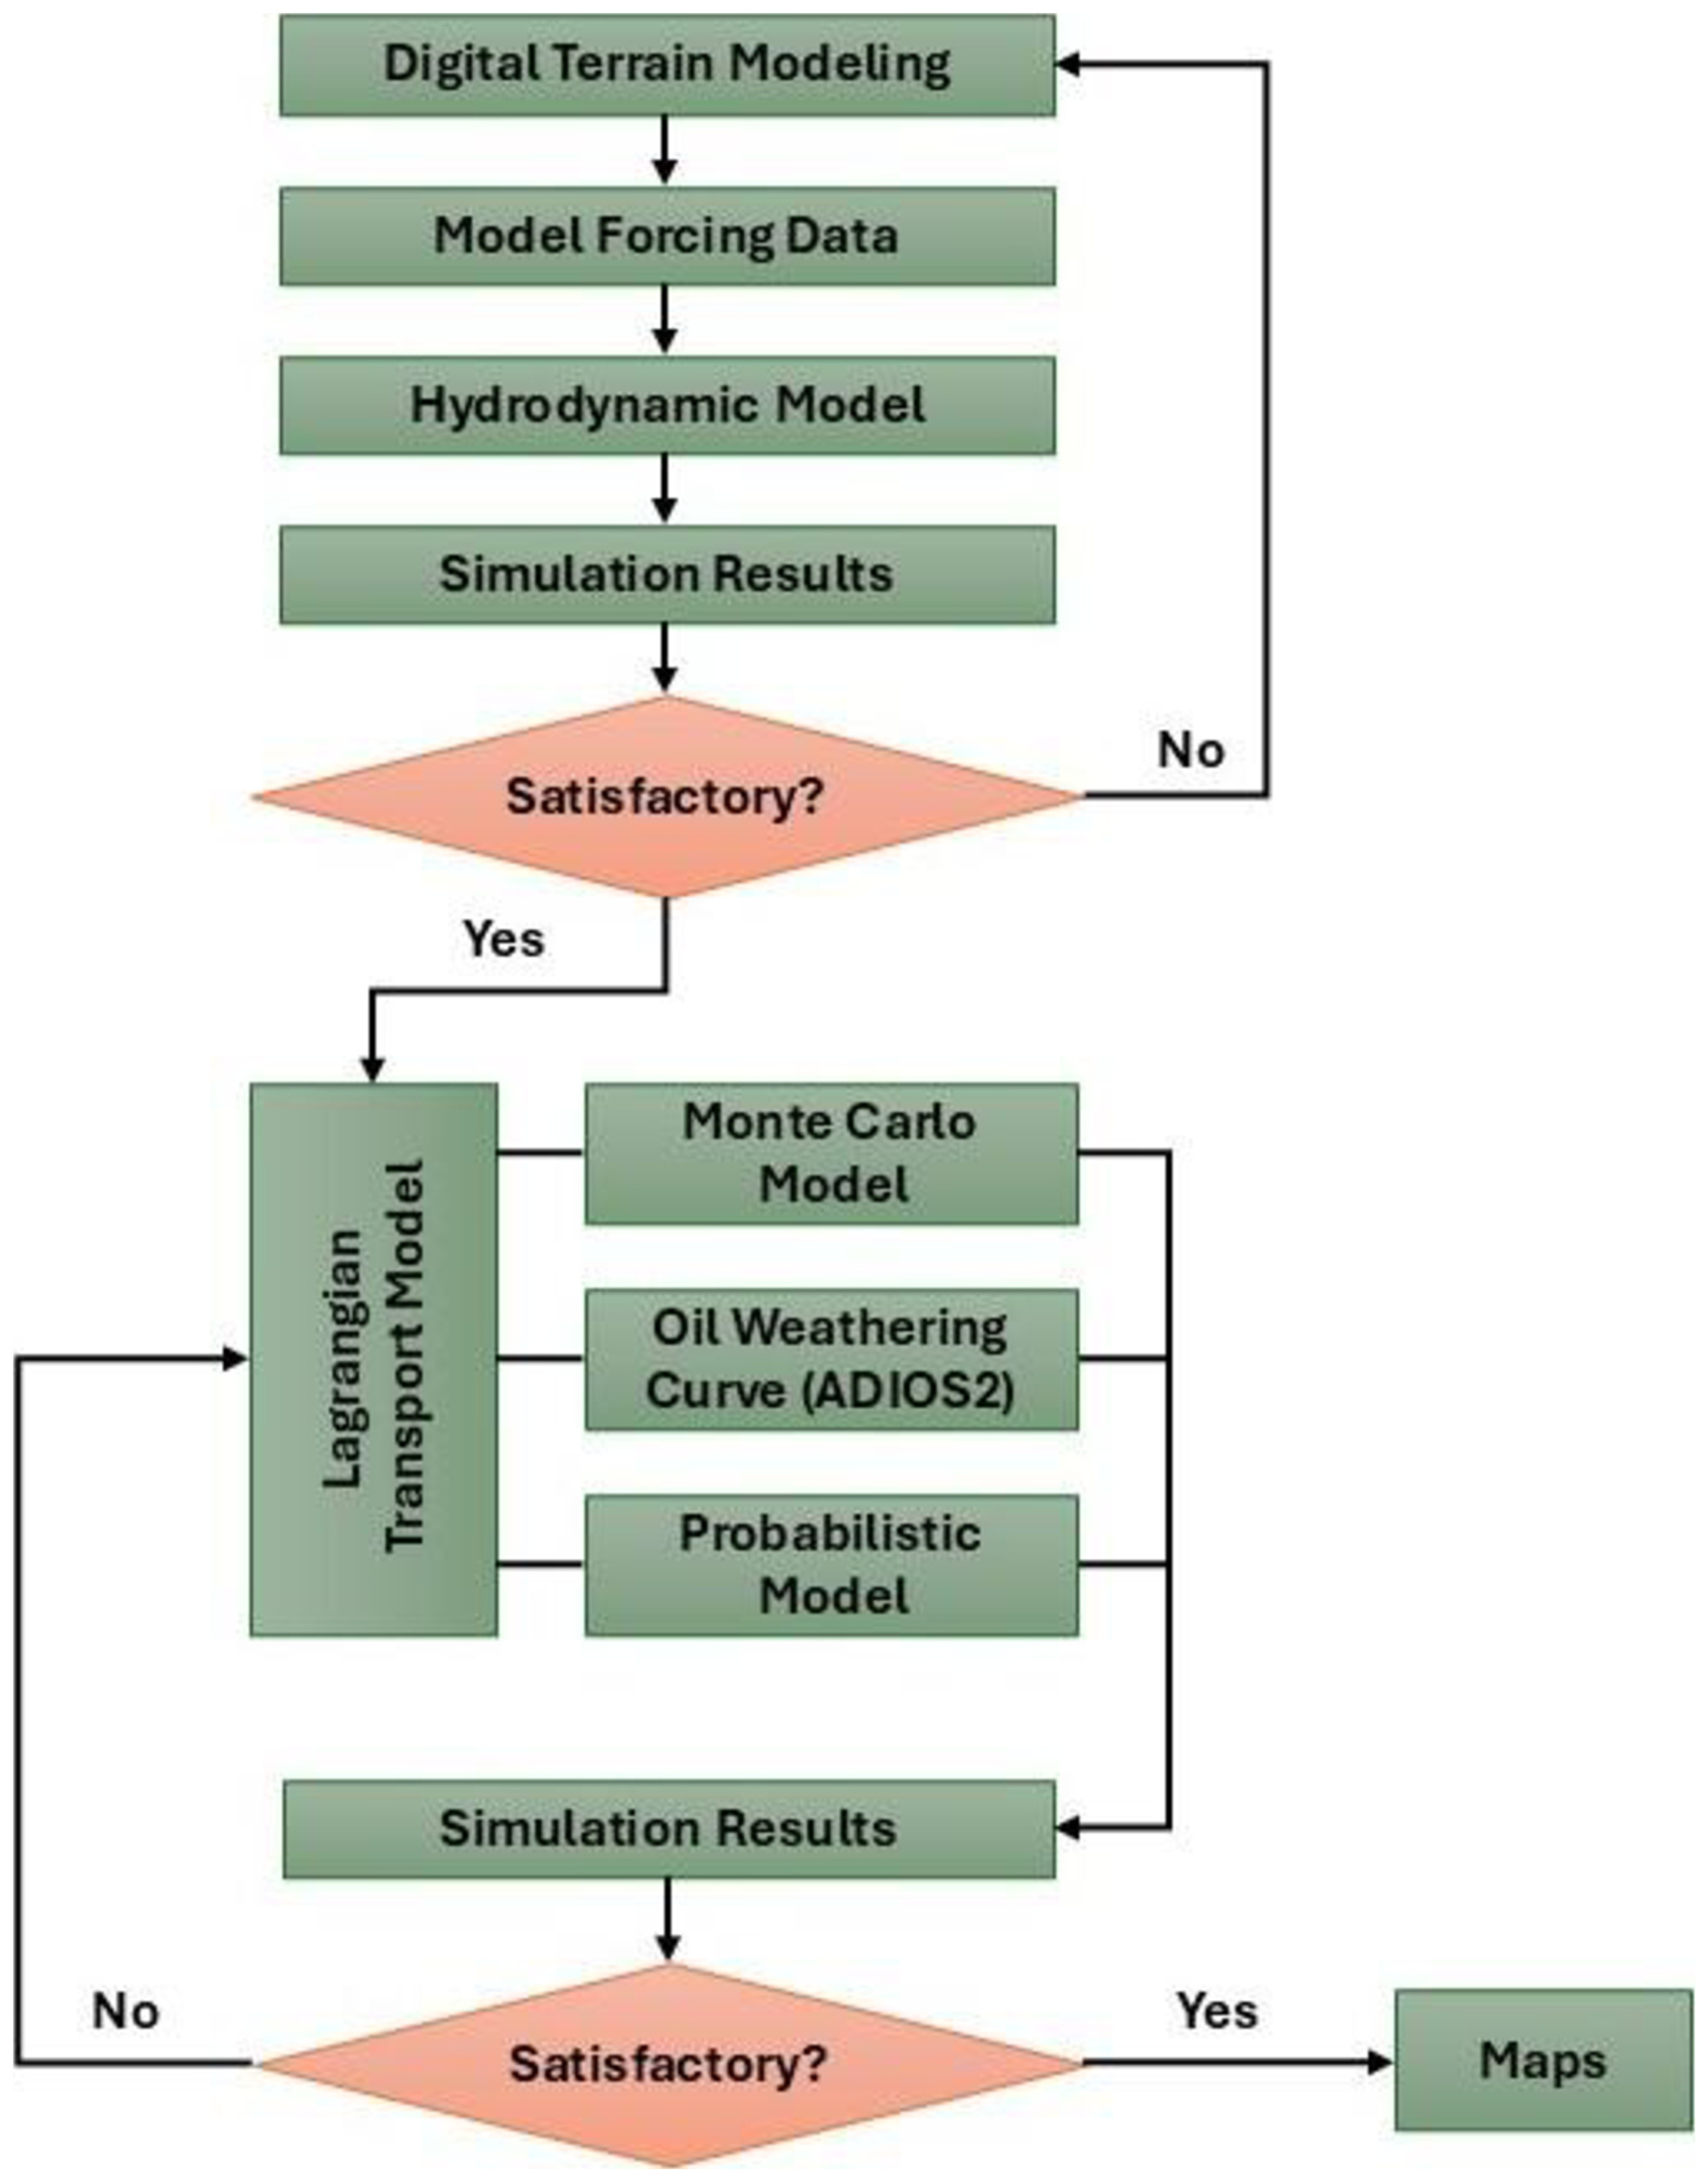
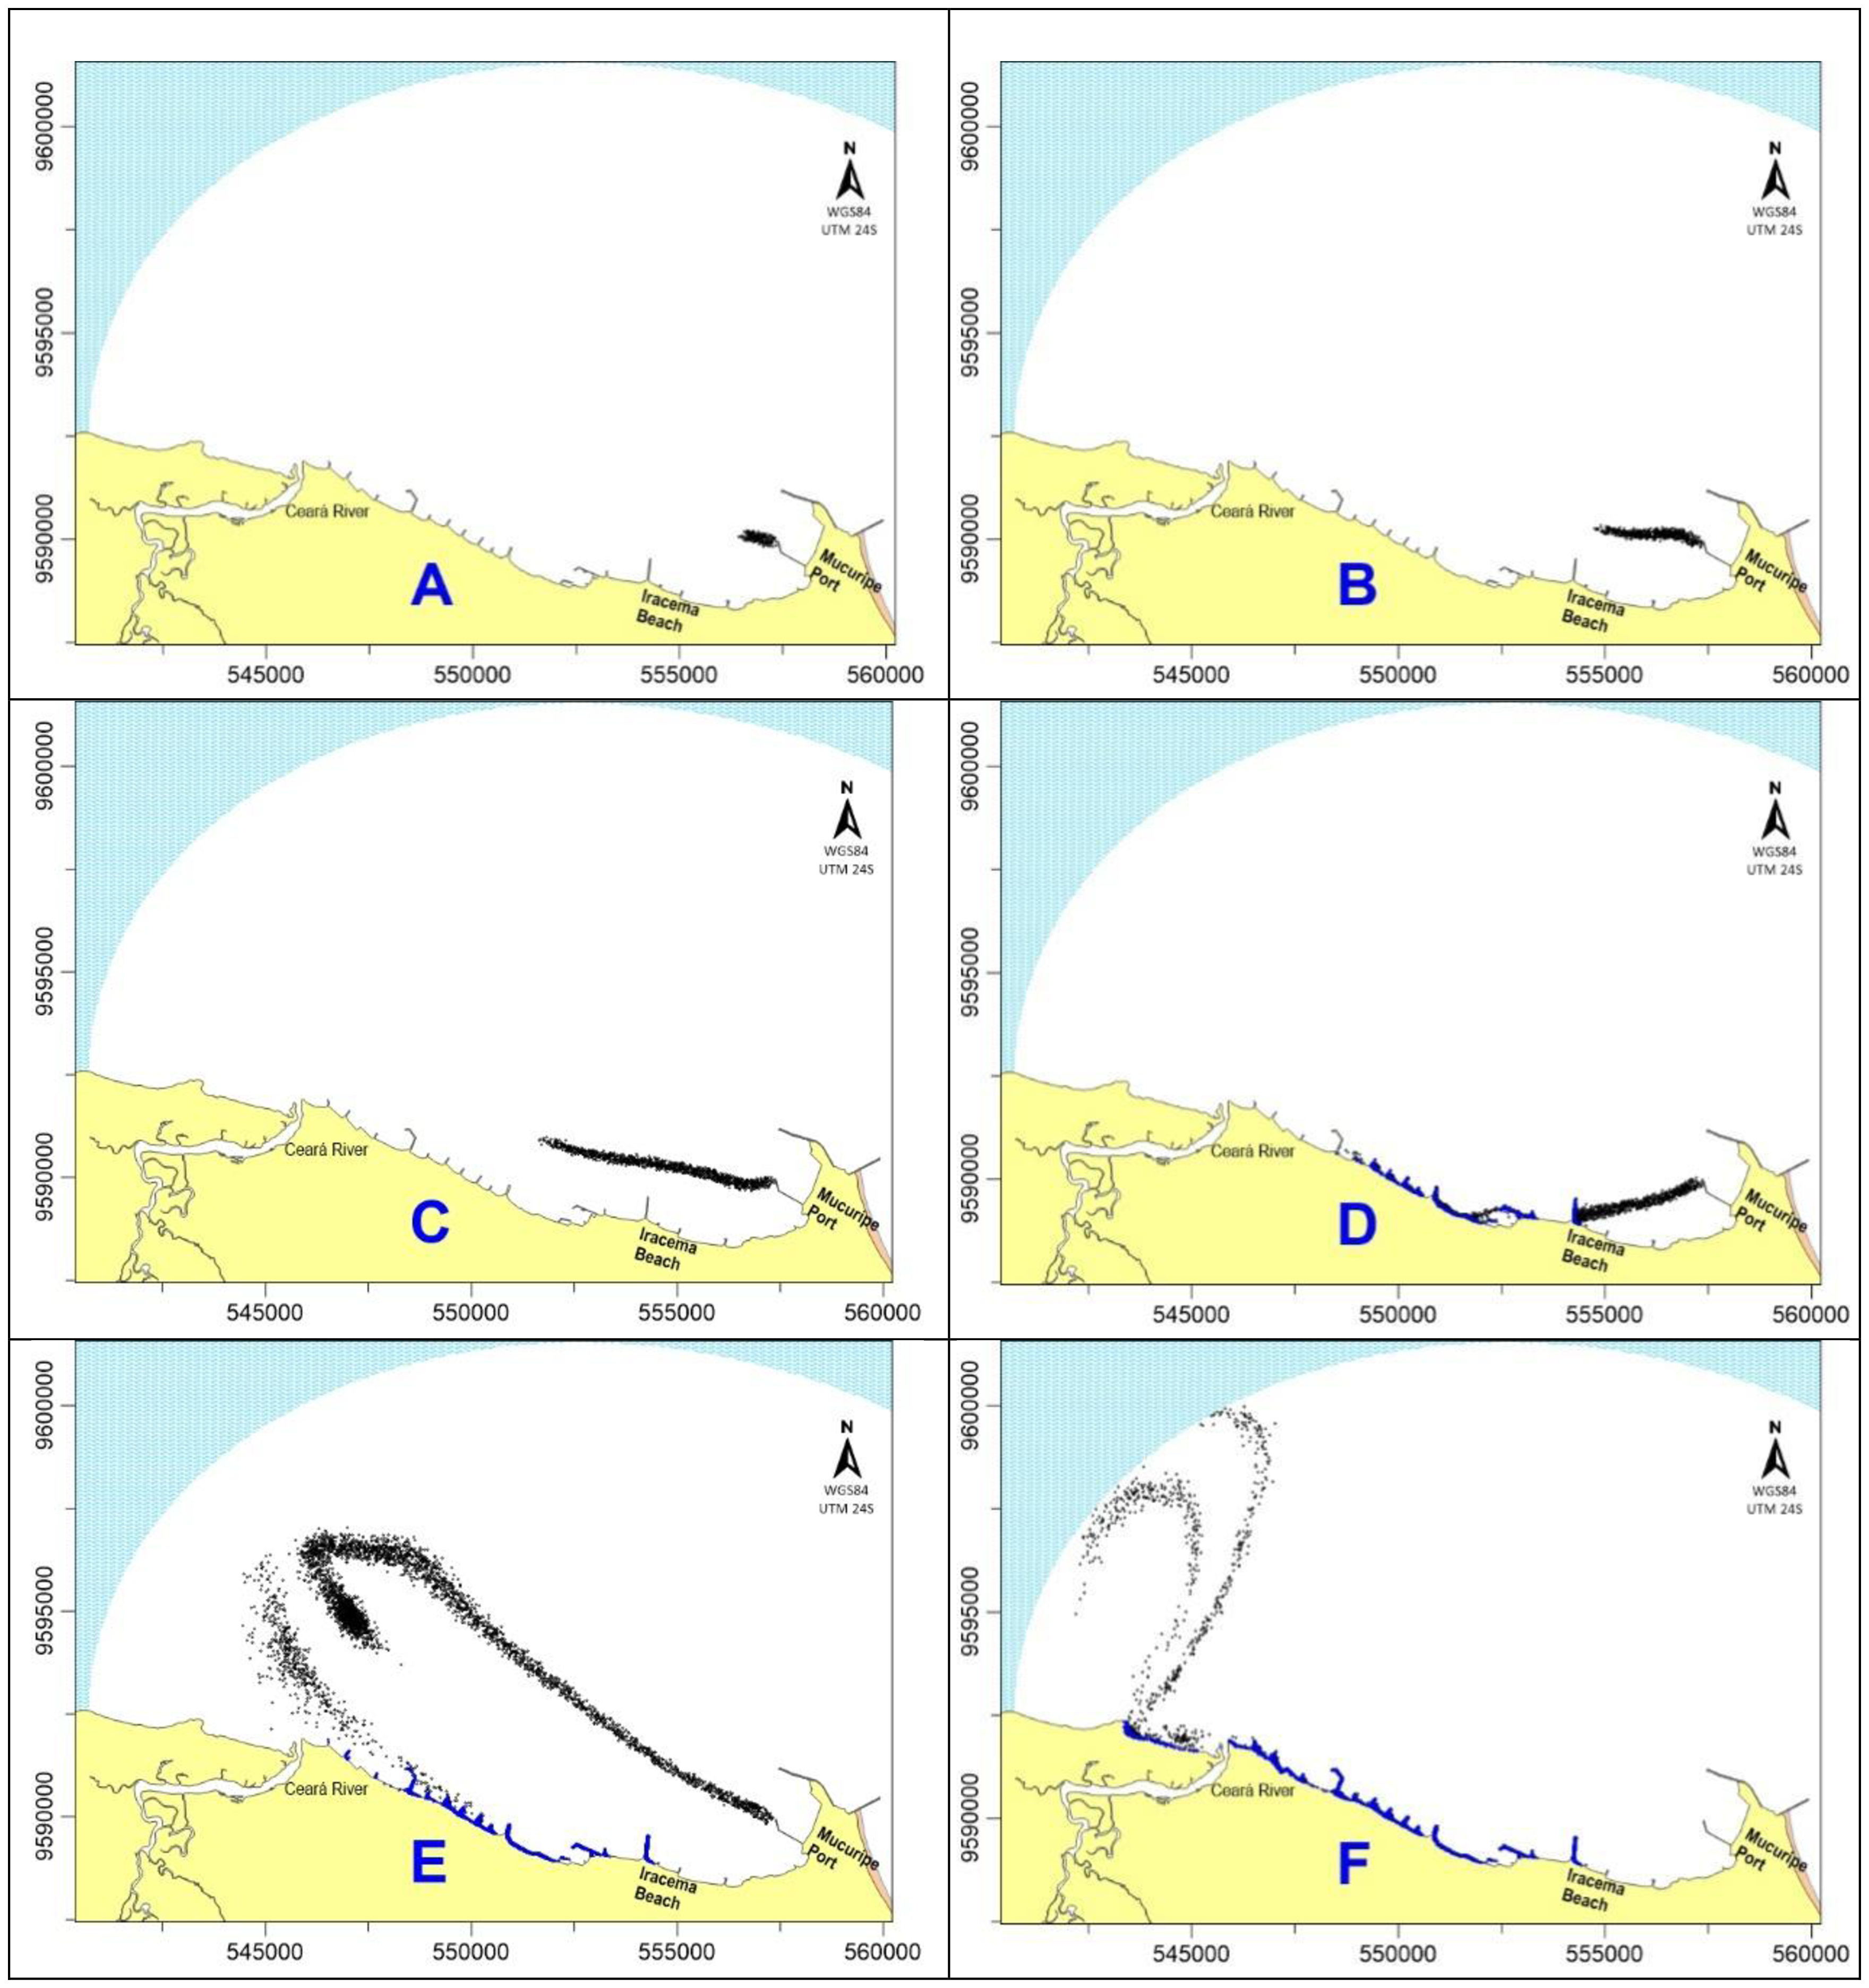
This study employed SisBaHiA, a numerical modeling system based on physical processes, continuously developed and maintained by the Federal University of Rio de Janeiro (UFRJ), and widely applied in investigations of surface water bodies (Pereira et al., 2015, 2021; Peixoto et al., 2017; Barros & Rosman, 2018; Rodrigues, 2023). Three modules of the system were utilized: the hydrodynamic model, the wave generation model, and the Lagrangian transport model. Figure 1 provides a concise overview of the workflow implemented in the modeling process. Note that model calibration is represented by the decision stage that evaluates whether the results are satisfactory. Satisfactory results allow progression to the Lagrangian transport model, whereas unsatisfactory results lead back to the evaluation of the DTM, forcing data, and hydrodynamic model parameters, characterizing an iterative process.
Study area
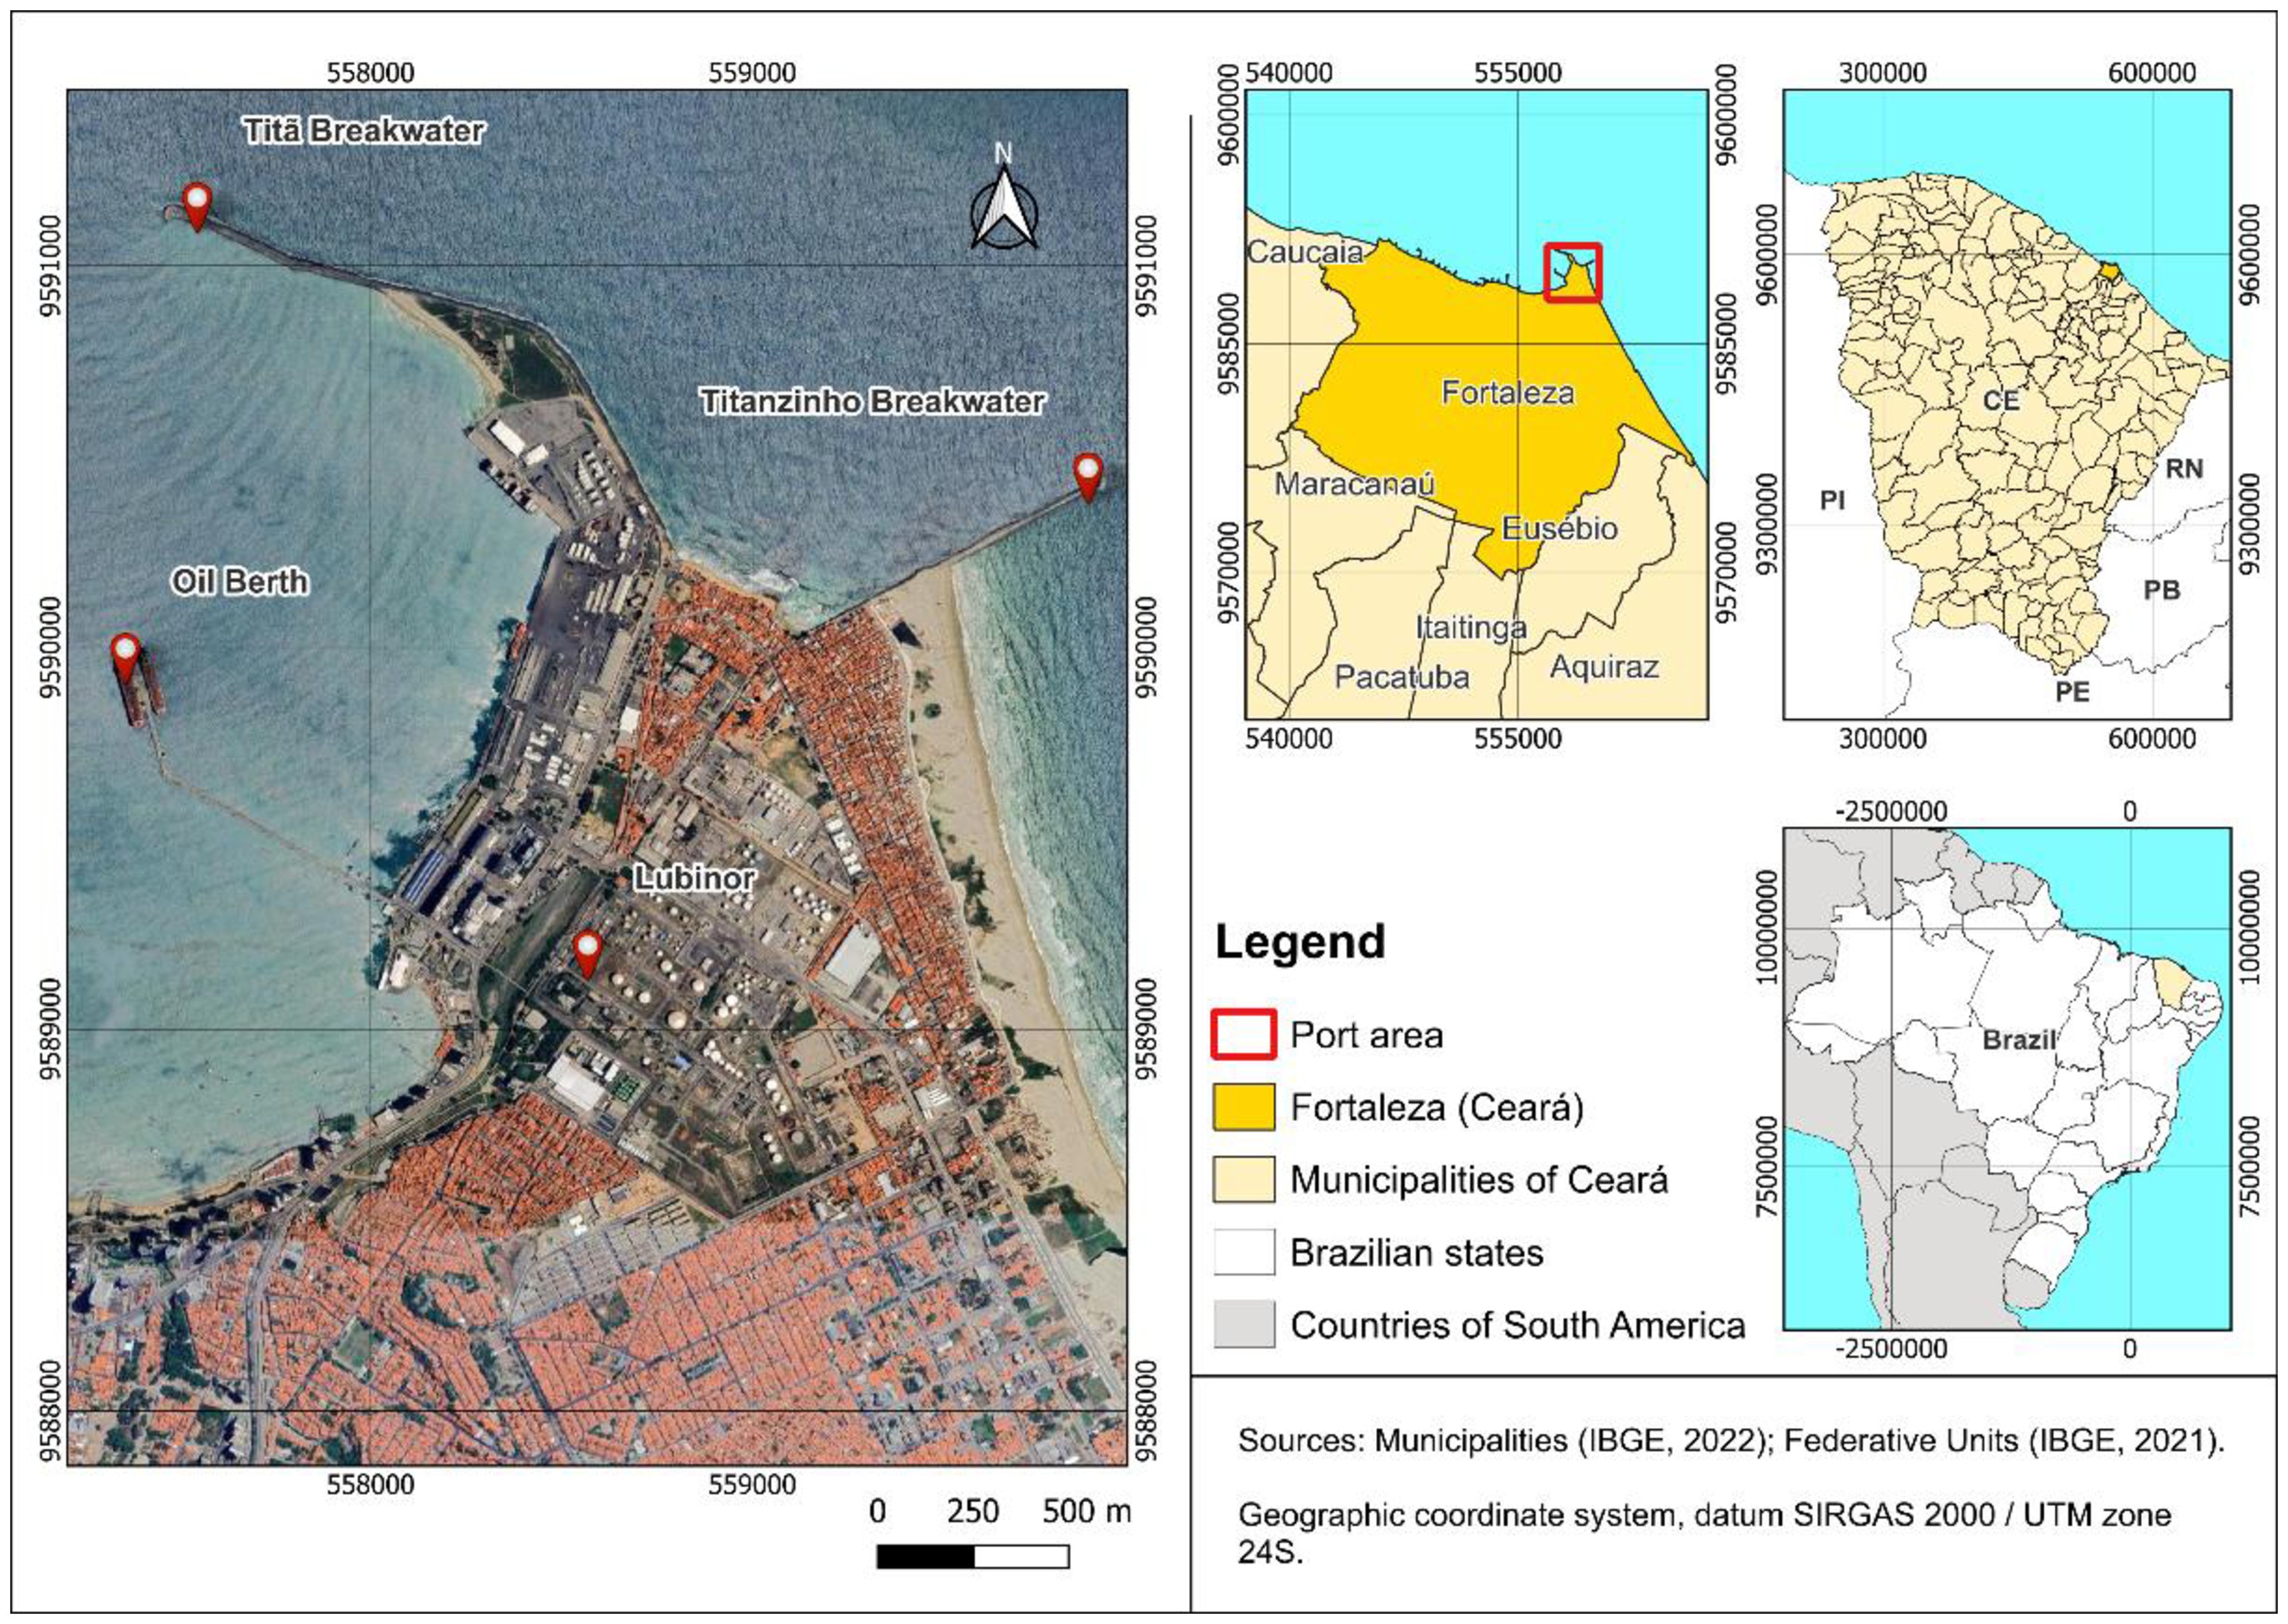
The city of Fortaleza (3°43’02”S, 38°32’35”W; area = 312.353 km2) is located on the northeastern Brazilian coast, bordering Caucaia, Maracanaú, Itaitinga, Eusébio, Aquiraz, and Pacatuba (Instituto Brasileiro de Geografia e Estatística, 2022). Along the coast of Fortaleza (CE, Brazil), the environmental regime is strongly influenced by northeast trade winds, which in the coastal zone frequently reach mean speeds of 7 m/s or higher (Lira et al., 2014). Recent analyses of wind and wave re‑analysis data off the Brazilian coast indicate that significant wave heights in the South Atlantic may average on the order of ~1 m, with frequent swell events of greater magnitude and variable direction (Cotrim et al., 2022). In the vicinity of the Port of Mucuripe, coastal current dynamics are driven by semi‑diurnal tidal forcing (astronomical amplitudes approaching ~3 m) in combination with wind forcing and coastline orientation, resulting in significant long‑shore sediment transport and seasonal variability in circulation patterns (Maia et al., 2018). These processes represent the main hydrodynamic forcings that also govern the behavior of oil slicks in the region (Marques et al., 2017).
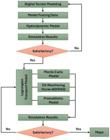
The Port of Mucuripe, located along the coastline of Fortaleza, serves as a multifunctional terminal of strategic importance for the state of Ceará. The port is protected by two major coastal defense structures: the Titan Breakwater, approximately 1,900 m in length, composed of large granite armor units and designed to attenuate wave agitation within the maneuvering basin; and the Titanzinho Breakwater, extending about 1,000 m, whose main function is to reduce longshore sediment transport from the eastern coast, thereby minimizing siltation within the access channel. Figure 2 shows the locations of the municipality of Fortaleza and the Port of Mucuripe.
According to the Port of Mucuripe Master Plan (Companhia Docas do Ceará, 2015), the commercial quay has an approximate length of 1,080 m; the oil pier comprises berths 201 and 202 (250 m each), with internal/external depths of 11.5/12.0 m. The pier is connected to the shore by an access bridge of 853 m, with a duct lane (4.40 m) and a vehicle lane (3.60 m). The duct section houses pipelines connecting the terminal to the Lubnor Refinery (Lubrificantes e Derivados do Nordeste), responsible for 10% of Brazil’s asphalt production. These infrastructural and operational characteristics justified the selection of this area as the origin point for the modeled spill scenarios.
Digital terrain modeling
The digital terrain model (DTM) provides the geometric basis for hydrodynamic modeling, conditioning mesh resolution, bathymetric representation, and bottom roughness assignment, critical elements for contaminant and sediment transport predictions.
The domain encompasses the entire Fortaleza shoreline and part of Caucaia, including the estuaries of the Cocó and Ceará Rivers, urbanized areas with high sediment dynamics and potential contaminant retention. The mesh was constructed aligning elements with coastal contours and port structures, with local refinement around the Port of Mucuripe and sections with jetties and breakwaters. The SisBaHiA mesh consists of 1,638 elements (1,629 biquadratic quadrilaterals and 9 quadratic triangles).
Bathymetry and seabed characteristics were defined based on the integration of nautical charts and sedimentological studies. Bathymetric data were obtained from nautical charts No. 701 (Port of Mucuripe, scale 1:13,000) and No. 710 (adjacent region, scale 1:50,000), produced in 2022 by the Hydrography and Navigation Department of the Brazilian Navy (DHN), adopting 1.60 m as the chart datum reduction level. Complementarily, seabed composition and textural attributes were characterized according Ximenes Neto et al. (2018), which indicate a predominance of medium sands with localized occurrences of bioclastic and muddy deposits.
The equivalent roughness (ε) was assigned according to the SisBaHiA Technical Reference (Table 1), considering a predominance of medium sands, with equivalent roughness values ranging from 0.01 m to 0.03 m. These values were subsequently converted into Chézy coefficients for the calculation of bed shear stress.
Suggested values for the effective bottom roughness amplitude, 𝜀, without wave effects, for use in the SisBaHiA hydrodynamic model.
Tides, currents and winds
The hydrodynamic model was configured to represent the main forcings acting in the study area, including winds, tides, and coastal currents, which are recognized as key mechanisms controlling oil transport and dispersion in coastal environments (Marques et al., 2017).
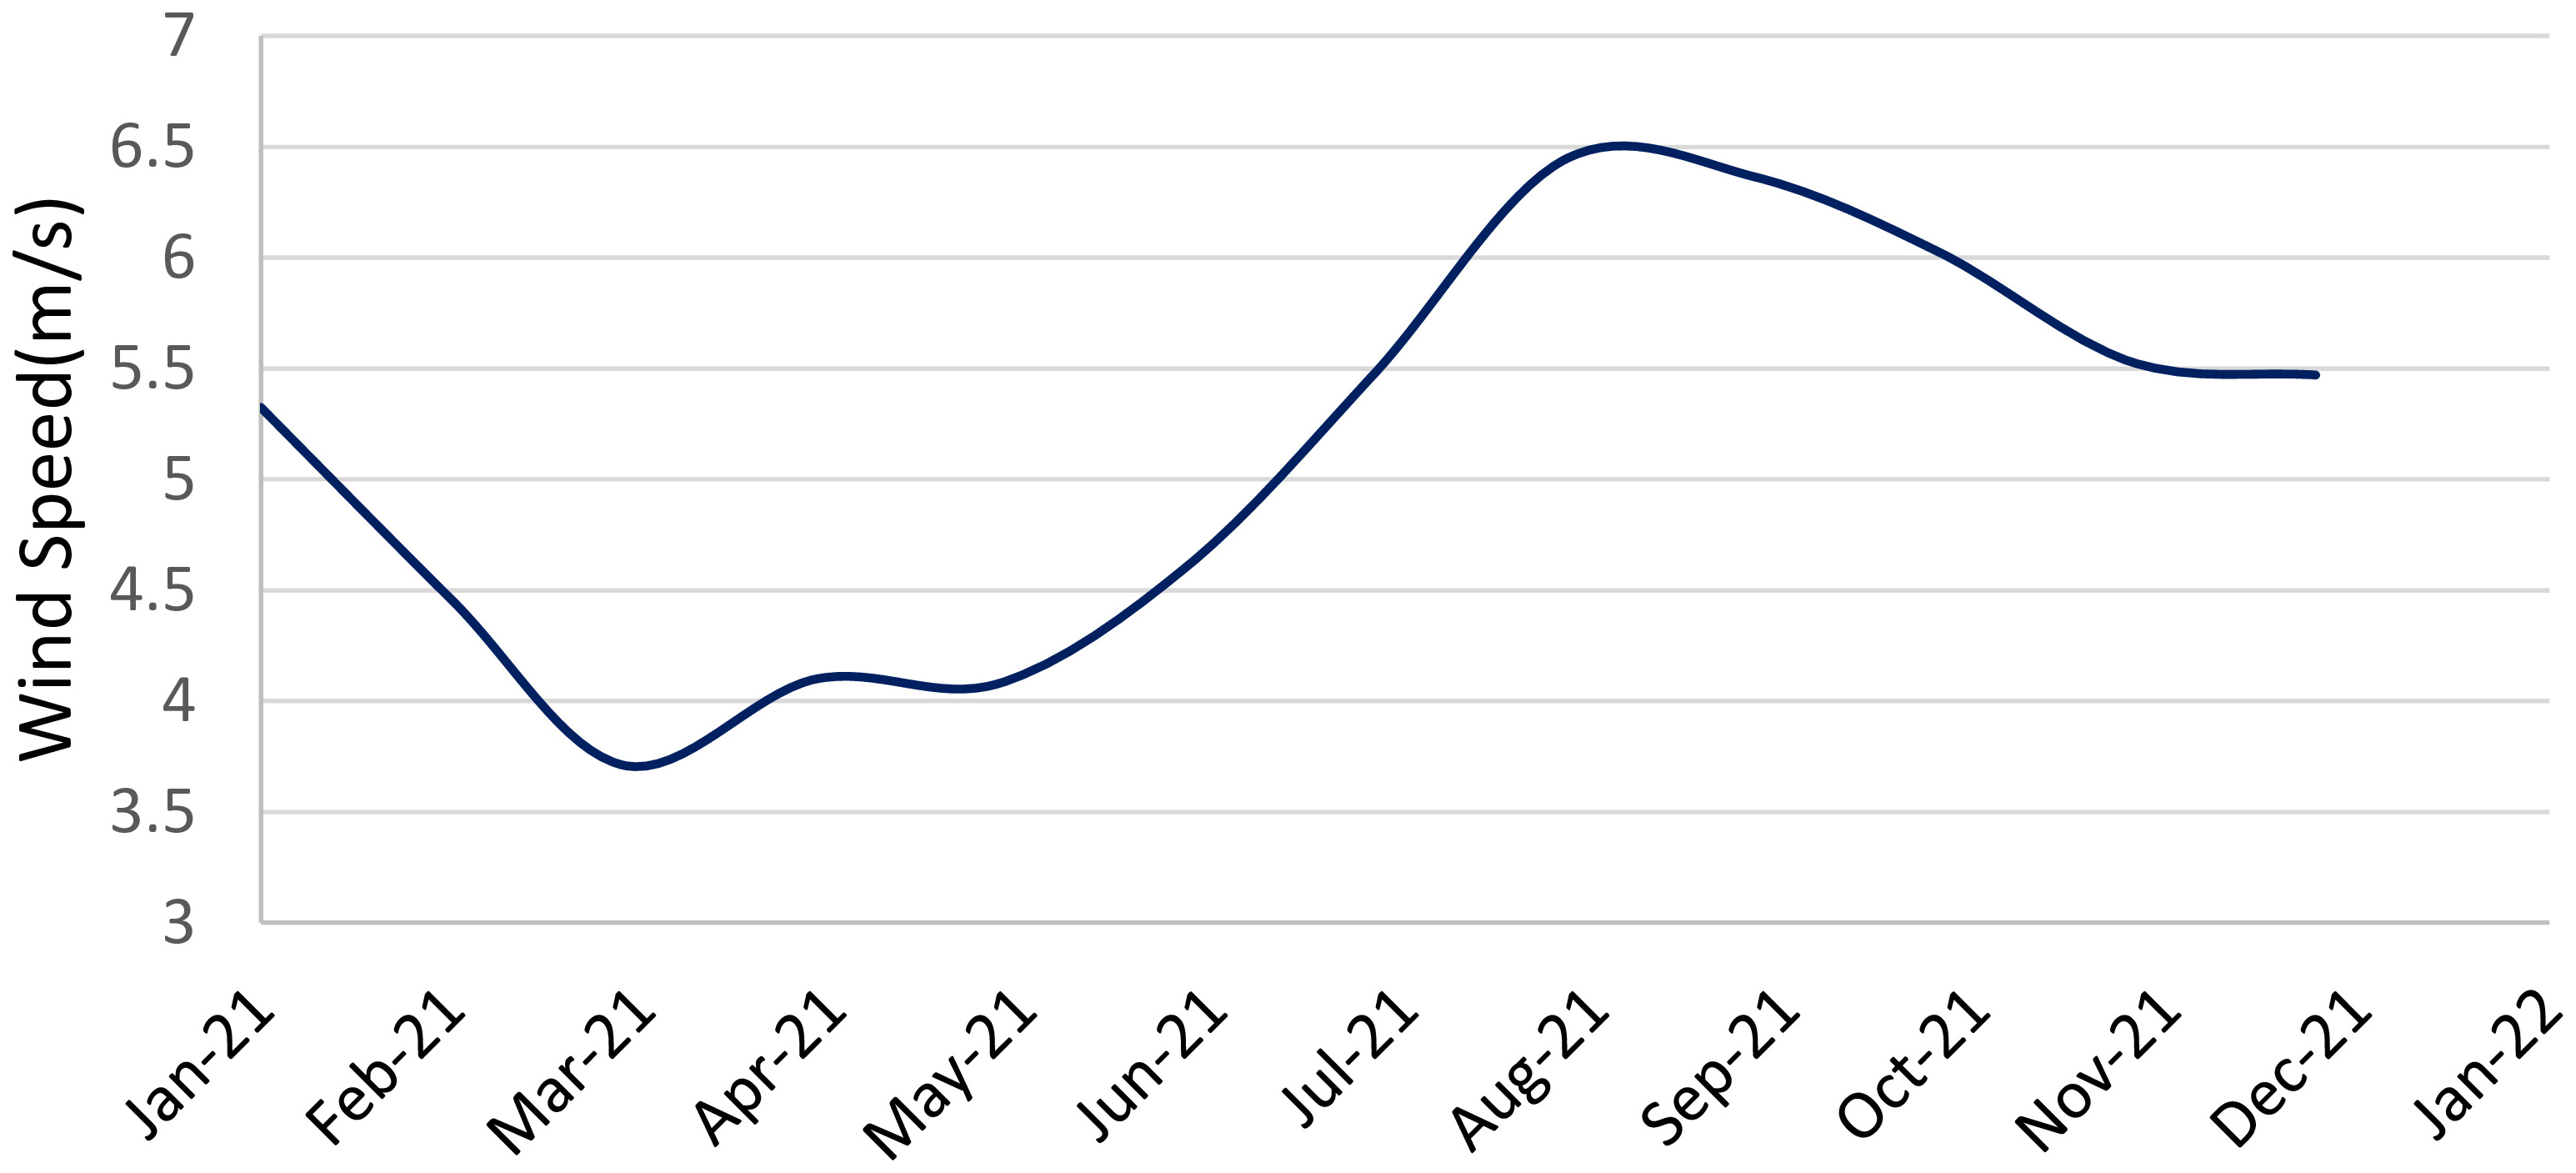
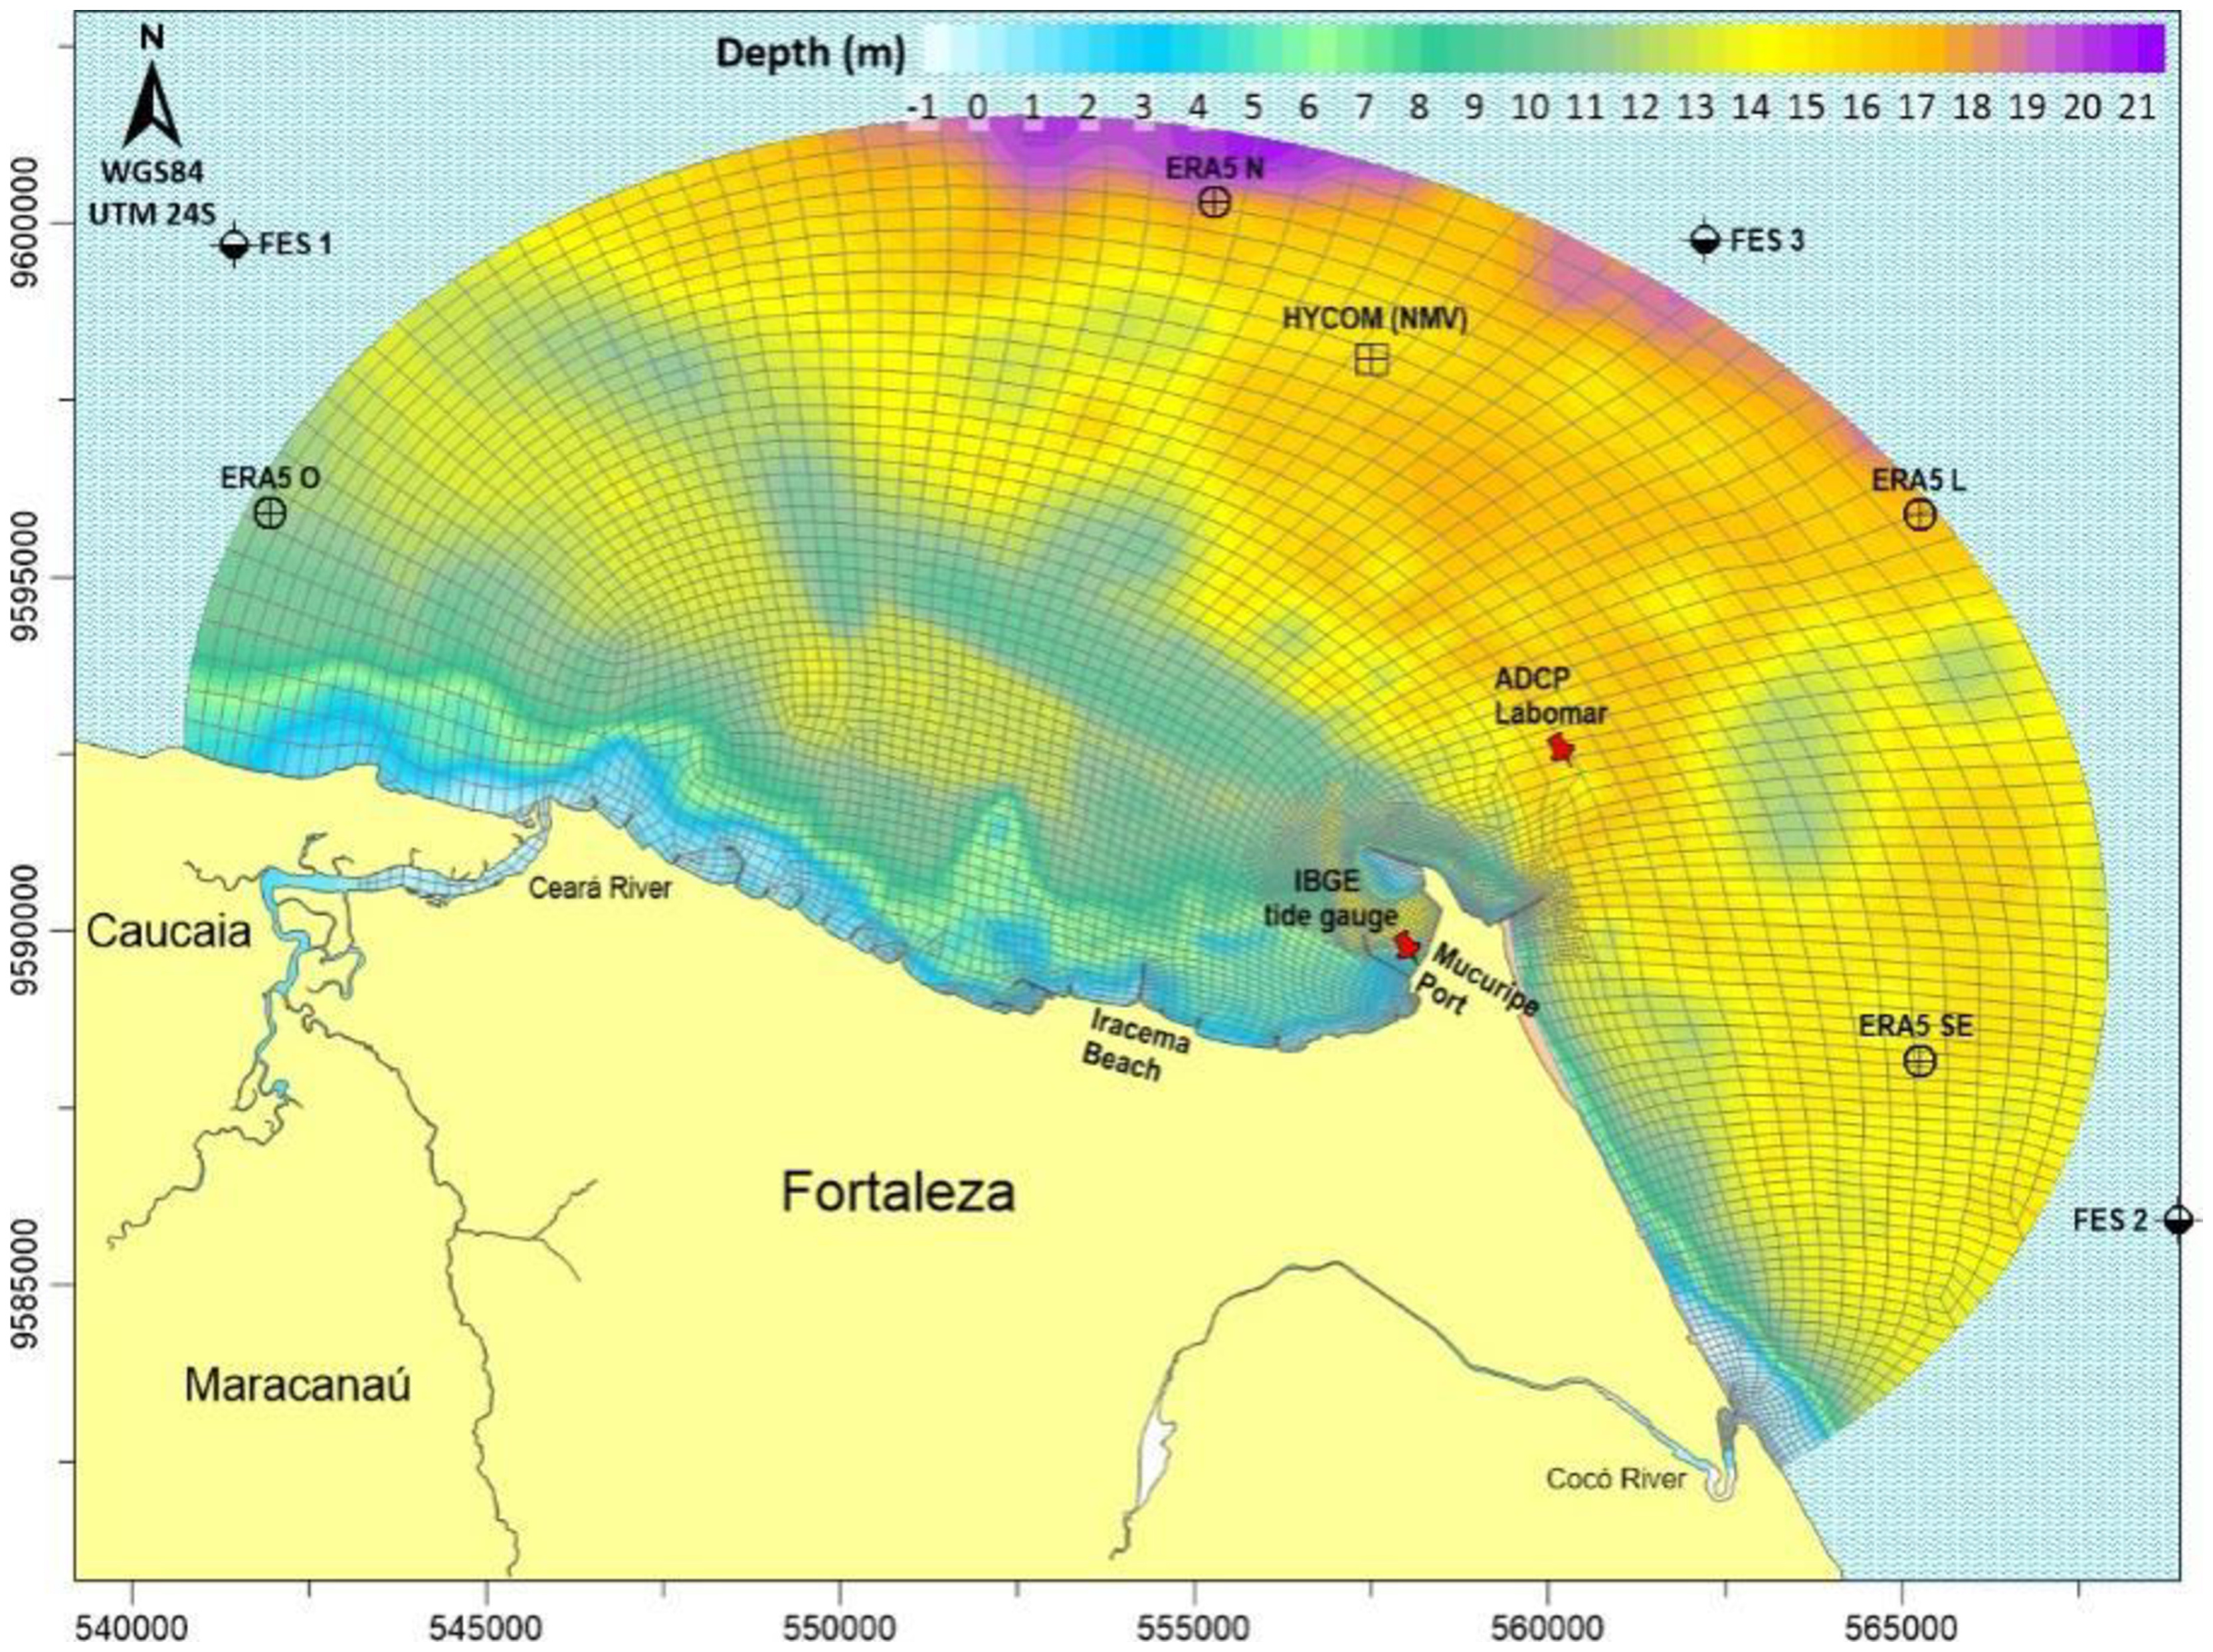
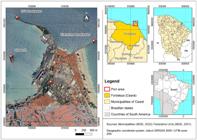
Surface elevation boundary conditions were generated by combining astronomical tides, using 33 harmonic constants extracted from Finite Element Solution (FES2014) at three stations along the domain boundary (Lyard et al., 2021), with meteorological variations derived from Hybrid Coordinate Ocean Model — HYCOM (Chassignet et al., 2009). In addition, external currents entering the modelling domain were incorporated into the HM using HYCOM data. Four stations of wind were used to force the model, obtained from the atmospheric reanalysis model ERA5 (Hersbach et al., 2020), developed by European Centre for Medium-Range Weather Forecasts ( ECMWF), with a 3-hour time step.For this study, October 2021 was selected as a representative scenario based on climatological analyses, which indicate its highest seasonal representativeness in terms of wind intensity (Figure 3), as well as the availability of field data for calibration.
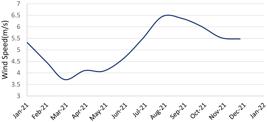
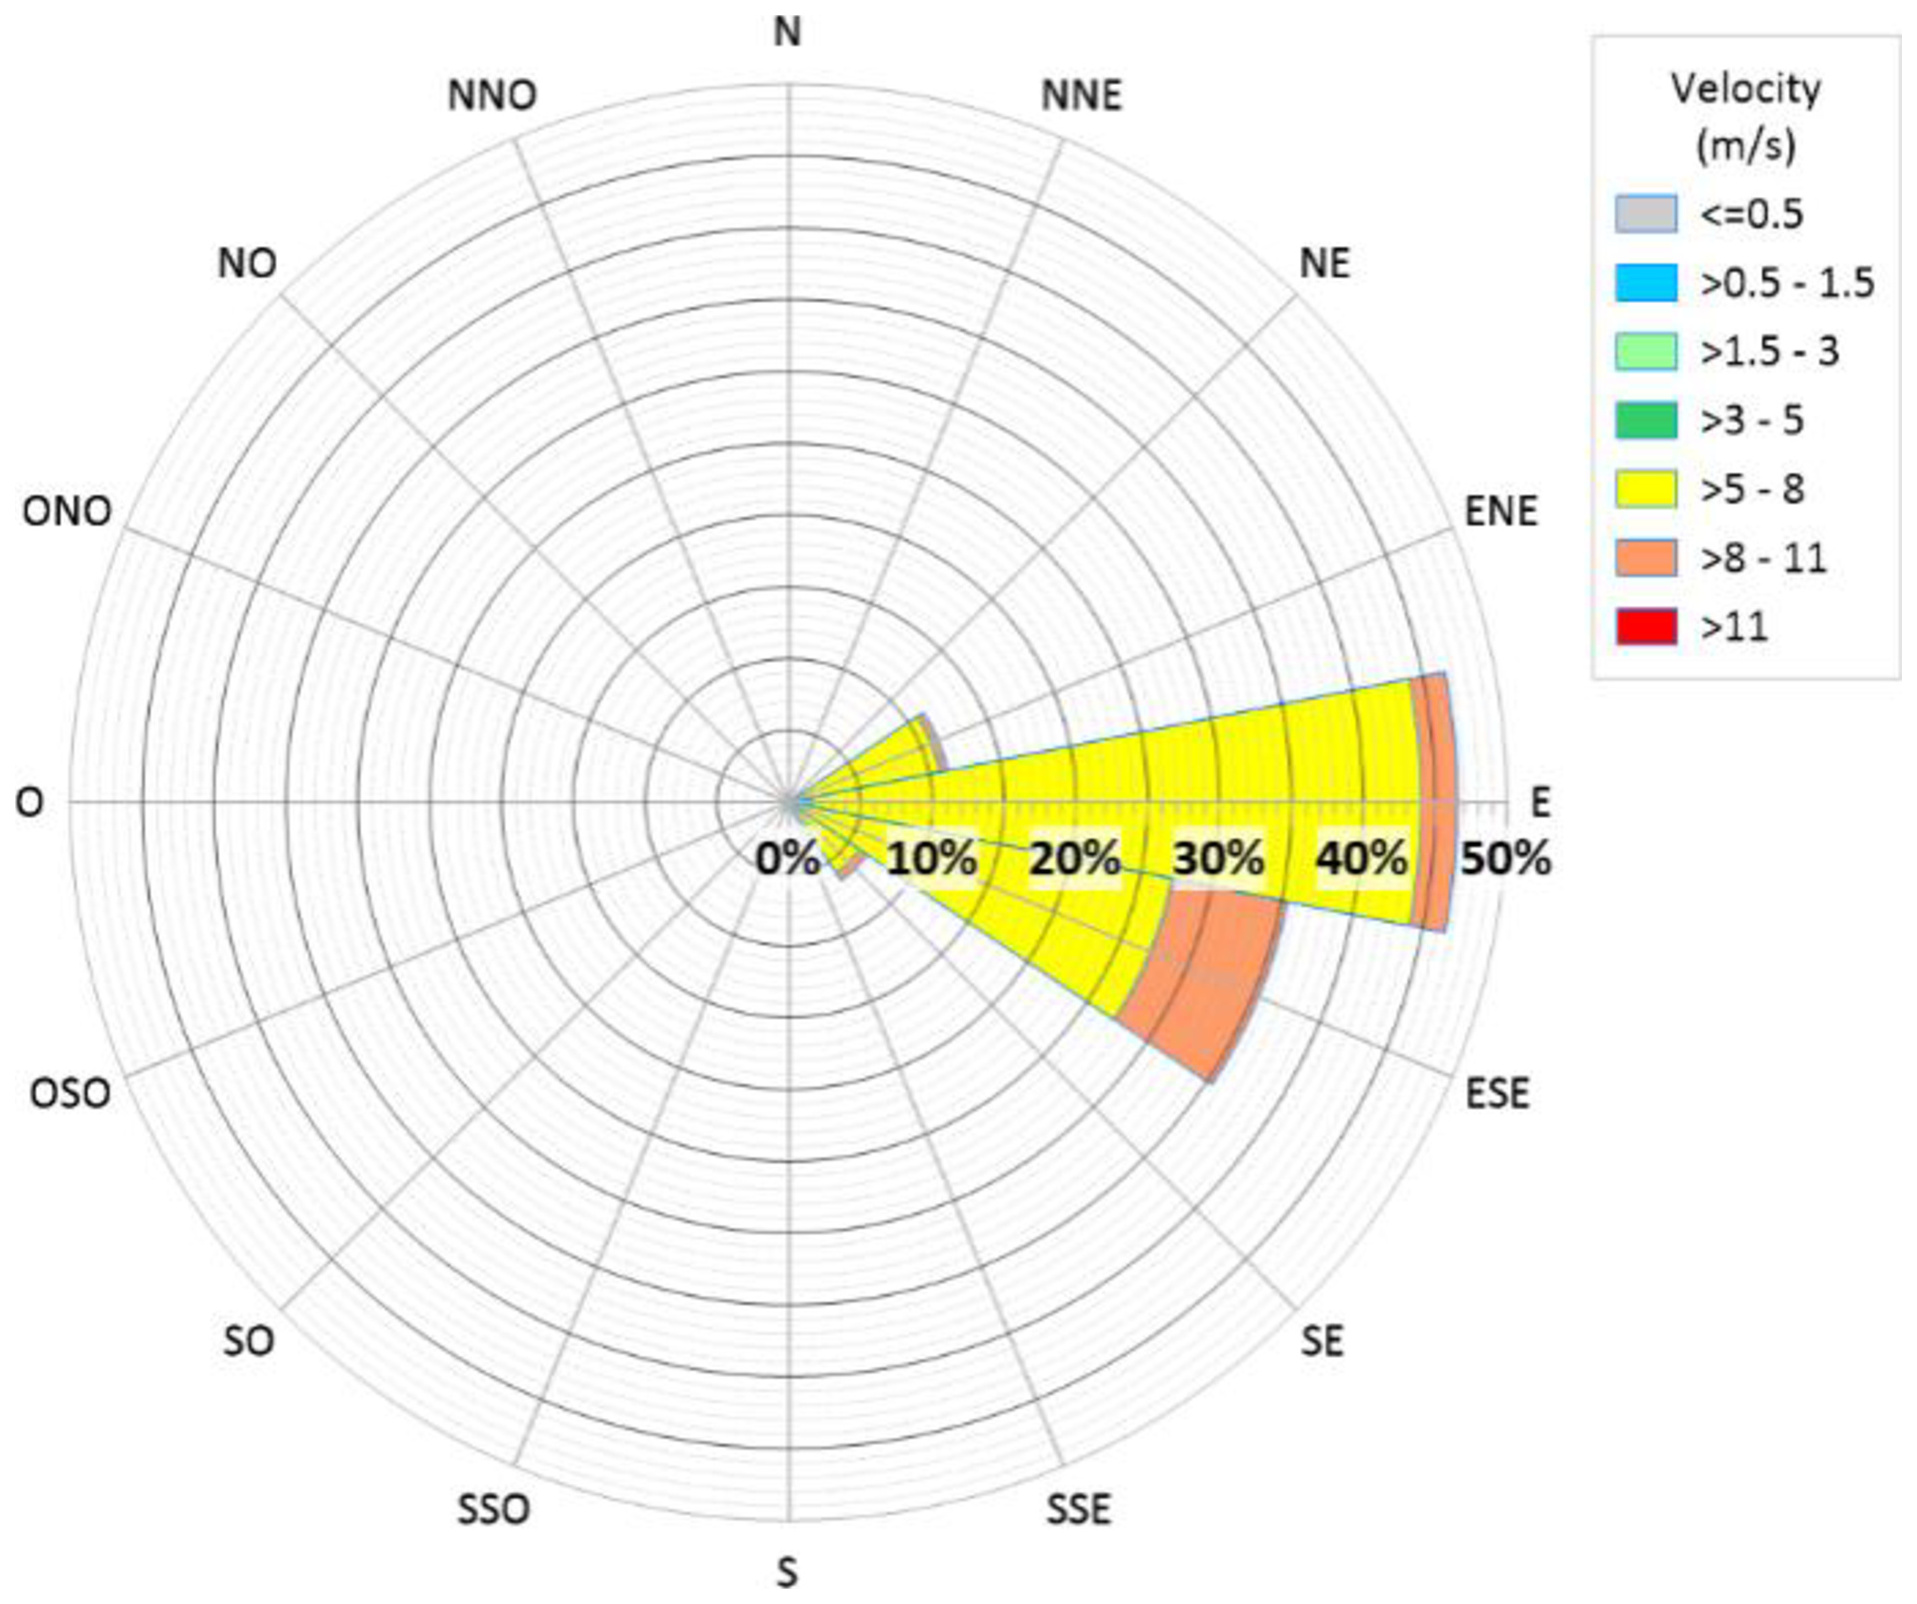
The wind rose (Figure 4) show a predominance of E/ESE winds, with maximum mean velocities of ≈ 9 m/s, a critical parameter for the generation of surface currents and initial oil slick trajectories (Stringari et al., 2012).
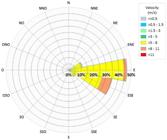
The hydrodynamic model was calibrated through comparison between simulated and observed tidal levels from the IBGE tide gauge at the Port of Mucuripe and current velocities measured by an ADCP deployed by Labomar/ Federal University of Ceará (UFC) approximately 2 km offshore at an average depth of 15 m.
ADCP data were originally collected at 50 vertical levels (spacing = 0.4 m) and, after quality filtering, they were used to obtain vertically averaged velocities comparable to model means.
Figure 5 illustrates the digital terrain model of the study area, showing the modeling domain with the finite element mesh, bathymetry, and FES2014, HYCOM, and ERA5 stations.
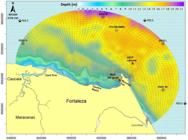
Finite element mesh with 1,638 elements, used for the discretization of the modeling domain and bathymetry interpolated from nautical charts No. 701 and 710 of the DHN. The map indicates the locations of the FES2014, ERA5, and HYCOM stations, used to generate model forcings. Additionally, the positions of the tide gauge and ADCP, used for model calibration, are shown.
Hydrodynamic Model
The 3D Hydrodynamic Model (HM) of SisBaHiA solves for the four primary prognostic variables of the circulation, namely the three velocity componentes u, v, w, and the free-surface elevation ζ. These variables are determined through a set of equations that ensure mass and momentum conservation in the water column: the incompressible continuity equation (Equation 1), the horizontal momentum equations under the hydrostatic approximation (Equations 2 and 3), and the vertically integrated continuity equation (Equation 4). This combination guarantees the consistency of vertical velocity profiles and provides the mathematical basis for three-dimensional simulations of circulation and contaminant transport (Rosman, 2007; Rollnic & Medeiros, 2013; Pereira et al., 2024).
In Equations 1-4, u, v and w represent the flow velocity components in the x, y and z directions, respectively. The variable ζ corresponds to the free surface elevation, while g denotes the acceleration due to gravity. The local fluid density is indicated by ρ, whereas ρ0represents the reference density, assumed constant. The parameter ϕ corresponds to the Earth’s angular rotation velocity in the local coordinate system, and θ is the latitude angle expressed in radians.
The SisBaHiA Wave Generation Model (WGO) is based on the classical spectral energy balance formulation and employs standard parameterizations (Pierson-Moskowitz and JONSWAP spectra), as detailed in the SisBaHiA Technical Reference (Rosman, 2025).
According to SisBaHiA Technical Reference (Rosman, 2025), for fully developed seas, the WGO adopts the Pierson-Moskowitz spectrum, while for developing seas, it employs the JONSWAP spectrum, characterized by the peak enhancement factor γ and frequency spread σ. The model incorporates empirical relationships linking wind and fetch to spectral parameters, such as the Phillips coefficient α as a function of fetch X, and the friction velocity u* (Equation 5).
When ρair is air density and wind stress is given by Equation 6.
When é 10-meters wind speed and CD is the wind drag coefficient, parameterized according to Wu (1980), as implemented in SisBaHiA. CD is also considered an important calibration parameter of the model. SisBaHiA allows the application of a calibration factor (cW) to adjust CD within reasonable limits, typically between 0.8 and 1.2, and potentially ranging from 0.5 to 2, depending on the need to match observed data.
The WGO computes key wave parameters, significant wave height (Hs) and peak period (Tp), as well as bottom orbital stresses (τ0) in order to capture the influence of short‑period wind‑waves on bottom shear and near‑bed mixing. These outputs were then provided as forcings to the hydrodynamic and transport model to ensure consistent treatment of wave‑induced processes in the study domain. The full set of equations, constants, and numerical implementation details are documented in the SisBaHiA Technical Reference v.12b (Rosman, 2025), which were used as the methodological basis for the WGO implementation.
WGO was executed in coupling with the hydrodynamic model, using identical wind‑time series (with a continuous wind duration of 12 h adopted to represent the local breeze and allow for fetch development).
The quality of the results of tide levels and current velocity was assessed using four statistical metrics: coefficient of determination (R2), root mean square error (RMSE), percent bias (PBIAS), and the Coherence Index between Measured and Calculated Values (CIM). R2, RMSE, and CIM are widely used to validate the accuracy of hydrodynamic models in coastal and estuarine zones (Prasad et al., 2020; French-McCay et al., 2021; Aldarias et al., 2020; Carvalho et al., 2024). PBIAS, frequently applied in the calibration and validation of hydrological and meteorological models, quantifies the average tendency of simulated values to underestimate or overestimate observed counterparts (Moriasi et al., 2015; Durap, 2025). These metrics were calculated according to Equations 7-10.
Lagrangian transport model
Lagrangian transport models (LTM) track the movement of particles representing the substance under study, avoiding common issues in Eulerian formulations, such as numerical diffusion and mass conservation inconsistencies (Gurgel, 2016; Góis, 2008; Rosman, 2025; Rodrigues, 2023).
Complementarily, probabilistic oil spill models were employed, based on the stochastic repetition of past metoceanographic scenarios, generating multiple simulated trajectories to capture environmental variability and estimate probabilities of oil contacting the coastline (Guo, 2017; Liubartseva et al., 2023). This methodology involves: (i) defining the hypothetical scenario (oil type, location, release mode, and initial conditions); (ii) simulating the trajectory considering advection, diffusion, weathering, and stranding; and (iii) statistically aggregating results into probability maps, arrival times, and mass balances (Liubartseva et al., 2021, 2023).
In the LTM, particles that cross the open boundary are removed (considered lost), while particles reaching the shoreline are subject to partial retention governed by an absorption coefficient (AC) assigned according to the Shoreline Sensitivity Indices (SSI) from the Atlas of Environmental Sensitivity to Oil (Brasil, 2004). The adopted values are reported in Table 2. For the coast of Fortaleza, the shoreline characterization applied in this work assigned medium-sand beaches to the majority of the littoral (AC = 0.30). Coastal structures (breakwaters and groynes) were characterized as rocky shores (AC = 0.05), and the estuarine reaches of the Cocó and Ceará rivers were classified as mangroves (AC = 0.60). These assignments were used to govern the probabilistic retention of particles on contact with the coast during transport simulations.
The main weathering processes (evaporation, droplet dispersion, and, to a lesser extent, emulsification) were simulated using the ADIOS2 model (Lehr et al., 2002; Elizaryev et al., 2018). In this model, the weathering processes are parameterized as a function of oil type, wind intensity, air and water temperatures, and mean current velocity. For the simulation, based on operational data from Lubnor, the Bachaquero crude oil (API 15.1) was selected from the ADIOS2 database. This oil has a density of 963 kg/m3 at 29 °C, and its physicochemical properties directly influence the morphology and decay rate of the oil slick over time. The environmental conditions adopted in the simulation included an average wind speed of 7 m/s and a water temperature of 29 °C, parameters that affect the evaporation, dispersion, and emulsification rates computed by the model.
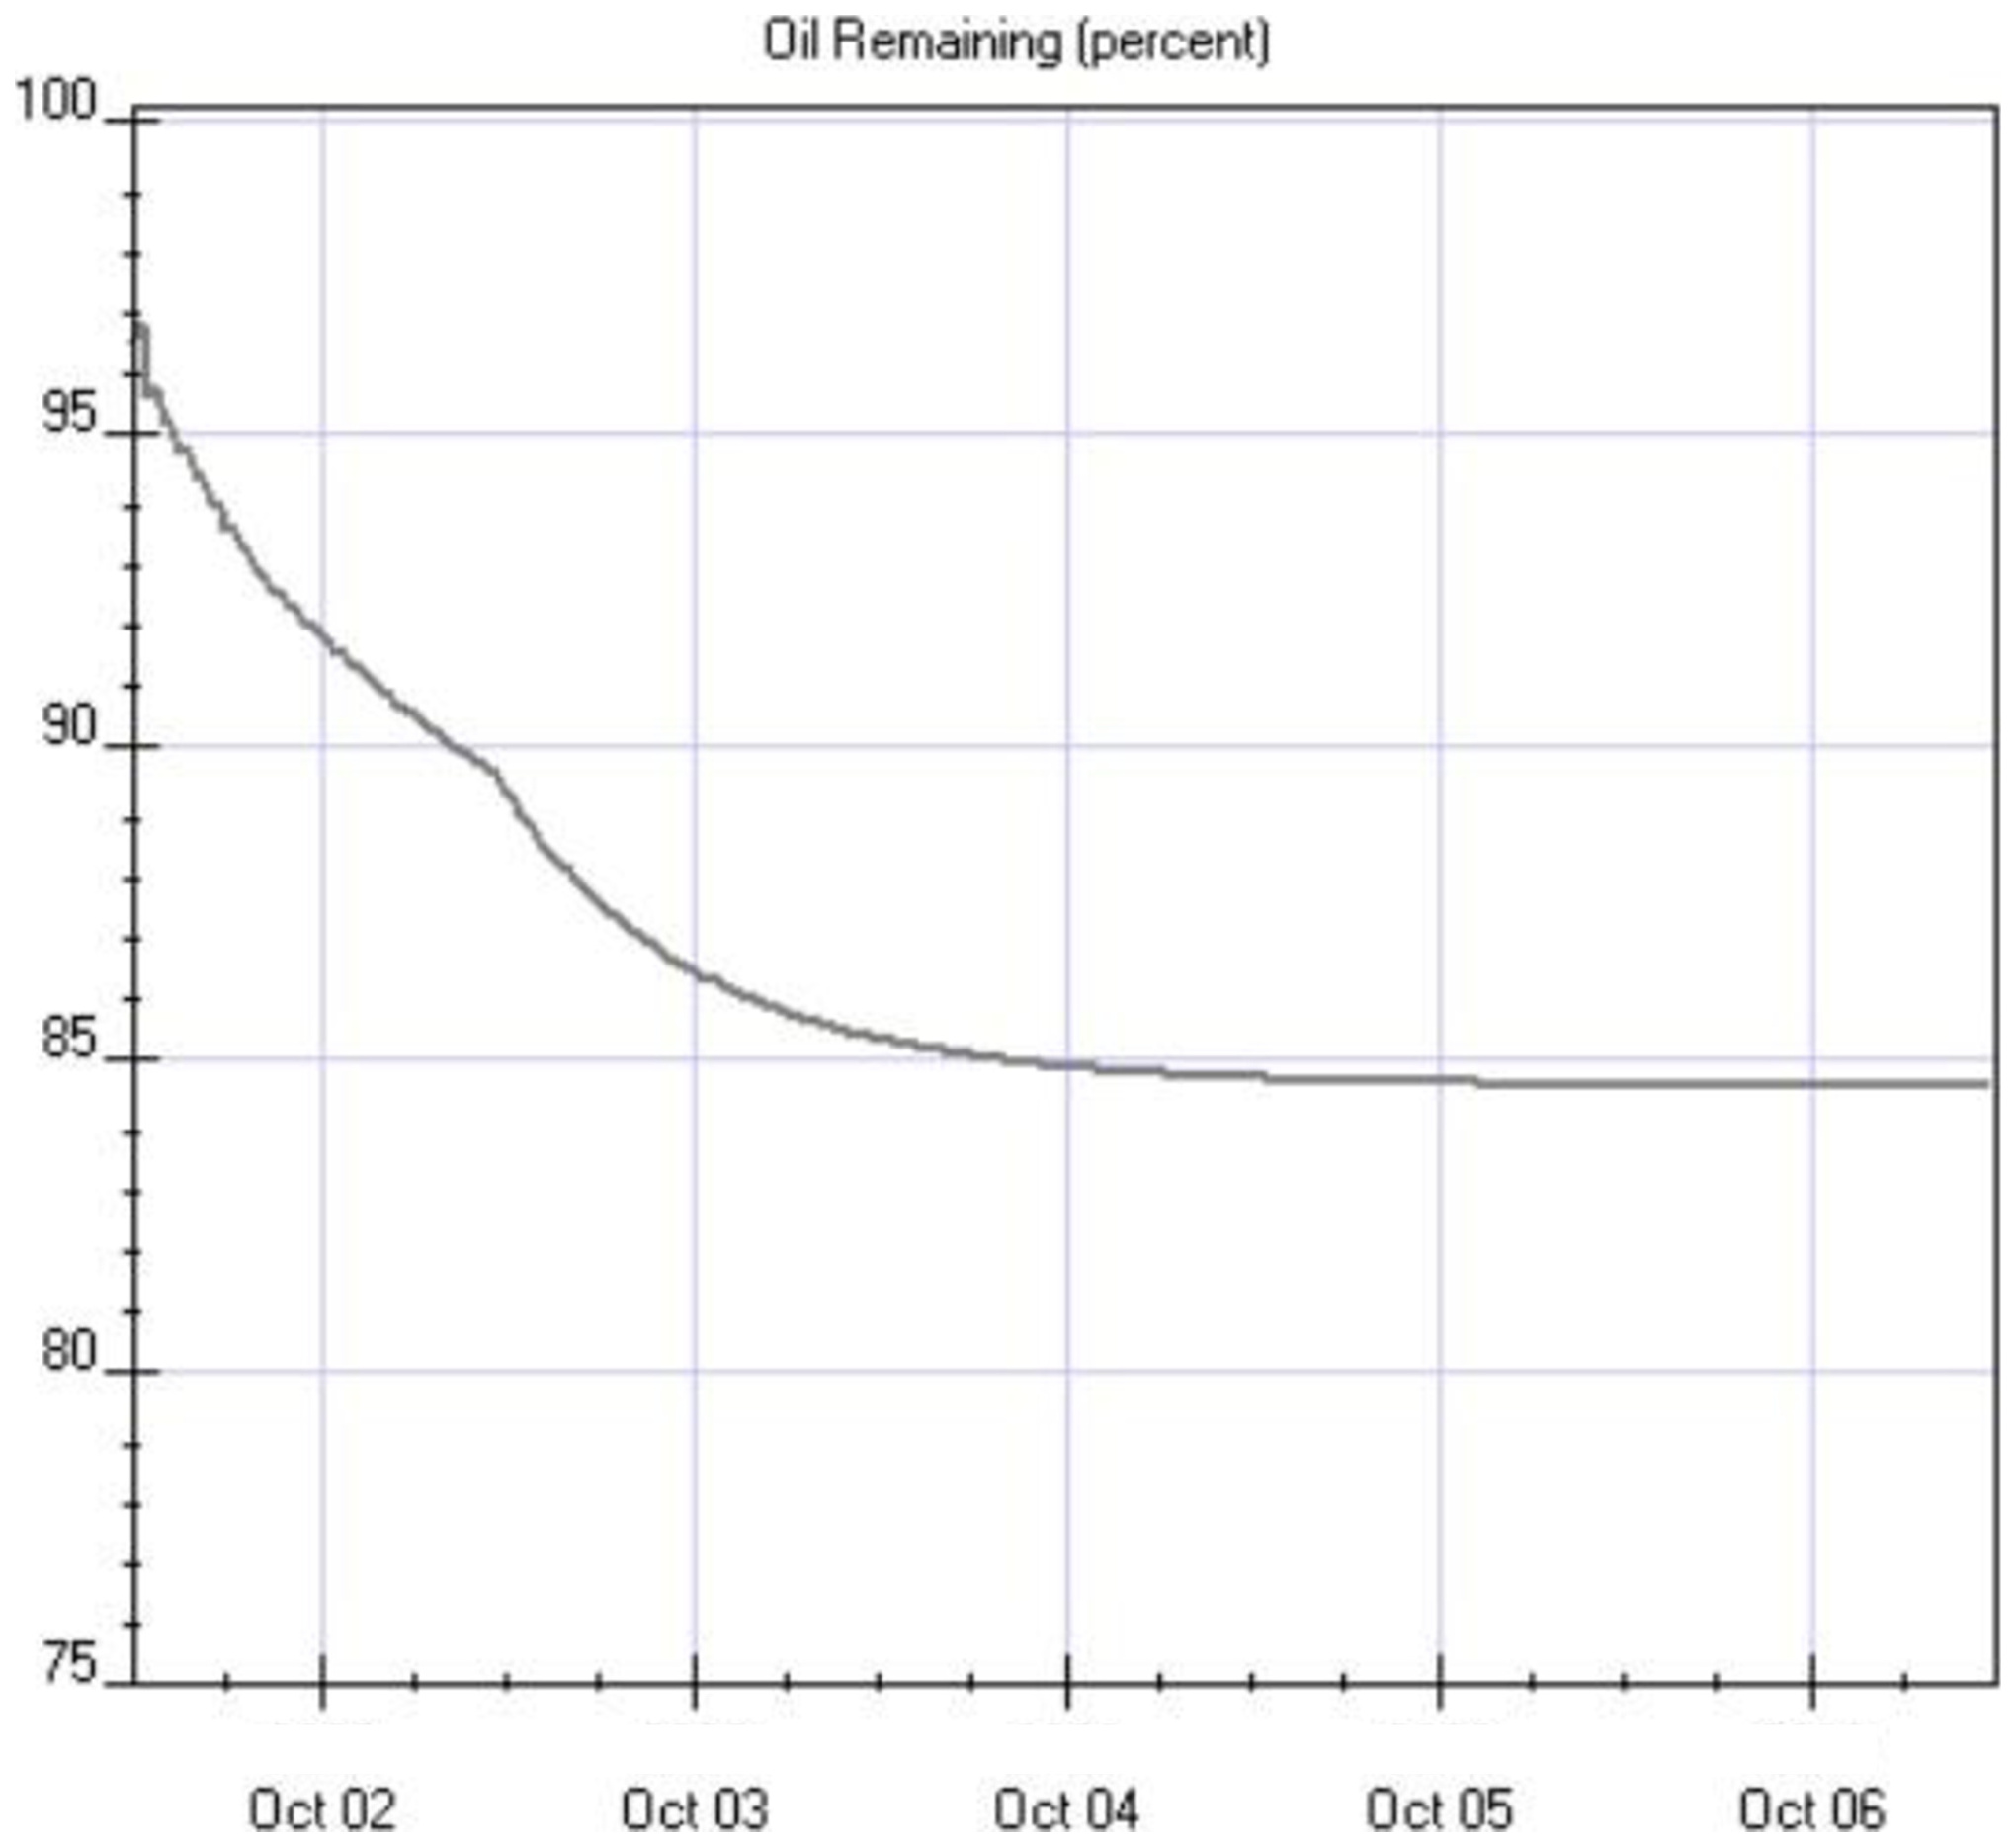
The oil mass decay curve obtained from ADIOS2 (Figure 6), can be directly incorporated into the SisBaHiA LTM. By integrating this mass-loss profile into the LTM, the model simultaneously represents both advective-diffusive transport processes and weathering mechanisms, ensuring that each virtual particle decreases its mass according to the simulated physicochemical and environmental conditions.
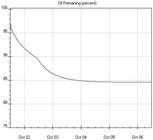
Oil decay curve obtained from the ADIOS2 program, indicating that the remaining volume after 5 days is approximately 85%.
In this study, a hypothetical oil spill was defined to represent a critical simulation scenario for environmental impact assessment and response planning. Spill scenarios were established according to the criteria of CONAMA Resolution No. 398/2008, which determines that the response capacity of port facilities must consider small (8 m3), medium (200 m3), and worst-case discharges (Brasil, 2008). As a hypothetical worst-case scenario, a constant spill of 1,000 m3 over 24 hours was defined. The initial oil slick area was estimated using Fay’s (1971) spreading theory, as expressed in Equation 9.
To incorporate the temporal and environmental variability inherent to oil spill events, a Monte Carlo simulation approach was employed for each defined scenario. For this purpose, 100 hypothetical oil releases were generated, each initiated at randomly distributed times within the simulation time window. Each hypothetical spill followed the same configuration: the selected oil type and its mass decay curve derived from ADIOS2 were applied, so that the SisBaHiA simultaneously implemented the processes of advection, diffusion, and weathering for each particle. The simulation sequence consisted of: (1) Random selection of the start time for each pollutant source was performed in a spreadsheet and subsequently used as input for the LTM; (2) release of particles at the defined source location; (3) Solution of the LTM, with tracking of particle trajectories and mass loss according to wind, current, and temperature conditions.
Each pollutant source was simulated as an individual event and, at the end of each set of 100 simulations, the results were aggregated to produce probabilistic distributions of the parameters of interest. Through descriptive statistics and probability maps of contamination, it became possible, for example, to determine the time intervals of highest risk for oil arrival and to identify coastal areas with the greatest likelihood of contact with the slick. This stochastic implementation transforms inherent uncertainties into quantifiable information, supporting risk analysis and the planning of emergency responses in port and environmental management (Liubartseva et al., 2021, 2023).
Probability maps of oil slick trajectories were generated within the modeling domain at 3, 6, 12, and 24 hours after the spill event. This approach is particularly valuable for identifying areas with the highest susceptibility to contact with the slick, as well as for estimating the response times required for contingency operations in order to maximize their effectiveness. In addition, transport maps of the oil slick from a representative spill were produced, visually depicting the movement of the pollutant over time.
RESULTS AND DISCUSSION
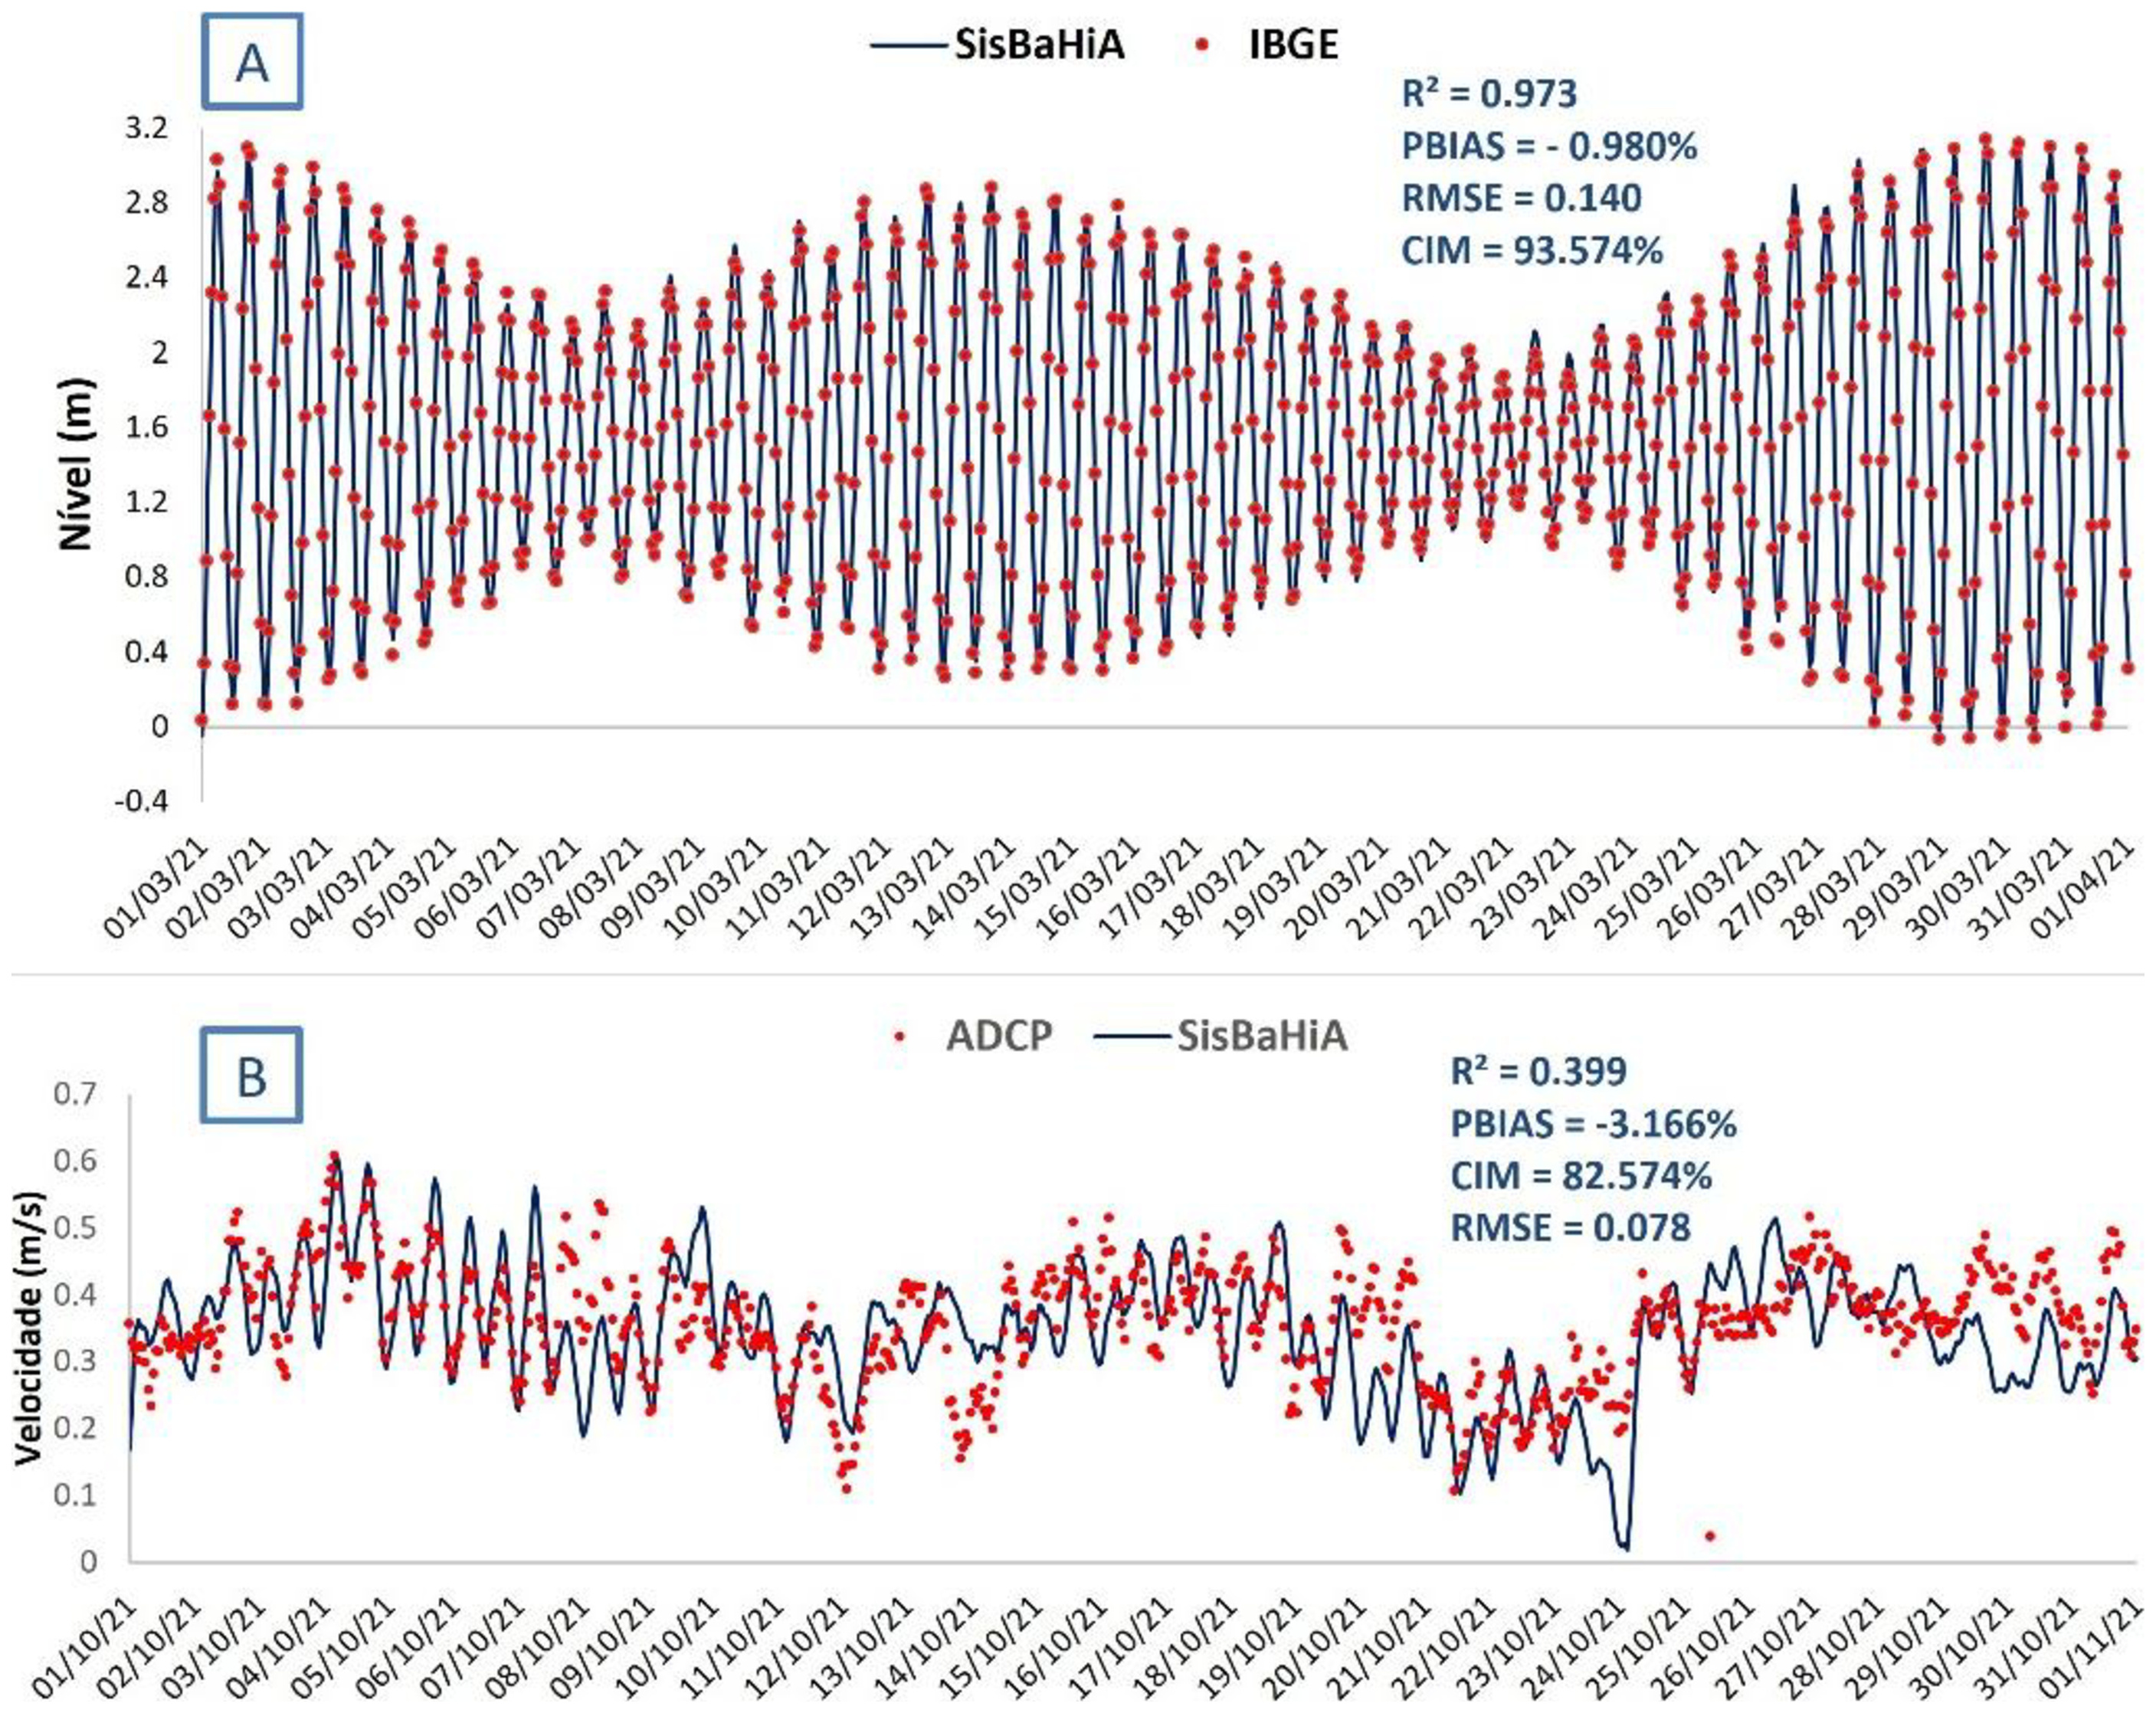
The time series of free surface elevation and current intensity are presented jointly in Figure 7. The domain exhibits a semidiurnal mesotidal regime (amplitudes ≈ 1.5-3.0 m).
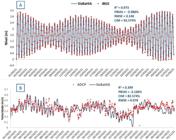
To achieve the presented results, the model calibration involved reducing the surface roughness to 50 % of its initial value and adopting a wind drag coefficient (CD) of 1.4, which are critical parameters to adjust the hydrodynamic response to observed conditions. For free surface elevation calibration, the hydrodynamic model performed well: R2 = 0.973; PBIAS = −0.980%; RMSE = 0.140 m; CIM = 93.574%, indicators that place the calibration at an excellent level according to applied references (Moriasi et al., 2015; Williams & Esteves, 2017; Carvalho et al., 2024; Durap, 2025). These results indicate an adequate representation of large-scale forcings controlling local sea level.
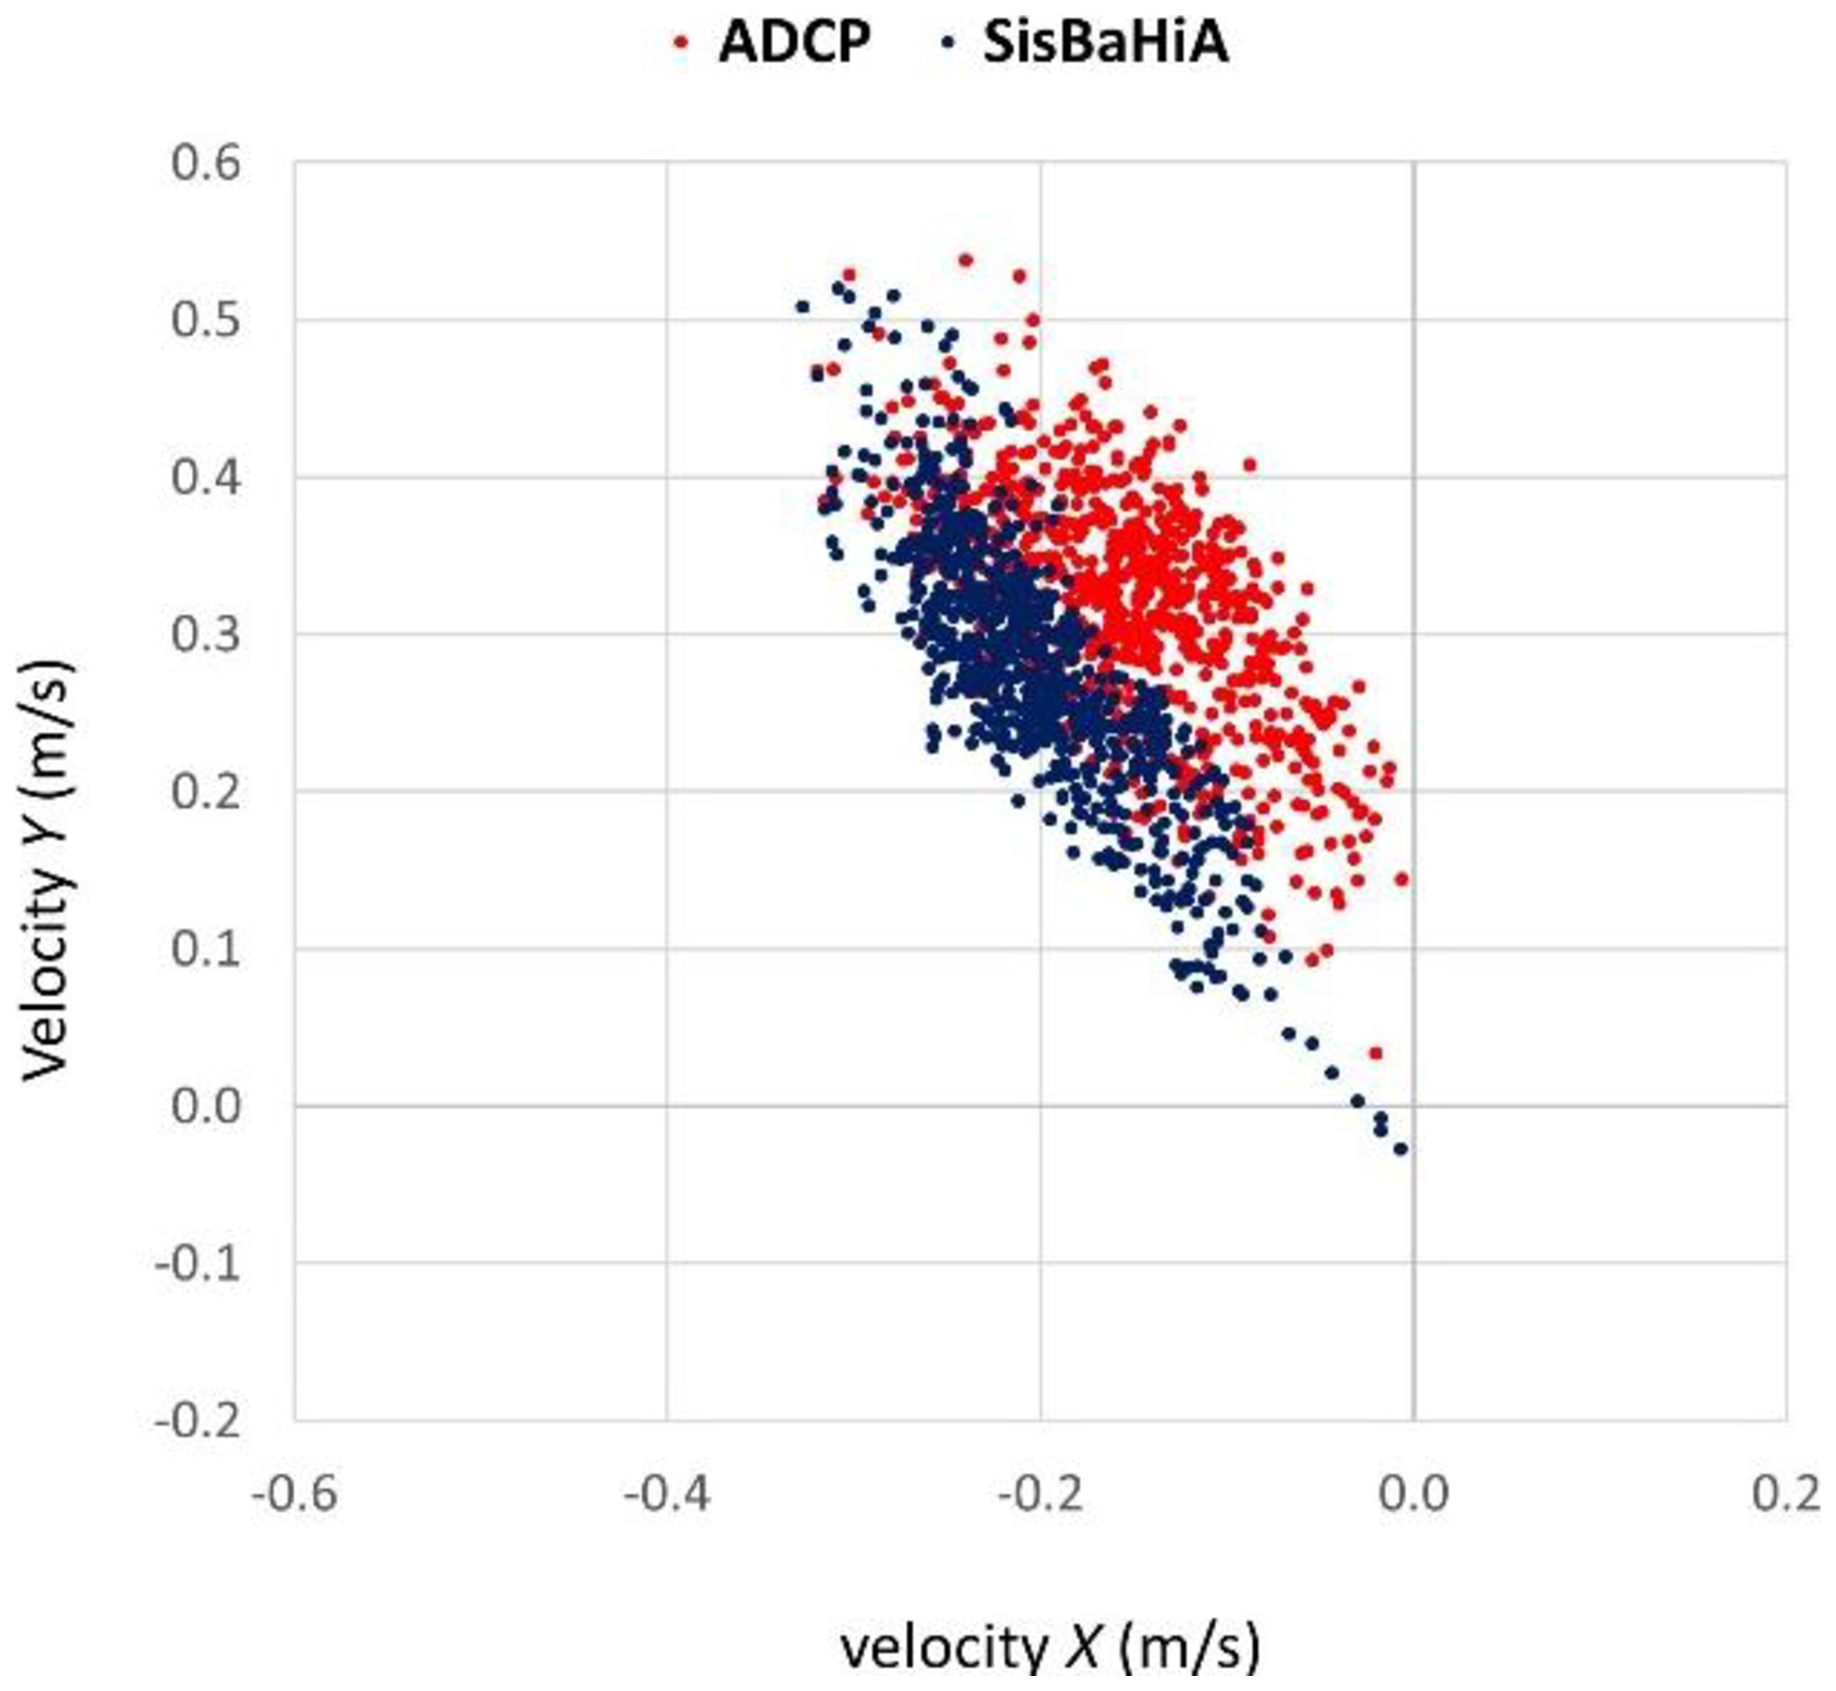
The evaluation of current velocities also yielded highly satisfactory performance metrics. The mean percent bias (PBIAS = –3.166%) indicates a slight underestimation, still within the excellent performance criteria of Moriasi et al. (2015). The RMSE of 0.078 m/s represents a moderate absolute error, consistent with current models of satisfactory accuracy, while the Coherence Index (CIM = 80.126%) indicates that approximately 80% of the temporal pattern of the series was correctly reproduced, reflecting relatively good structural coherence (Moriasi et al., 2015; Williams & Esteves, 2017; Carvalho et al., 2024; Durap, 2025). The current ellipses (Figure 8) show a similar directional trend between the model and ADCP measurements.
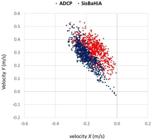
Figure 8 indicates the agreement between the SisBaHiA simulations and ADCP observations, particularly regarding the dominant flow direction and the overall variability of the currents. Although a slight underestimation of current magnitudes is observed, as indicated by the negative PBIAS, the similar orientation and dispersion of the ellipses suggest that the model adequately represents the directional structure of the local circulation. This result indicates that the main hydrodynamic forcing mechanisms are reasonably captured, supporting the application of the calibrated model to current-driven transport analyses, such as oil spill dispersion.
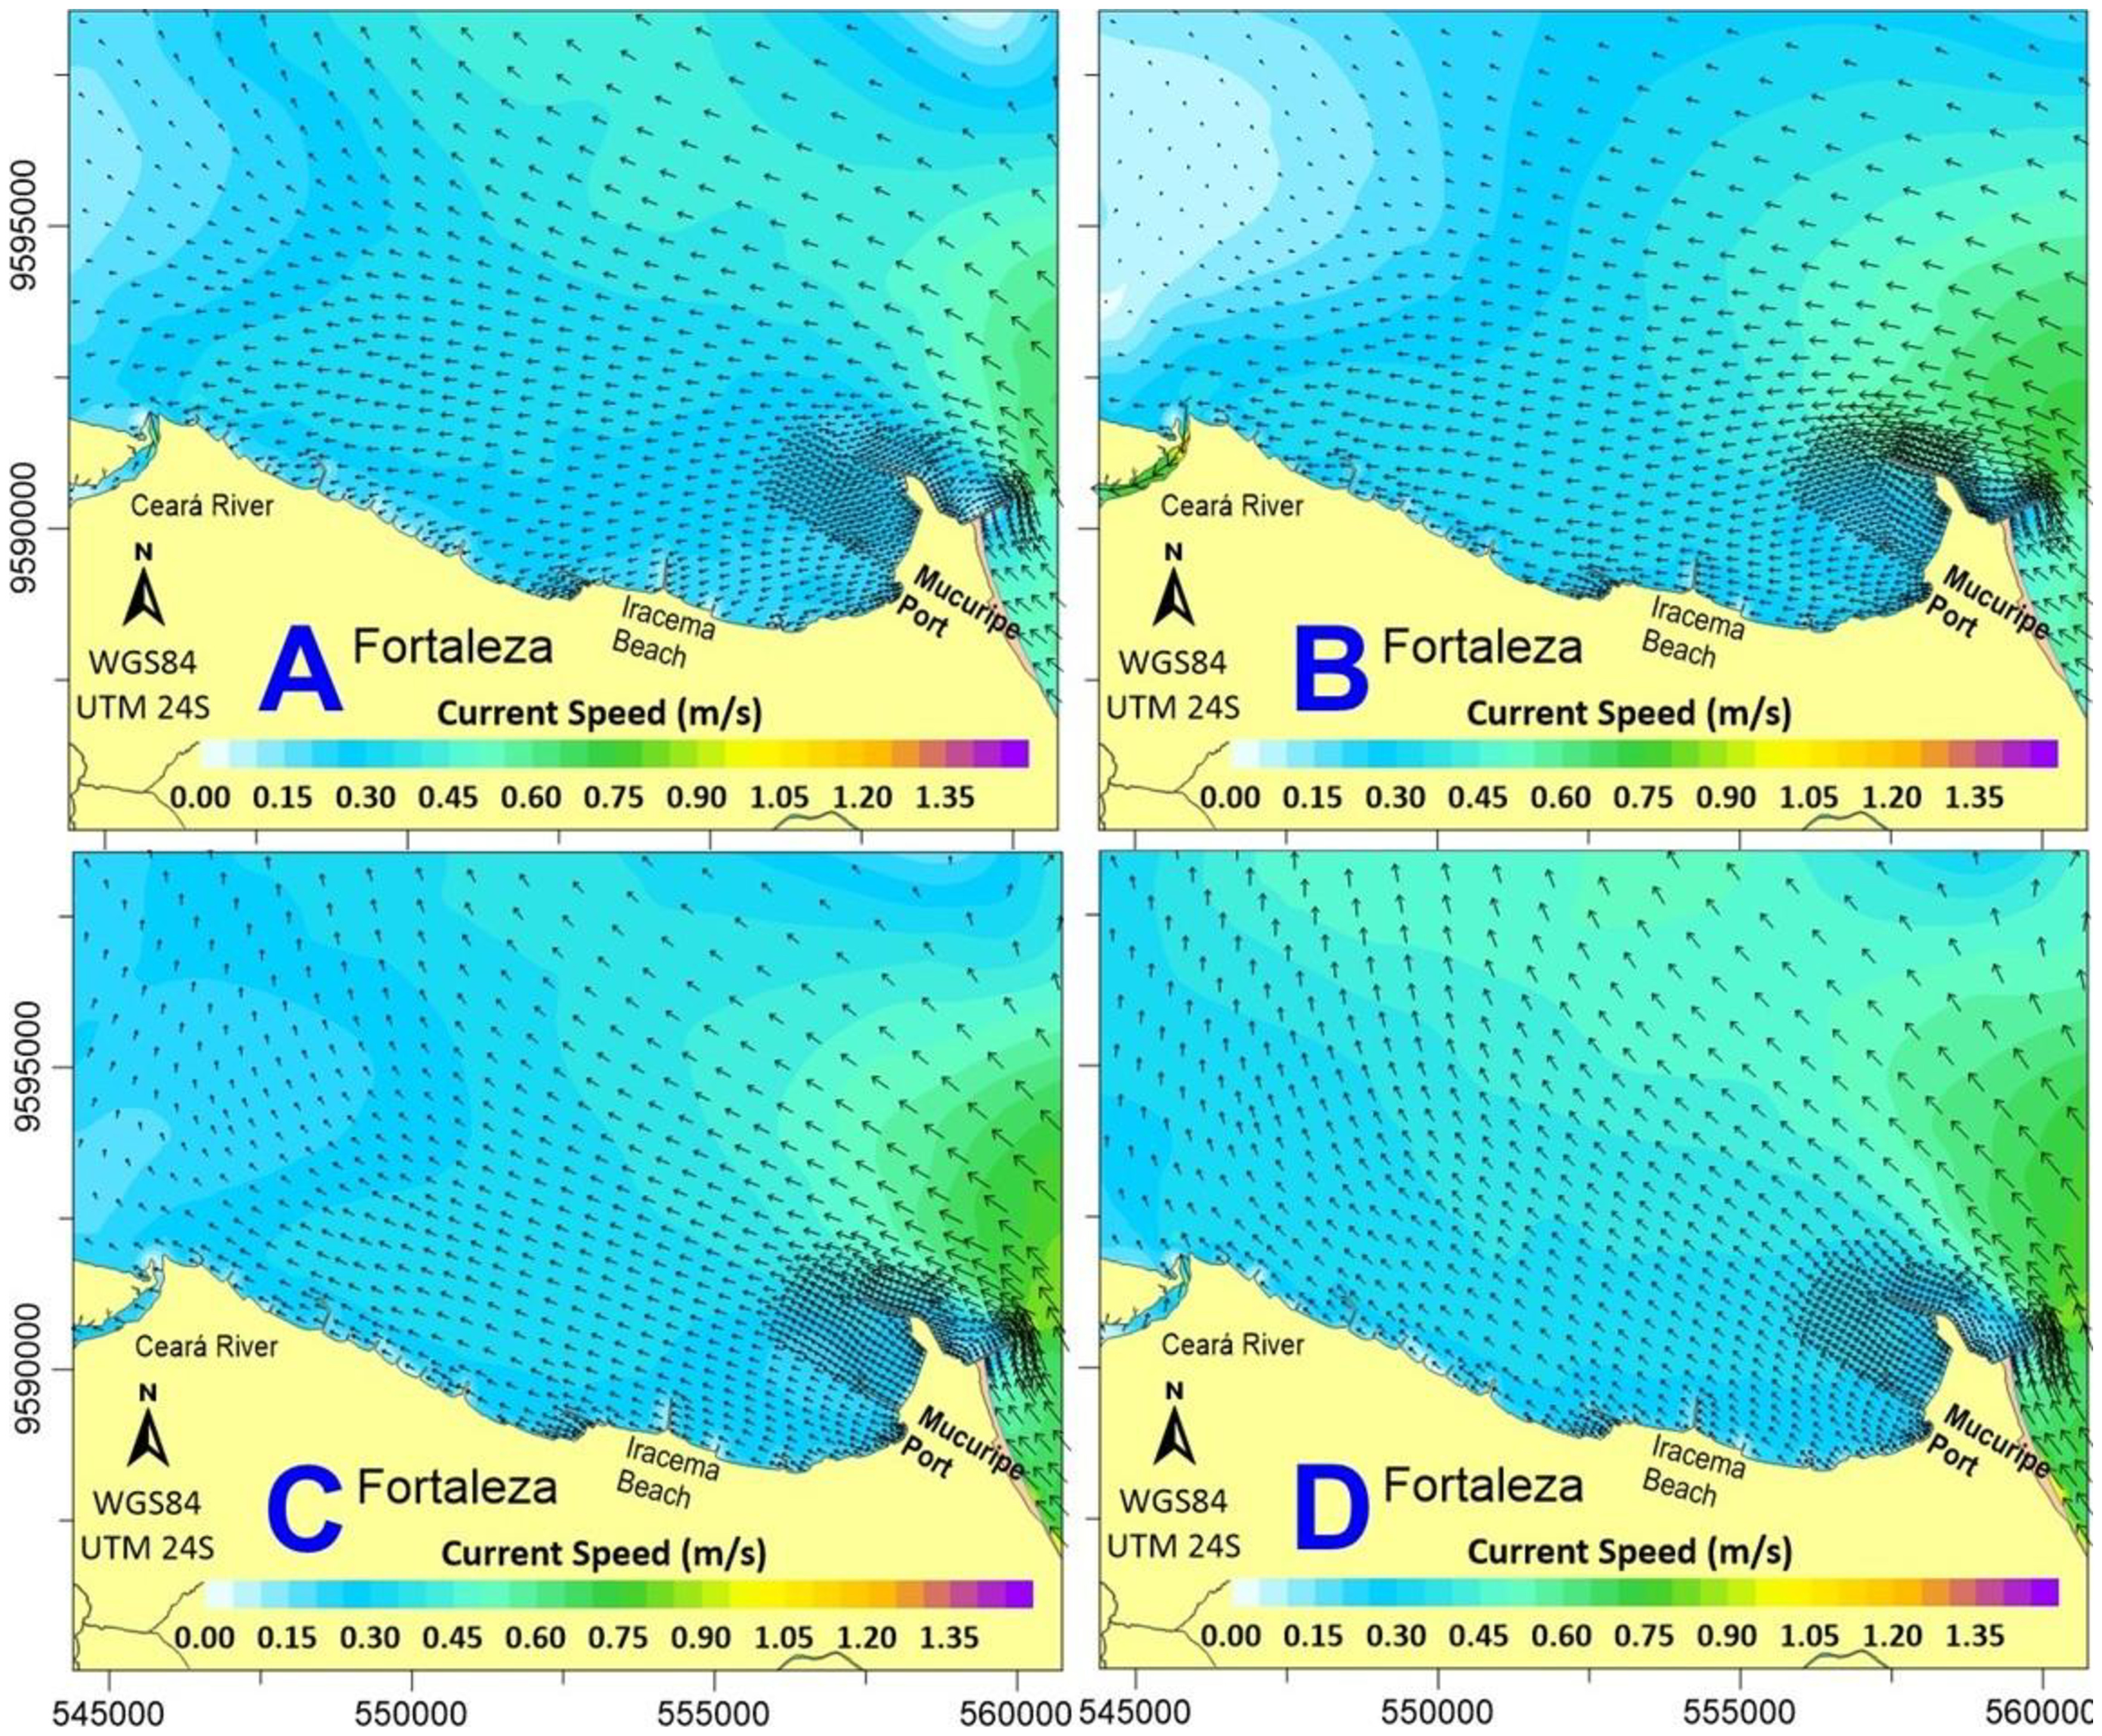
The qualitative characterization of circulation at different tidal phases (Figure 9) indicates a predominant westward direction, the influence of the Titan Breakwater on local port dynamics (reducing current intensity), and a barotropic nature dominated by tides and wind. This pattern is consistent with previous studies in the region (Pereira & Rosman, 2009; Silva et al., 2017; Pereira et al., 2015, 2021, 2024). Figure 9 shows the spatial distribution of surface currents during October 2021, illustrating their variability across the different phases of the spring tide.
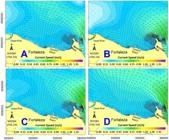
Hydrodynamic circulation pattern for typical spring low tides (A), mid-rising spring tides (B), spring high tides (C), mid-falling spring tides (D) in October 2021.
Stochastic analysis of the oil transport model
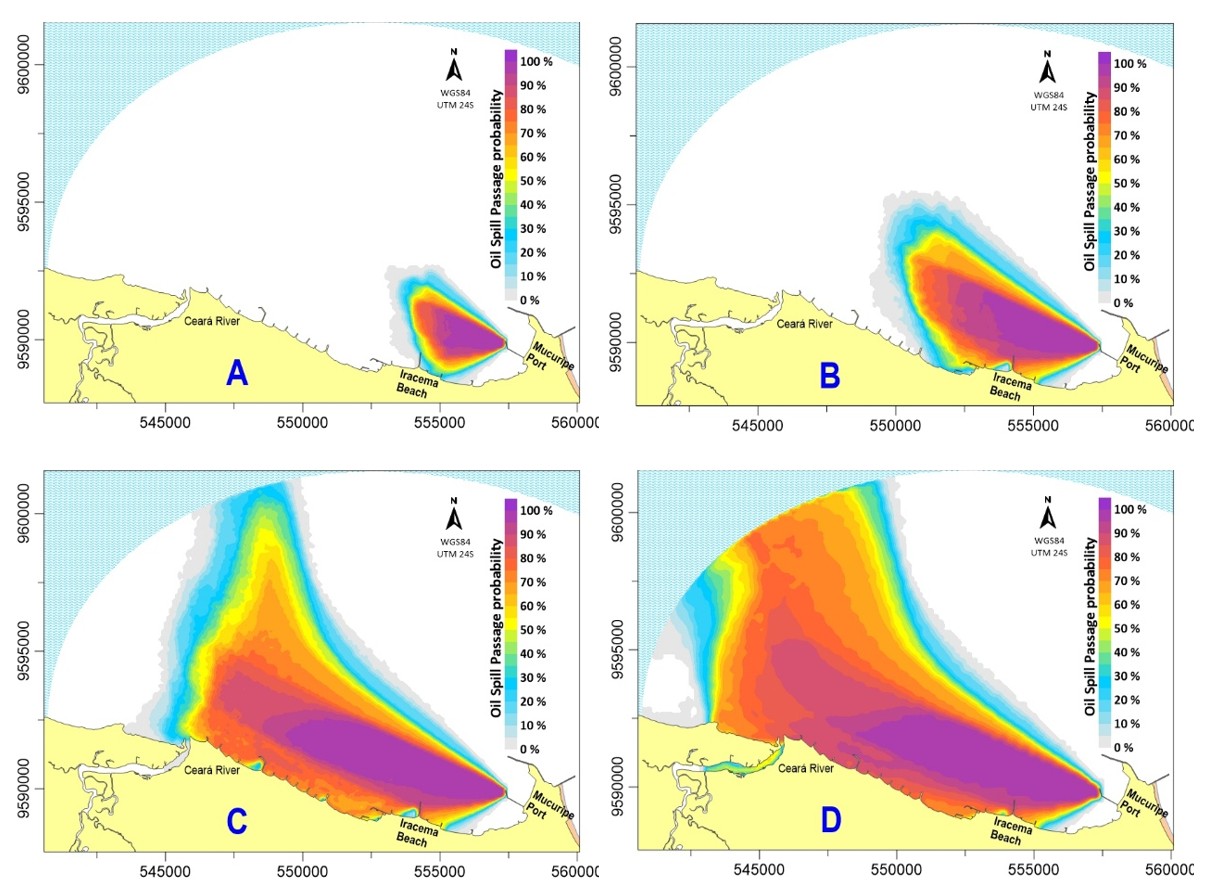
The maps shown in Figure 10 depict the probability of oil slick passage within the modeling domain, considering any of the 100 randomly simulated spills incorporated into the LTM. These maps include frequency contour lines, indicating the areas with the highest likelihood of contamination by the pollutant after specific time intervals following the spill. They provide a valuable tool for identifying priority protection zones and for developing emergency response plans in port operation areas.
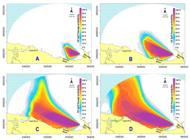
Probability of occurrence of the heavy oil slick at intervals of 3 h (A), 6 h (B), 12 h (C), and 24 h (D) after the beginning of the constant spill (24 hours) of 1,000 m3 in the month of October.
Rapid coastal advection was observed, with approximately 30% probability of shoreline contact within the first 3 hours after the spill. This probability exceeds 60% after 6 hours along a vast stretch of coastline. By 24 hours, probabilities surpass 70% along nearly the entire coast west of the port, including the Ceará River estuary (a highly sensitive area). These results indicate maximum criticality, with a high potential to impact mangroves and the local estuarine biota, necessitating prompt response actions.
In all simulations, the plume advected predominantly toward the western portion of the port, with no significant projected impact east of the Titan Breakwater. This pattern is explained by the prevailing current and wind orientation in October, which favors west/northwest transport while inhibiting penetration toward the opposite side.
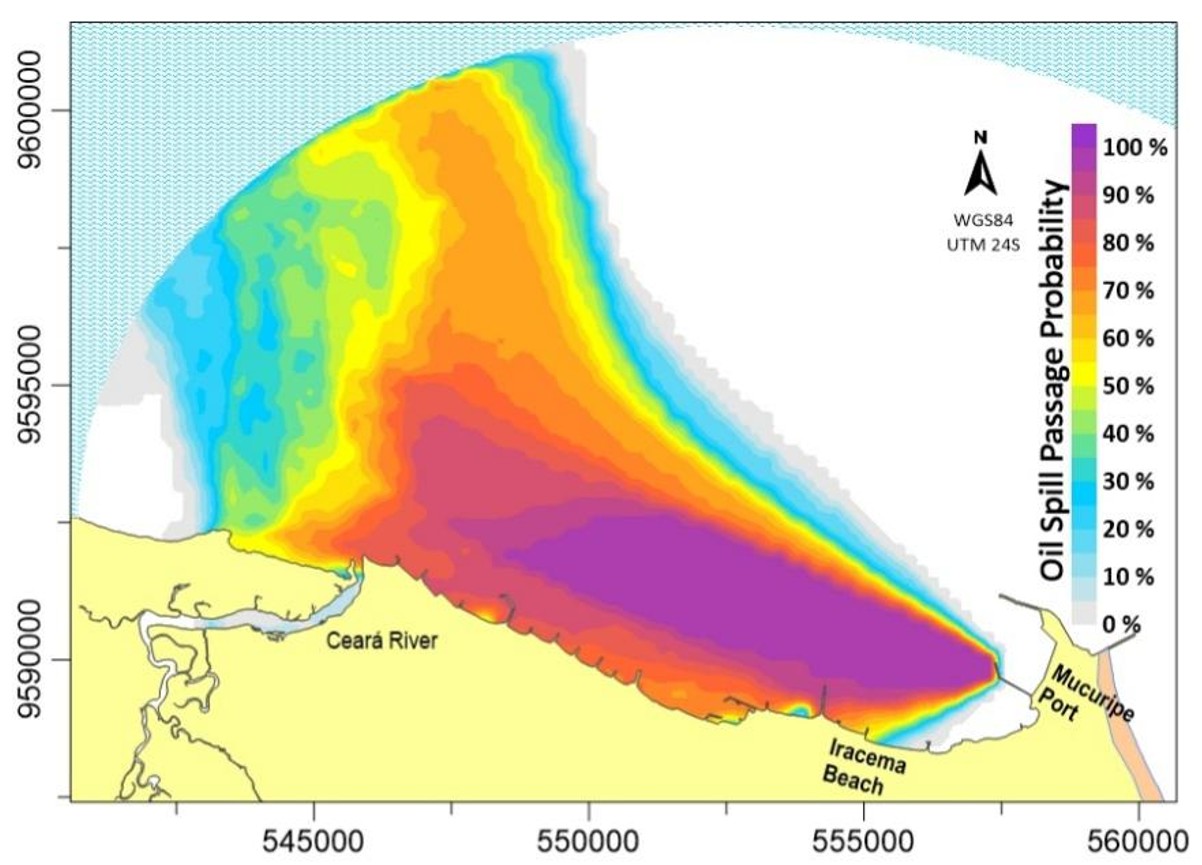
For regulatory assessment, the oil and grease limit established by CONAMA Resolution No. 393/2007 was adopted (monthly mean concentration = 29 mg/L; daily maximum = 42 mg/L) (Brasil, 2007). The conversion between film thickness and concentration was performed following Rosman (2000), who proposed a standardized approach for reporting oil spill study results, whereby 29 mg/L corresponds to an approximate thickness of 0.029 mm. Probability maps of exceeding this threshold are presented in Figure 11.
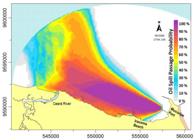
Probability of occurrence of the heavy oil slick, with concentrations exceeding 29 mg/L, during the month of October.
According to Breaker & Bratkovich (1993), Jones et al. (2016), and Kuang et al. (2023), stronger wind regimes, such as those prevailing in October, enhance wind-driven drift, promoting a faster and more surface-parallel displacement of the slick along the coast, which increases the spatial extent of contamination. Conversely, under weaker wind conditions, the reduction in wind stress favors greater surface retention and localized recirculation, as also reported by these authors. Comparable studies using probabilistic models (e.g., MEDSLIK-II, MOHID) also indicate strong seasonal sensitivity in lateral dispersion and plume direction (Correia Lima et al., 2025).
Deterministic analysis of the oil transport model
From the stochastic database (100 sources generated by the Monte Carlo model), the event with the largest extent of impacted shoreline was selected for deterministic analysis. This criterion prioritizes scenarios that best represent the potential contamination to be mitigated in response strategies.
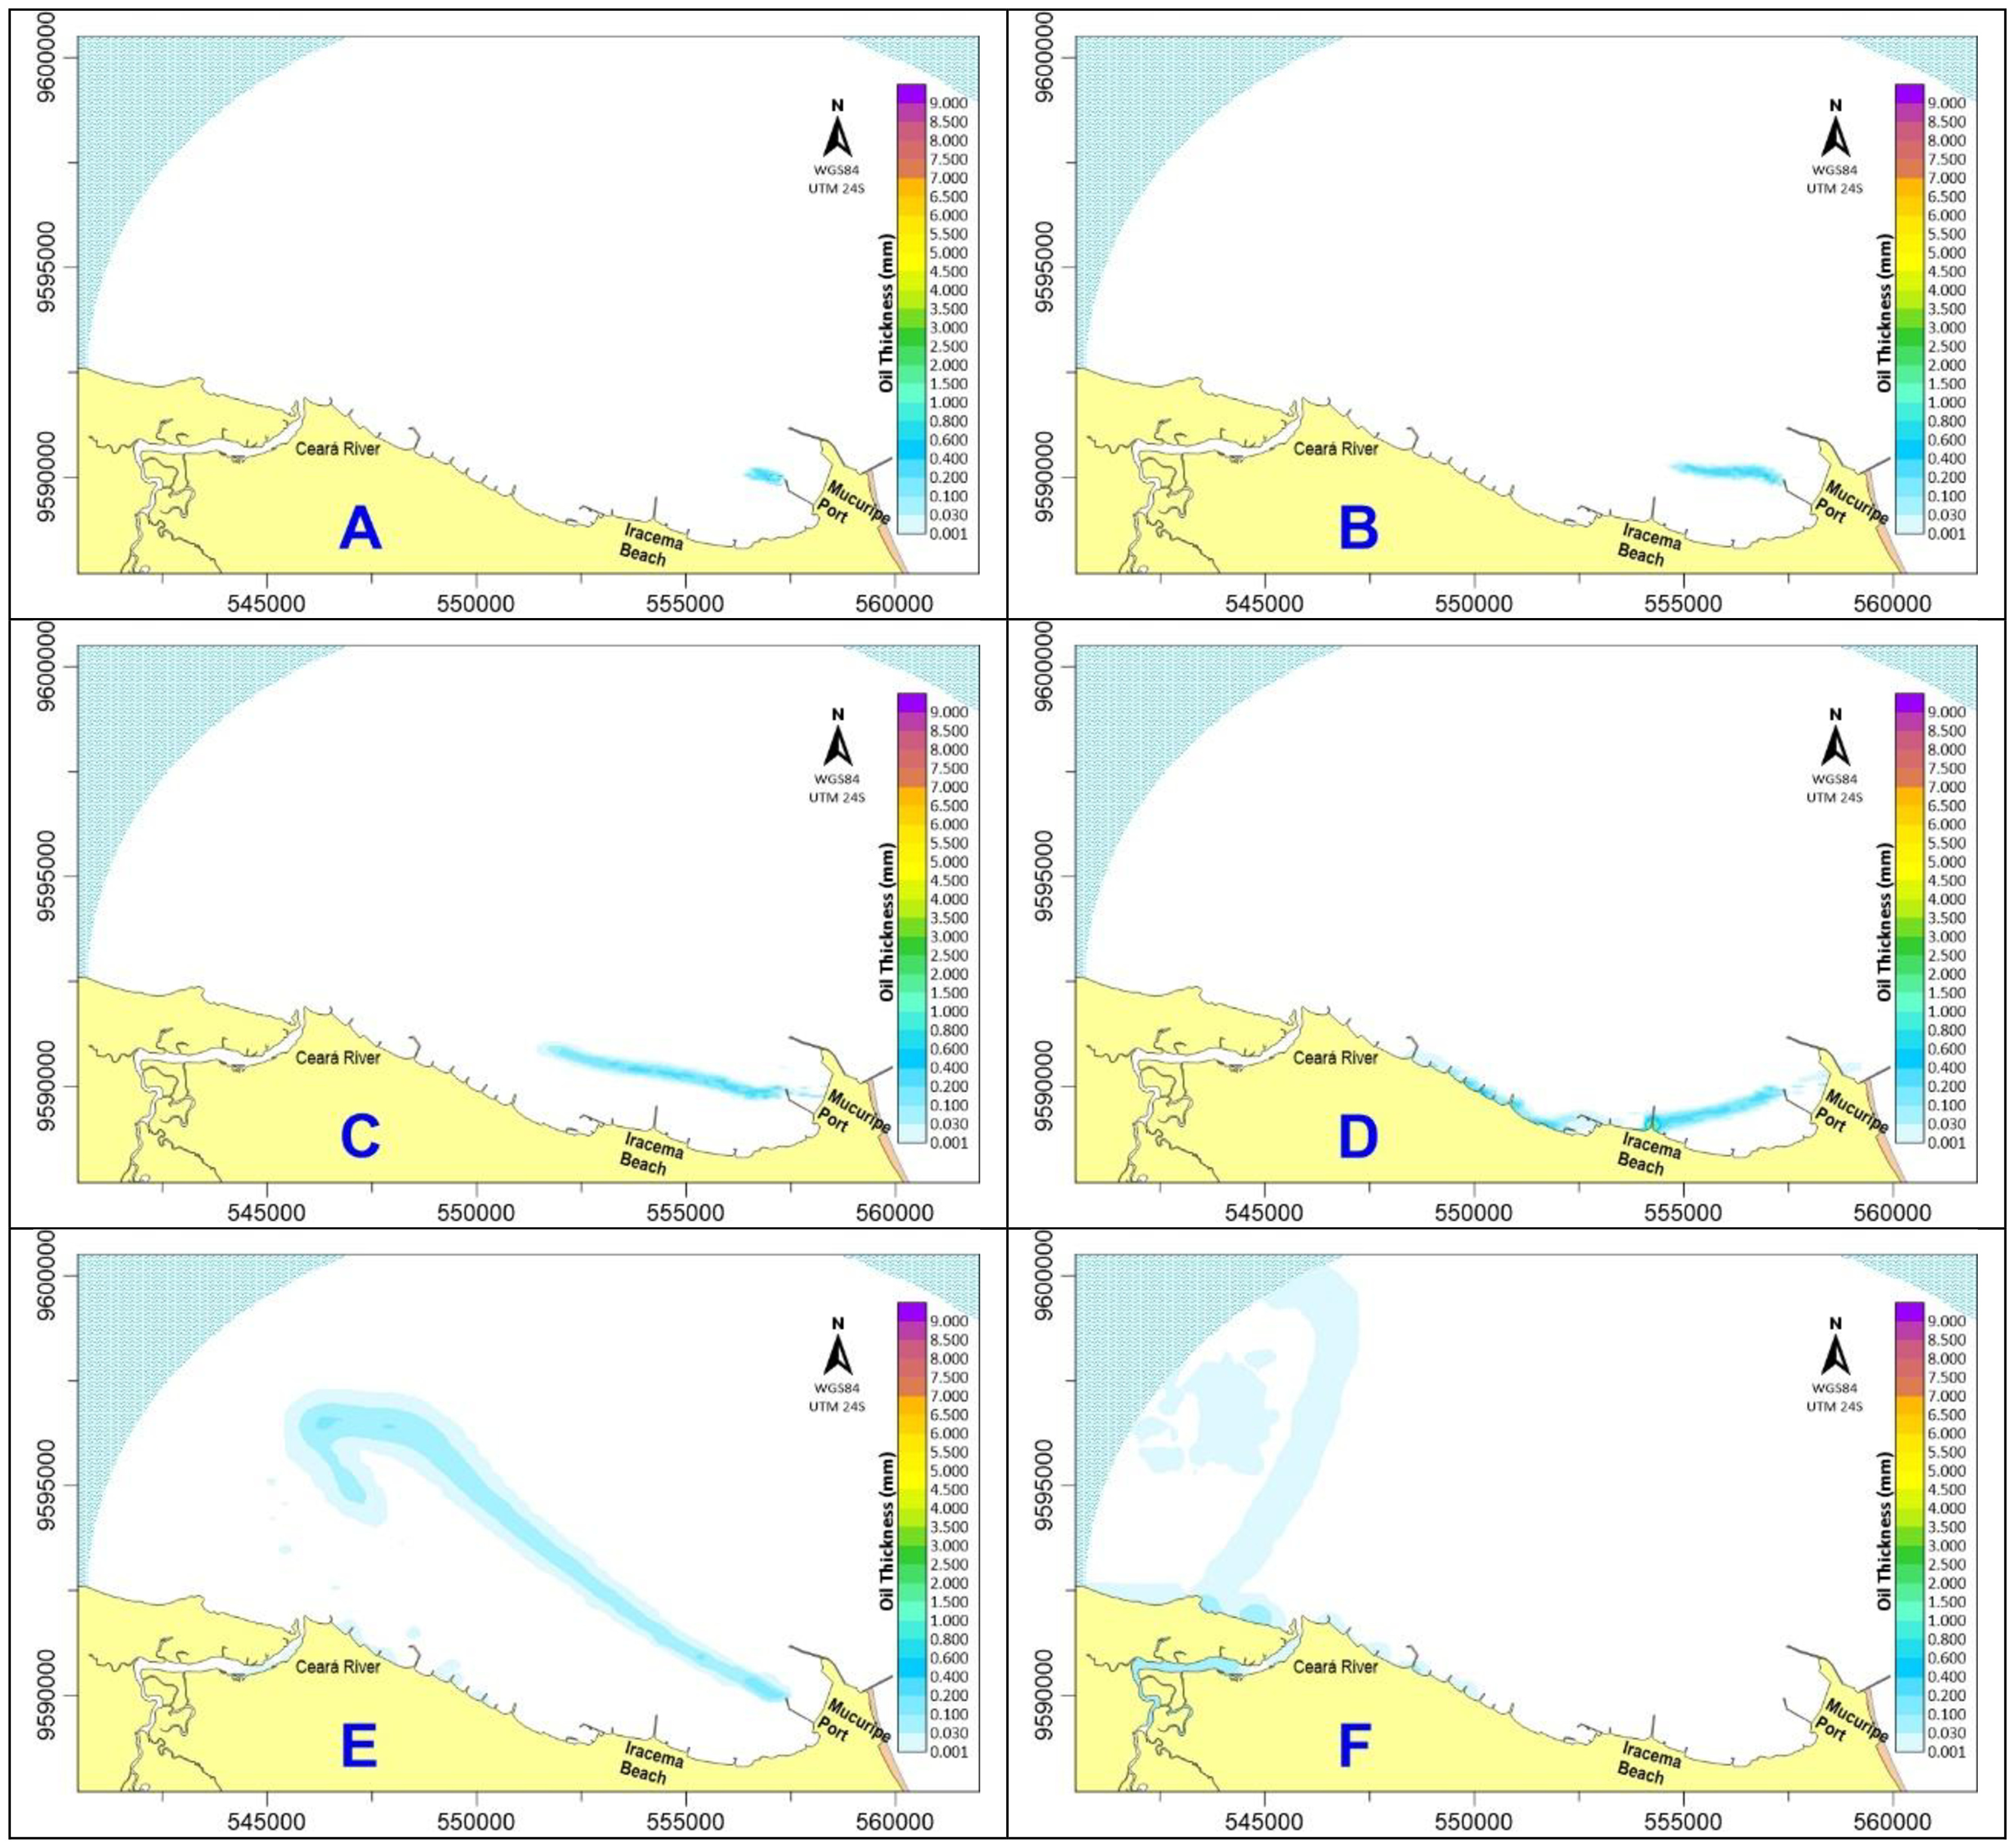
The selected spill was simulated as beginning on October 8, 2021, at 13:00, under southeast winds with a mean velocity of 7.5 m/s, during spring tide conditions. Analytical outputs were addressed along two complementary dimensions: (i) quantitative (Figure 12), plume maps with thickness isolines (convertible into concentration, kg/m3); and (ii) qualitative (Figure 13), particle trajectory maps, identifying shoreline stranding segments and retention within substrates. Each time the particles reach the shoreline, part of their mass is absorbed by the substrate, represented by the blue highlight along the closed boundary (Figure 13), while the particles that cross the open boundary limit are considered removed from the system and are not subject to re-entering the modeling domain.
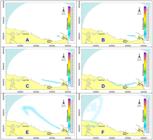
Quantitative visualization (oil film thickness isolines in the surface layer) of the slick progression resulting from a continuous spill (24 hours) of 1,000 m3, initiated on October 8, 2021, at 13:00 in times 1h (A), 3 h (B), 6 h (C), 12 h (D), 24 h (E) and 36 h (F) fter the beginning of the spill, southeast wind, mean velocity of 7.5 m/s, under spring tide conditions.
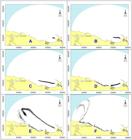
Qualitative visualization (particle cloud, with coastal segments affected by oil highlighted in blue) of the slick resulting from a continuous spill (24 hours) of 1,000 m3, initiated on October 8, 2021, at 13:00 in times 1h (A), 3 h (B), 6 h (C), 12 h (D), 24 h (E) and 36 h (F) fter the beginning of the spill, southeast wind, mean velocity of 7.5 m/s, under spring tide conditions.
During the first six hours, the plume evolved under coastal advection, assuming an elongated morphology parallel to the bay shoreline in response to currents and wind-driven drift. This transport, associated with the continuous but relatively low release rate, maintained stable mean thicknesses (≈ 0.2-0.6 mm), consistent with the balance between input, lateral dispersion, and weathering processes insufficient to produce significant thinning. Twelve hours after the onset of the spill, a large portion of the shoreline was already affected, and currents directed the contaminant plume toward the Iracema Beach jetty.
By the end of the release (24 h), changes in hydrodynamic forcing (current direction and wind reorientation) deflected the plume northwestward, generating an elongated slick along the coast, with a substantial fraction of the oil transported beyond the modeling domain. After 36 hours, current reversal toward the southwest once again drove the oil toward the shoreline, leading to contamination within the Ceará River estuary.
The SisBaHiA system includes a statistical tool that enables the extraction, for each simulated source, of probabilities of shoreline contact, arrival times, and accumulated mass/volume within the coastal zone. For the simulated scenario, a 100% stranding probability was obtained, indicating that all simulated sources eventually reach the shoreline. The mean arrival time at the coast was 3 h 54 min, with a minimum observed time of 2 h 28 min.
Mass loss associated with shoreline contact was parameterized through empirical absorption coefficients defined by substrate classes. While practical and capable of incorporating average spatial heterogeneity, this parameterization represents a significant limitation. The coefficients are transferable values that do not fully capture the local variability in porosity, grain size, organic content, and moisture. Therefore, the need for local calibration is emphasized, through field surveys and standardized laboratory tests (saturation curves, absorption coefficients, penetration and removal rates, including leaching, resuspension, and biodegradation), as well as experiments with different oil types depending on the objectives of the study.
Finally, it is emphasized that the projections retain significant uncertainties associated with hydrodynamic fields and weathering parameterizations. Such uncertainties must be explicitly acknowledged in the interpretation of results and mitigated, whenever possible, through empirical calibration (Owens et al., 2008; Keramea et al., 2021).
CONCLUSIONS
This study integrated calibrated numerical hydrodynamic modeling with stochastic oil spill simulations to evaluate the transport, weathering, and coastal impact of slicks associated with operations at the Port of Mucuripe. The combined analysis of plume isopleths, particle trajectories, probabilistic shoreline deposition maps, and statistical performance metrics indicates that the modeling framework adequately represents the dominant circulation patterns and the main surface transport processes in the study area.
The continued spill scenario simulated for October highlights a high risk of rapid coastal contamination, with potential direct impacts on environmentally sensitive areas such as the Ceará River estuary and adjacent mangroves. These results provide objective support for the prioritization of protection areas and the definition of operational response windows, contributing to the development of monitoring and contingency strategies aimed at minimizing environmental impacts during worst-case events.
Limitations and future perspectives
Despite the satisfactory performance obtained, some limitations should be acknowledged. Model accuracy may be further improved through mesh refinement, updated bathymetric data, and the incorporation of more detailed forcing datasets, allowing for a better representation of local velocity gradients and small-scale circulation features. The installation of additional in situ monitoring instruments, particularly an ADCP near the pier, is recommended to enhance the characterization of spatial variability, vertical shear, and local hydrodynamic structures influencing transport and shoreline stranding.
Recent advances have demonstrated the growing role of remote sensing in the detection and monitoring of oil spills, representing a valuable complementary resource for the calibration and validation of hydrocarbon transport models in coastal environments. The integration of remote sensing products, particularly thermal infrared imagery, with hydrodynamic and transport models constitutes a promising pathway for improving the representation of slick drift, dispersion, and weathering processes.
Future research should therefore prioritize the implementation of formal data assimilation techniques and multiplatform validation procedures, supported by objective statistical metrics, in order to rigorously quantify uncertainties and performance gains associated with the use of remote observations. As a priority application, further studies are recommended to investigate chronic oil pollution related to routine port operations, such as small-scale operational leaks, ballast water discharge, and equipment washing, emphasizing the cumulative effects of prolonged low-intensity discharges on the coastal system.
DATA AVAILABILITY STATEMENT
Research data is only available upon request.
REFERENCES
-
Aldarias, A., Gómez-Enri, J., Laiz, I., Tejedor, B., Vignudelli, S., & Cipollini, P. (2020). Validation of Sentinel-3a SARAL coastal sea level data at high posting rate: 80Hz. IEEE Transactions on Geoscience and Remote Sensing, 58(6), 3809-3821. https://doi.org/10.1109/TGRS.2019.2957649
» https://doi.org/10.1109/TGRS.2019.2957649 -
Azevedo, R. N. A., Bezerra, K. M. M., Nascimento, R. F., Nelson, R. K., Reddy, C. M., Nascimento, A. P., Oliveira, A. H. B., Martins, L. L., & Cavalcante, R. M. (2022). Is there a similarity between the 2019 and 2022 oil spills that occurred on the coast of Ceará (Northeast Brazil)? An analysis based on forensic environmental geochemistry. Environmental Pollution, 314, 120283. https://doi.org/10.1016/j.envpol.2022.120283
» https://doi.org/10.1016/j.envpol.2022.120283 -
Barros, M. L. C., & Rosman, P. C. C. (2018). A study on fish eggs and larvae drifting in the Jirau reservoir. Journal of the Brazilian Society of Mechanical Sciences and Engineering, 40(2), 62. https://doi.org/10.1007/s40430-017-0951-1
» https://doi.org/10.1007/s40430-017-0951-1 - Brasil. Ministério do Meio Ambiente – MMA. (2004). Atlas de sensibilidade ambiental ao óleo das bacias marítimas do Ceará e Potiguar (55 p.). Brasília.
- Brasil. (2007, agosto). Resolução CONAMA nº 393, de 8 de agosto de 2007. Dispõe sobre o descarte contínuo de água de processo ou de produção em plataformas marítimas de petróleo e gás natural, e dá outras providências. Diário Oficial [da] República Federativa do Brasil, Brasília.
- Brasil. (2008, junho). Resolução CONAMA nº 398, de 11 de junho de 2008. Dispõe sobre o conteúdo mínimo do Plano de Emergência Individual para incidentes de poluição por óleo em águas sob jurisdição nacional, originados em portos organizados, instalações portuárias, terminais, dutos, sondas terrestres, plataformas e suas instalações de apoio, refinarias, estaleiros, marinas, clubes náuticos e instalações similares, e orienta a sua elaboração. Diário Oficial [da] República Federativa do Brasil, Brasília.
-
Breaker, L. C., & Bratkovich, A. (1993). Coastal-ocean processes and their influence on the oil spilled off San Francisco by the M/V Puerto Rican. Marine Environmental Research, 36(3), 153-184. https://doi.org/10.1016/0141-1136(93)90094-G
» https://doi.org/10.1016/0141-1136(93)90094-G -
Carvalho, A. C. B., Carvalho, M. V., Trevisan, C. L., Rosman, P. C. C., & Wasserman, J. C. (2024). Modeling a hypersaline lagoon to evaluate salinity changes due to morphology of an ocean connection. Revista Brasileira de Recursos Hídricos, 29, e44. https://doi.org/10.1590/2318-0331.292420240078
» https://doi.org/10.1590/2318-0331.292420240078 -
Chassignet, E., Hurlburt, H., Metzger, E. J., Smedstad, O., Cummings, J., Halliwell, G., Bleck, R., Baraille, R., Wallcraft, A., Lozano, C., Tolman, H., Srinivasan, A., Hankin, S., Cornillon, P., Weisberg, R., Barth, A., He, R., Werner, F., & Wilkin, J. (2009). US GODAE: global ocean prediction with the HYbrid Coordinate Ocean Model (HYCOM). Oceanography, 22(2), 64-75. https://doi.org/10.5670/oceanog.2009.39
» https://doi.org/10.5670/oceanog.2009.39 -
Chiau, W.-Y. (2005). Changes in the marine pollution management system in response to the Amorgos oil spill in Taiwan. Marine Pollution Bulletin, 51(8-12), 1041-1047. https://doi.org/10.1016/j.marpolbul.2005.02.048
» https://doi.org/10.1016/j.marpolbul.2005.02.048 -
Companhia Docas do Ceará – CDC. (2015). Plano Mestre do Porto do Mucuripe (120 p.). Fortaleza. Retrieved in 2025, July 19, from https://www.gov.br/infraestrutura/pt-br/centrais-de-conteudo/se10-pdf/@download/file/se10.pdf
» https://www.gov.br/infraestrutura/pt-br/centrais-de-conteudo/se10-pdf/@download/file/se10.pdf -
Correia Lima, E. J. A., Queiroz, S., Ishimaru, M. E. A., Kusuky, M. E., Moura, M. C., Araujo, M., Mendonca, L. F. F., Lentini, C. A. D., & Cunha Lima, A. T. (2025). The effect of wind parametrizations in MEDSLIK-II oil spill simulations: a case study of the FPU P-53 incident in Brazilian waters. Marine Pollution Bulletin, 218, 118118. https://doi.org/10.1016/j.marpolbul.2025.118118
» https://doi.org/10.1016/j.marpolbul.2025.118118 -
Cotrim, C. S., Semedo, A., & Lemos, G. (2022). Brazil wave climate from a high-resolution wave hindcast. Climate, 10(4), 53. https://doi.org/10.3390/cli10040053
» https://doi.org/10.3390/cli10040053 -
Dong, Y., Liu, Y., Hu, C., MacDonald, I. R., & Lu, Y. (2022). Chronic oiling in global oceans. Science, 376(6599), 1300-1304. https://doi.org/10.1126/science.abm5940
» https://doi.org/10.1126/science.abm5940 -
Durap, A. (2025). Interpretable machine learning for coastal wind prediction: integrating SHAP analysis and seasonal trends. Journal of Coastal Conservation, 29(3), 24. https://doi.org/10.1007/s11852-025-01108-y
» https://doi.org/10.1007/s11852-025-01108-y -
Elizaryev, A., Maniakova, G., Longobardi, A., Elizareva, E., Gabdulkhakov, R., Nurutdinov, A., & Khakimov, R. (2018). Numerical simulation of oil spills based on the GNOME and ADIOS. IACSIT International Journal of Engineering and Technology, 7(2.23), 24-27. https://doi.org/10.14419/ijet.v7i2.23.11876
» https://doi.org/10.14419/ijet.v7i2.23.11876 -
Fay, J. A. (1971). Physical processes in the spread of oil on a water surface. In Proceedings of the Joint Conference on the Prevention and Control of Oil Spills (pp. 463-467), Washington. https://doi.org/10.7901/2169-3358-1971-1-463
» https://doi.org/10.7901/2169-3358-1971-1-463 -
French-McCay, D. P., Spaulding, M. L., Crowley, D., Mendelsohn, D., Fontenault, J., & Horn, M. (2021). Validation of oil trajectory and fate modeling of the Deepwater Horizon oil spill. Frontiers in Marine Science, 8, 618463. https://doi.org/10.3389/fmars.2021.618463
» https://doi.org/10.3389/fmars.2021.618463 - Góis, D. M. M. (2008). Estudo da circulação hidrodinâmica e da dispersão de óleo na zona costeira entre Macau e Galinhos RN (Dissertação de mestrado). Universidade Federal do Rio Grande do Norte, Natal.
-
Guo, W. (2017). Development of a statistical oil spill model for risk assessment. Environmental Pollution, 230, 945-953. https://doi.org/10.1016/j.envpol.2017.07.051
» https://doi.org/10.1016/j.envpol.2017.07.051 - Gurgel, F. O. M. J. (2016). Aplicações de modelagem hidrodinâmica para ações de resposta a incidentes de poluição por óleo: estudo de caso da Enseada dos Anjos em Arraial do Cabo-RJ (Dissertação de mestrado). Pontifícia Universidade Católica do Rio de Janeiro, Rio de Janeiro.
-
Hersbach, H., Bell, B., Berrisford, P., Hirahara, S., Horányi, A., Muñoz-Sabater, J., Nicolas, J., Peubey, C., Radu, R., Schepers, D., Simmons, A., Soci, C., Abdalla, S., Abellan, X., Balsamo, G., Bechtold, P., Biavati, G., Bidlot, J., Bonavita, M., De Chiara, G., Dahlgren, P., Dee, D., Diamantakis, M., Dragani, R., Flemming, J., Forbes, R., Fuentes, M., Geer, A., Haimberger, L., Healy, S., Hogan, R. J., Hólm, E., Janisková, M., Keeley, S., Laloyaux, P., Lopez, P., Lupu, C., Radnoti, G., de Rosnay, P., Rozum, I., Vamborg, F., Villaume, S., & Thépaut, J.-N. (2020). The ERA5 global reanalysis. Quarterly Journal of the Royal Meteorological Society, 146(730), 1999-2049. https://doi.org/10.1002/qj.3803
» https://doi.org/10.1002/qj.3803 -
Instituto Brasileiro de Geografia e Estatística – IBGE. (2022). Cidades e estados: Fortaleza. Retrieved in 2021, February 21, from https://cidades.ibge.gov.br/brasil/ce/fortaleza
» https://cidades.ibge.gov.br/brasil/ce/fortaleza -
International Tanker Owners Pollution Federation – ITOPF. (2014). Effects of oil pollution on social and economic activities (Technical Information Paper, No. 12). Retrieved in 2025, January 7, from https://www.itopf.org/knowledge-resources/documents-guides/tip-12-effects-of-oil-pollution-on-social-and-economic-activities/
» https://www.itopf.org/knowledge-resources/documents-guides/tip-12-effects-of-oil-pollution-on-social-and-economic-activities/ -
International Tanker Owners Pollution Federation – ITOPF. (2025). Oil tanker spill statistics 2024. Retrieved in 2025, June 22, from https://www.itopf.org/knowledge-resources/data-statistics/oil-tanker-spill-statistics-2024/
» https://www.itopf.org/knowledge-resources/data-statistics/oil-tanker-spill-statistics-2024/ -
Jones, C. E., Dagestad, K.-F., Breivik, Ø., Holt, B., Röhrs, J., Christensen, K. H., Espeseth, M., Brekke, C., & Skrunes, S. (2016). Measurement and modeling of oil slick transport. Journal of Geophysical Research. Oceans, 121(10), 7759-7775. https://doi.org/10.1002/2016JC012113
» https://doi.org/10.1002/2016JC012113 -
Keramea, P., Spanoudaki, K., Zodiatis, G., Gikas, G., & Sylaios, G. (2021). Oil spill modeling: a critical review on current trends, perspectives, and challenges. Journal of Marine Science and Engineering, 9(2), 181. https://doi.org/10.3390/jmse9020181
» https://doi.org/10.3390/jmse9020181 -
Kontovas, C. A., Psaraftis, H. N., & Ventikos, N. P. (2010). An empirical analysis of IOPCF oil spill cost data. Marine Pollution Bulletin, 60(9), 1455-1466. https://doi.org/10.1016/j.marpolbul.2010.05.010
» https://doi.org/10.1016/j.marpolbul.2010.05.010 -
Kuang, C., Chen, J., Wang, J., Qin, R., Fan, J., & Zou, Q. (2023). Effect of wind-wave-current interaction on oil spill in the Yangtze River Estuary. Journal of Marine Science and Engineering, 11(3), 494. https://doi.org/10.3390/jmse11030494
» https://doi.org/10.3390/jmse11030494 -
Lehr, W., Jones, R., Evans, M., Simecek-Beatty, D., & Overstreet, R. (2002). Revisions of the ADIOS oil spill model. Environmental Modelling & Software, 17(2), 189-197. https://doi.org/10.1016/S1364-8152(01)00064-0
» https://doi.org/10.1016/S1364-8152(01)00064-0 -
Lemos, A., Andrade, L., Franklin, L., Bezerra, D., Ghisolfi, R., Maita, R., & Nobre, P. (2024). Ship route oil spill modeling: a case study of the Northeast Brazil Event, 2019. Applied Sciences, 14(2), 865. https://doi.org/10.3390/app14020865
» https://doi.org/10.3390/app14020865 -
Lira, M. A. T., Da Silva, E. M., Alves, J. M. B., & Veras, G. V. O. (2014). Estimation of wind resources in the coast of Ceará, Brazil, using the linear regression theory. Renewable & Sustainable Energy Reviews, 39, 509-529. https://doi.org/10.1016/j.rser.2014.07.097
» https://doi.org/10.1016/j.rser.2014.07.097 -
Liubartseva, S., Federico, I., Coppini, G., & Lecci, R. (2021). Stochastic oil spill modeling for environmental protection at the Port of Taranto (southern Italy). Marine Pollution Bulletin, 171, 112744. https://doi.org/10.1016/j.marpolbul.2021.112744
» https://doi.org/10.1016/j.marpolbul.2021.112744 -
Liubartseva, S., Coppini, G., Verdiani, G., Mungari, T., Ronco, F., Pinto, M., Pastore, G., & Lecci, R. (2023). Modeling chronic oil pollution from ships. Marine Pollution Bulletin, 195, 115450. https://doi.org/10.1016/j.marpolbul.2023.115450
» https://doi.org/10.1016/j.marpolbul.2023.115450 -
Lyard, F. H., Allain, D. J., Cancet, M., Carrère, L., & Picot, N. (2021). FES2014 global ocean tide atlas: design and performance. Ocean Science, 17(3), 615-649. https://doi.org/10.5194/os-17-615-2021
» https://doi.org/10.5194/os-17-615-2021 - Maia, L. P., Jiménez, J. A., Serra, J., & Morais, J. O. (2018). The coastline of Fortaleza City: a product of environmental impacts caused by the Mucuripe Harbor. Arquivos de Ciências do Mar, 31(1-2), 93-100.
-
Marques, W. C., Stringari, C. E., Kirinus, E. P., Möller Junior, O. O., Toldo Junior, E. E., & Andrade, M. M. (2017). Numerical modeling of the Tramandaí beach oil spill, Brazil: case study for January 2012 event. Applied Ocean Research, 65, 178-191. https://doi.org/10.1016/j.apor.2017.04.007
» https://doi.org/10.1016/j.apor.2017.04.007 -
Marta-Almeida, M., Ruiz-Villarreal, M., Pereira, J., Otero, P., Cirano, M., Zhang, X., & Hetland, R. D. (2013). Efficient tools for marine operational forecast and oil spill tracking. Marine Pollution Bulletin, 71(1-2), 139-151. https://doi.org/10.1016/j.marpolbul.2013.03.022
» https://doi.org/10.1016/j.marpolbul.2013.03.022 -
Moriasi, D. N., Gitau, M. W., Pai, N., & Daggupati, P. (2015). Hydrologic and water quality models: performance measures and evaluation criteria. Transactions of the ASABE, 58(6), 1763-1785. https://doi.org/10.13031/trans.58.10715
» https://doi.org/10.13031/trans.58.10715 -
National Research Council – NRC. (2003). Oil in the sea III: inputs, fates, and effects Washington, D.C.: The National Academies Press. https://doi.org/10.17226/10388
» https://doi.org/10.17226/10388 -
Owens, E. H., Taylor, E., & Humphrey, B. (2008). The persistence and character of stranded oil on coarse-sediment beaches. Marine Pollution Bulletin, 56(1), 14-26. https://doi.org/10.1016/j.marpolbul.2007.08.020
» https://doi.org/10.1016/j.marpolbul.2007.08.020 -
Peixoto, R. S., Rosman, P. C. C., & Vinzon, S. B. (2017). A morphodynamic model for cohesive sediments transport. Revista Brasileira de Recursos Hídricos, 22, e57. https://doi.org/10.1590/2318-0331.0217170066
» https://doi.org/10.1590/2318-0331.0217170066 -
Pereira, S., Rodrigues, M. F., Rosman, P. C. C., Rosman, P., Bleninger, T., Lima Neto, I. E., Teixeira, C. E. P., Sola, I., & Sánchez Lizaso, J. L. (2024). A novel tool for modeling the near- and far-field dispersion of brine effluent from desalination plants. Frontiers in Marine Science, 11, 1377252. https://doi.org/10.3389/fmars.2024.1377252
» https://doi.org/10.3389/fmars.2024.1377252 -
Pereira, S. P., Rosman, P. C. C., Sánchez-Lizaso, J. L., Lima Neto, I. E., Silva, R. A. G., & Rodrigues, M. (2021). Brine outfall modeling of the proposed desalination plant of Fortaleza, Brazil. Desalination and Water Treatment, 234, 22-30. https://doi.org/10.5004/dwt.2021.27557
» https://doi.org/10.5004/dwt.2021.27557 -
Pereira, S. P., Rosman, P. C. C., Alvarez, C., Schetini, C. A. F., Souza, R. O., & Vieira, R. H. S. F. (2015). Modeling of coastal water contamination in Fortaleza (Northeastern Brazil). Water Science and Technology, 72(6), 928-936. https://doi.org/10.2166/wst.2015.292
» https://doi.org/10.2166/wst.2015.292 - Pereira, S. P., & Rosman, P. C. C. (2009). Modelagem computacional da pluma de efluentes do emissário submarino de Fortaleza. In Anais do 25º Congresso Brasileiro de Engenharia Sanitária e Ambiental, Recife, PE.
-
Prasad, S. J., Francis, P. A., Balakrishnan Nair, T. M., Shenoi, S. S. C., & Vijayalakshmi, T. (2020). Oil spill trajectory prediction with high-resolution ocean currents. Journal of Operational Oceanography, 13(2), 84-99. https://doi.org/10.1080/1755876X.2019.1606691
» https://doi.org/10.1080/1755876X.2019.1606691 -
Reddy, C. M., Nelson, R. K., Hanke, U. M., Cui, X., Summons, R. E., Valentine, D. L., Rodgers, R. P., Chacón-Patiño, M. L., Niles, S. F., Teixeira, C. E. P., Bezerra, L. E. A., Cavalcante, R. M., Soares, M. O., Oliveira, A. H. B., White, H. K., Swarthout, R. F., Lemkau, K. L., & Radović, J. R. (2022). Synergy of analytical approaches enables a robust assessment of the Brazil mystery oil spill. Energy & Fuels, 36(22), 13688-13704. https://doi.org/10.1021/acs.energyfuels.2c00656
» https://doi.org/10.1021/acs.energyfuels.2c00656 - Rodrigues, M. F. (2023). Análise de lançamento de efluentes com boiância negativa em corpos de água naturais (Dissertação de mestrado). Universidade Federal do Rio de Janeiro, Rio de Janeiro.
-
Rollnic, M., & Medeiros, C. (2013). Application of a probabilistic sediment transport model to guide beach nourishment efforts. Journal of Coastal Research, 165, 1856-1861. https://doi.org/10.2112/SI65-314.1
» https://doi.org/10.2112/SI65-314.1 - Rosman, P. C. C. (2000). Um critério para uniformizar os limites de apresentação de resultados de modelos de derrame de óleo Rio de Janeiro: Programa de Engenharia Costeira e Oceanográfica (PENO).
- Rosman, P. C. C. (2007). Subsídios para modelagem de sistemas estuarinos. In R. C. V. Silva (Ed.), Métodos numéricos em recursos hídricos (pp. 238-248). Porto Alegre: ABHH.
- Rosman, P. C. C. (2025). Referência técnica do SisBaHiA® (426 p.). Rio de Janeiro: Fundação COPPETEC-COPPE/UFRJ. Retrieved in 2025, January 27, from www.sisbahia.coppe.ufrj.br
- Silva, R. A. G., Pereira, S. P., & Rosman, P. C. C. (2017). Modelagem numérica da circulação costeira e das correntes litorâneas na costa de Fortaleza – CE. In Anais do XXII Simpósio Brasileiro de Recursos Hídricos (SBRH), Florianópolis, SC. Porto Alegre: ABRHidro.
-
Soares, M. O., Brandão, D. B., Teixeira, C. E. P., Cavalcante, R. M., Oliveira, A. H. B., Bezerra, L. E. A., & Barros, E. L. (2023). Déjà vu: new oil spill poses cumulative risks to protected coastal environments in the South Atlantic. Marine Policy, 155, 105764. https://doi.org/10.1016/j.marpol.2023.105764
» https://doi.org/10.1016/j.marpol.2023.105764 -
Stringari, C. E., Marques, W. C., Mello, L. F., & Edit, R. T. (2012). Modeling the wind influence in an oil spill along the southern brazilian shelf. Revista de Engenharia Térmica, 11(1-2), 100-109. https://doi.org/10.5380/reterm.v11i1-2.62008
» https://doi.org/10.5380/reterm.v11i1-2.62008 -
Ventikos, N. P., & Sotiropoulos, F. S. (2014). Disutility analysis of oil spills: graphs and trends. Marine Pollution Bulletin, 81(1), 116-123. https://doi.org/10.1016/j.marpolbul.2014.02.007
» https://doi.org/10.1016/j.marpolbul.2014.02.007 -
Williams, J. J., & Esteves, L. S. (2017). Guidance on setup, calibration, and validation of hydrodynamic, wave, and sediment models for shelf seas and estuaries. Advances in Civil Engineering, 2017, 1-25. https://doi.org/10.1155/2017/5251902
» https://doi.org/10.1155/2017/5251902 -
Wu, J. (1980). Wind-Stress coefficients over Sea surface near Neutral conditions: a revisit. Journal of Physical Oceanography, 10(5), 727-740. https://doi.org/10.1175/1520-0485(1980)010<0727:WSCOSS>2.0.CO;2
» https://doi.org/10.1175/1520-0485(1980)010<0727:WSCOSS>2.0.CO;2 -
Ximenes Neto, A. R., Morais, J. O., & Pinheiro, L. S. (2018). Distribuição das formas de fundo e padrões sedimentares no Porto do Mucuripe, Fortaleza-Ceará. Revista Brasileira de Geomorfologia, 19(2), 321-339. https://doi.org/10.20502/rbg.v19i2.1278
» https://doi.org/10.20502/rbg.v19i2.1278 -
Zacharias, D. C., Gama, C. M., & Fornaro, A. (2021). Mysterious oil spill on Brazilian coast: analysis and estimates. Marine Pollution Bulletin, 165, 112125. https://doi.org/10.1016/j.marpolbul.2021.112125
» https://doi.org/10.1016/j.marpolbul.2021.112125 -
Zacharias, D. C., Crespo, N. M., Silva, N. P., Rocha, R. P., Gama, C. M., Ribeiro e Silva, S. B. N., & Harari, J. (2023). Oil reaching the coast: is Brazil on the route of international oceanic dumping? Marine Pollution Bulletin, 196, 115624. https://doi.org/10.1016/j.marpolbul.2023.115624
» https://doi.org/10.1016/j.marpolbul.2023.115624 -
Zacharias, D. C., Lemos, A. T., Keramea, P., Dantas, R. C., Rocha, R. P., Crespo, N. M., Sylaios, G., Jovane, L., Silva Santos, I. G., Montone, R. C., Oliveira Soares, M., & Lourenço, R. A. (2024). Offshore oil spills in Brazil: an extensive review and further development. Marine Pollution Bulletin, 205, 116663. https://doi.org/10.1016/j.marpolbul.2024.116663
» https://doi.org/10.1016/j.marpolbul.2024.116663
Edited by
-
Editor-in-Chief:
Adilson Pinheiro
-
Associated Editor:
Fernando Mainardi Fan