Figure 1
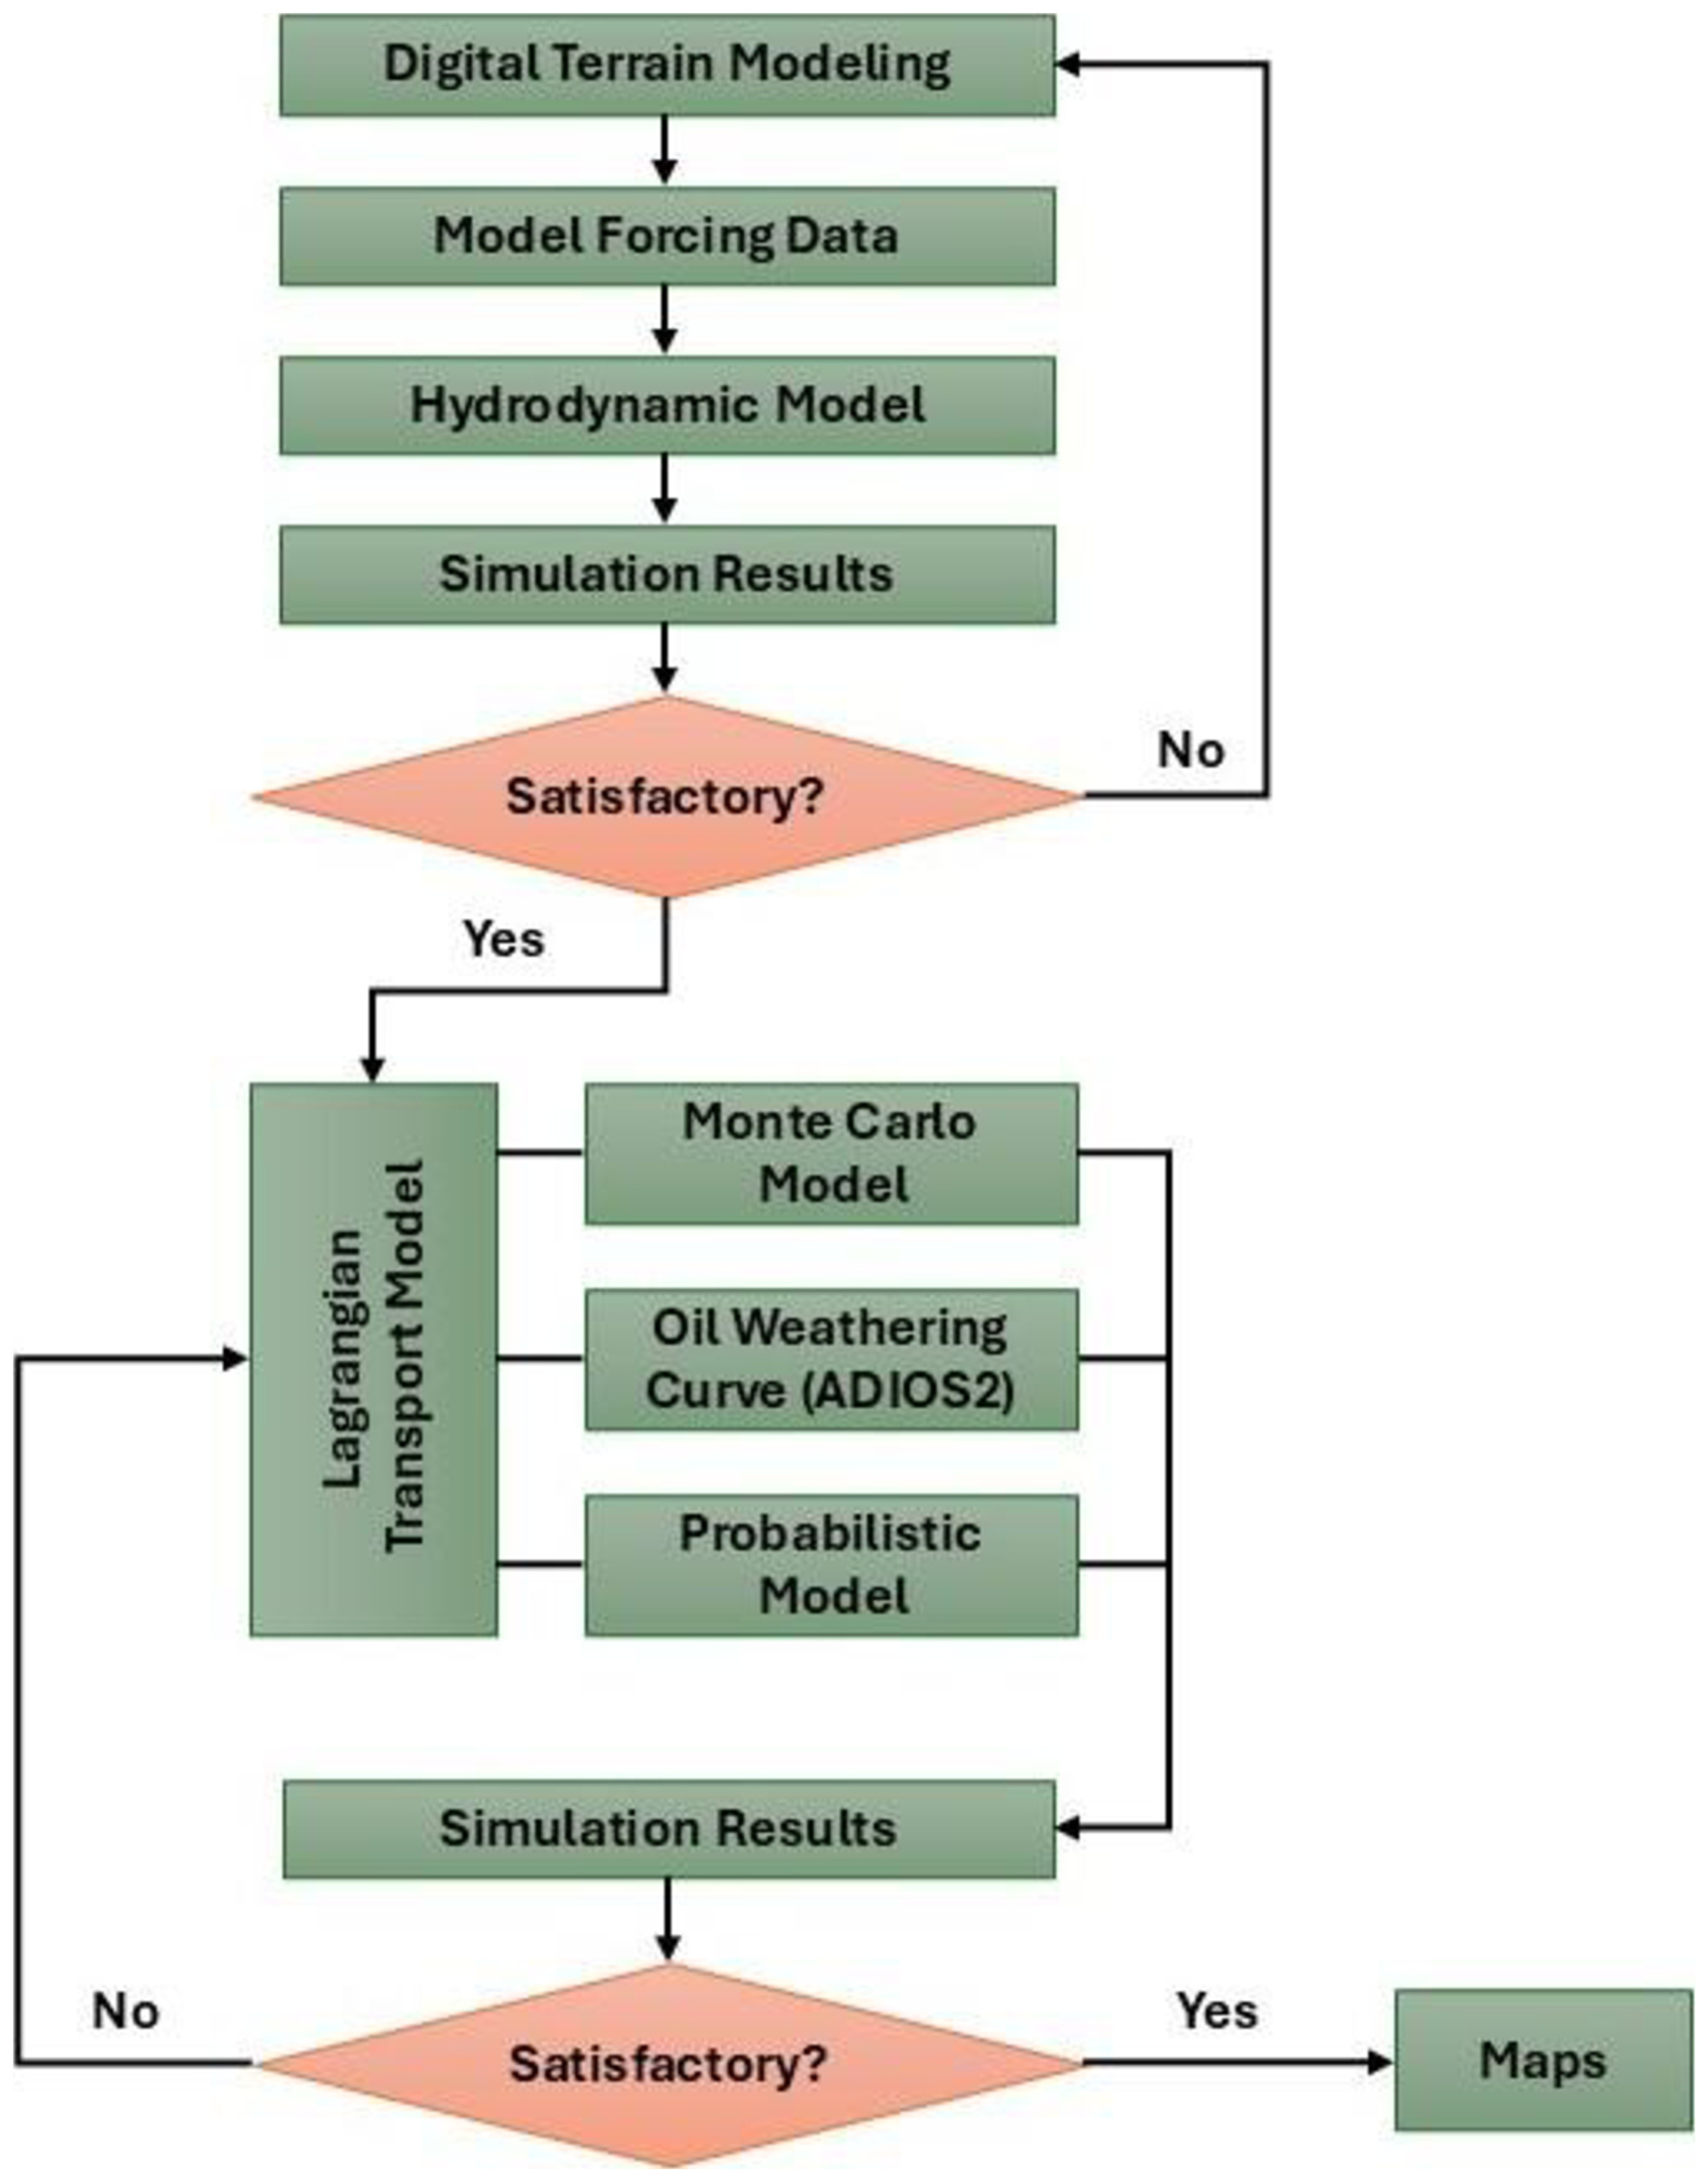
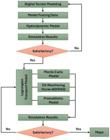
Workflow implemented in the modeling process.
Figure 2
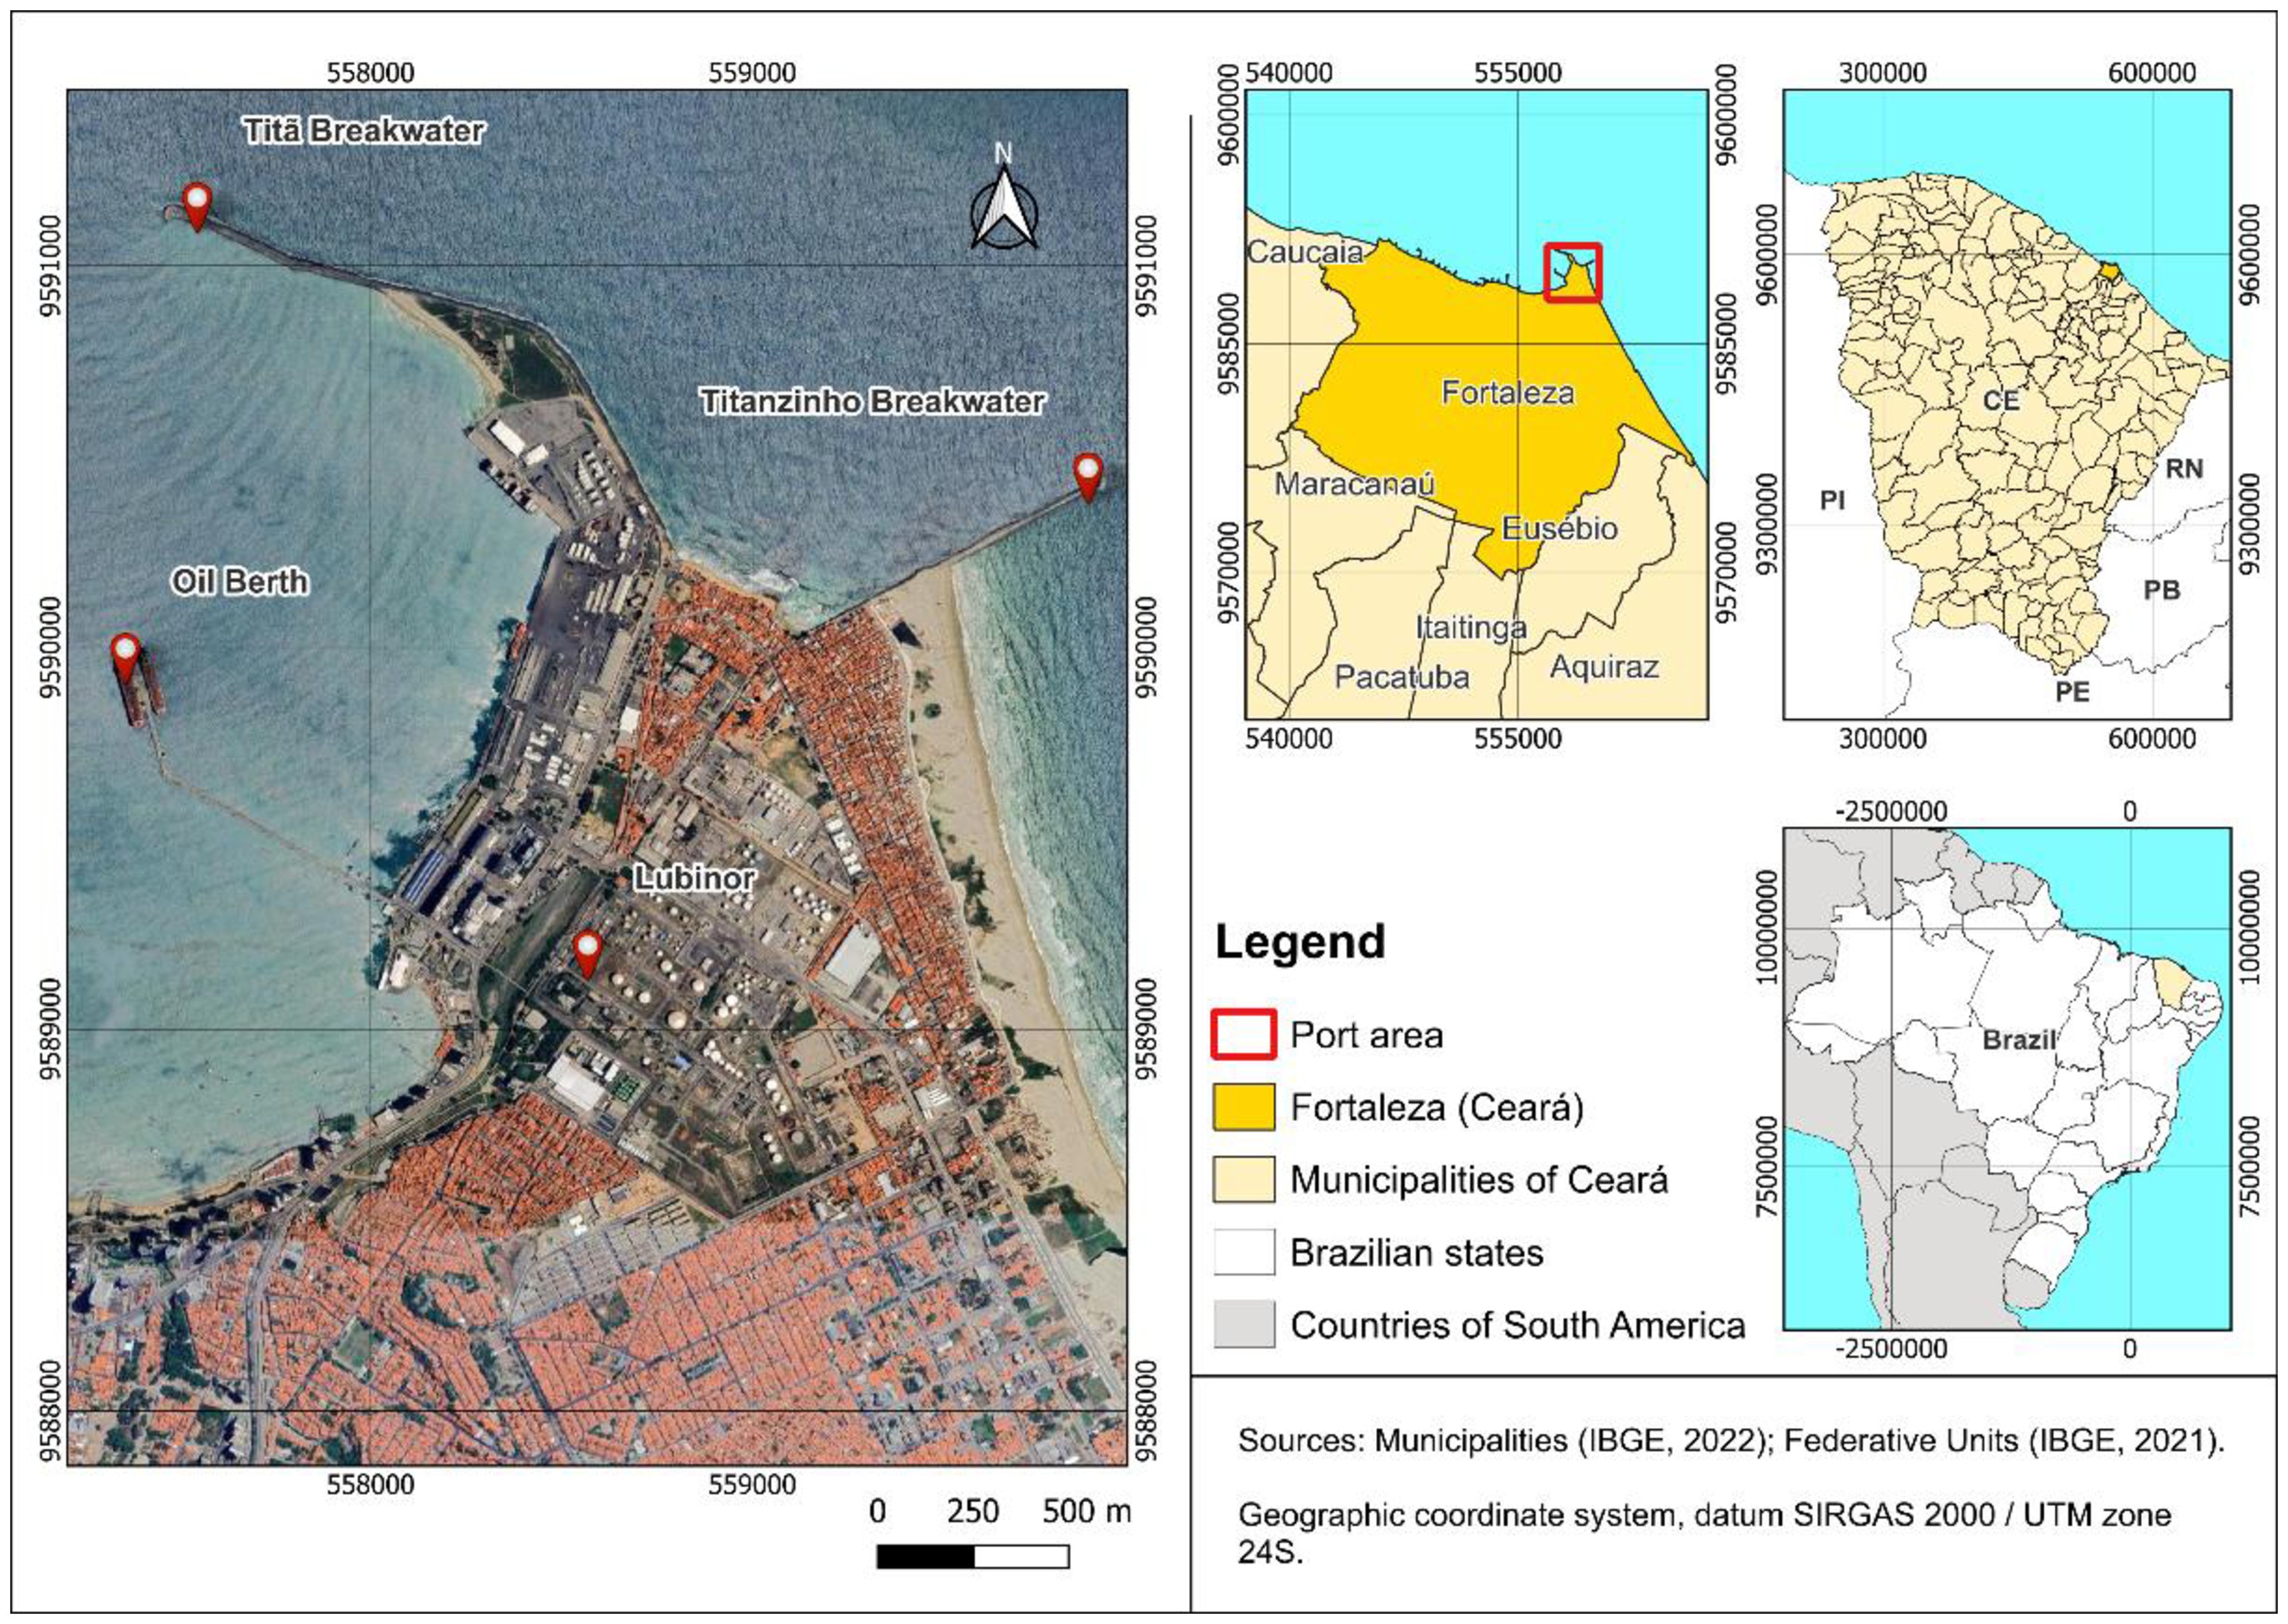
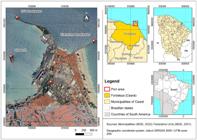
Location map of the Municipality of Fortaleza and the Port of Mucuripe.
Figure 3
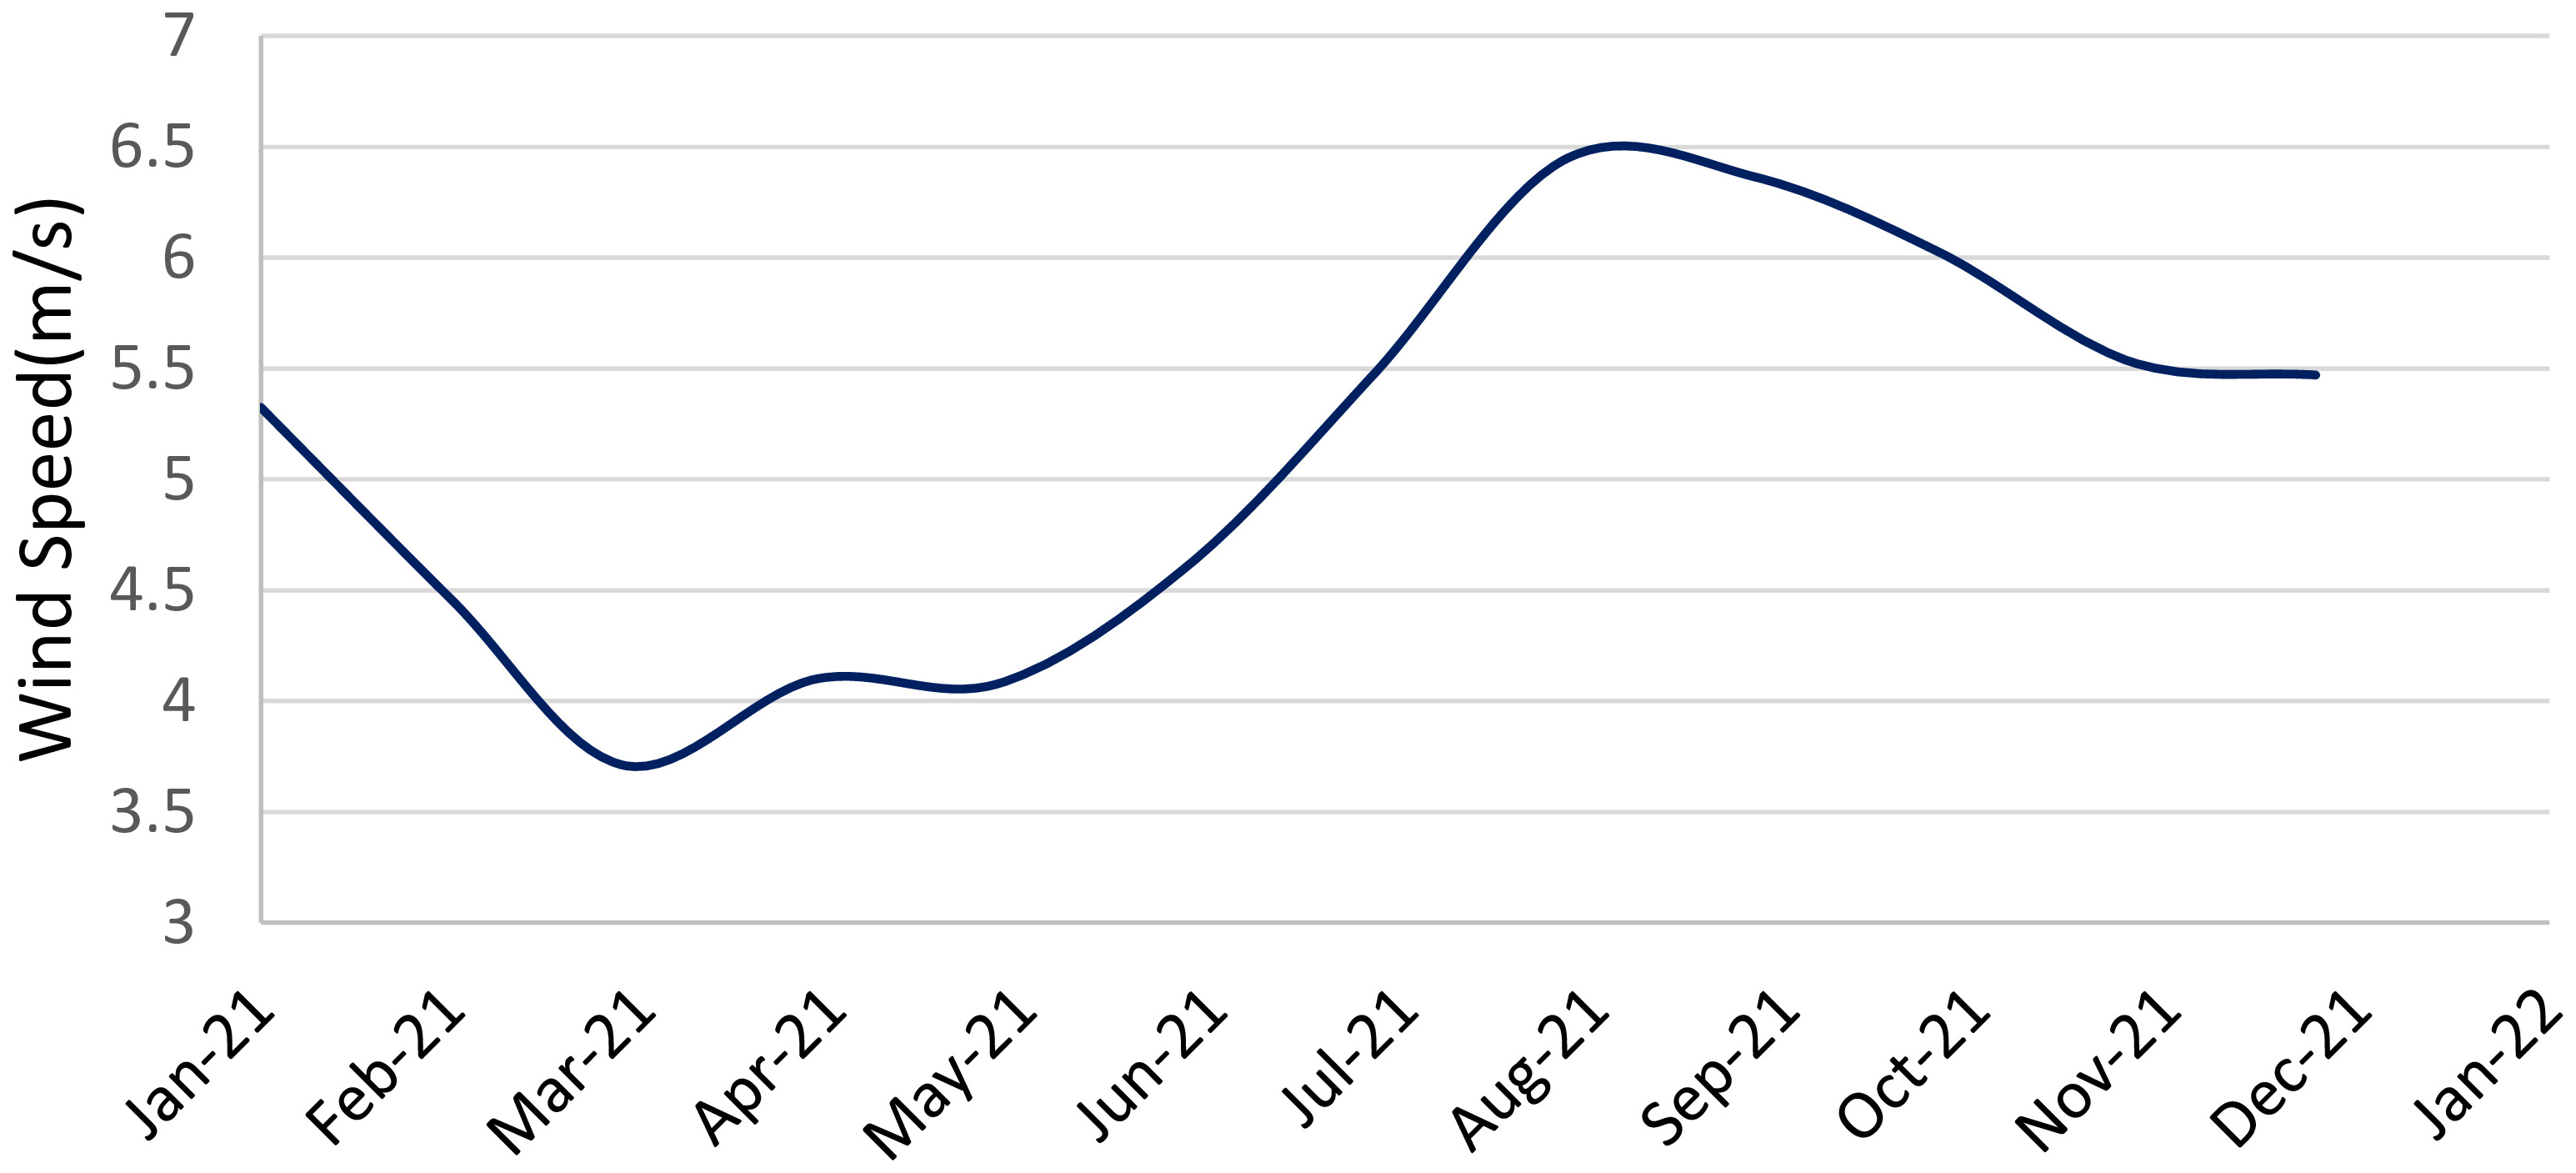
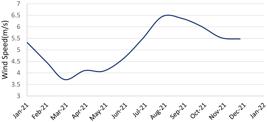
Monthly mean variation of wind intensity in the study area for the year 2021.
Figure 4
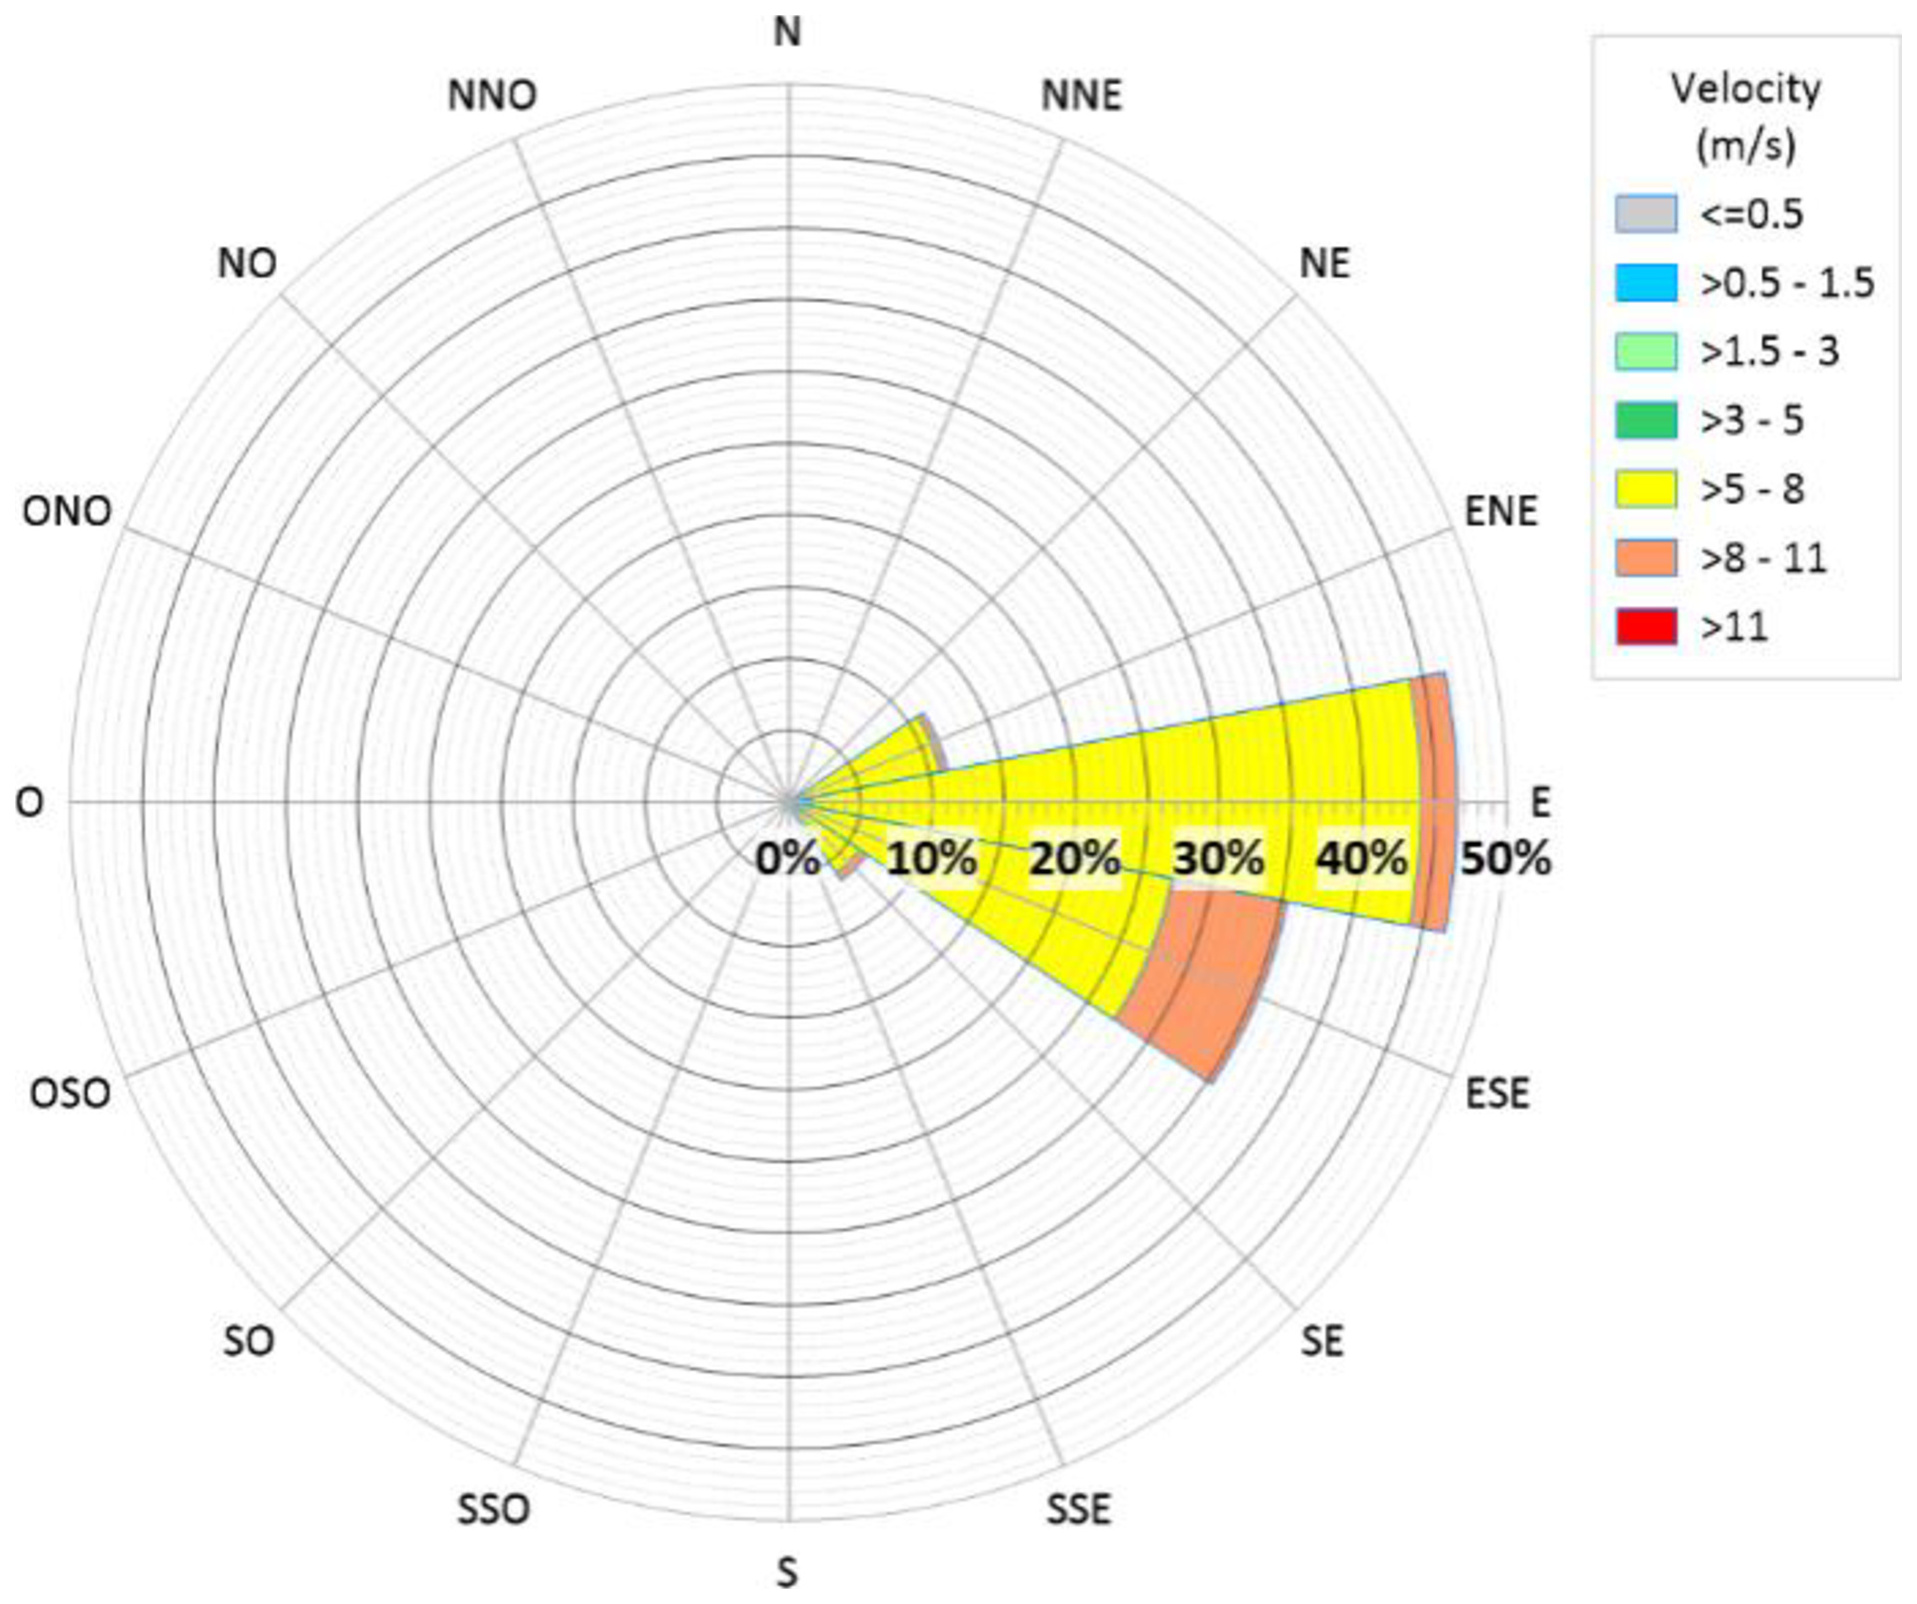
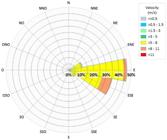
Wind rose during October 2021 obtained from the ECMWF.
Figure 5
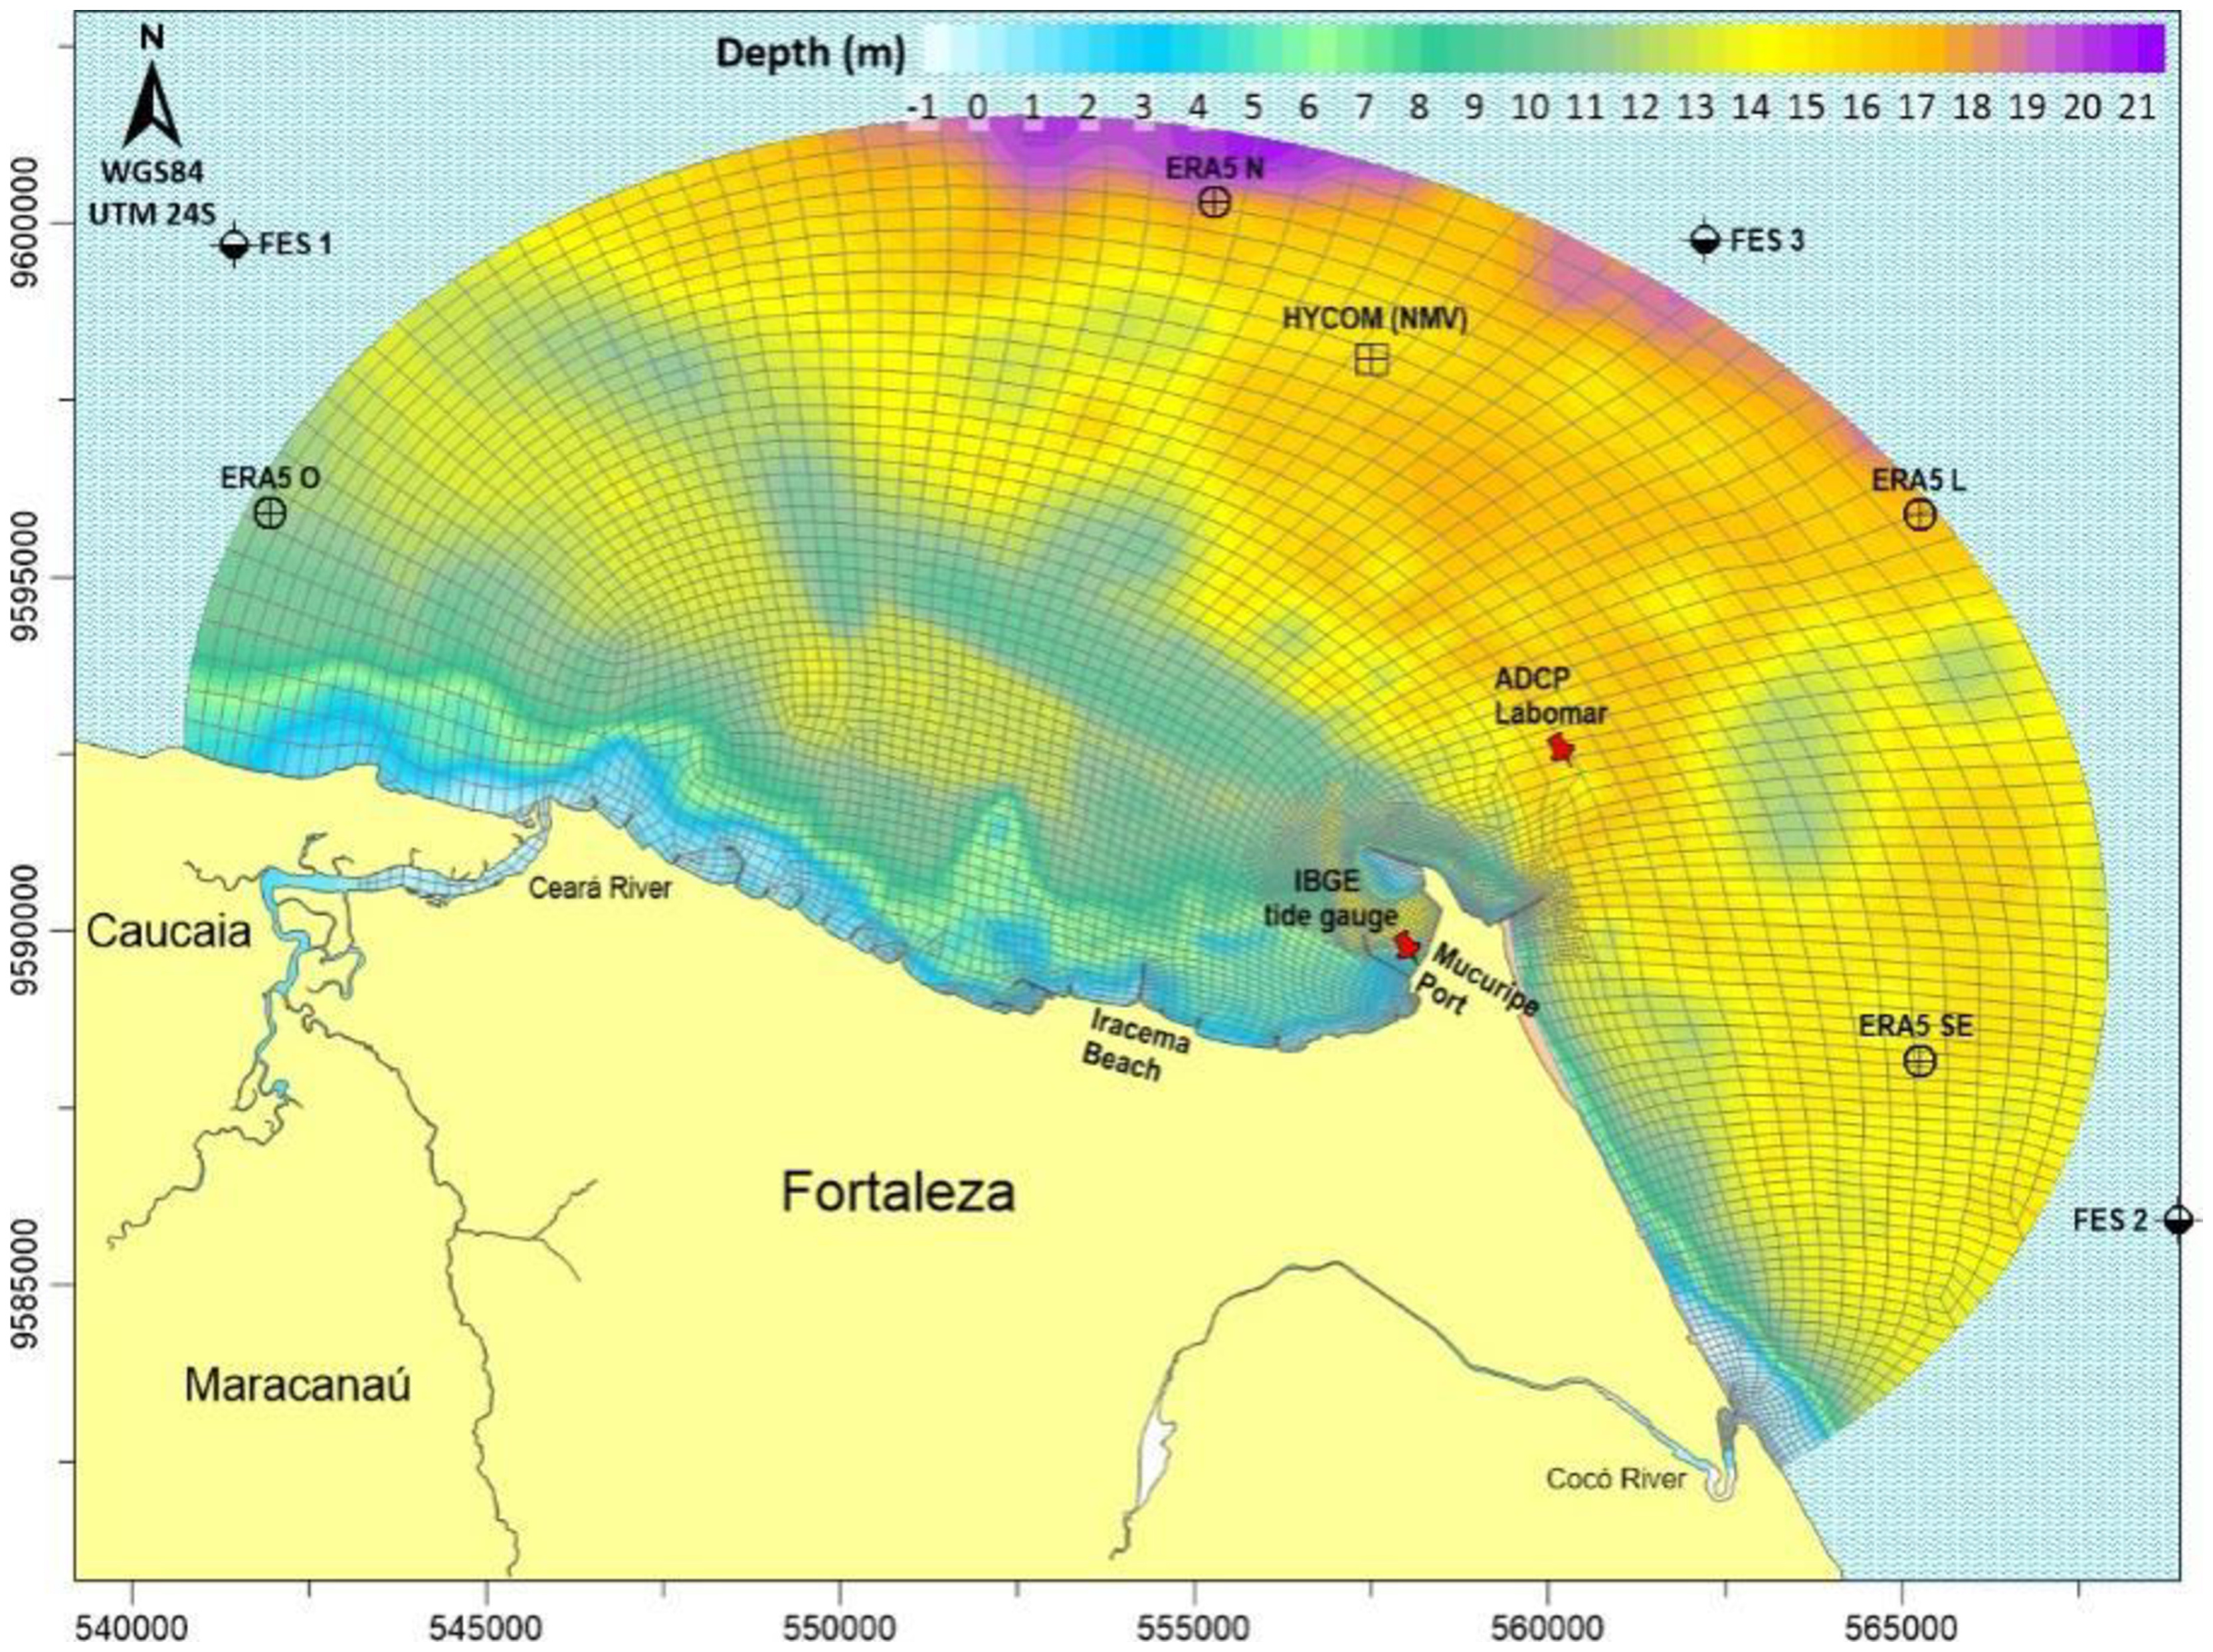
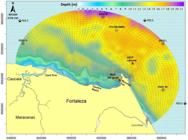
Finite element mesh with 1,638 elements, used for the discretization of the modeling domain and bathymetry interpolated from nautical charts No. 701 and 710 of the DHN. The map indicates the locations of the FES2014, ERA5, and HYCOM stations, used to generate model forcings. Additionally, the positions of the tide gauge and ADCP, used for model calibration, are shown.
Figure 6
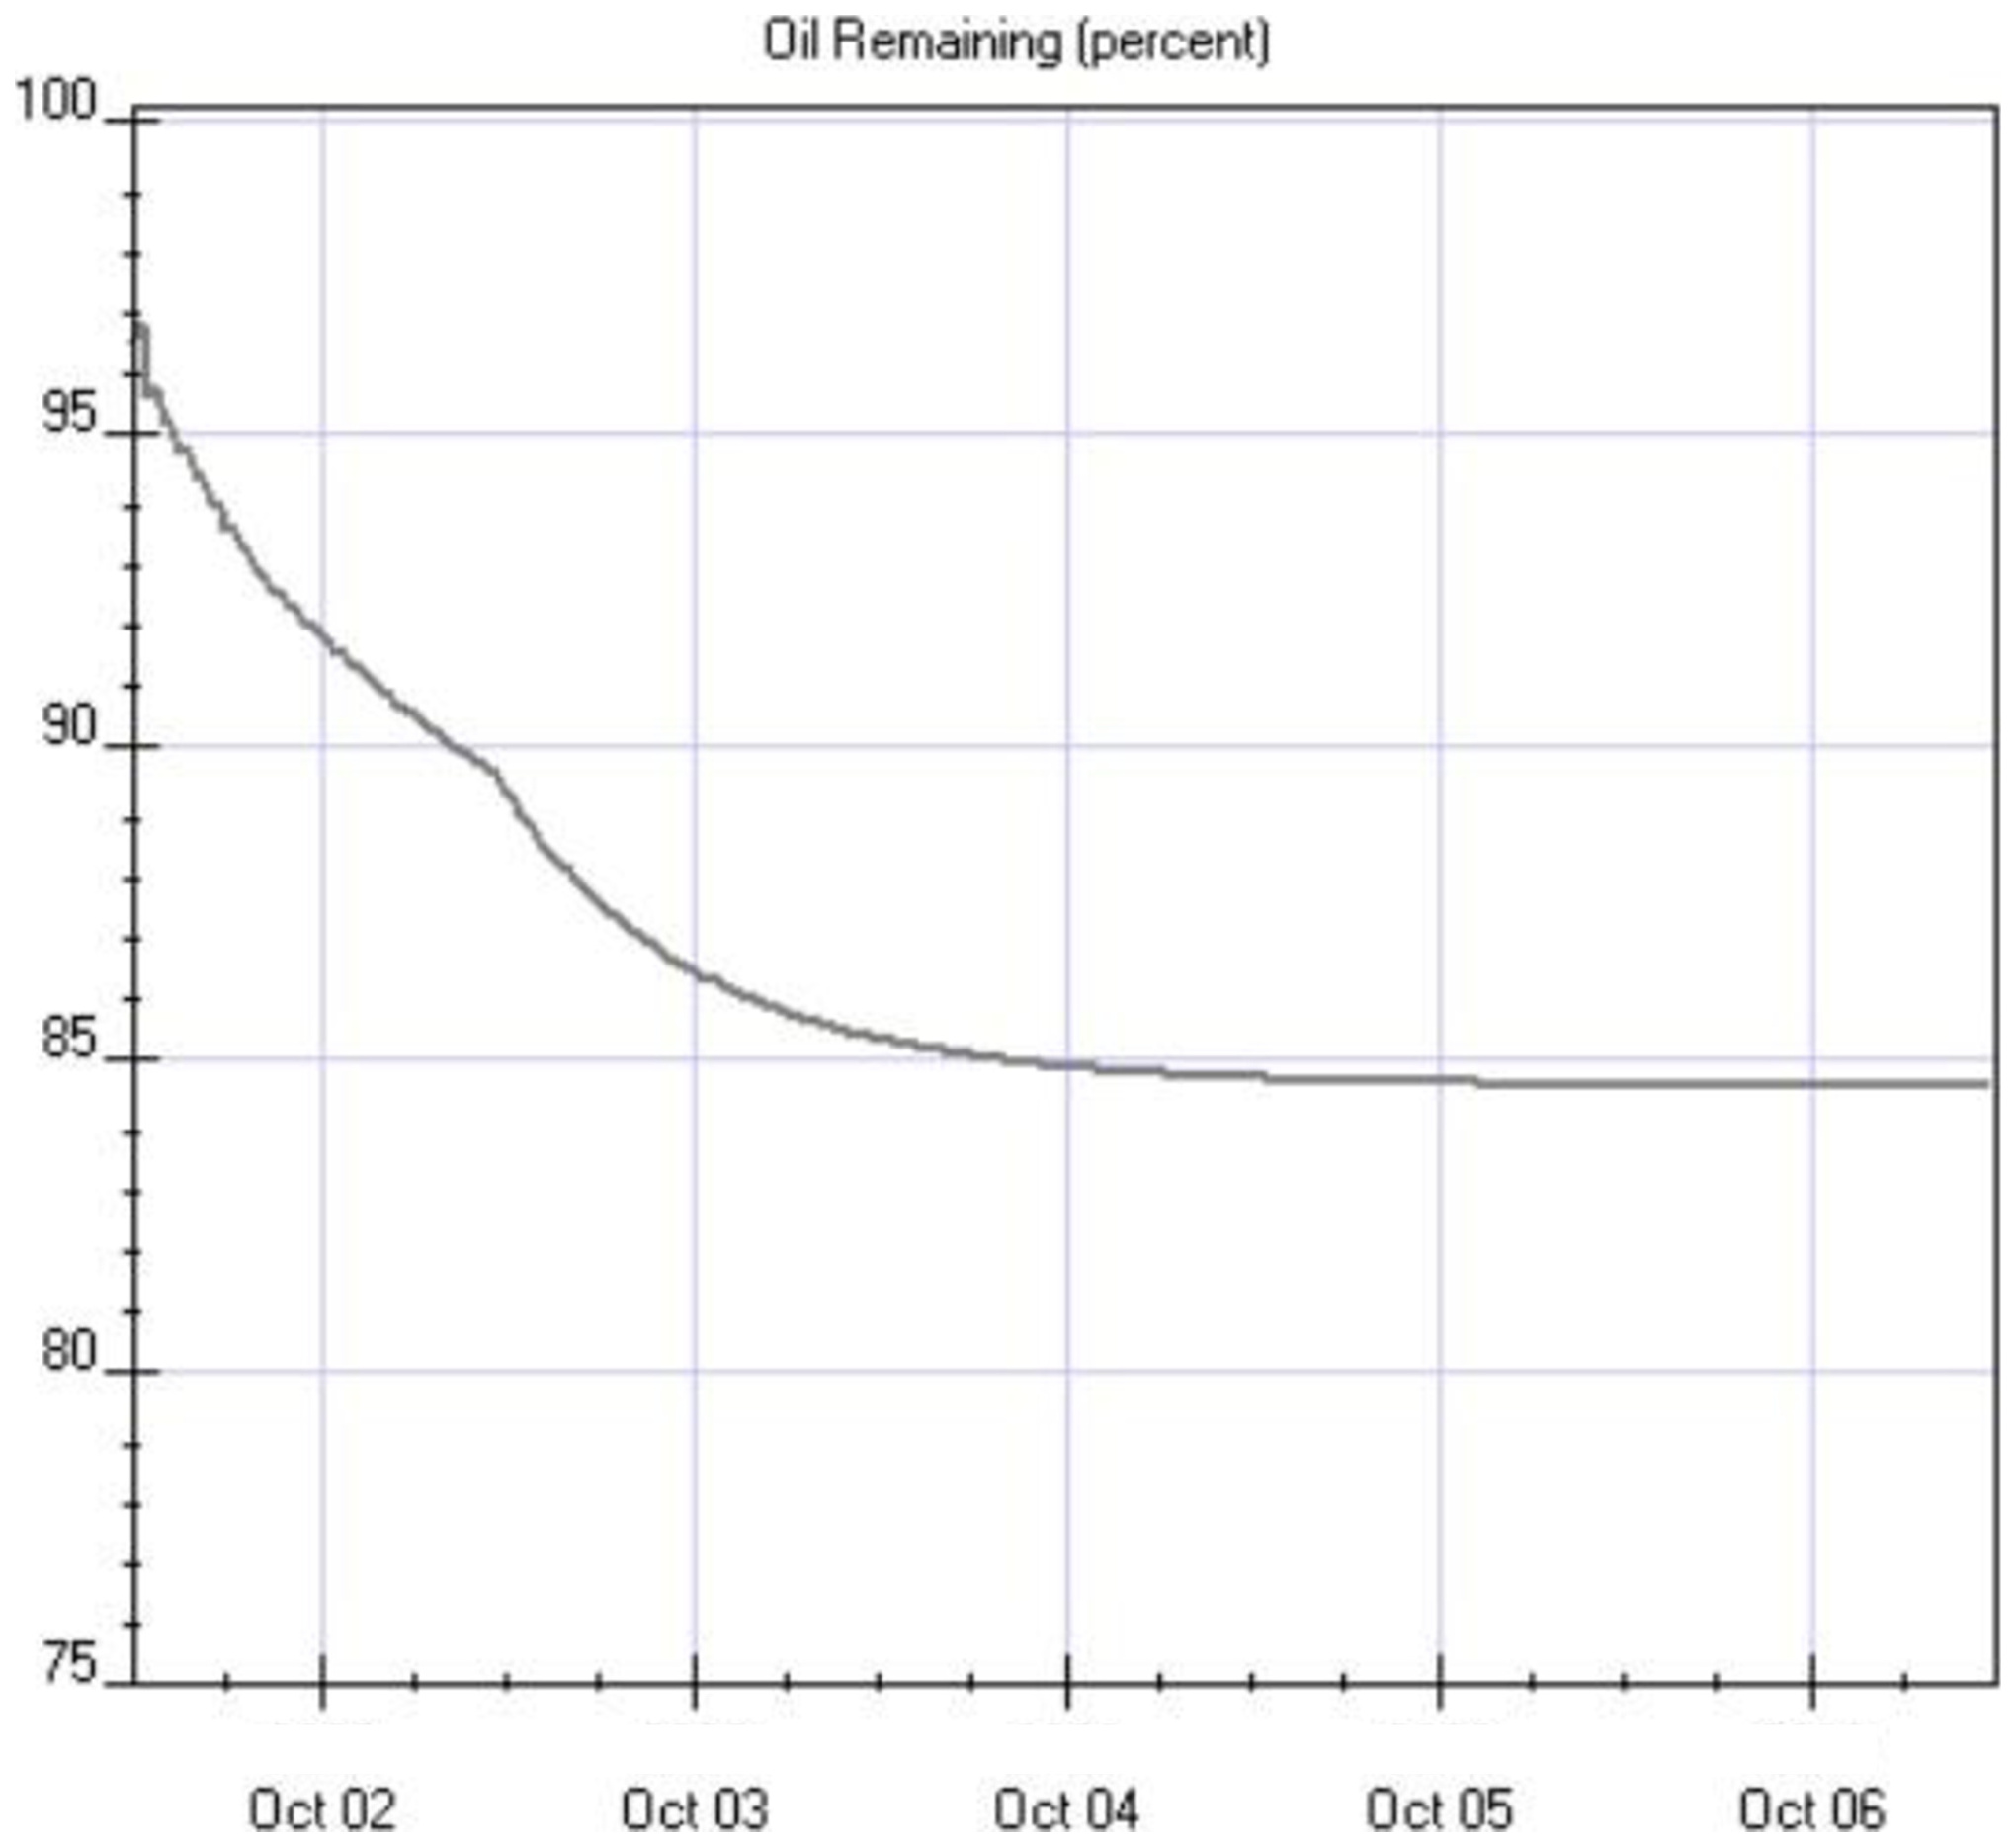
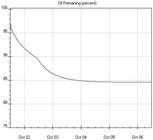
Oil decay curve obtained from the ADIOS2 program, indicating that the remaining volume after 5 days is approximately 85%.
Figure 2
Location map of the Municipality of Fortaleza and the Port of Mucuripe.
Figure 3
Monthly mean variation of wind intensity in the study area for the year 2021.
Figure 4
Wind rose during October 2021 obtained from the ECMWF.
Figure 5
Finite element mesh with 1,638 elements, used for the discretization of the modeling domain and bathymetry interpolated from nautical charts No. 701 and 710 of the DHN. The map indicates the locations of the FES2014, ERA5, and HYCOM stations, used to generate model forcings. Additionally, the positions of the tide gauge and ADCP, used for model calibration, are shown.
Figure 6
Oil decay curve obtained from the ADIOS2 program, indicating that the remaining volume after 5 days is approximately 85%.
Figure 7
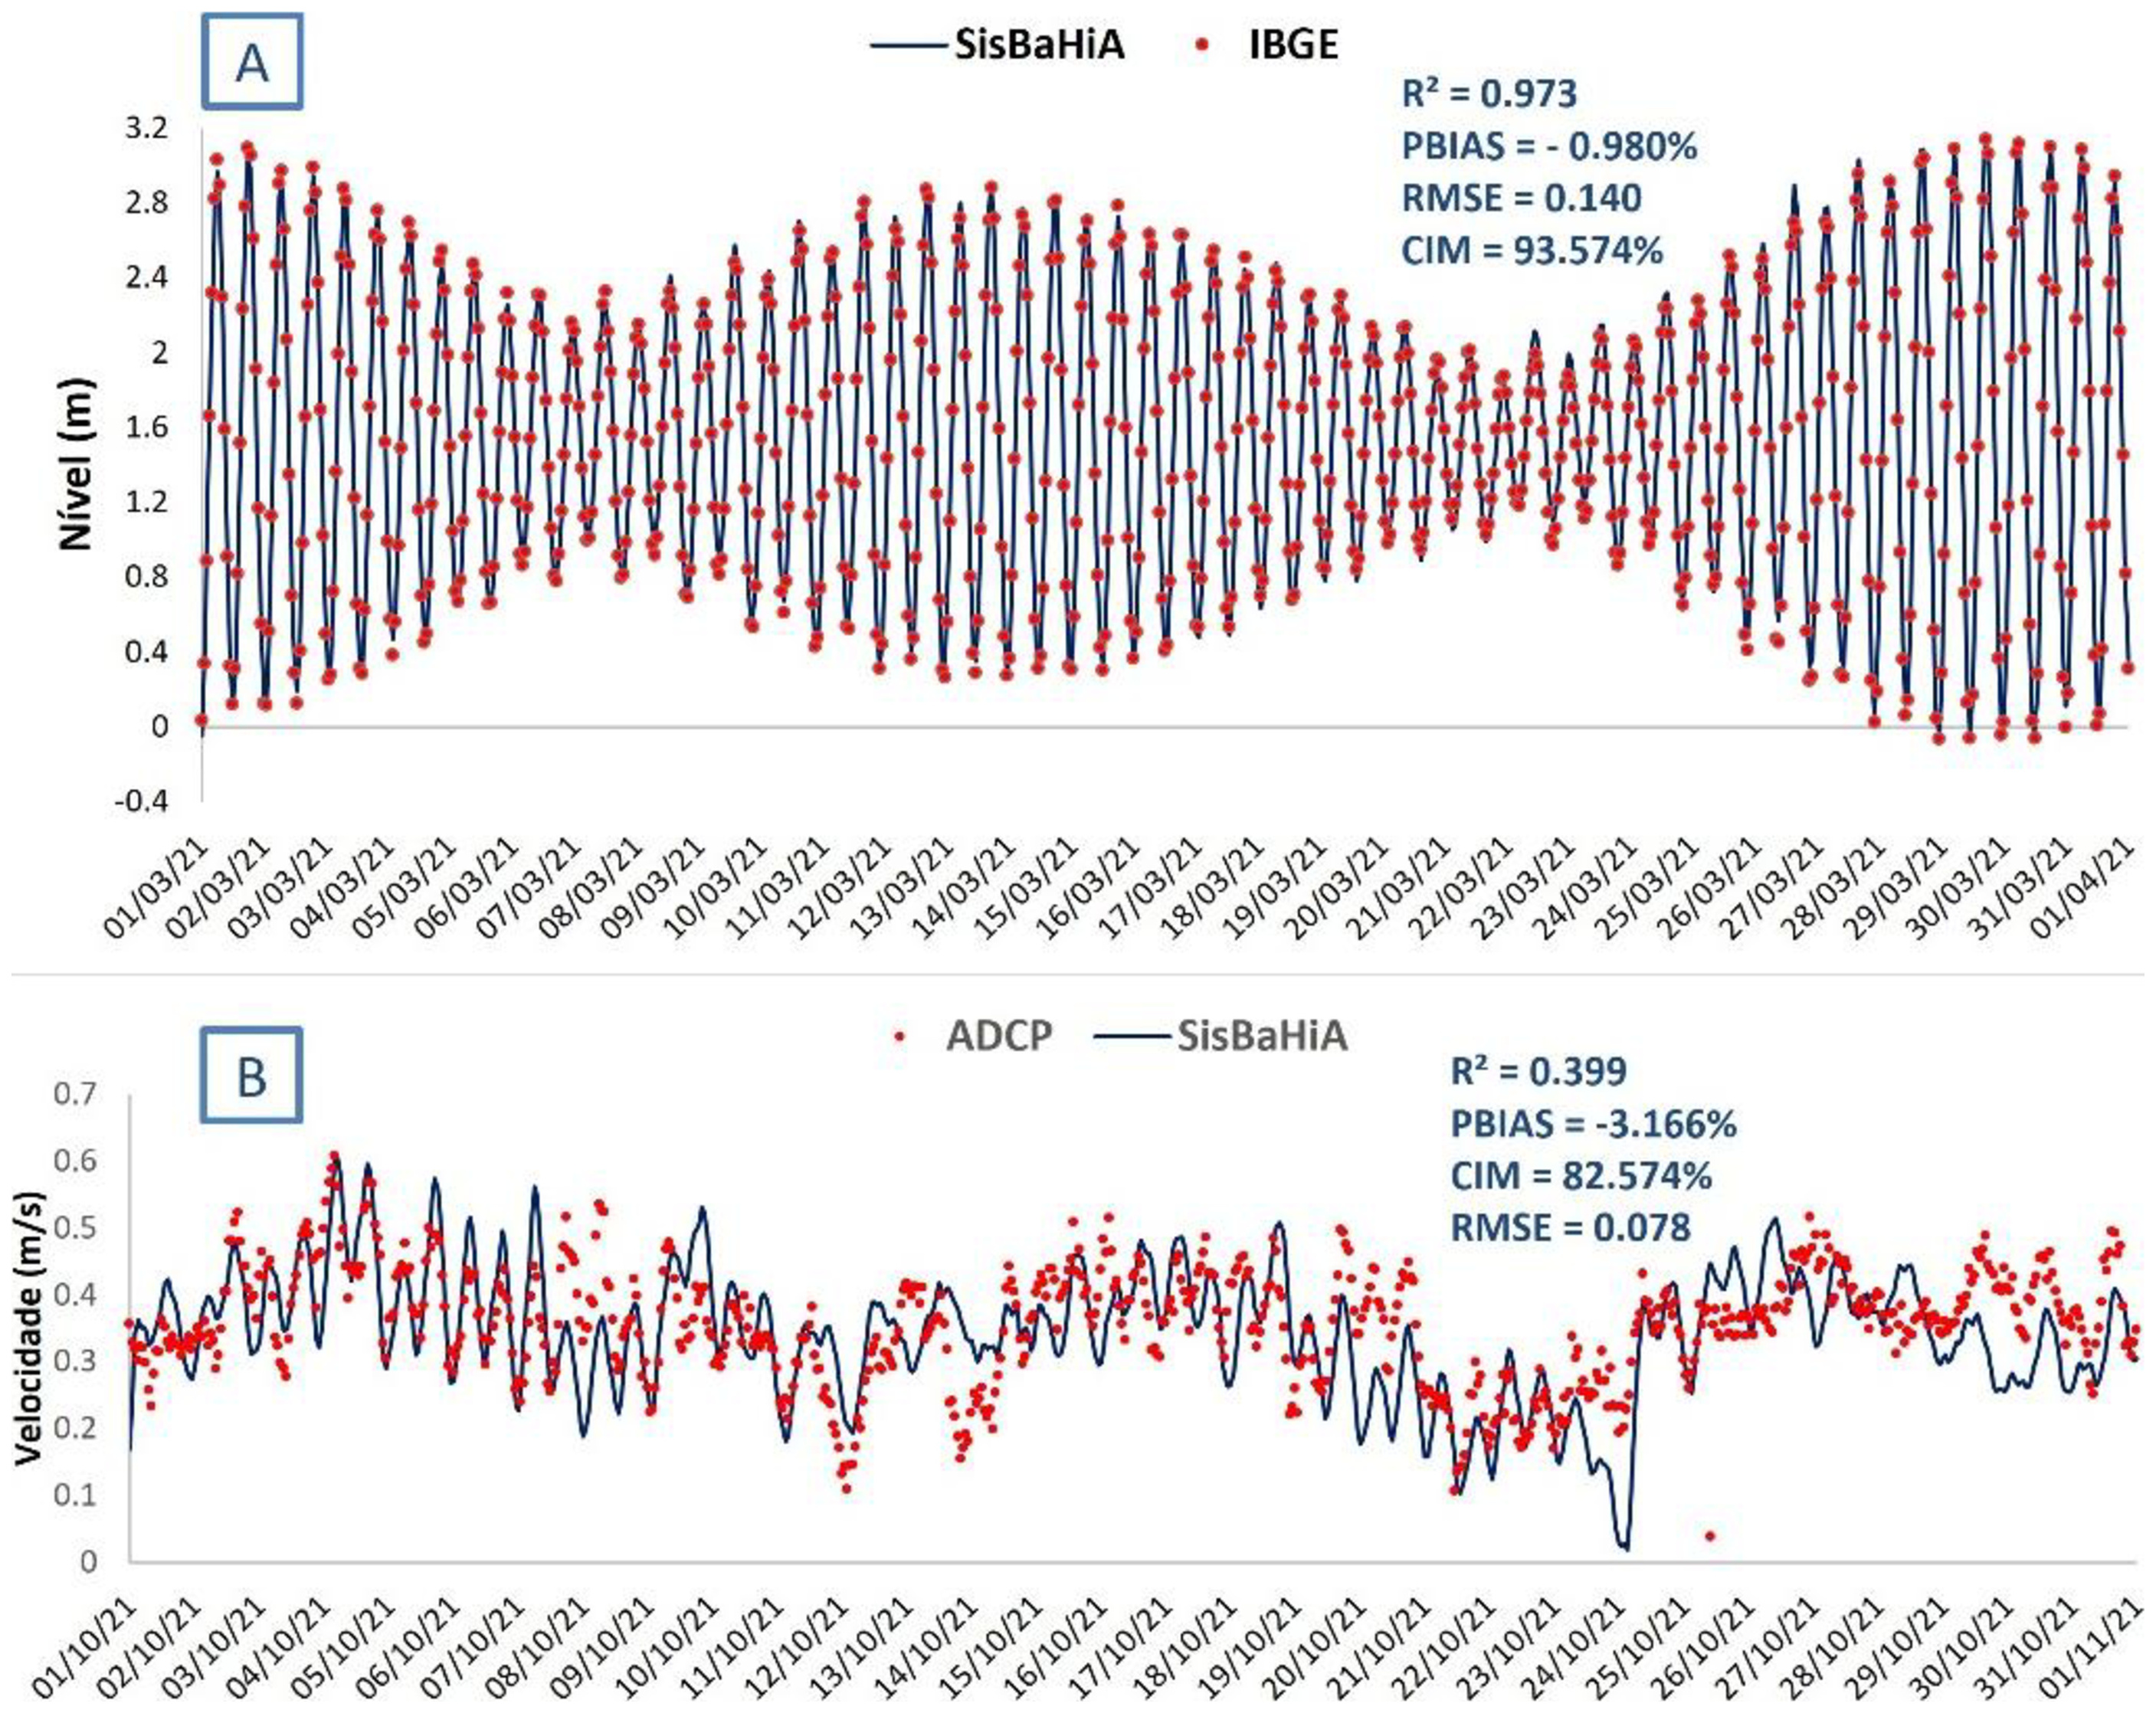
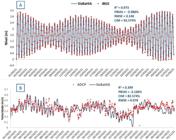
Calibration of sea level (A) and vertically averaged current intensity (B) time series.
Figure 8
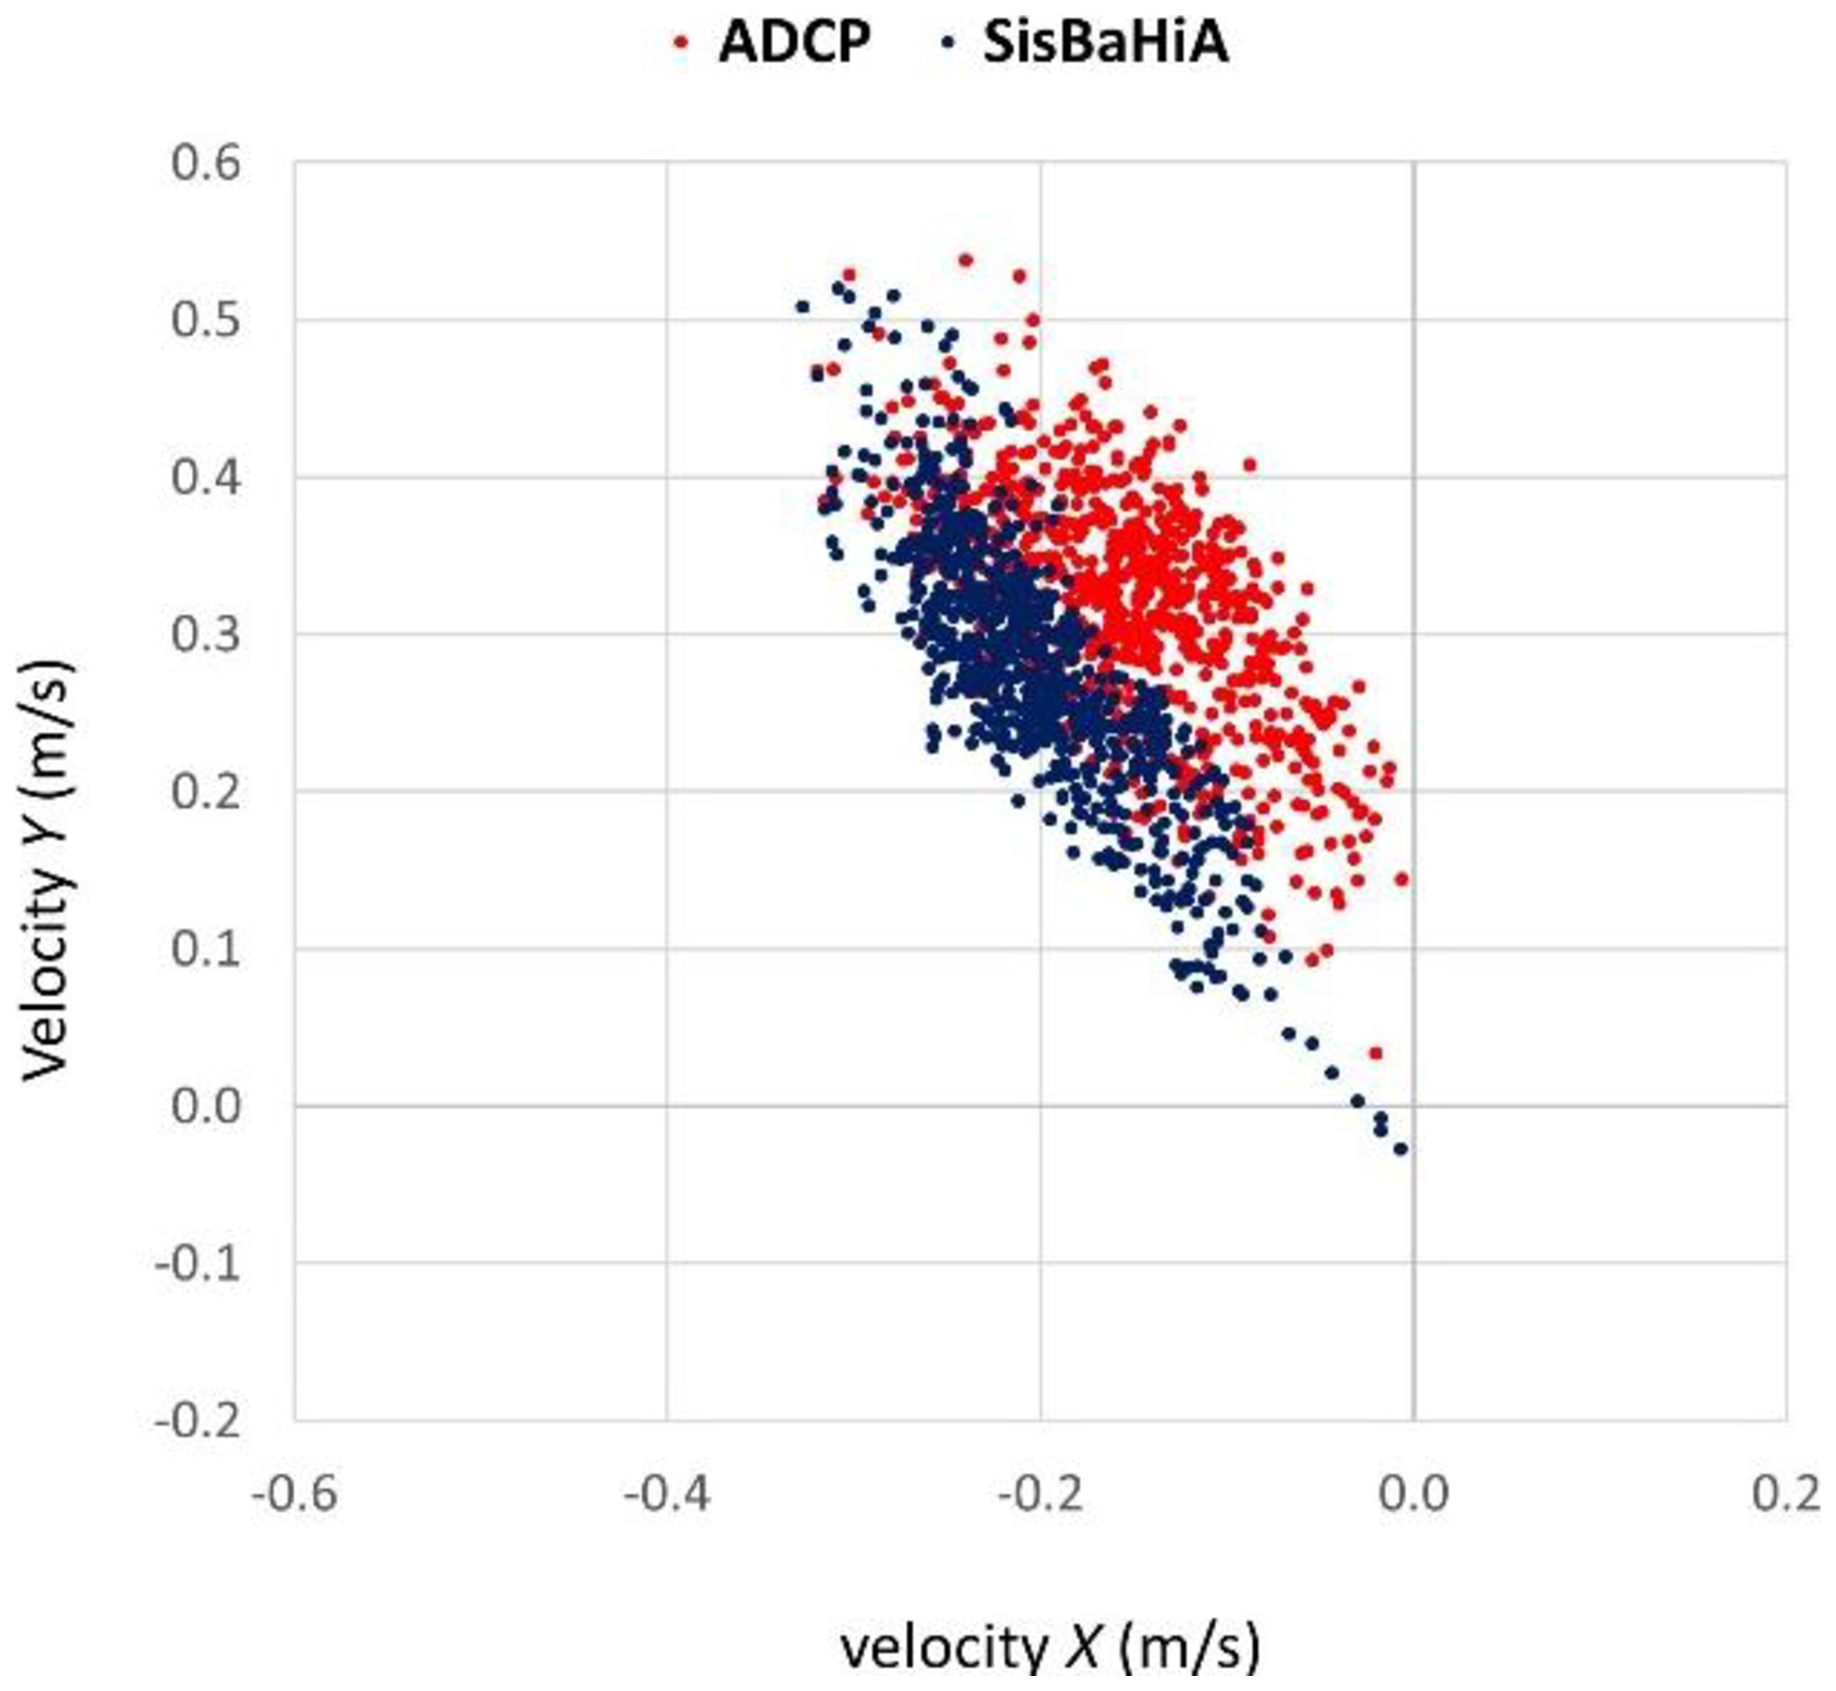
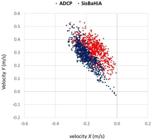
Current ellipses (dispersion) for October 2021.
Figure 9
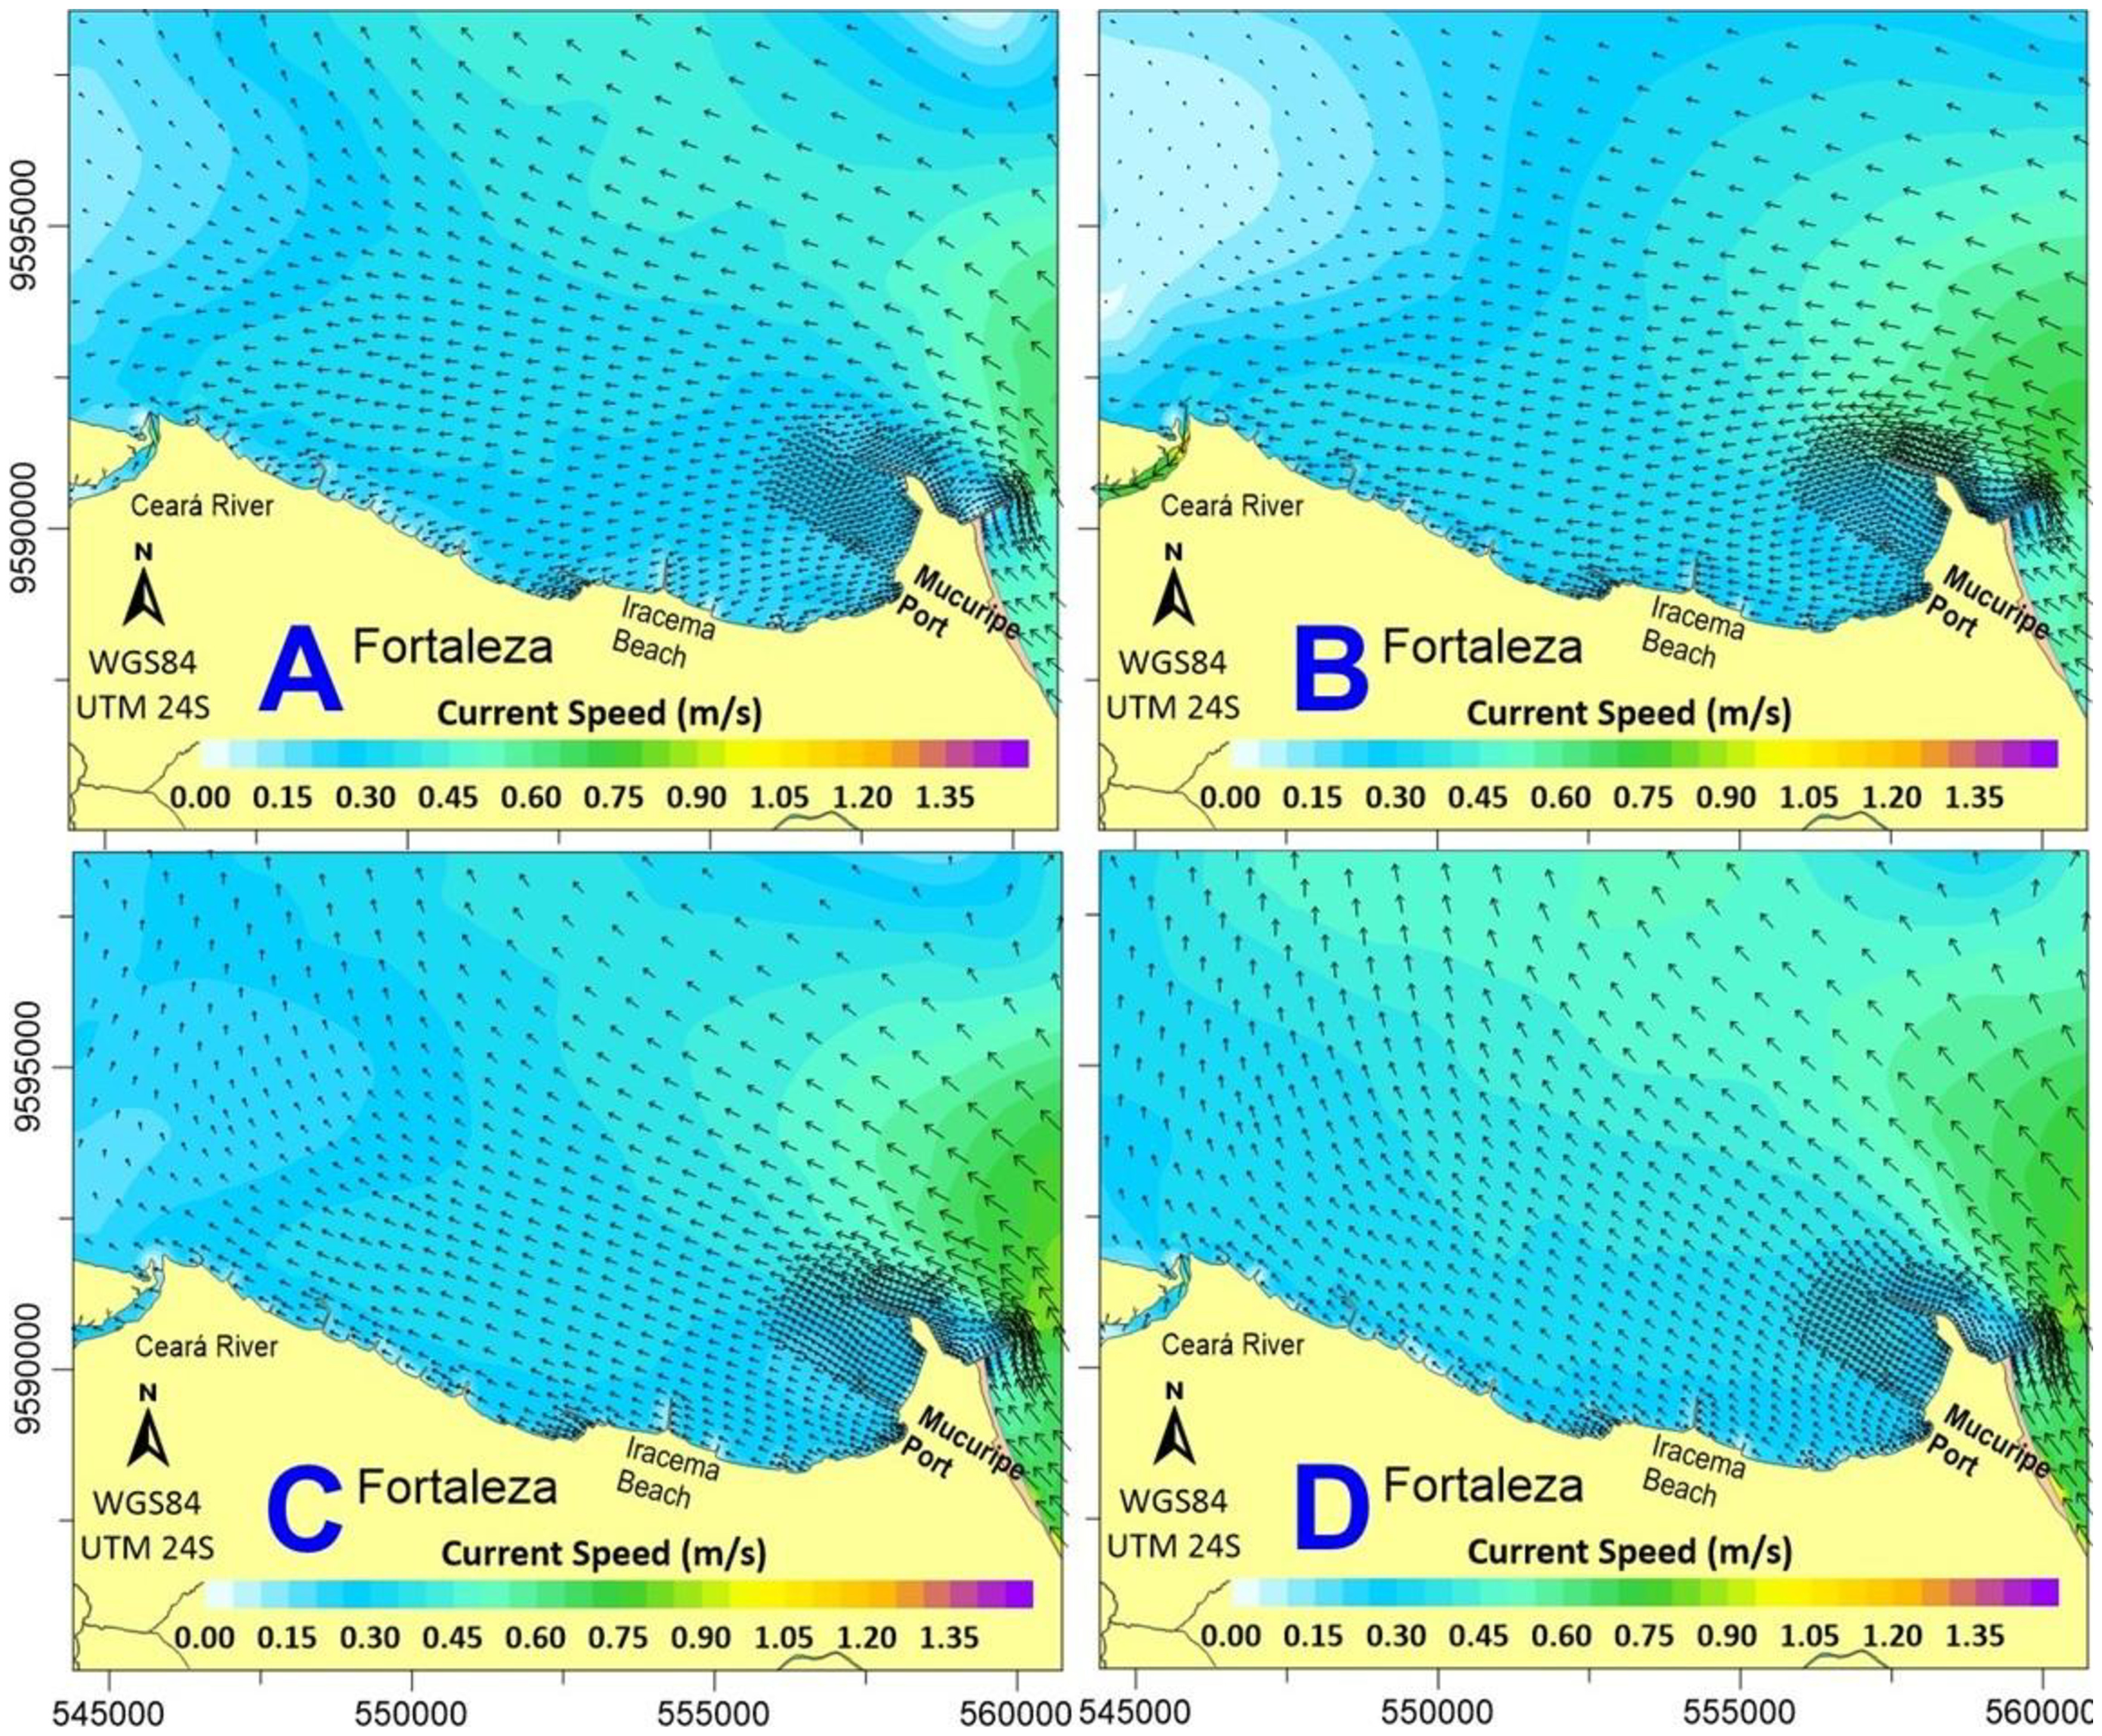
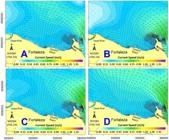
Hydrodynamic circulation pattern for typical spring low tides (A), mid-rising spring tides (B), spring high tides (C), mid-falling spring tides (D) in October 2021.
Figure 10
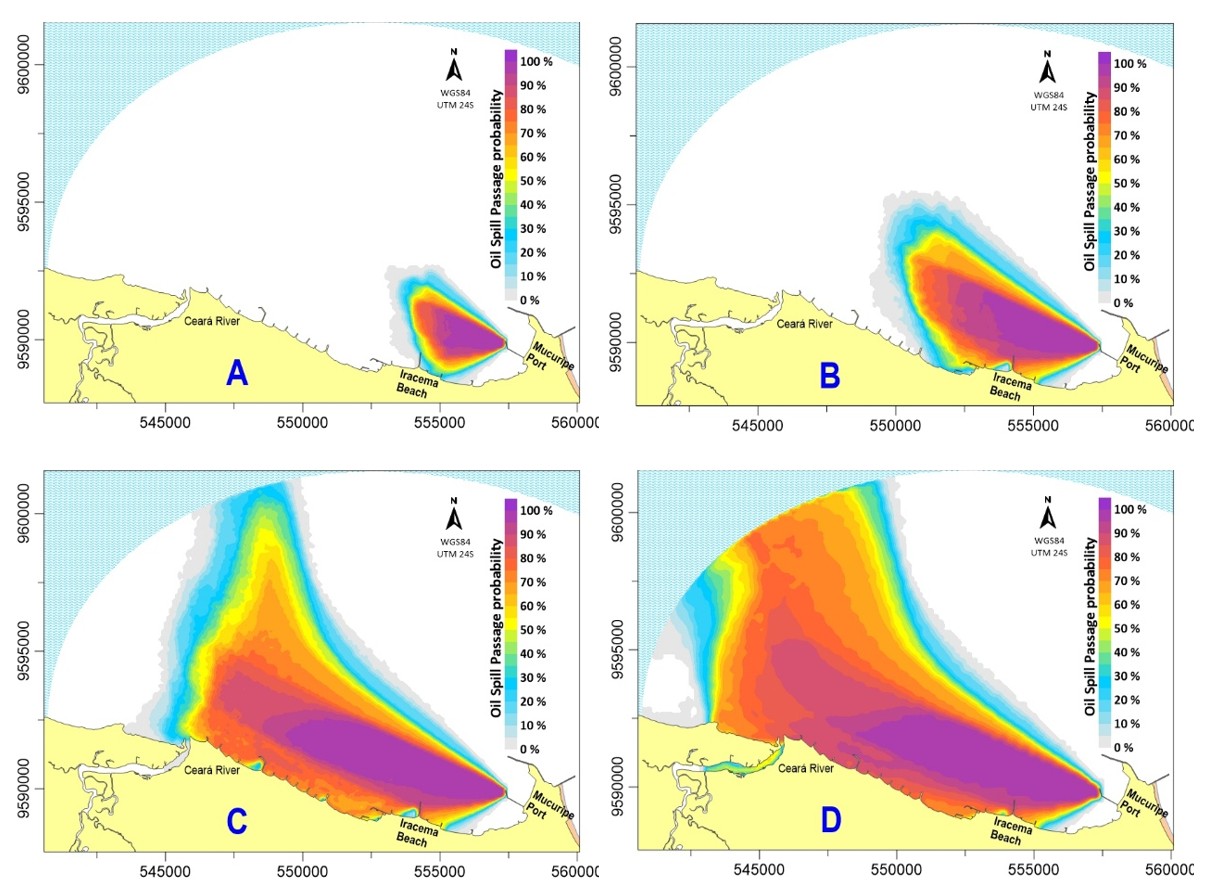
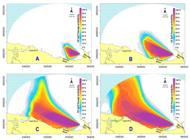
Probability of occurrence of the heavy oil slick at intervals of 3 h (A), 6 h (B), 12 h (C), and 24 h (D) after the beginning of the constant spill (24 hours) of 1,000 m3 in the month of October.
Figure 11
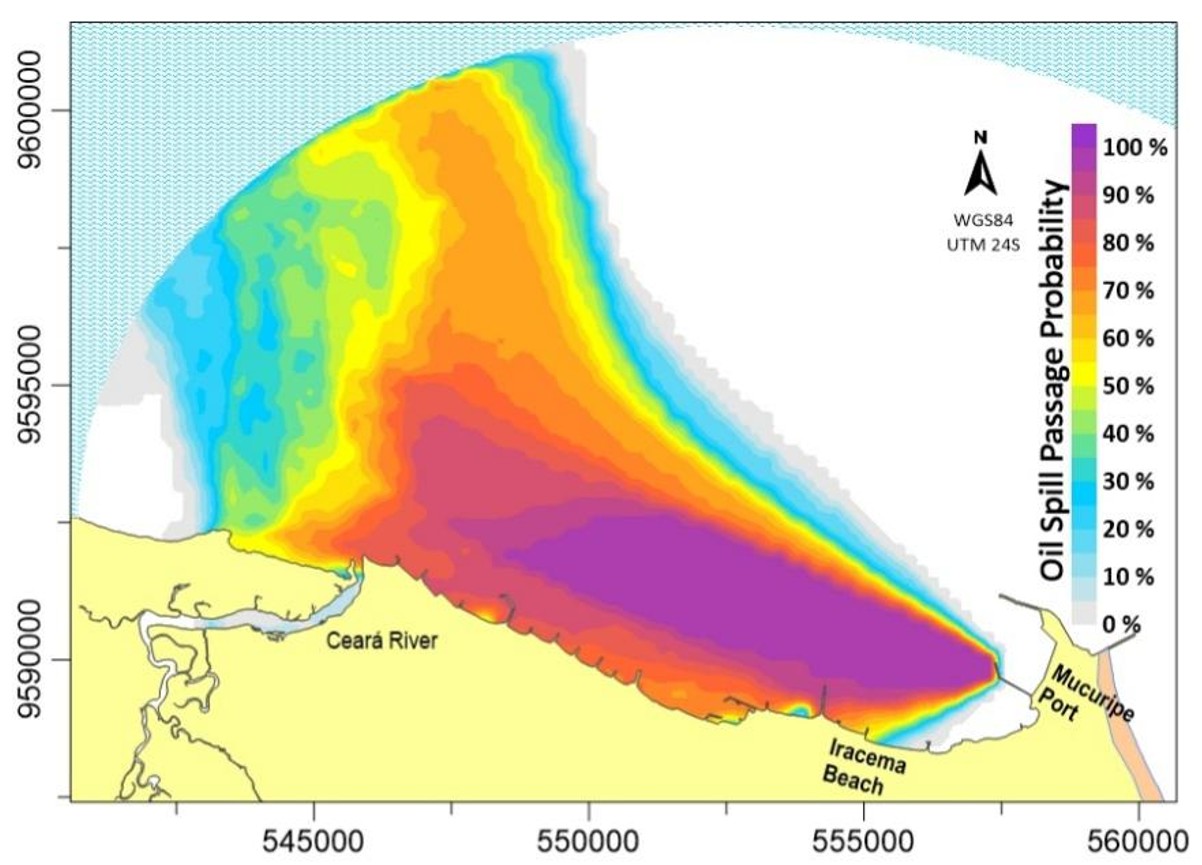
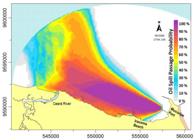
Probability of occurrence of the heavy oil slick, with concentrations exceeding 29 mg/L, during the month of October.
Figure 12
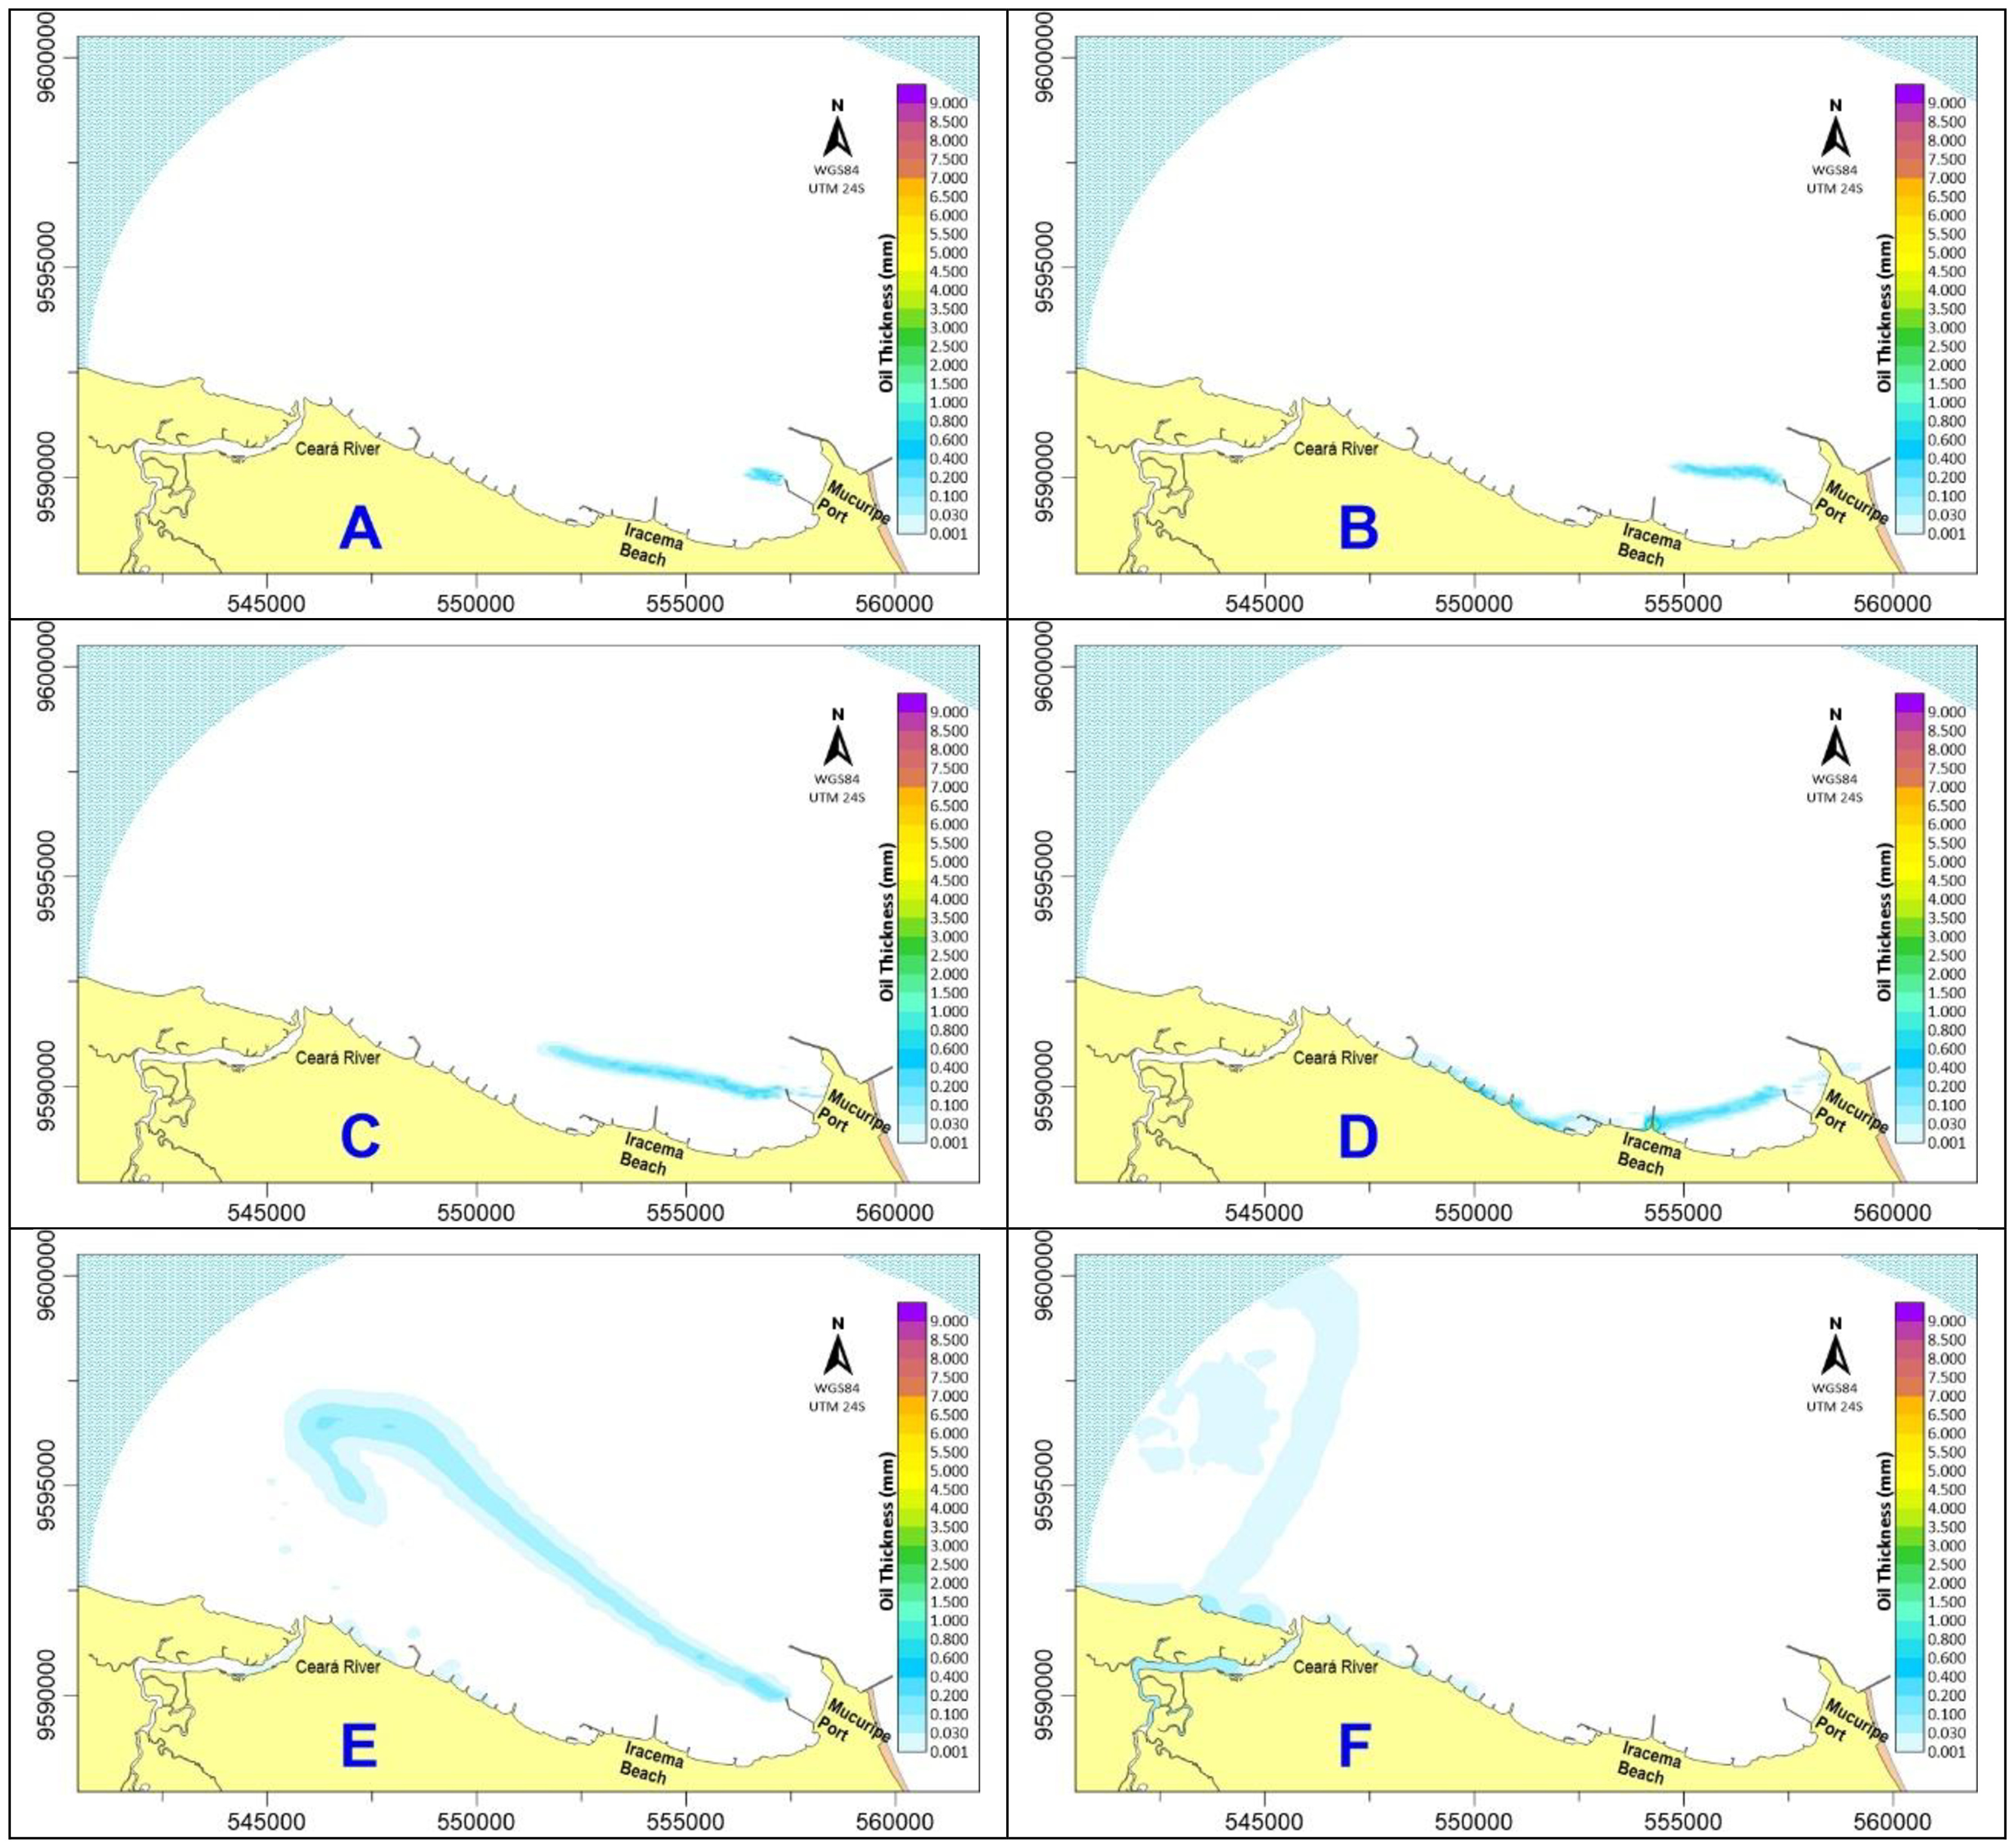
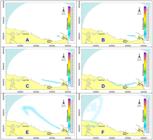
Quantitative visualization (oil film thickness isolines in the surface layer) of the slick progression resulting from a continuous spill (24 hours) of 1,000 m3, initiated on October 8, 2021, at 13:00 in times 1h (A), 3 h (B), 6 h (C), 12 h (D), 24 h (E) and 36 h (F) fter the beginning of the spill, southeast wind, mean velocity of 7.5 m/s, under spring tide conditions.
Figure 13
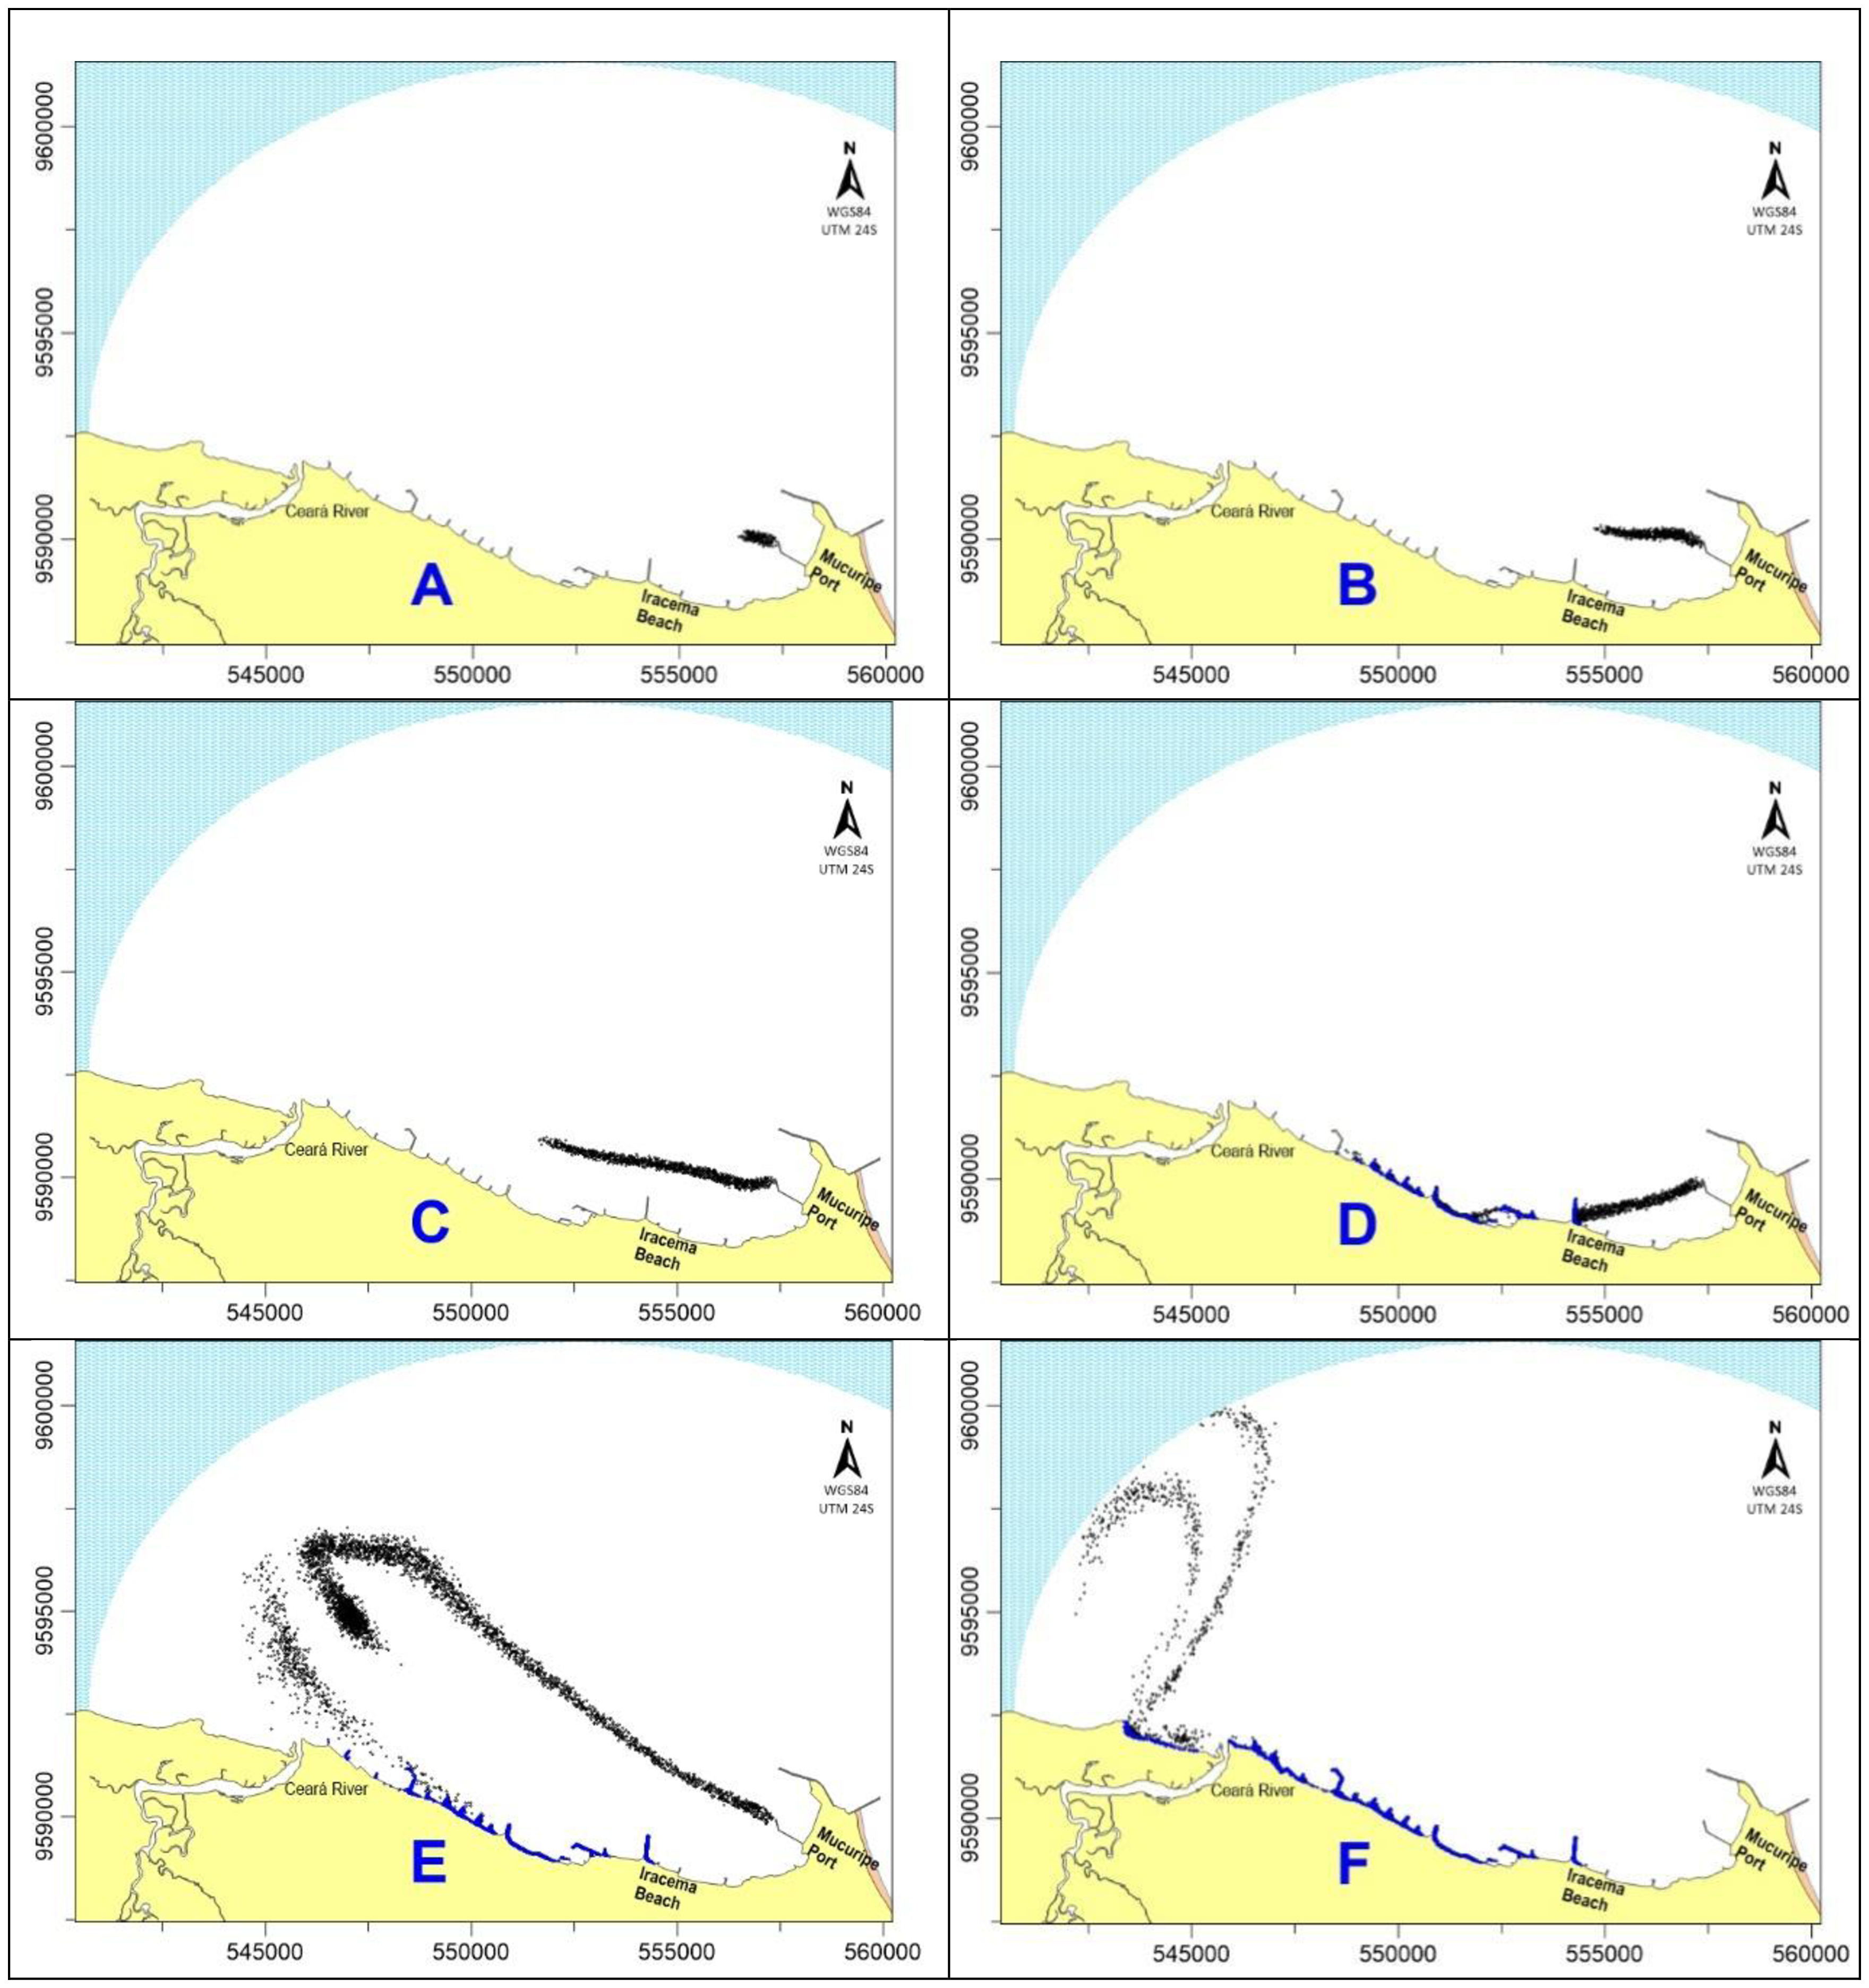
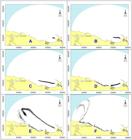
Qualitative visualization (particle cloud, with coastal segments affected by oil highlighted in blue) of the slick resulting from a continuous spill (24 hours) of 1,000 m3, initiated on October 8, 2021, at 13:00 in times 1h (A), 3 h (B), 6 h (C), 12 h (D), 24 h (E) and 36 h (F) fter the beginning of the spill, southeast wind, mean velocity of 7.5 m/s, under spring tide conditions.
Figure 10
Probability of occurrence of the heavy oil slick at intervals of 3 h (A), 6 h (B), 12 h (C), and 24 h (D) after the beginning of the constant spill (24 hours) of 1,000 m3 in the month of October.
Figure 11
Probability of occurrence of the heavy oil slick, with concentrations exceeding 29 mg/L, during the month of October.
Figure 12
Quantitative visualization (oil film thickness isolines in the surface layer) of the slick progression resulting from a continuous spill (24 hours) of 1,000 m3, initiated on October 8, 2021, at 13:00 in times 1h (A), 3 h (B), 6 h (C), 12 h (D), 24 h (E) and 36 h (F) fter the beginning of the spill, southeast wind, mean velocity of 7.5 m/s, under spring tide conditions.
Figure 13
Qualitative visualization (particle cloud, with coastal segments affected by oil highlighted in blue) of the slick resulting from a continuous spill (24 hours) of 1,000 m3, initiated on October 8, 2021, at 13:00 in times 1h (A), 3 h (B), 6 h (C), 12 h (D), 24 h (E) and 36 h (F) fter the beginning of the spill, southeast wind, mean velocity of 7.5 m/s, under spring tide conditions.

 Modelagem hidrodinâmica e de dispersão de óleo na zona costeira de Fortaleza, Nordeste do Brasil: uma ferramenta de apoio à gestão ambiental e aos planos de contingência
 Thumbnail
 Thumbnail
 Thumbnail
 Thumbnail
 Thumbnail
 Thumbnail
 Thumbnail
 Thumbnail
 Thumbnail
 Thumbnail
 Thumbnail
 Thumbnail
 Thumbnail