 Computational fluid-dynamic analysis of an automated floodgate for capacity gains in hydroelectric powerplants
ABSTRACT
Brazil has an elevated dependence on hydroelectric powerplants, both in terms of production of renewable energy as well as providing stability to the energy grid while using intermittent energy sources. Despite these challenges, the country currently encounters environmental and social restrictions to build new dams. Thus, the use of alternatives to improve efficiency, such as heightening reservoir walls through the use of floodgates, has become more relevant. The dimensions of these systems should be determined in order not to compromise the reservoir’s safety. In light of this, this study presents the hydrodynamic evaluation of a heightening system for capacity gains, flow control, and increasing energy generation at the Cipó hydroelectric plant in southern region of the state Minas Gerais, Brazil. The heightening system proposed in this study is based on an automated floodgate with a curvilinear profile. The analyses were conducted in a physics laboratory as well as virtually through computational fluid dynamics (CFD) tools. To model the problem, a two-phase steady state flow was adopted. The floodgate demonstrated satisfactory behavior, capable of opening and closing as the static pressure from the water volume overloaded its center of gravity, controlling the volume within the reservoir.
Keywords:
Automated floodgate; Reservoir; Dam, spillway; Computational fluid dynamics; Free surface
RESUMO
O Brasil é um país com elevada dependência de reservatórios hidrelétricos, tanto para produção de eletricidade renovável quanto para fornecer estabilidade ao sistema em face do uso de fontes intermitentes. Contudo, o país também enfrenta restrições ambientais e sociais para a criação de novos reservatórios. Neste contexto, o uso de alternativas que melhorem a eficiência dos reservatórios, como o alteamento de barragens por meio de comportas, se tornam relevantes. O dimensionamento desses sistemas deve ser realizado de maneira a não comprometer a segurança da barragem. Neste contexto, este trabalho apresenta a avaliação hidrodinâmica de um sistema de alteamento para ganho de capacidade, controle de vazão e acréscimo da geração de energia na barragem de Cipó, no Sul de Estado de Minas Gerais, Brasil. O sistema alteamento proposto nesse trabalho se baseia em uma comporta auto operante de perfil curvilíneo. As análises foram realizadas tanto em laboratório físico quanto em laboratório virtual, por meio de ferramentas CFD. Para modelagem do problema, foi adotado um escoamento bifásico em regime permanente. A comporta avaliada apresentou comportamento satisfatório, sendo capaz de abrir e fechar conforme a pressão estática do volume de água sobrecarregava o seu centro de gravidade, controlando o volume dentro do reservatório.
Palavras-chave:
Comporta auto operante; Reservatório; Barragem; Vertedouro, CFD; Superfície livre
INTRODUCTION
Hydroelectric energy is the main energy generation form in Brazil, comprising 53.4% of the national grid through 2021. It is also the main renewable energy form in the country (Empresa de Pesquisa Energética, 2021). Of all the installed power in Brazilian hydroelectric plants, 94% resides in large hydroelectric plants (Agência Nacional de Energia Elétrica, 2025), many of which have large reservoirs for accumulating water, in turn making the country dependent on these structures. The largest reservoirs in terms of water accumulation are Serra da Mesa (43.25 km3) and Tucuruí (38.89 km3); most of the large reservoirs are located in the Southeast, South, and Central West, which are the regions with the highest demand (Dias et al., 2018).
Hydroelectric reservoirs play an important role in providing security and support to the energy grid, allowing for the use of intermittent renewable energy forms such as solar and wind power (Empresa de Pesquisa Energética, 2018). However, this also makes the Brazilian energy matrix more vulnerable to dry seasons and severe droughts. Such events have become all the more recurrent in the Brazilian reality, which have influenced the functioning of these reservoirs in many opportunities, such as in 2011, 2013-2015 and 2021 (Goldenberg & Prado, 2003; Galvão & Bermann, 2015; Empresa Brasil de Comunicação, 2021; Hunt et al., 2022). Due to these environmental impacts, the construction of large power plants as reservoirs for accumulating water has become more restricted and regulated in Brazil, fueling debates and a national conversation on the topic (Associação Brasileira de Pequenas Centrais Hidrelétricas e Centrais Geradoras Hidrelétricas, 2019).
The impact of potential climatic changes on reservoirs also must be considered. Caceres et al. (2021) evaluated the potential impact of climate change on 134 hydroelectric dams above 100 MW in South America. The authors concluded that, for the regions under study in Brazil, there is a tendency in useful capacity reductions during the dry season and slight gains in useful capacity during the rainy season. This information points to the need for new mechanisms for energy storage in Brazil as well as the use of more efficient resources. In light of this, an attractive option for the Brazilian scenario is heightening existing hydroelectric structures.
During the rainy season, excess volumes are released through spillways. However, all of this volume could be stored for future use in a safe way and controlled so that the excess does not compromise the dam structure. Reservoir wall heightening is one of the ways this can be achieved. Increased reservoir storage capacity through elevated water levels makes it possible to handle unexpected demands, in turn reducing seasonal variability and contributing to the consolidation of multiple uses (Santos, 2018). Through dam wall heightening, it is possible to guarantee greater flow for the project as a whole. Flow reliability is an important parameter for hydroelectric potential studies, as demonstrated in the results from Tefera & Kasiviswanathan (2022) and Gernaat et al. (2017).
Heightening projects can be realized through installation of floodgates or mobile dams above the spillway level, and multiple authors have proposed multiple mechanisms to execute such endeavors. Chevalier (2004) and HYDROPLUS (2017) feature a trapezoidal section fusible gate that can be installed above reservoirs. Opening the floodgate happens due to the balance of forces when the water level reaches a determined point. Another example is Ross (1998), who proposes a floodgate to control the flow through a mobile dam connected to the spillway through rotating hinges between an upper, closed position, which is projected on top of the crest of the spillway to increase its altitude, and a lower, open position. The floodgate is molded to open and close automatically and uses a counterweight system. Its surface is convex upstream. A more complete review of these types of structures can be found in Santos et al. (2022).
Santos et al. (2022) also studied impacts in terms of the increase of flow and energy produced in the hydro power plants downstream due to the installation of heightening structures in upstream dams in the Cipó dam, in Minas Gerais, Brazil. The authors did not study any specific structure, focusing their analysis on the benefits of heightening in general. In conclusion, the authors observed that the energy gains would compensate investments of up to 500,000 USD over five years, which was a satisfactory result for the case study. The structural flow study, including reservoirs, dams, and spillways, is key to the solution of problems related to hydraulic engineering, such as hydrodynamics and water retention (Ziemińska-Stolarska et al., 2015), being central to the study of reservoir heightening structures.
Computational fluid dynamics (CFD) techniques are able to aid in designing such structures, as these tools are based on equations of the laws of conservation (Tu et al., 2013). These techniques enable the development of modern designs aimed at achieving the highest possible efficiency (Botan et al., 2021). Modern projects aiming at minimum losses and maximum efficiencies Kumcu (2017) and Muhammad & Ullah (2021) present, in each of their studies using different CFD softwares, important contributions to the investigation of fluid dynamic behavior on varying spillway types, which are reproducible in cases of overflow self-operating gates for heightening reservoirs. Despite the use of CFD techniques, a complete study on any hydraulic structure requires validation with physical tests (Bennett et al., 2018).
In addition to the well-established use in hydraulic structures, CFD modeling is also employed for assessing novel designs or significant departures from standard configurations (Chesterton et al., 2019). Another relevant application of CFD related to dams is in the study of dam-break events. This problem has been extensively investigated in 2D and 3D using different turbulence models by Simsek & Islek (2023). Once a dam-break incident occurs in cascade reservoirs, it may trigger successive downstream dam-breaks, making the study of this phenomenon particularly relevant (Qiu et al., 2024). In the study by Qiu et al. (2024), the authors employed a coupling of CFD with the discrete element method based on Euler–Lagrangian theory. Sediment concentration and upstream and downstream water levels were identified as the main factors affecting the evolution of the dam-break flood.
As limited attention has been given to the specific influence of flow parameters in different gate configurations, the study by Moghadam et al. (2025) provides valuable insight into the effects of variations in flow depth, as well as average and maximum velocities, in both single- and double-gate scenarios using numerical modeling. The authors concluded that a double-gate configuration helps reduce the maximum velocity at the center of the spillway, thereby decreasing the structural risks associated with these components.
Given the context presented above, Brazilian dependence on reservoirs, the restrictions for creating new reservoirs in the country and the possibility of heightening through floodgates, the present study develops and evaluates a self-operating device to gain storage capacity of reservoirs. The planned device was tested both in physical and virtual laboratory and was developed for operation in the Creager spillway of the Ribeirão do Cipó Dam, in the city Poços de Caldas located in the southeastern state Minas Gerais, Brazil, enabling a gain of 1m of water column storage. This study complements the work by Santos et al. (2022) for proposing a heightening structure for the same dam in which the authors studied the energy and economic benefits of heightening.
METHODOLOGY
This study methodology is divided into three stages. The first refers to the presentation of the floodgate model chosen for heightening the dam. The second comprises the CFD analysis of the experiment and functions to determine the behavior of the flow related to the self-operating floodgate and in turn obtaining a forecast of the operating conditions. Finally, the third step aims to validate the results obtained in CFD with physical model tests in the laboratory. Each of these steps is described in detail in the following topics.
Description of the floodgate technology
The automated floodgate developed is meant to heighten the existing dam wall and operates as a security device during overflow seasons. For the study developed for the Cipó dam, the parameters of interest in the hydraulic-hydrological study are described in Table 1, according to Souza Junior (2018).
Parameters for the hydraulic-hydrological study of the Cipó reservoir (Souza Junior, 2018; Santos, 2018).
The hydraulic-hydrological study of heightening the studied dam has already been carried out in previous studies (Souza Junior, 2018; Santos, 2018). Such studies conducted system dimensioning considering a one-meter increase of the spillage level, which represents a capacity gain of around 4.2,106 m3 in relation to the usual conditions. The authors also concluded that the reference flow of the raised reservoir can be considered equal to 2.4 m3/s.
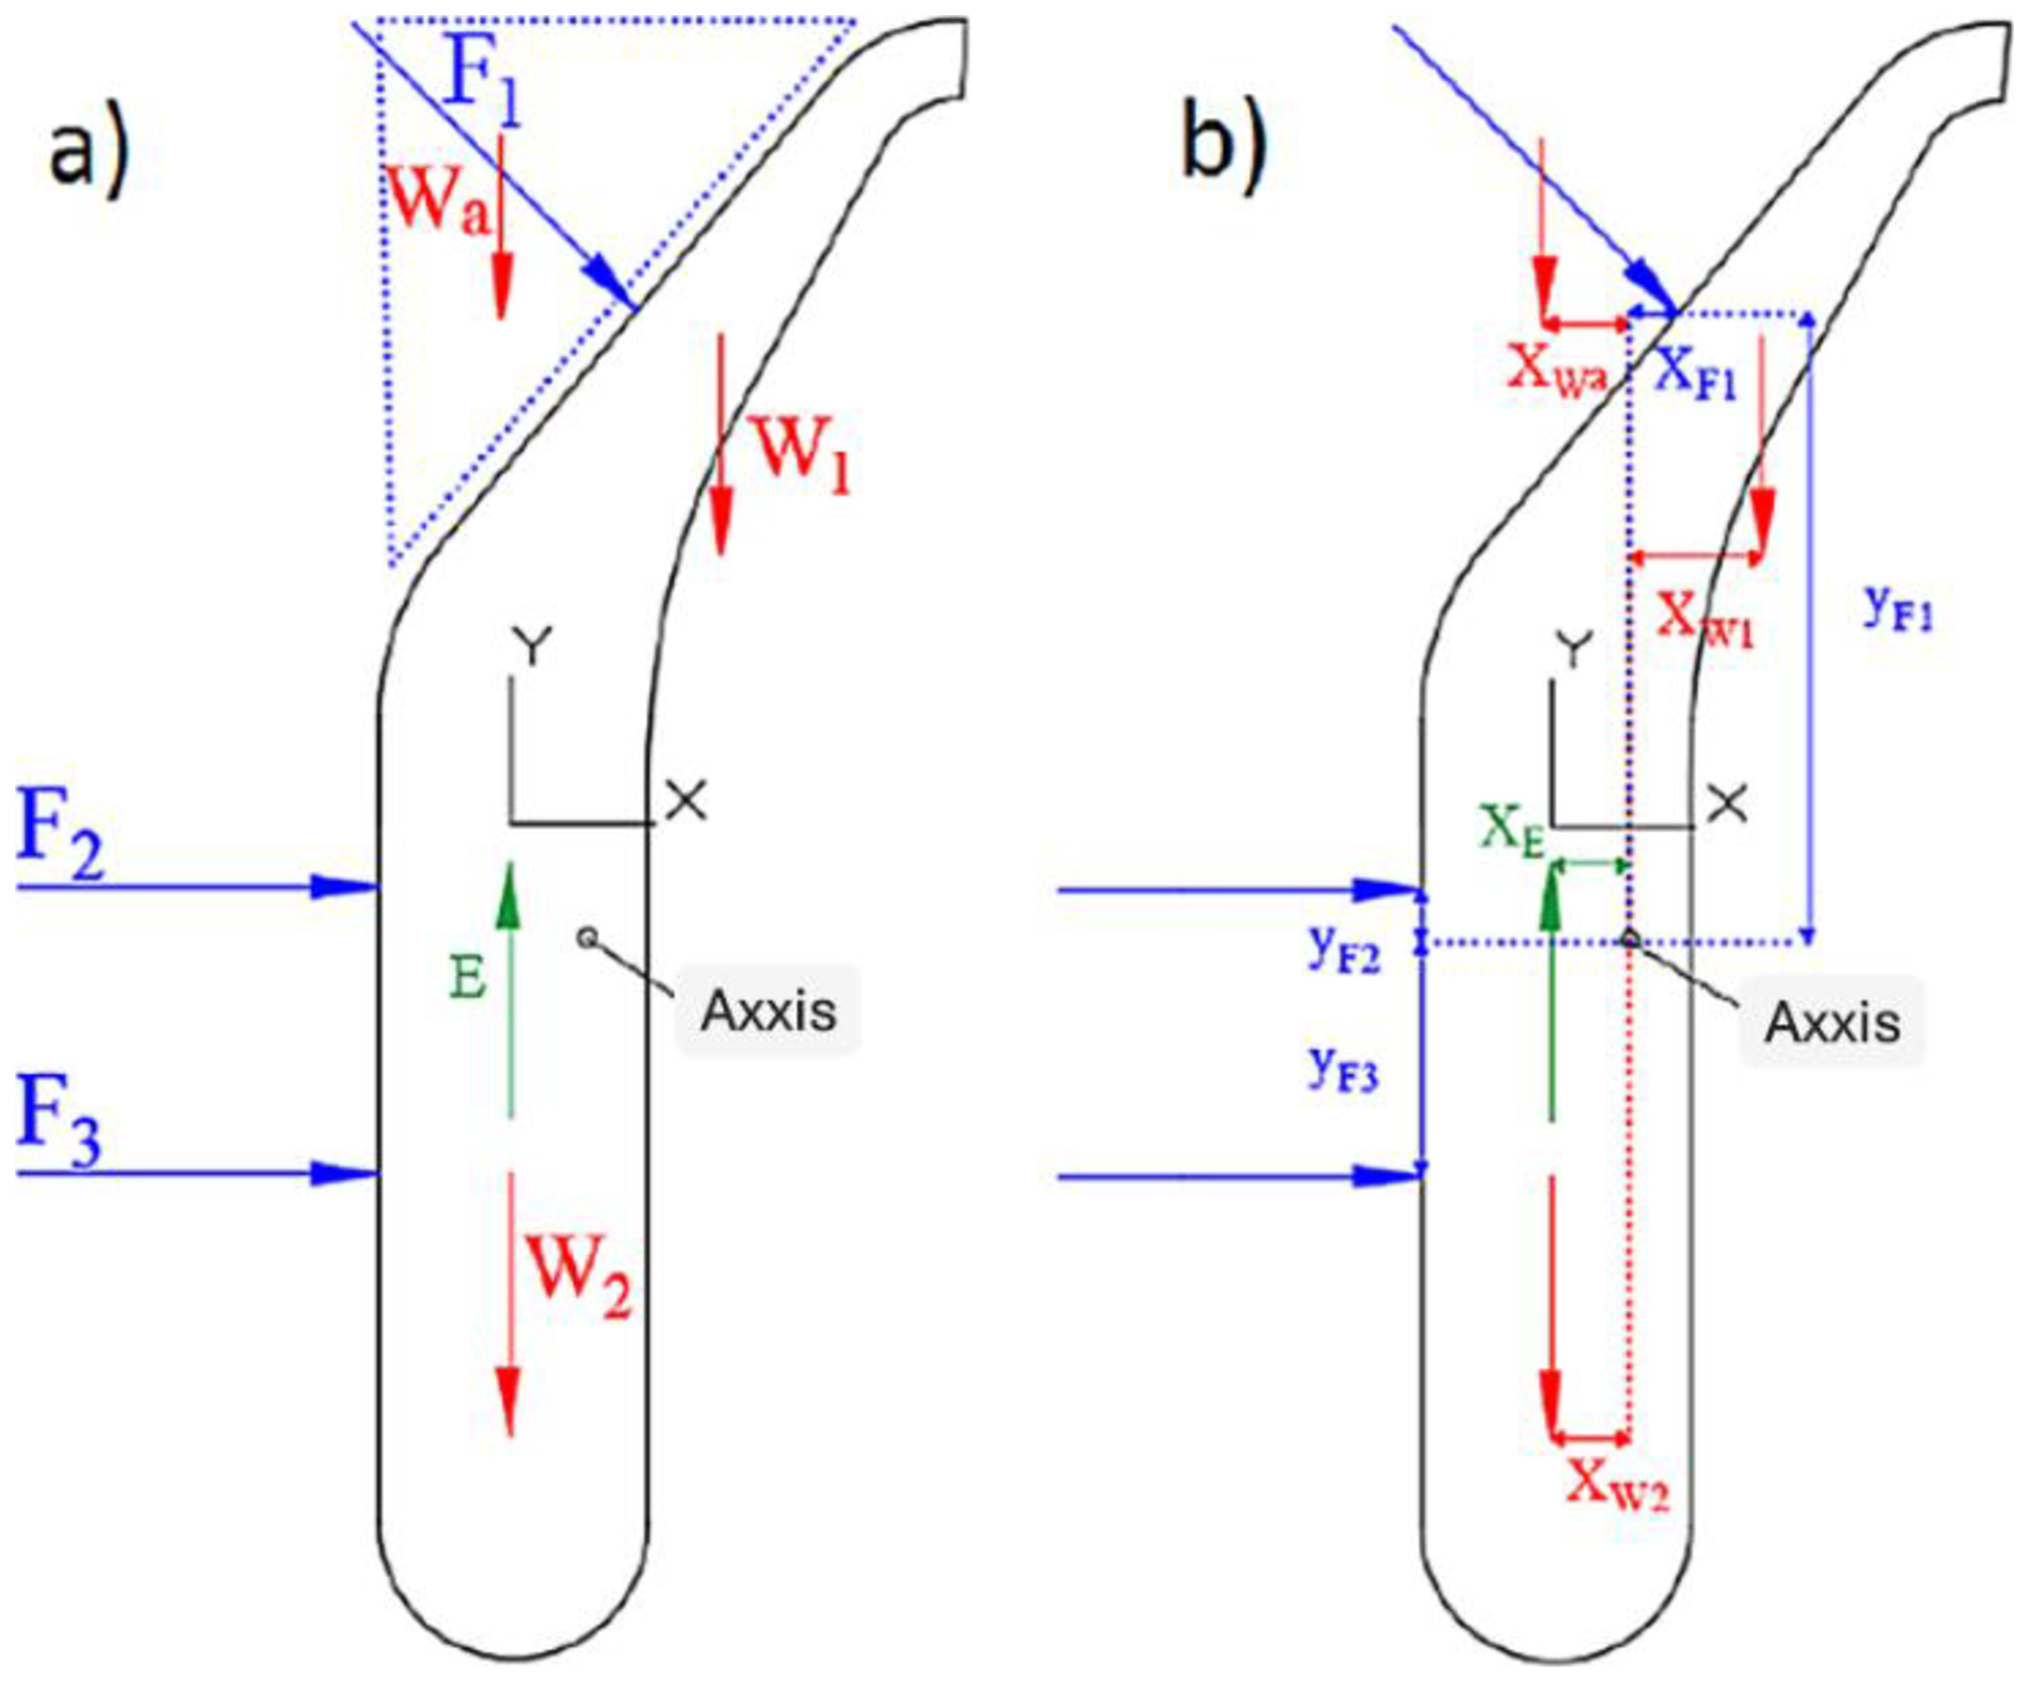
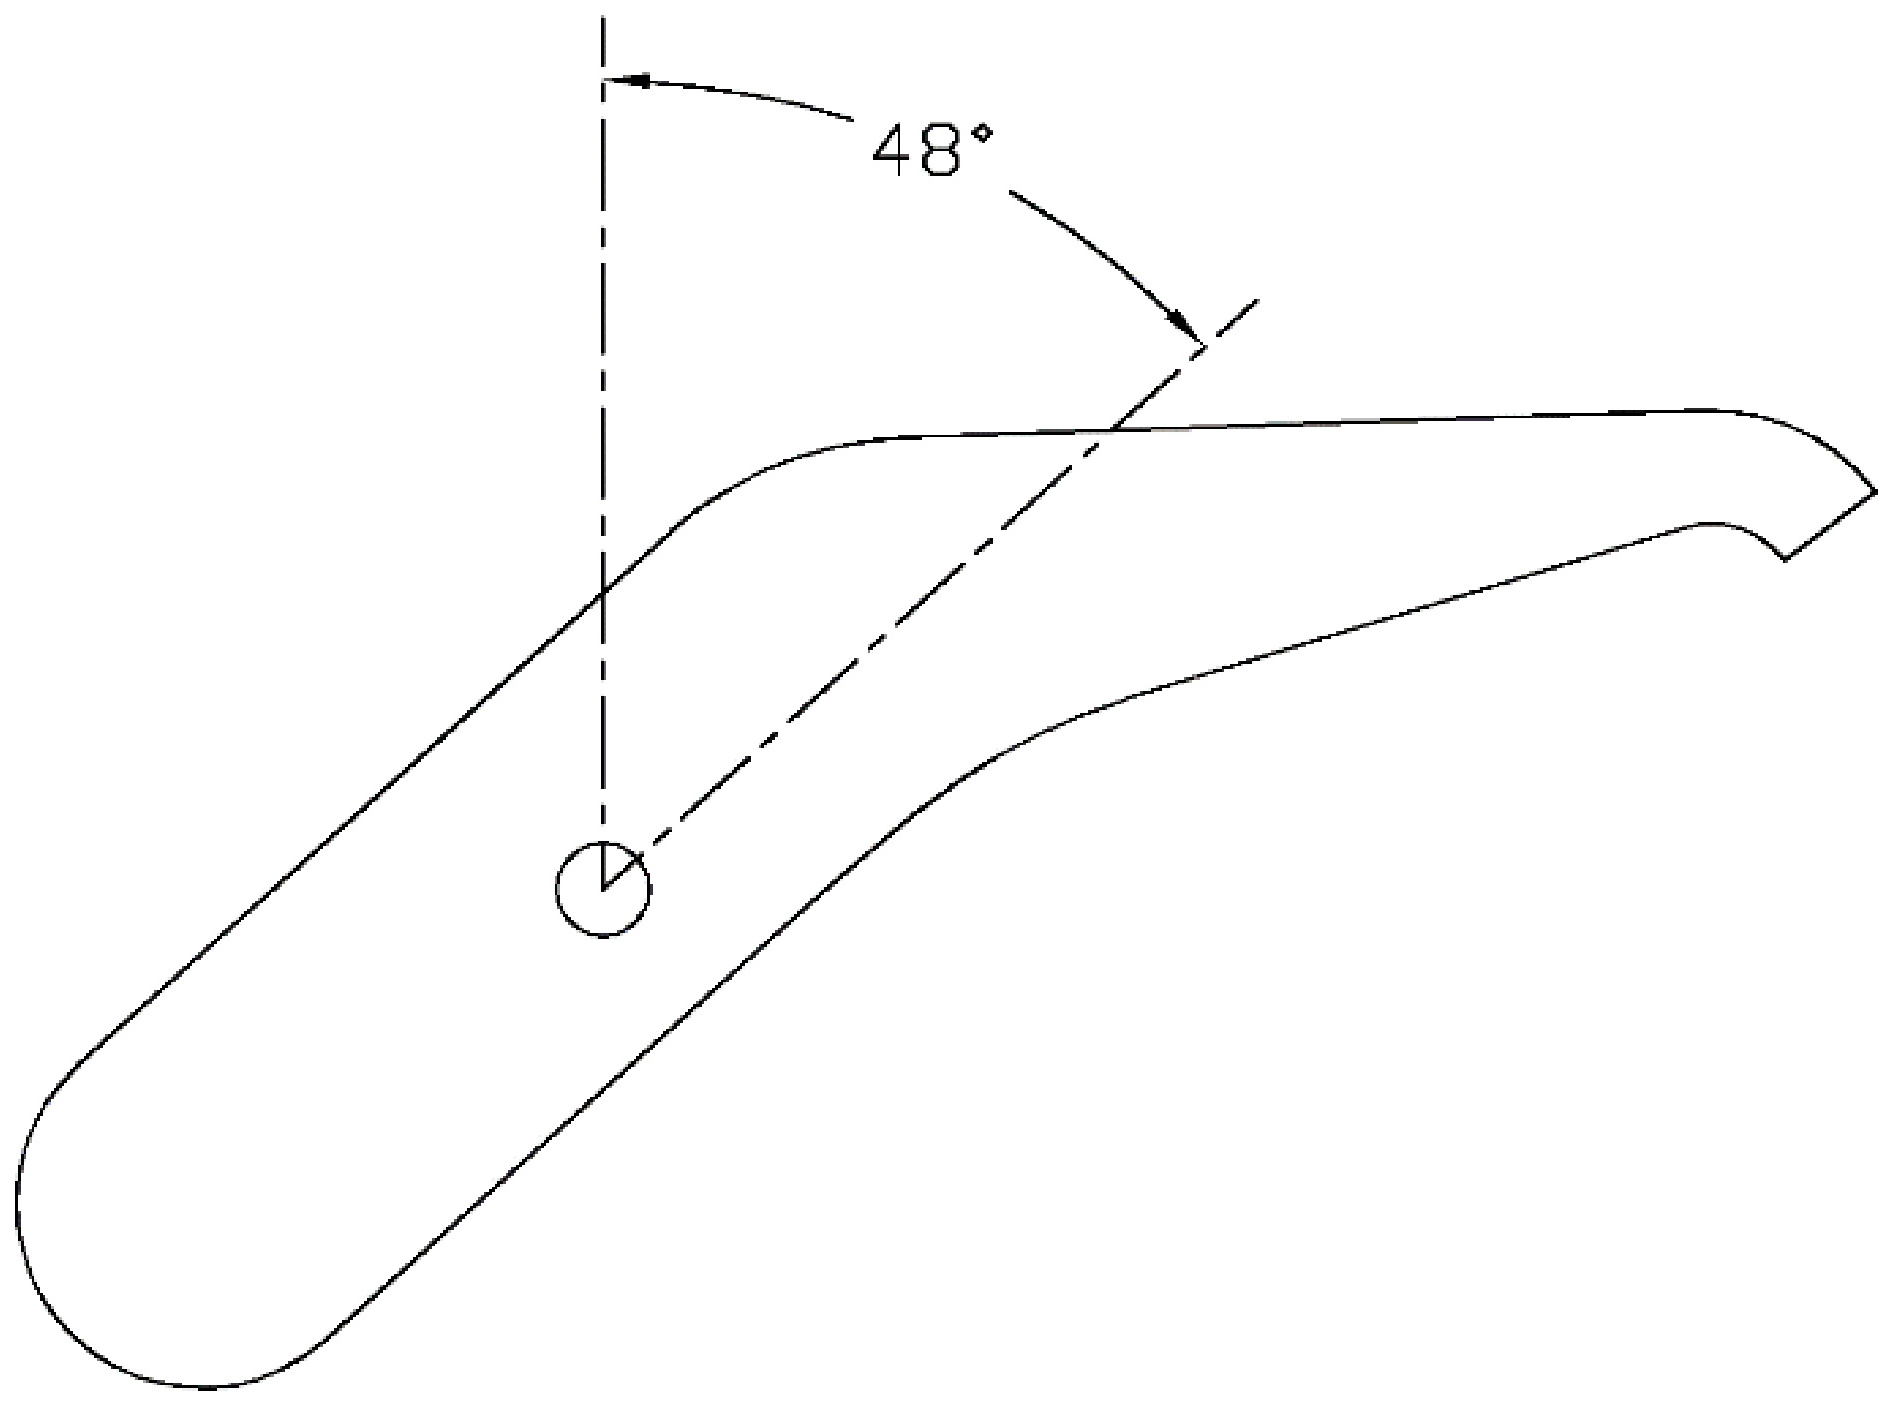
The floodgate profile was developed based on the distributor fin of a Michel-Banki turbine (Mockmore & Merryfield, 1949), which is the ideal profile for automatic opening and closing. This profile was obtained by Souza Junior (2018) and Santos (2018), in previous studies, based on improvement studies as well as structural and dynamic calculations (see in Tiago Filho & Souza Junior, 2018, a script for floodgate calculations). The angle between the inclined gate surface and the water surface was determined by considering factors such as the hydraulic load, the center of mass, the center of gravity of the structure and the position of the gate axis. Figure 1 shows the resulting gate profile.
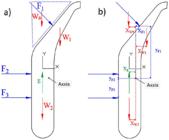
Automated floodgate profile. a) Schematic representation of the forces acting on the gate mechanism and (b) the position of the forces.
Numerical CFD modeling
The numerical model of the present study was discretized considering the geometry of the Creager profile in scale, based on the physical model tested in a hydraulic laboratory at the Federal University of Itajubá, Brazil. The study considered two- and three-dimensional approaches, using numerical models based on RANS (Reynolds Averaged Navier Stokes equations), with dual phase and steady-state modeling. The simulations were developed based on 10 opening positions of the device, with each opening angle of the gate (θ) represented as a new computational case, compared with the opening of the tested gate through images obtained from the experimental tests. For the analyses, commercial CFD analysis software was used, namely, ANSYS CFX® 2021 through the Workbench application.
Considering the flow turbulence, and that the fluid is incompressible, as well as the lack of temperature change, that is, isothermal, the Reynolds average equations (RANS) are applicable, obtained through the continuity equation and a set of averages of the Navier-Stokes equations. Given the assumptions made, one has Equations 1 (continuity) and 2 (momentum) represented in general:
Where is the velocity vector in any of the cartesian system directions, ρ is the Fluid density (kg/m3), is the gravitational acceleration, p is the pressure and τ is the viscous stress tensor.
Currently, for solutions to fluid dynamics problems, there are many turbulence models; that is, there are sets of equations available for solving turbulent flow problems. Each one is indicated for different situations and needs, which require specific conditions and parameters for their use. The k-ε (k-epsilon) turbulence model is a two-equation model, where the k equation is the solution of the turbulent kinetic energy and the ε equation is given by the dissipation rate solution. In Equation 3, the turbulent viscosity μt is a function that seeks the solution of the Reynolds tensor through the solution of k and ε, allowing its modeling based on the Boussinesq hypothesis. The equations for k and ε are presented by Equation 4 and Equation 5, respectively (Versteeg & Malalasekera, 1995).
The constants are given by: , , , and , is a production of turbulence from the viscous forces.
In numerical simulations of free-surface flows—the type studied in this article—the fluid is in direct contact with the atmosphere. These flows are multiphase, since more than one phase is present: in this case, air and water (This is a more comprehensive approach, different from that used in other studies, such as Santos et al. (2021), which model the free surface as a moving wall). A very important parameter for the classification of these flows is the Froude number (Fr). It is a dimensionless quantity in fluid mechanics that compares a fluid's inertial forces to its gravitational forces, as defined in Equation 6.
Where: V = Displacement speed of the wave propagating on the free surface and y = scalar length from channel bottom to free surface
Another important parameter for two-phase flows is surface tension. Such tension between phases is due to the molecular distribution, given that this distribution is not homogeneous, as the cohesion forces that are found in the region below the surface, that is, in the liquid phase of water where the density is much greater than that above the surface in the air phase, is much greater. This tension, which is given by the force in relation to the distance, N/m, is represented by the Greek letter σ and varies according to the temperature; that is, the higher the temperature, the lower the surface tensions are, since the lower the direct interactions of one molecule with another. For a surface at 20°C, the surface tension given by the pure air-water interface is 0.072 N/m (as done by Silva 2021). This value was entered into ANSYS CFX, since it is used by the software in modeling the interface between the working fluids (in this case, water and air).The surface tension model used in CFX is based on the Continuum Surface Force model. This models the surface tension force as a volume force concentrated at the interface, rather than a surface force (ANSYS Inc., 2025).
As this problem has more than one phase, the continuity equation must be rewritten and replaced by Equation 7, where α is the volumetric fraction of the interaction of the air-water phases in a range from 0 to 1.
Continuity and Navier-Stokes equations are provided with effective density and viscosity for each cell of the discretized domain, in order to solve fluid volume problems. Equations 8 and 9 represent the solution of the effective density and viscosity; respectively, assuming that if α = 1, the properties correspond to fluid 1 of this mixture, and if α = 0, the properties correspond to fluid 2, where 0 < α < 1 represents the free surface.
In Apsley & Hu (2003), the authors describe the implementation of moving mesh and free surface features in a 3-D model, using multi-block structured meshes conforming to the surface.
The discretization of the two-dimensional mesh was built on the geometry of each opening position of the floodgate, with mostly hexahedral elements and not squares, given that, even though this is considered a two-dimensional study, the symmetry boundary condition is applied for a relatively small thickness dimension.
The definition of the total number of mesh elements, or alternatively the maximum dimension of each element, was carried out using the Grid Convergence Index (GCI) method. This procedure is based on estimating the error associated with mesh refinement, obtained through the generalized Richardson extrapolation (NASA, 2008). This approach enables quantification of the uncertainty associated with numerical convergence, indicating how far the computed result remains from the expected value in the asymptotic regime. The analysis is considered satisfactory when the discrepancy between the results obtained from two distinct discretizations, evaluated through a representative mean value of the solution, becomes minimal, indicating proximity to the asymptotic limit. Accordingly, an initial coarse mesh consisting of 76,247 elements was generated and simulated, as will be described later in this section. The same procedure was repeated using a refined mesh with 157,207 elements, followed by a second refined mesh composed of 323,667 elements. The method adopted the torque applied to the gate rotation axis as the monitored variable. The asymptotic convergence error obtained was 0.001, indicating that the first refined mesh, with 157,207 elements, is adequate for the proposed analysis in this work.
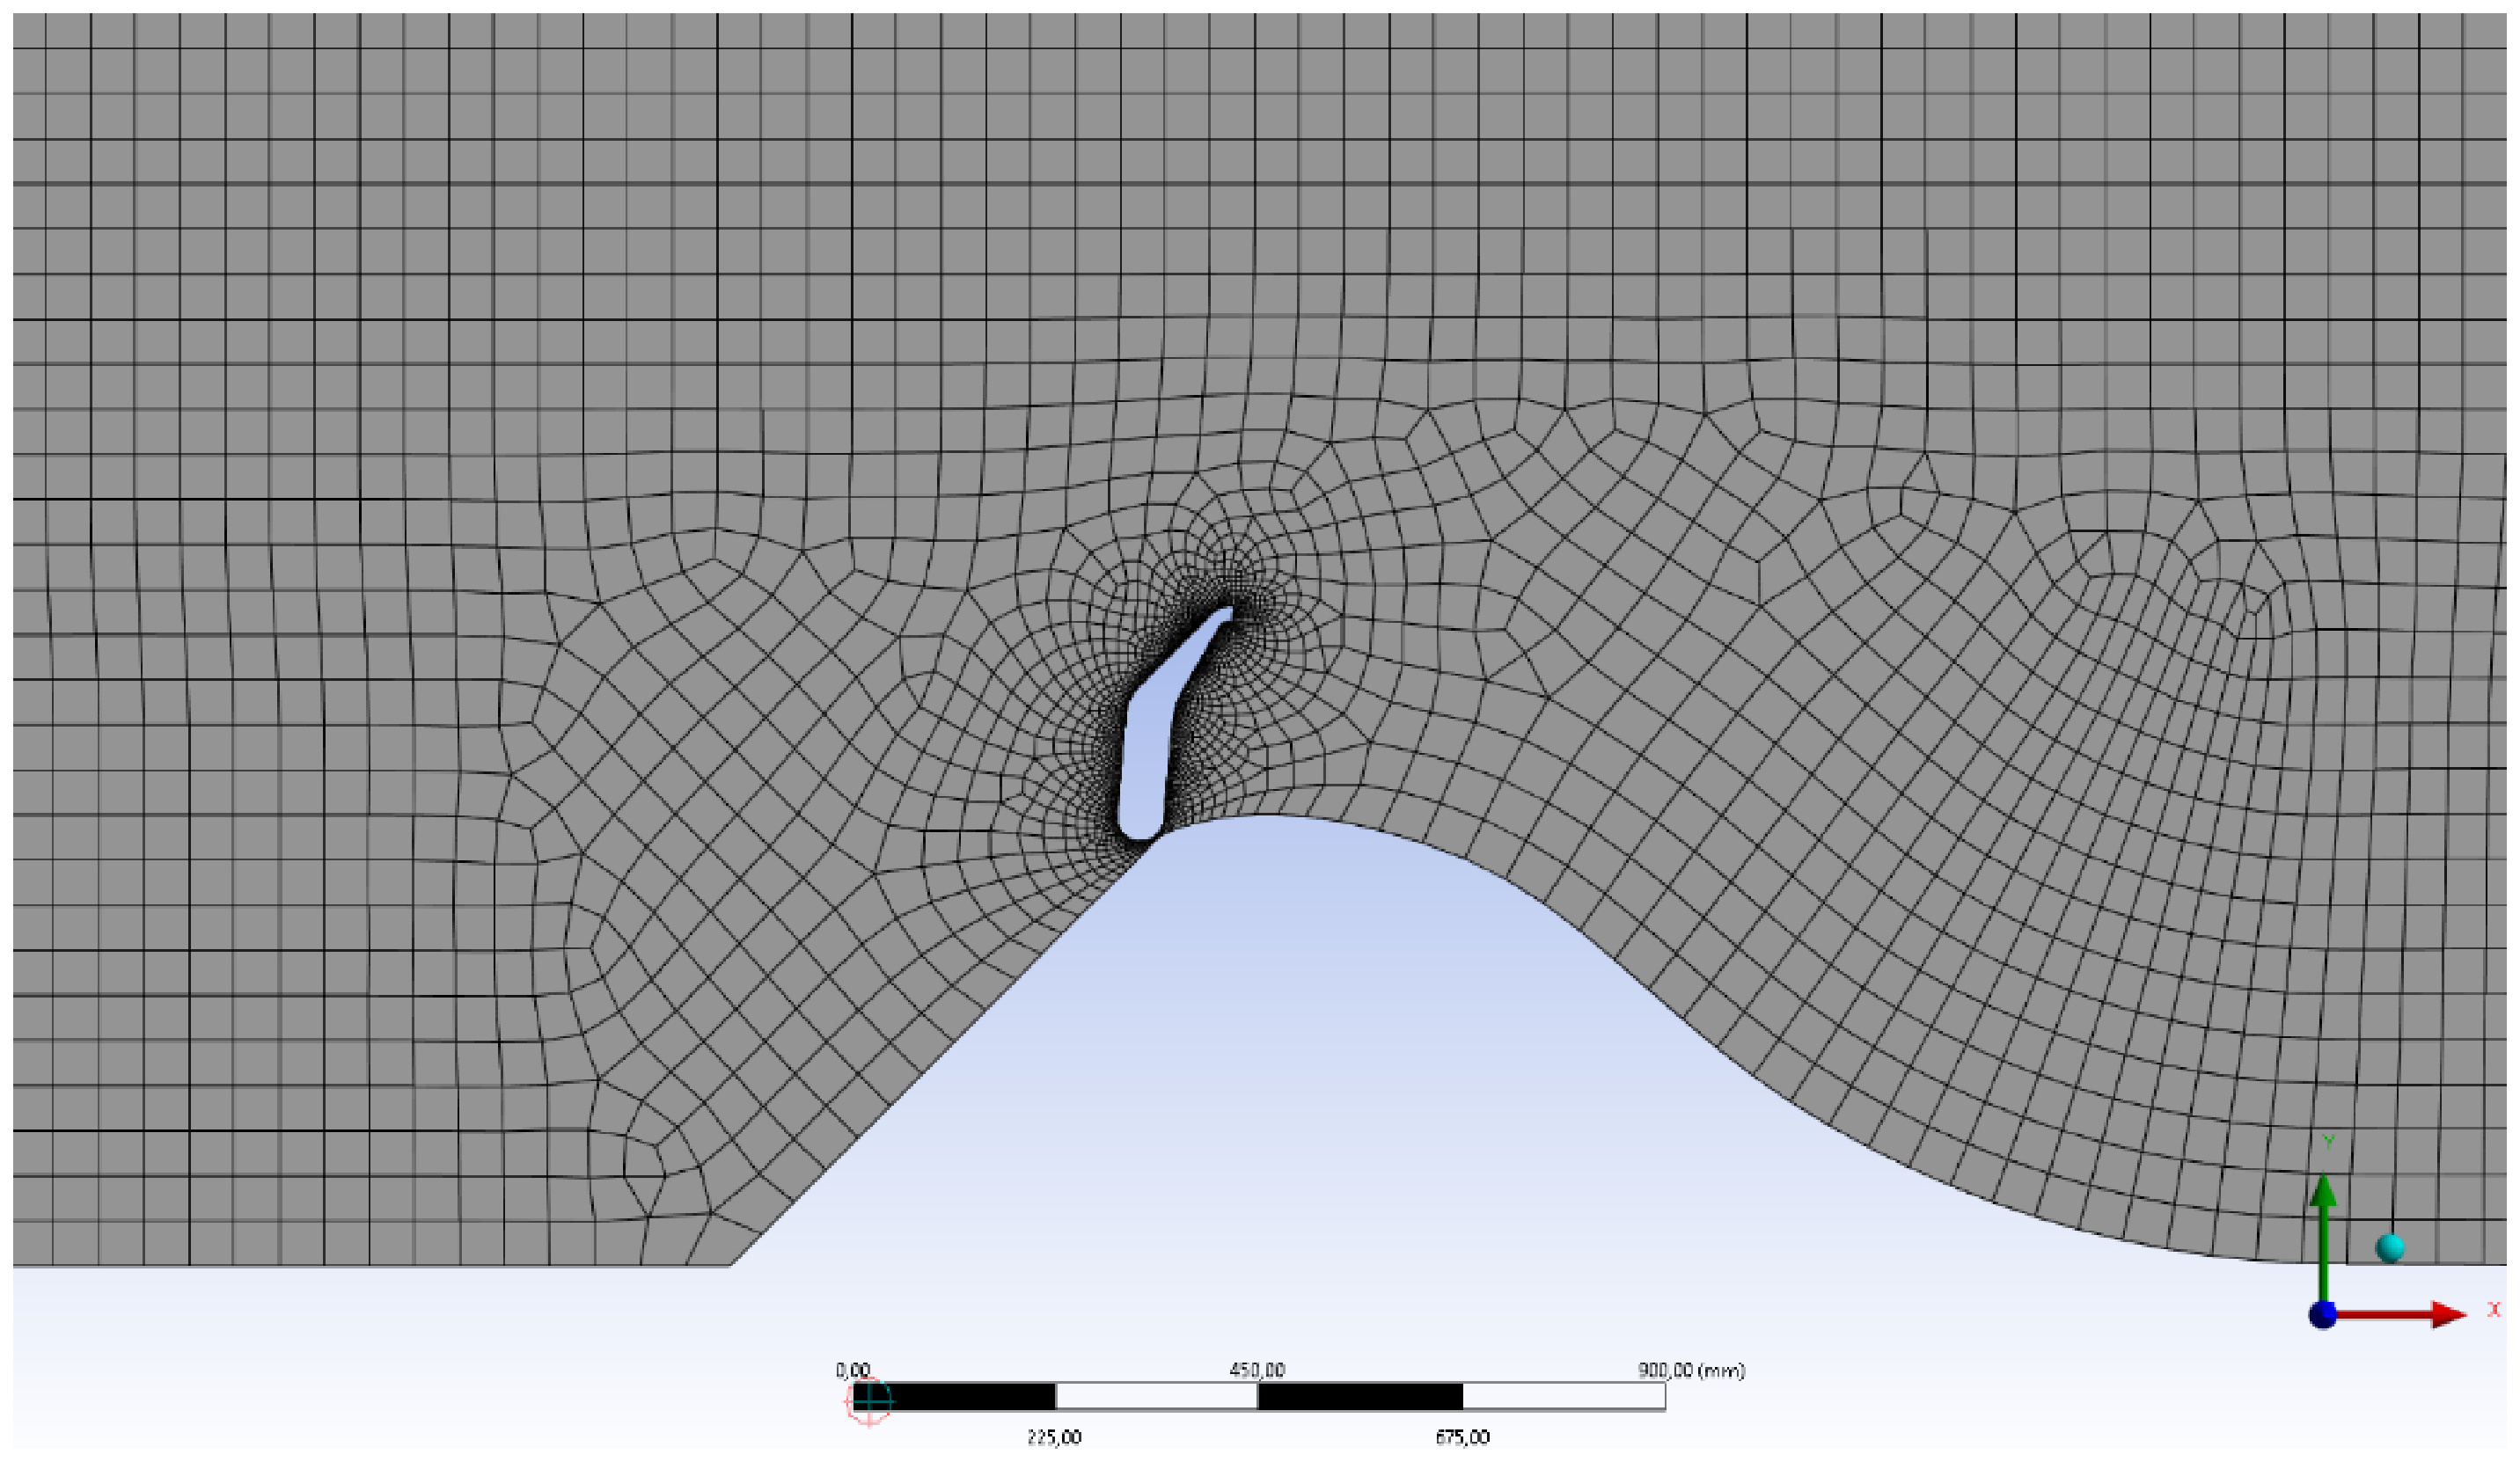
In Figure 2, there is a greater concern with the mesh in the discretization of the geometry of the floodgate and not as much focus on the Creager profile of the spillway or with the rest of the control volume of the problem. As seen, the sub-viscous layer is not of interest in this work; therefore, no concern was placed on the magnitude of y+ for the element adjacent to wall regions.
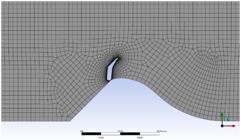
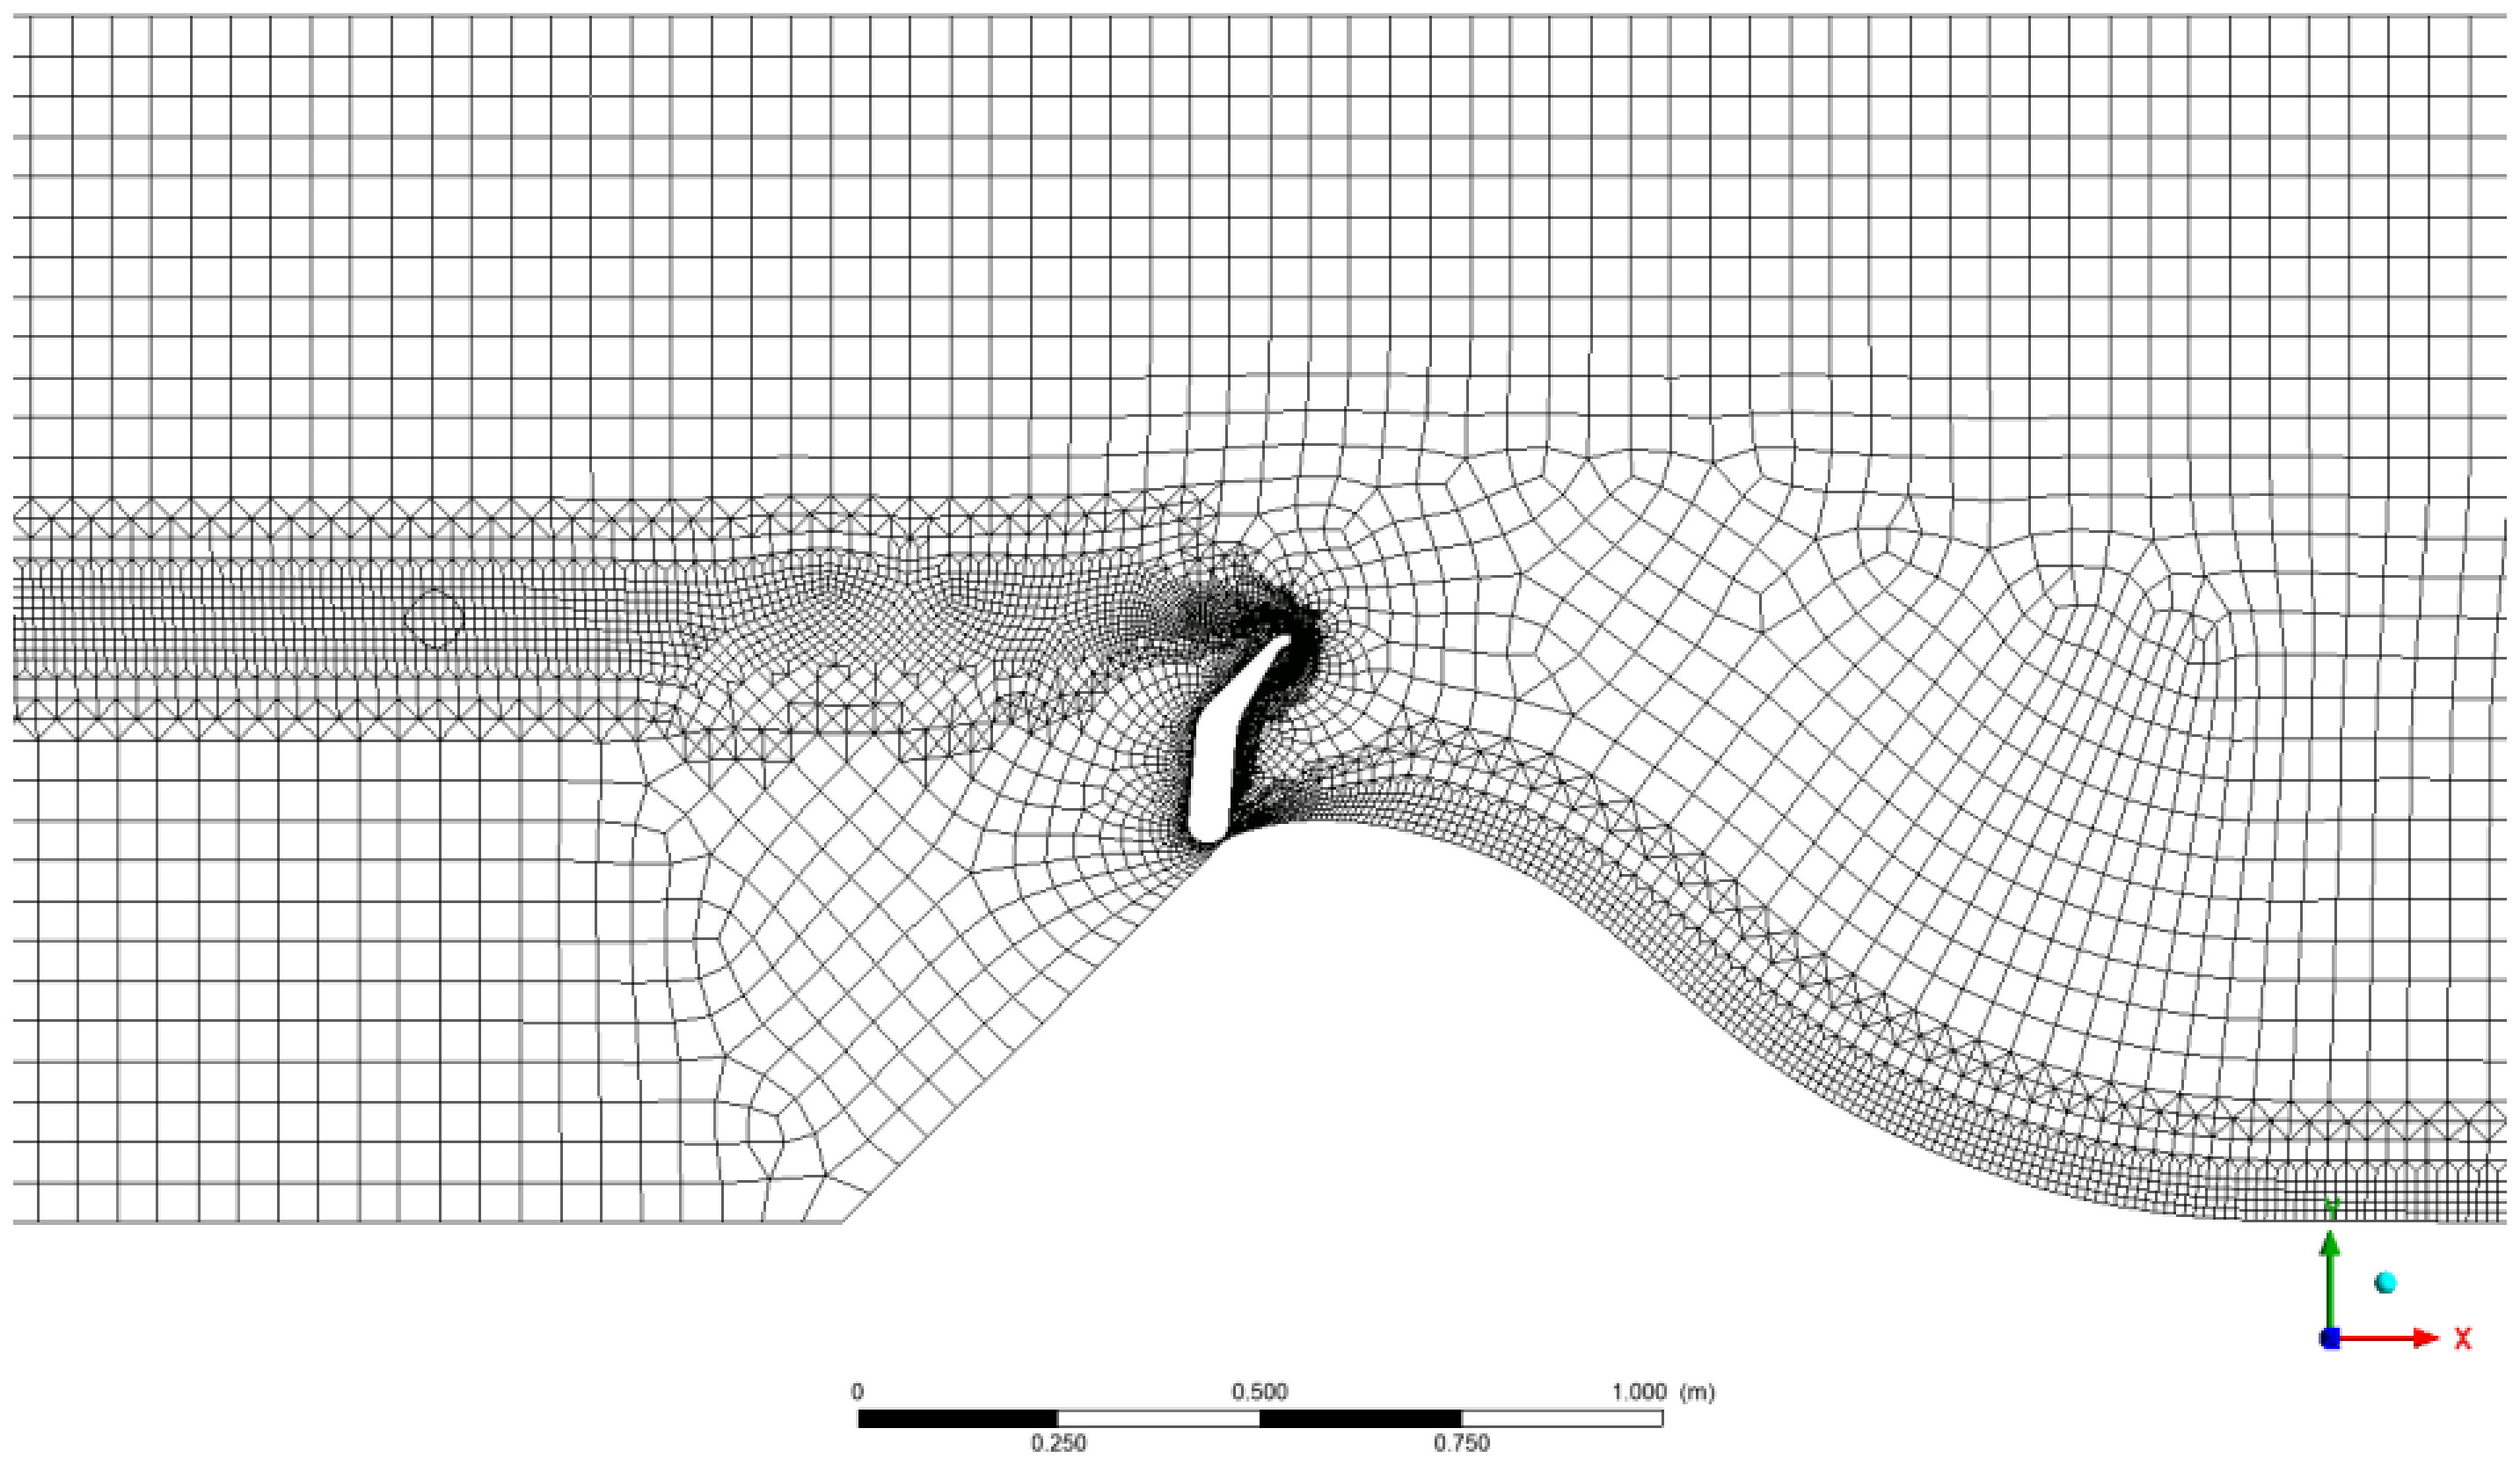
The major concern with the proposed problem is on the interface surface between the air-water phases. In this article, mesh adaptation methodology (Figure 3) was used to refine the meshes in the interface region. The mesh discretization can be adapted according to the phase interface. With the variation of the boundary conditions, the water level upstream of the reservoir and its behavior on the device and downstream is variable and difficult to predict with precision, making the adaptation of the mesh a very useful artifice.
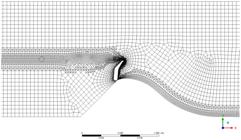
The mesh adaptation process allows semi-automatic refinement, with the objective of obtaining a significant resolution improvement in regions with large gradients. Also, mesh refinement and adaptation (semi-automatic mesh refinement to improve resolution in regions with large gradients) are much easier on unstructured meshes (ANSYS Inc., 2015).
Several authors have used mesh adaptation in previous studies. Mnasri et al. (2010) studied the 2D entry and exit of horizontal cylinders in calm water, where the interaction of the free surface with the moving cylinders was modeled using the fluid volume and dynamic mesh method, with the aim of water body oscillations estimate. The results showed that the splash jet was properly simulated. Doustdar & Kazemi (2019) analyzed the impact of using fixed versus dynamic mesh approaches in CFD simulations of stepped planing vessels, employing the volume of fluid method to model the free surface. The authors concluded that the use of dynamic mesh, despite having a longer computational time, is more accurate than the fixed mesh method in the proposed simulation.
The works of Perot & Nallapati (2003), Apsley & Hu (2003), López & Lévy (2012) can also be cited along these lines. Perot & Nallapati (2003) investigated the effectiveness of adaptive stepped meshes for simulating the free surface in incompressible flows and obtaining velocity fields and conservative properties. According to the authors, the Mesh Motion function provides a high-quality mesh in the interior while offering a detailed resolution of the free surface motion. Apsley & Hu (2003), in turn, presented the implementation of moving mesh and free surface functionalities in a three-dimensional finite-volume RANS solver using multi-block structured meshes. They applied the implemented meshes to five cases of practical interest, demonstrating the method’s applicability. Finally, López & Lévy (2012) proposed a new algorithm for generating isotropic and anisotropic meshes that conform to an evolving free surface.
This mesh adaptation takes place in such a way that the adaptation criterion is calculated for each mesh element. To do so, the appropriate number of nodes is added according to the calculated adaptation criterion, causing the calculated solution in the previous mesh to be interpolated to the new mesh. In the current problem, it was hypothesized that the method for the adaptation criterion is the Solution Variation method. In this case, the adaptation criteria are applied using only the maximum variation of a solution variable on any edge associated with an element. As an adaptation variable, the property surface tension between the air-water phases is considered. The adaptation criterion, Ai, for a given mesh edge i with length li, is calculated by Equation 10 (ANSYS Inc., 2015):
Where is the j-th adaptation variable; is the global interval of the variable in all of the nodes (except for those in wall boundary conditions for turbulent regimes); is the difference between in one of the extremities of the limit and the other extremity; and is a scale for the adaptation variable j to scale all Ai to take on values between 0 and 1.
For the current study, a k-epsilon turbulence model was used due to the steady-state, free surface flow approach. The choice of this turbulence model is motivated by the fact that the analysis focuses on macroscopic fluid-dynamic phenomena. In other words, there is no interest in resolving stresses and resulting effects within the sub-viscous layer or boundary layer separation near wall regions. The k–ε model is an appropriate option for this type of simulation because it offers an effective balance among numerical robustness, moderate computational cost, and well-established validation for turbulent flows with medium to high Reynolds numbers, particularly within the Reynolds-Averaged Navier-Stokes (RANS) framework. For instance, Coste & Laviéville (2015) employ exactly the k and ε transport equations in each phase to model the Reynolds stresses at a large-scale liquid–gas interface, showing that the k–ε formulation can adequately capture turbulence effects even when a significant interfacial region is present.
Shaheed et al. (2022) compared the standard k–ε and realizable k–ε models for free-surface flows in bends and confluences, and observed that the standard formulation “behaves satisfactorily” for predicting free-surface elevation and velocity profiles. Likewise, in contexts involving spillways and free jets over sluice gates, Muralha et al. (2020) evaluated the inter Foam and two Phase Euler Foam solvers and found that the use of the k–ε model reproduces the velocity field well while remaining numerically stable. The Shear Stress Transport (SST) model could be applicable, however, that modeling is suitable for simulations applied when wall regions interfere with the result when the limit wall regions are important.
The number of nodes and elements of the resulting meshes in each of the simulated gaps, as well as the number of resulting iterations until convergence to a residual of 10-4 is reached, are shown in Table 2. Some probable causes for the observed iteration peaks (15 degrees with 804 iterations until convergence; 48 degrees closing with 900 iterations until convergence) include the presence of strong gradients at the free surface (VOF) and transient effects during the closing/opening process, the formation of recirculation zones and vorticial structures and poor-quality cells (high aspect ratio in boundary-layer/interface regions. During motions such as “start closing” the mesh and boundary conditions undergo changes that may introduce initial inconsistencies, thereby requiring substantially more iterations to reach a stable solution. It is also common for interface-capturing techniques (VOF compression and volume-fraction advection) to increase numerical stiffness in the system, consequently raising the iteration count regardless of the total number of mesh elements.
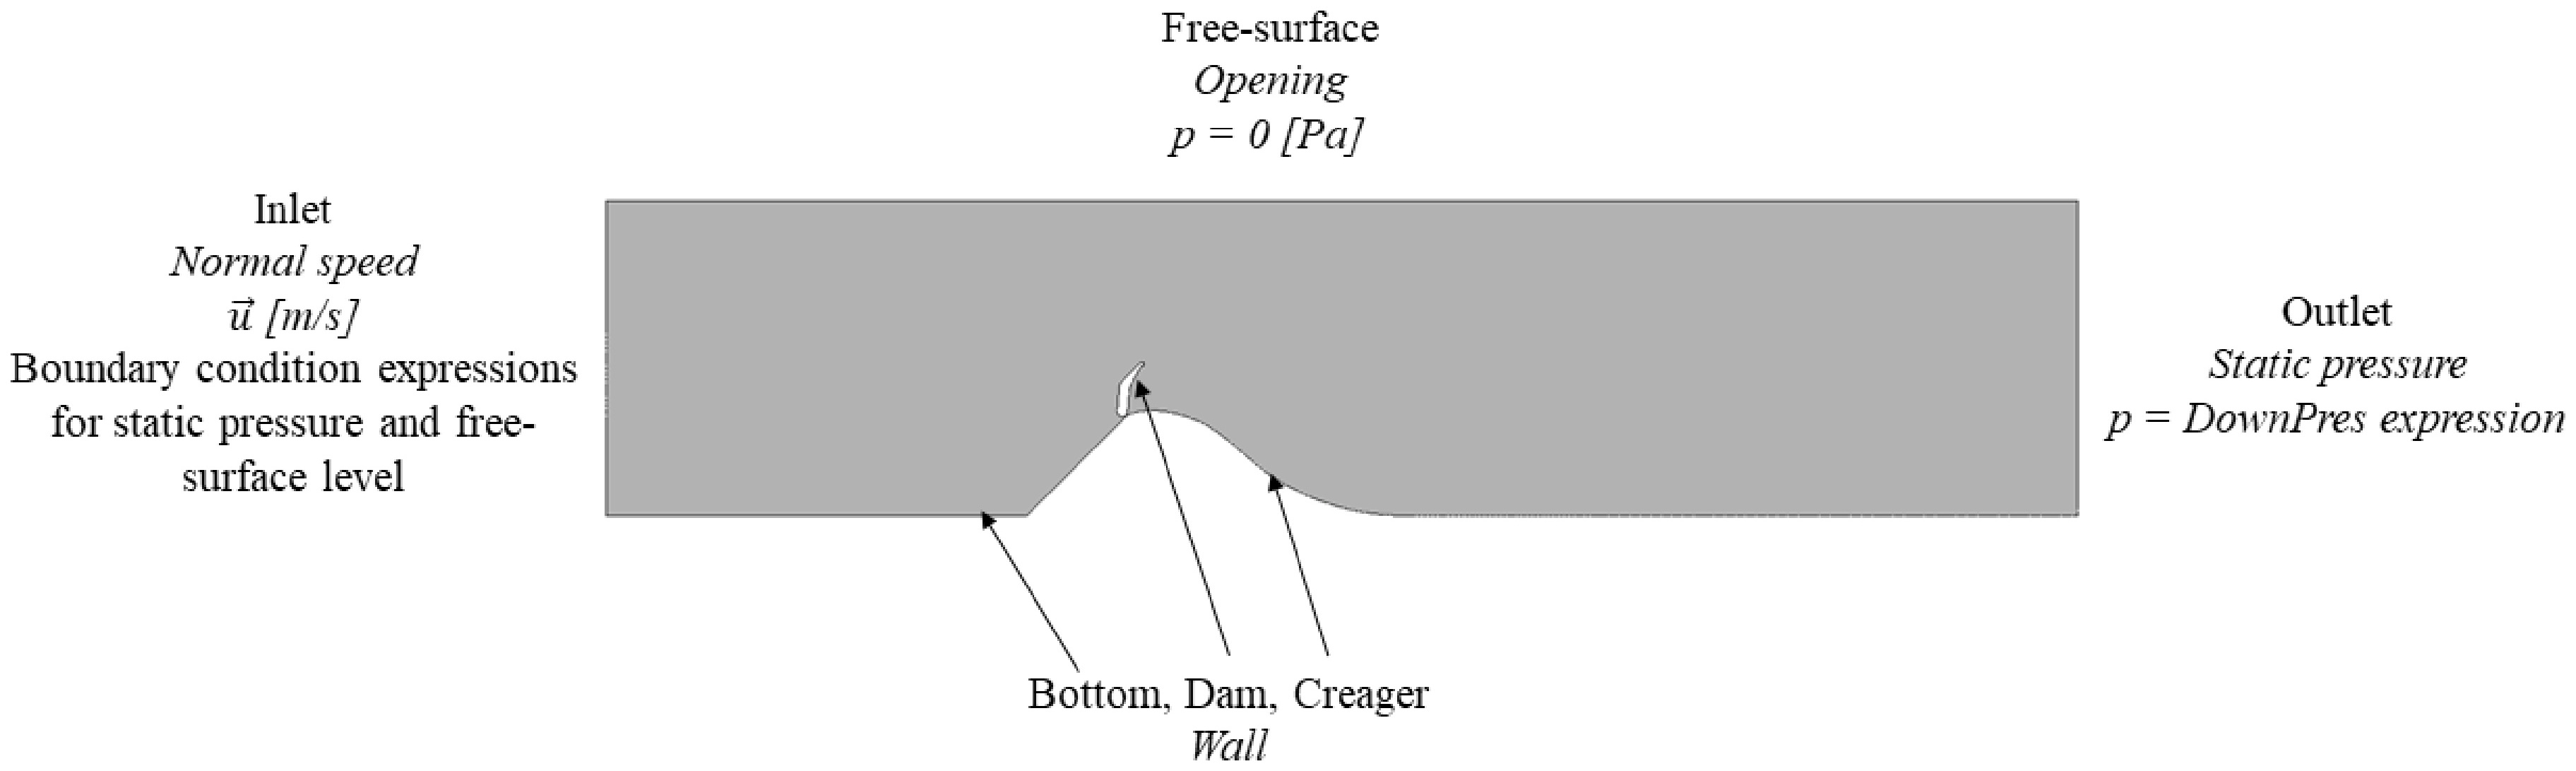
Finally, the boundary conditions of the problem are imposed considering the initial level in the upstream direction of the dam, with velocity and flow that vary for each moment of the floodgate opening. The defined surfaces are shown in Figure 4. This relationship between the velocity that interferes with the flow and the opening of the gate is consistent with the flood situation in the reservoir, which starts to rise as the level is raised with the mobile gate and the excess flow that is released. In the given boundary condition at the exit of the domain, there is only the action of gravity forces and atmospheric pressure.
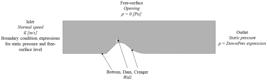
However, these boundary conditions are imposed on the model through the interaction between expressions that determine the height of the free surface by static pressure and the physical properties of fluids, and the viscous effects given by the flow from upstream to downstream. Thus, the levels upstream and downstream of the obstacle created by the Creager profile and the gate are configured, as well as the effects of flow on this obstacle. These mathematical expressions are interpreted by the software through a command language file, obtained in ANSYS Inc. (2010) and in Silva (2021).
Physical laboratory tests
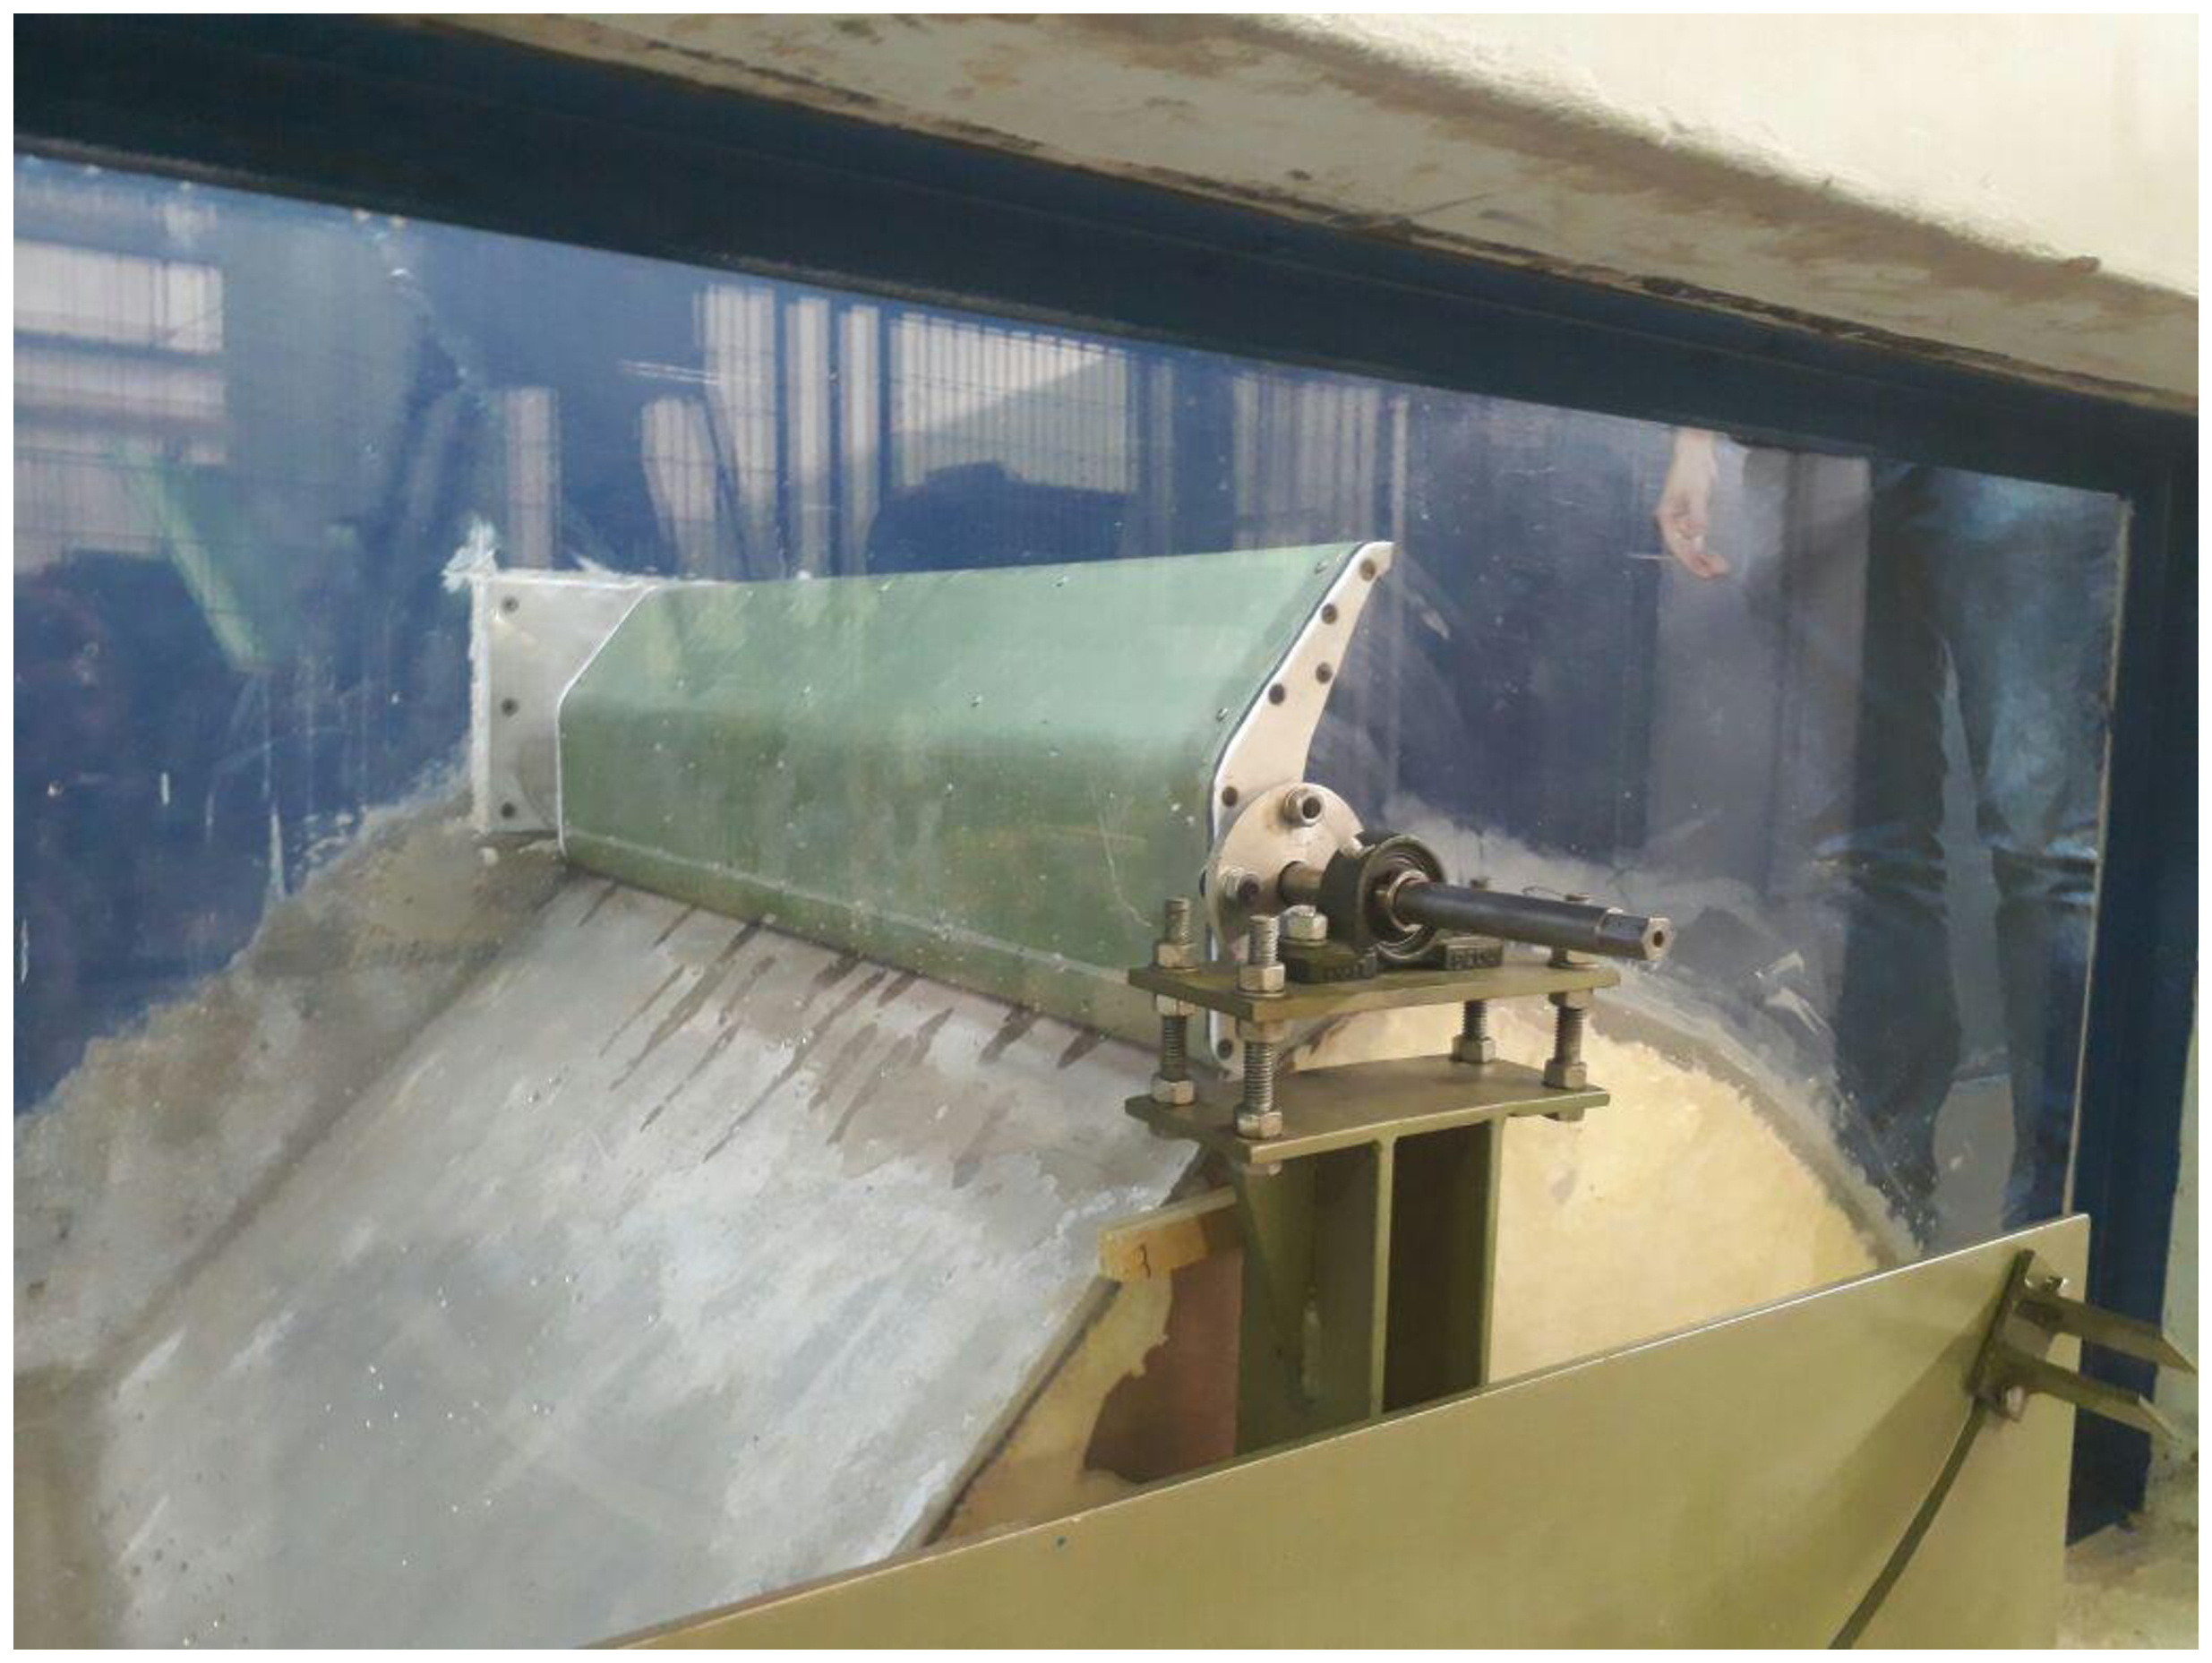
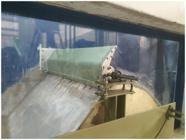
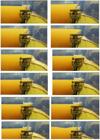
A scale model was built for laboratory tests. The test channel has a width of 1 meter, and the construction scale of the Creager spillway is 4:1. The channel used was fed by two pumps with a flow capacity of 250 L/s each, from an accumulation reservoir in the basement of the laboratory structure. The Creager profile spillway was built with brick and mortar, while the floodgate model was mostly built in aluminum, with an axle supported by bearings for movement during operation. The figures that make up Figure 5 show images of the test model in the laboratory. The flow rate during the test is calculated by Equation 11, by reading the level in a piezometer and determining the reservoir level at the beginning of the pouring process. The water level results obtained in the physical experiment were used to validate the experimental results.
Where:
● Q = Volumetric flow [m3/s];
● b = Channel width [m];
● hv = piezometric reading[m].
RESULTS AND DISCUSSION
Evaluating the CFD results in comparison and validation with the tests carried out in the laboratory guarantees the reliability of the numerical model, as well as obtaining these results, which are data that can be applied in a possible optimization of the equipment in future studies.
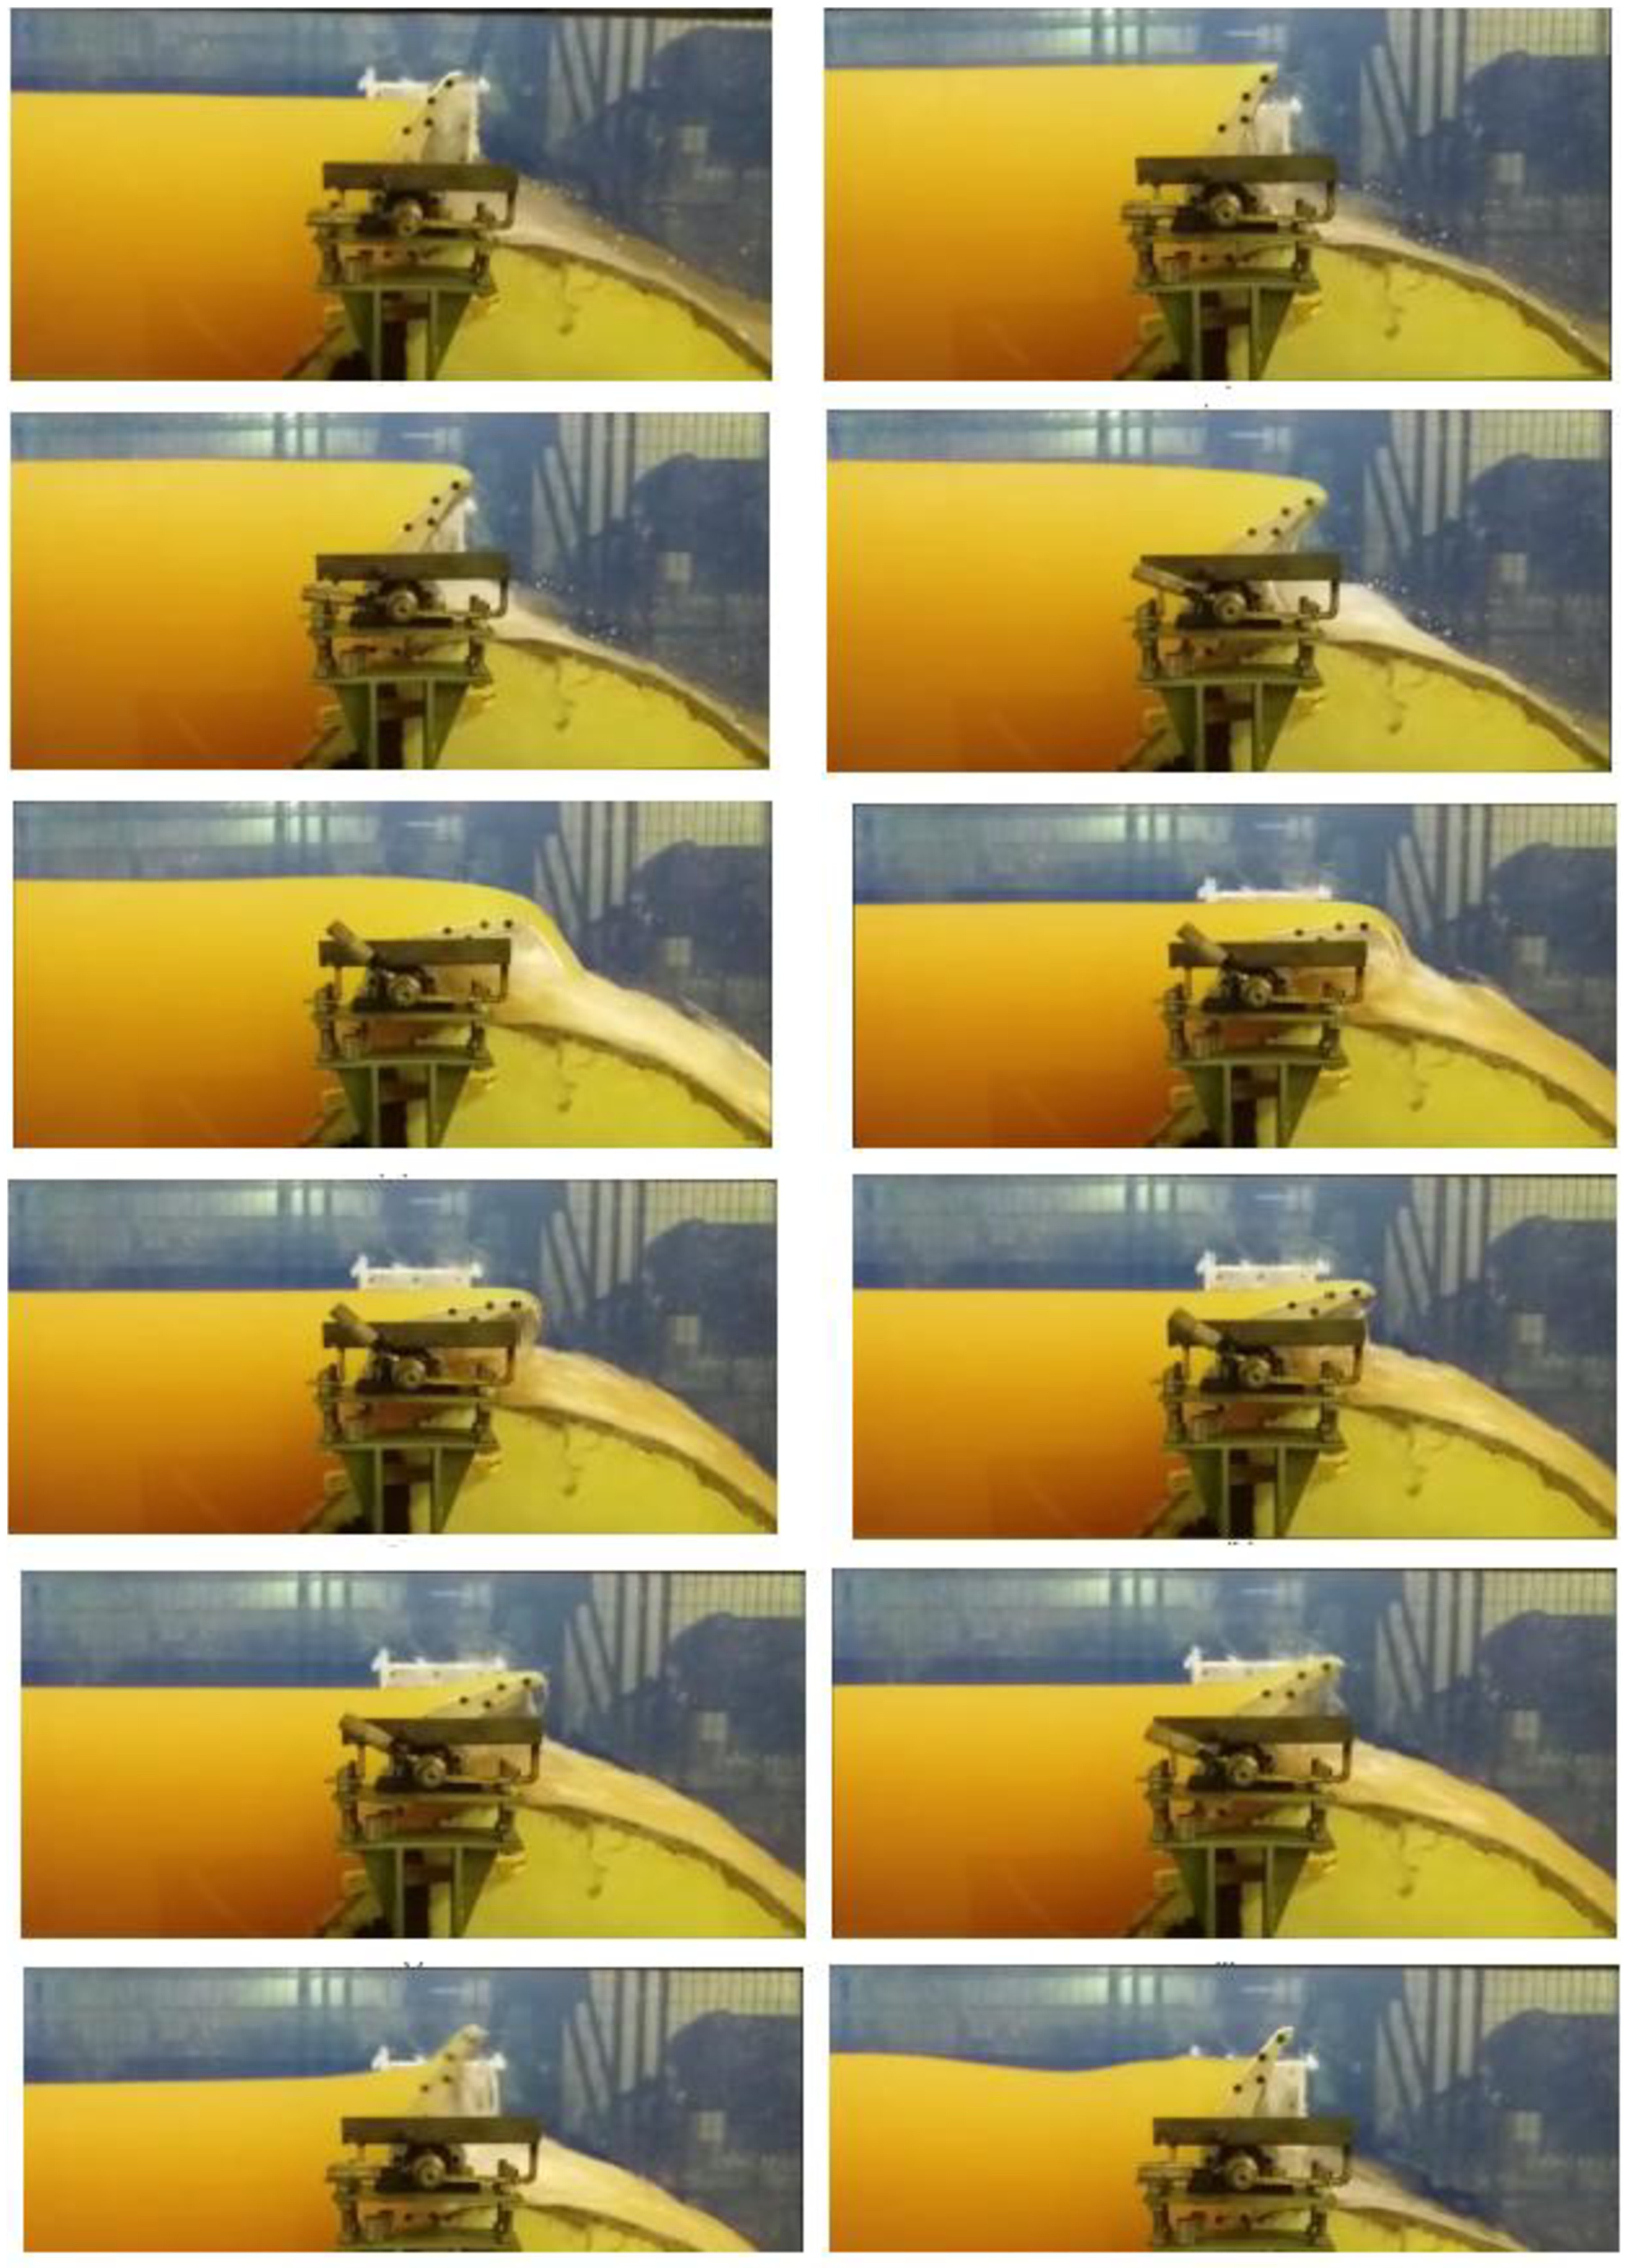
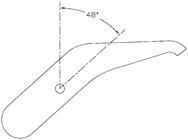
At first glance, what can be identified is the visual assessment of the behavior of the water flowing over the gate at each stage of its opening. The analyzed opening angles are 5º, 15º, 20º, 25º, 30º, 35º, 40º and 48º. The 48-degree opening is delimited by a limitation mechanism, defined in experiments in the preliminary stages of laboratory testing (Figure 6).
From the experiment, it was possible to evaluate the upstream level for a constant flow. It was observed that the spillage capacity in the Ribeirão do Cipó dam, for a return time of 10,000 years, is 10.31 m3/s (value obtained by Souza Junior, 2018; also see Table 1). The scale used to represent the actual spillway of the dam in a physical laboratory, as well as the gate to be designed, was 1:4 in relation to its height and 1:8 in relation to its width. With the difference in scales between height and width, attention is paid to the representation of the same field conditions of the spillway blade on the test bench. To this end, a transposition of the design flow to the test bench is carried out from the discharge equation of the spillway with Creager profile. Therefore, a flow of 161 [l/s], corresponding to 10.31 [m3/s] in the Cipó Dam, was used in the experiments. The overelevation of the upstream level was also measured in three different tests, the results of which can be seen in Table 3.
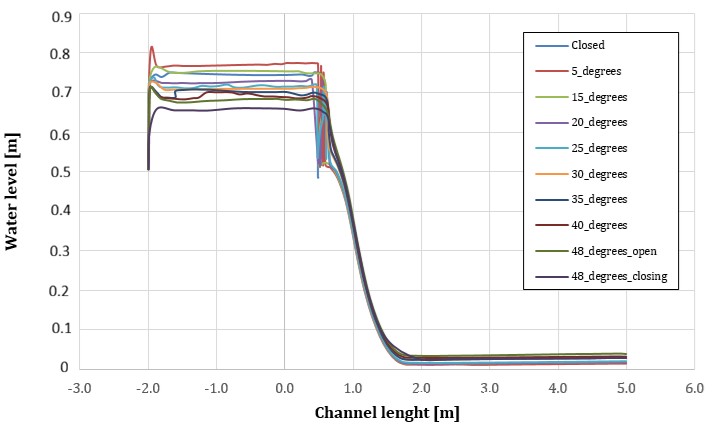
The upstream value level obtained by the CFD model is verified in the results of the numerical modeling presented in Figure 7, where one has the levels from the filling of the dam level to the spare value over the floodgate, from the first moment of its opening until the point at which the efforts given due to the mass of fluid no longer act on the opening, initiating the closing. Considering the level of the crest of the Creager profile at an elevation of 0.5 meters, the upstream level reached an elevation of 0.77 meters, that is, 0.27 meters (27 cm), a value consistent with the average elevation of 26.4 cm measured experimentally (Table 3).
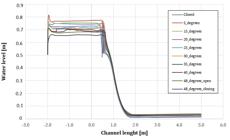
Variation of the raised level according to the moment "t" of opening of the floodgate gate.
Considering that the applied scale is 4:1 in relation to the Ribeirão do Cipó dam, the actual heightening level will be around 1.08 meters, consistent with the forecast of 1.0 meters. As identified by previous studies, changing the water level in the reservoir by 1 [m] above the crest of the spillway, maintaining the guaranteed level of 95%, it is possible to obtain a regularized flow of 2.47 [m3/ s]. This represents a change in the useful available volume to 35 million cubic meters, increasing the reservoir energy production (for more details see Santos, 2018; Santos et al., 2022).
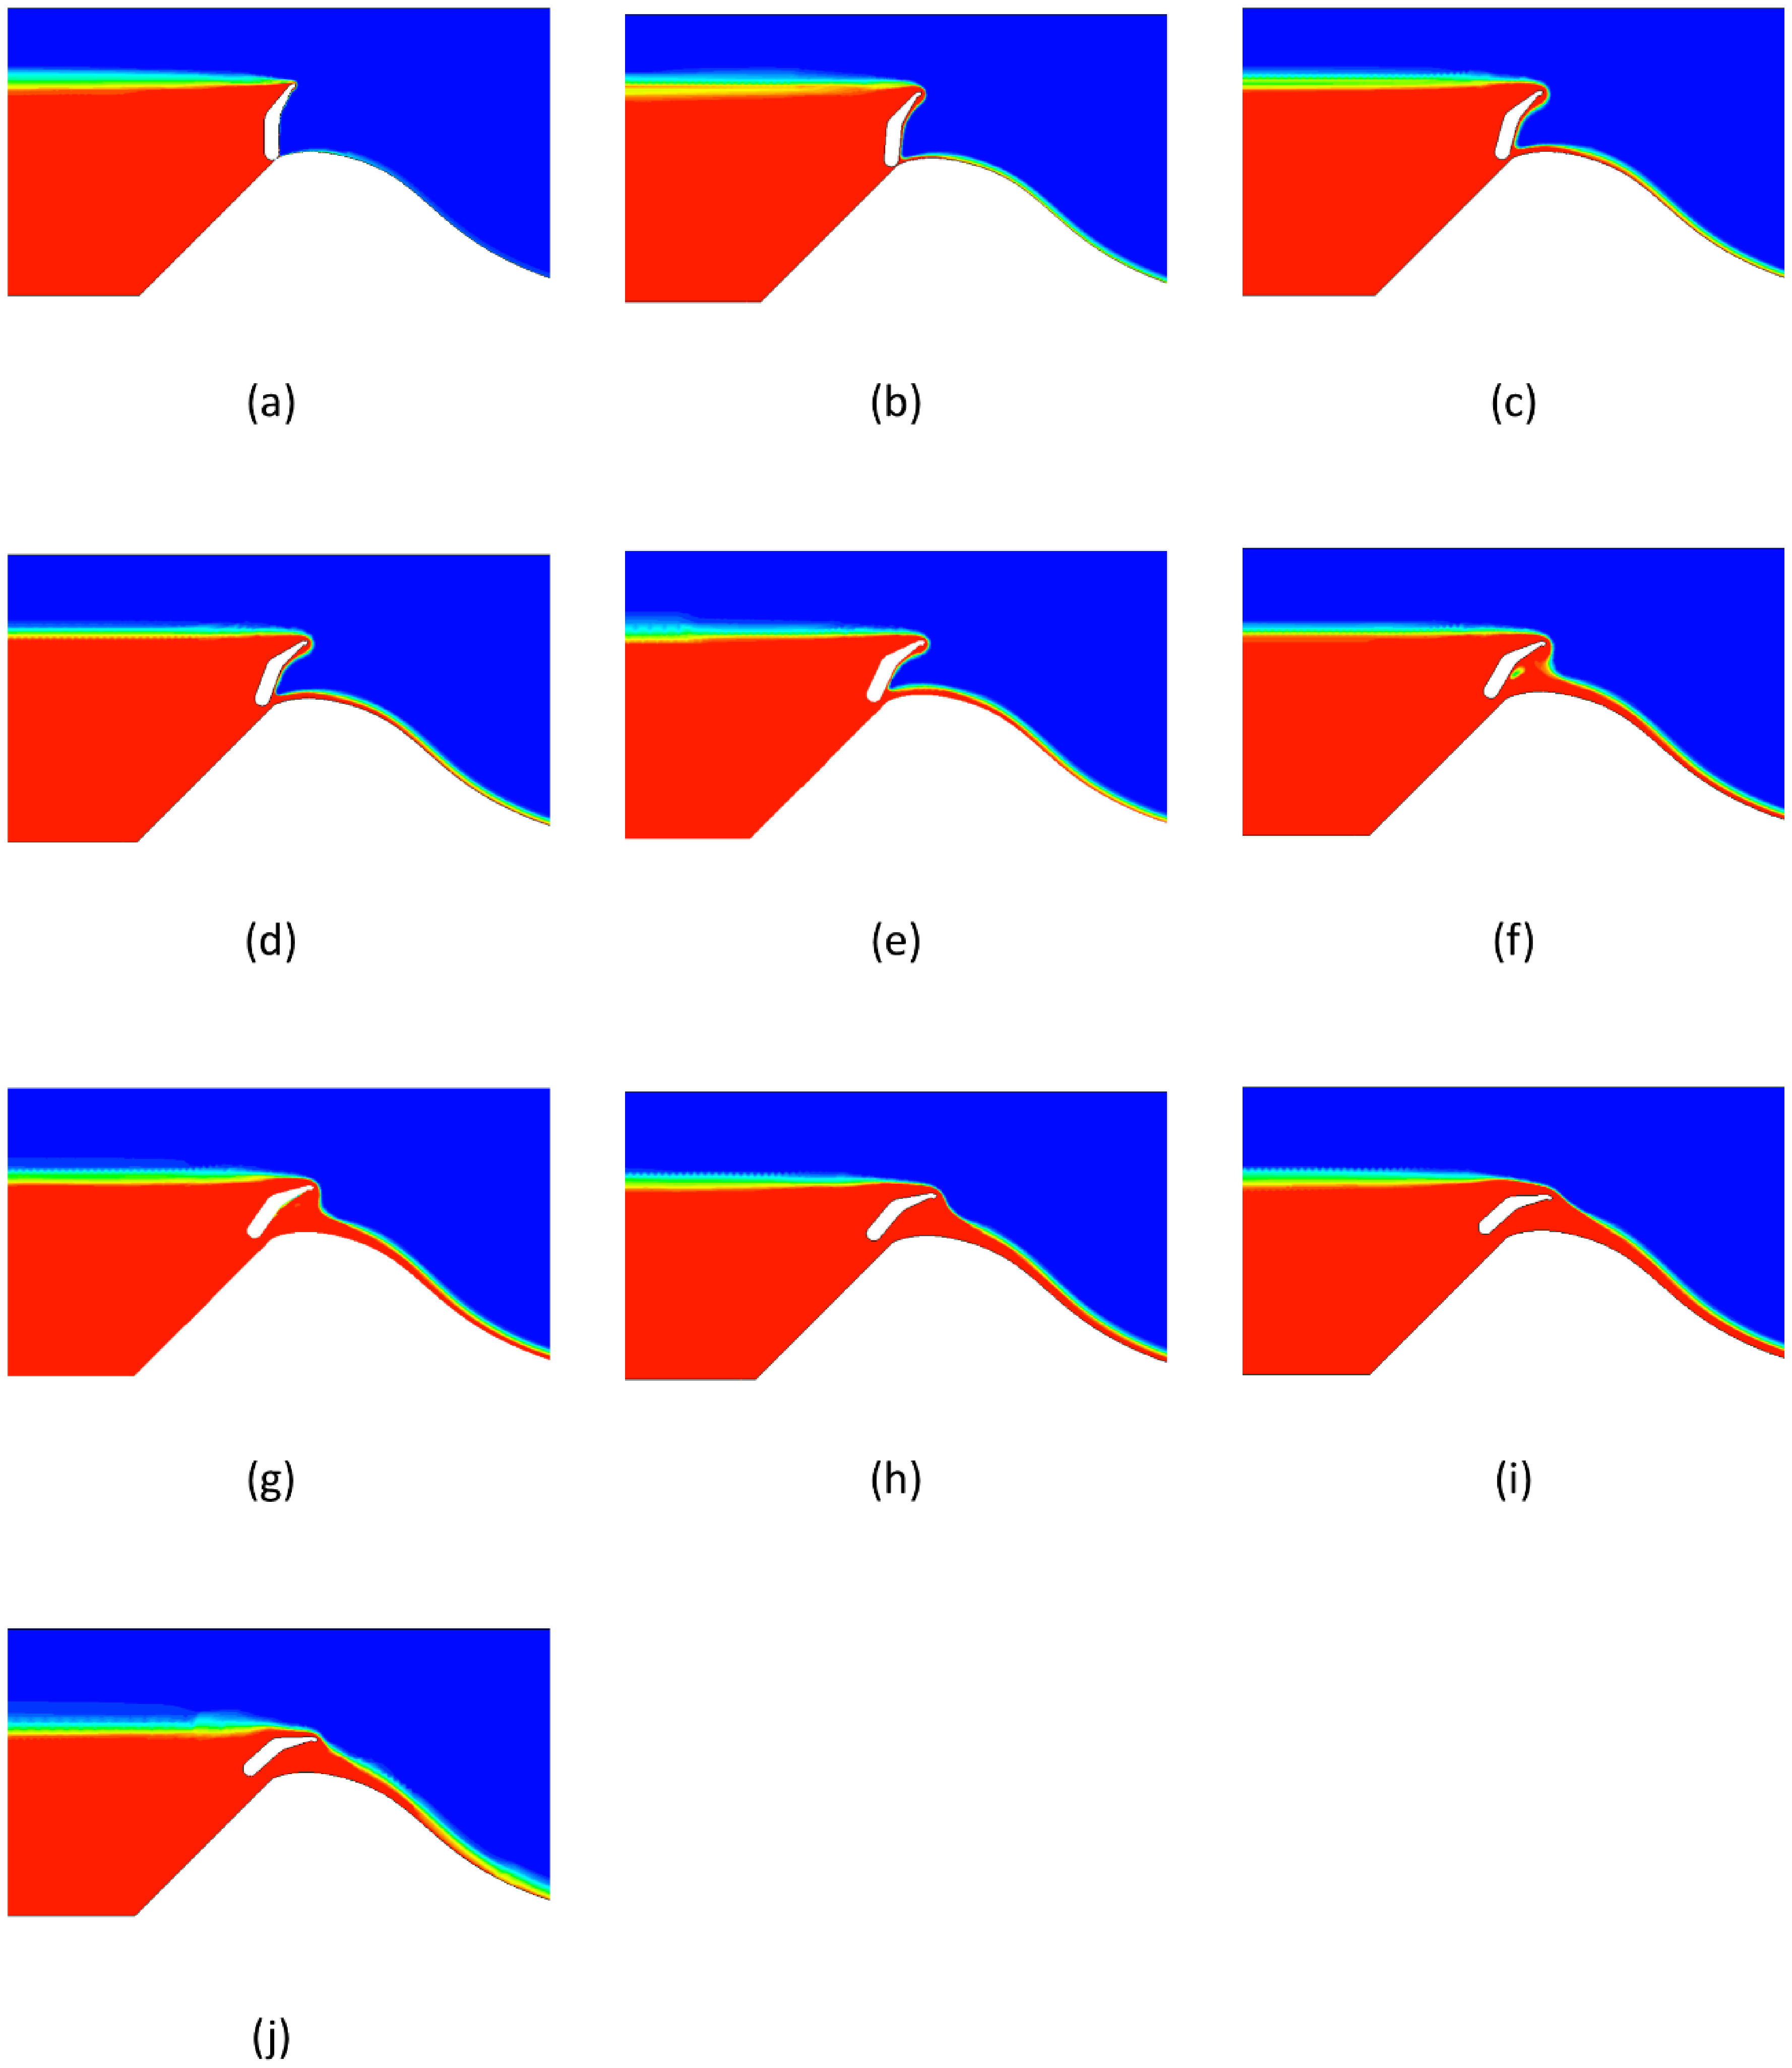
Figures 8 and 9 show comparisons between different opening positions resulting from experimental and numerical analyses. Such figures graphically demonstrate the variation in the heightening level between the experimental and numerical studies, and their importance lies in the control of the heightened level, in order to guarantee that the predicted level can determine the safety conditions in the operation of the dam . In Figure 9, the water fraction is represented in red while the air fraction is in blue. Intermediate colors represent intermediate mixture fractions between both fluids. This predictability of water levels allows dimensioning of the reservoir area and spillage control, so that the flooded region, during spillage in periods of excess water, does not threaten the safety of the areas surrounding the reservoir and the plant.
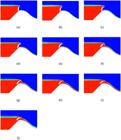
Opening movement of the self-operating gate in numerical analysis. (a) Closed gate condition; (b) Initial opening stage; (c) Early intermediate opening; (d) Intermediate opening; (e) Mid-opening position; (f) Advanced opening; (g) Near-maximum opening; (h) High opening angle; (i) Maximum opening at 48° – maximum discharge (opening flow); (j) Maximum opening at 48° – maximum discharge (closing flow).
In Figures 8 and 9, the small variations in level between the laboratory and computational experiments, respectively, can be observed for various opening angles. Figures 9i and 9j show the moments of maximum opening of the gate at 48 degrees with the maximum flow and closing flow, respectively. The first has the entire volume of water flowing once fully opened and the second has the minimum flow volume, when the hydrostatic pressure on the gate is low enough to start closing.
In search of a more detailed comparison between the employed methods (experimental and computational), a representation, at close moments, of the phase distinction (air and water) generated by the CFD simulation was compared with a photographic record taken during the laboratory tests. Through both methods, it can be concluded that the profile of the mechanism model meets the proposed requirements, seeing that they demonstrated similarity and coherence in their results in both the behavior of the fluid-structure interaction and in functional results.
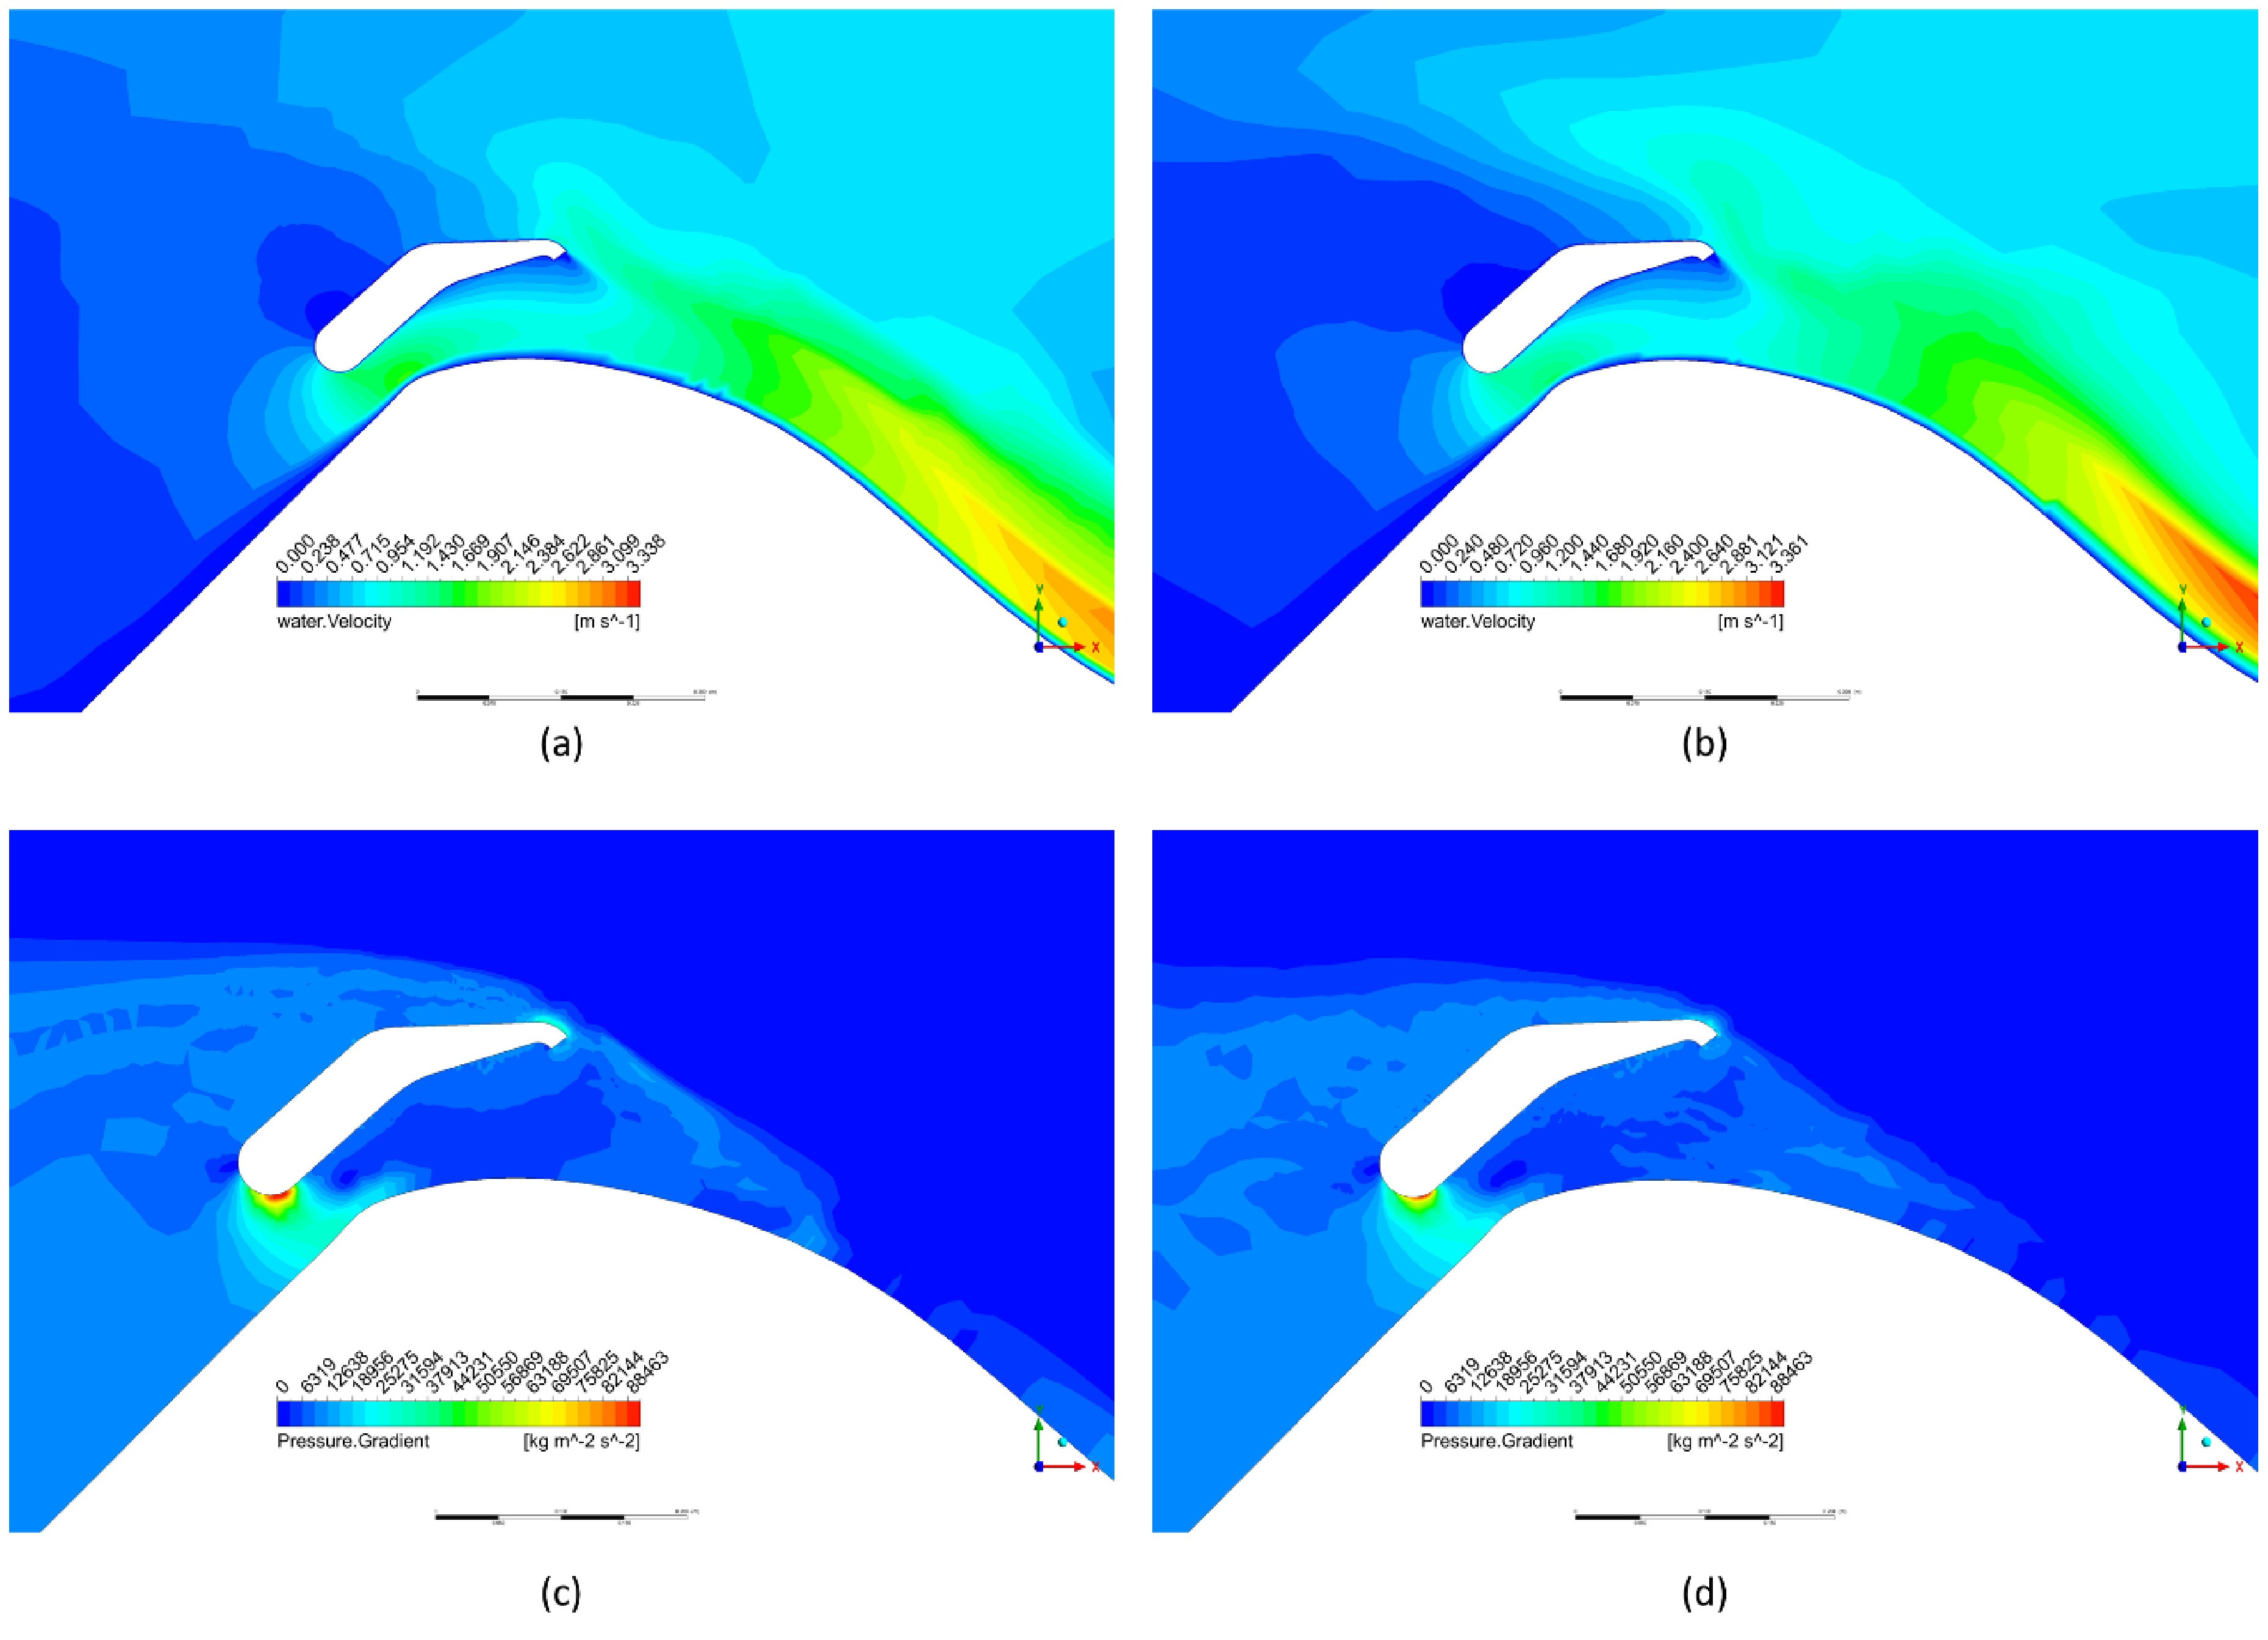
Regarding the distribution of the velocity contours and also the pressure gradients, Figure 10 demonstrates these components at the instants when the gate is at 48 degrees, with the total passage of the volume of water and with the passage of water at the threshold of initiating closure, respectively. However, the figure shows that the velocity variation over the gate is quite subtle since the flow remains constant upstream of the reservoir (Figure 10a and 10b).
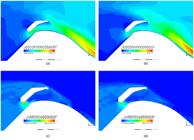
(a) Speed contour at 48º open and (b) at the moment of closing; (c) Contour resulting from pressure gradients at 48º open and (d) at the moment of closing.
The pressure gradients in the horizontal and vertical directions of the Cartesian plane are condensed as a resultant in Figure 10c and 10d. It is also observed that the highest concentrations of pressure are found in the lower opening curvature and in the upper tip of the gate profile, which makes these two regions subject to wear, tear and defects. However, the regions subject to these efforts are constantly varied according to the filling of the upstream reservoir and its articulation movement. However, in the most extreme situation of 48 degrees, it is demonstrated that the situation repeats itself: the gate is in equilibrium and returns to the initial position for a new operation cycle.
Analyses like these are fundamentally important for the application of these data in structural assessments of the equipment under development. The use of fluid dynamic analysis allows for obtaining results of the efforts applied to the structure, due to the total pressure, so that the mechanical components of the gate can be dimensioned. Therefore, the definition of the center of gravity and the center of support for opening and closing the gate can be foreseen.
Therefore, the forces acting on the mechanism are graphically obtained as a function of velocity and pressure as hydrostatic forces which are exerted by the contact of the liquid; the weight forces, exerted by the earth both on the mechanism and on the volume of water present above the mechanism; and the buoyant force exerted on the entire surface of the mechanism by the liquid surrounding it. The analysis of hydrostatic forces in the mechanism, in order to specify the magnitude or mode of the forces, the direction and the line of action, is divided into acting on an inclined plane surface and a vertical plane surface. According to White (1999), the hydrostatic force on one side of any flat surface submerged in a uniform fluid is equal to the product of the pressure at the geometric center of the plate by the area of the plate, regardless of the shape of the plate or its angle of inclination. To determine the weight force, the specific mass of the materials used in the structure and the weight of the water, which varies according to its gradient on the vertical axis, are considered. With this, the center of gravity, which represents the point where the body's weight acts, should vary. Therefore, it is assumed that the line of action of the weight is located at the centroid of the part. Finally, the buoyancy force is like the vertical force acting on bodies immersed or floating in a liquid (Fox & McDonald, 1998). The thrust line of action is related to the body's center of gravity in relation to the displaced volume, where it is applied.
CONCLUSION
The present study comprises the experimental and CFD comparison of a self-operating gate for heightening hydroelectric reservoirs. The fluid dynamic modeling study presented results that were validated with the experimental results. The applied methodology is based on two-phase flow, in both steady-state and turbulent flow; both satisfied the predictive analysis of the floodgate operation based on the increase in the dam elevation level and the discharged flow during the punctual opening process of the gate.
Both the experimental and numerical results were consistent with the heightening value at the upstream level for a 4:1 scale, in the order of 1.08 meters. This increase enables an energy gain of approximately 3,341 [MWh/year] in the entire cascade of river reservoirs in which the dam is inserted. Such an application becomes relevant in the Brazilian scenario, where there is a significant dependence on large reservoirs associated with increasingly frequent water crisis events and severe environmental restrictions for the construction of new reservoirs, which requires an increasingly efficient use of existing structures. The studied gate profile is capable of performing opening and closing operations and can be replicated in other reservoirs in other regions.
In summary, the methodology makes possible the prediction of heightening with precision, considering steady-state in a dual-phase, two-dimensional model; aside from a relatively low computational cost, it was validated by experimental analysis and can be replicated in problems that correlate the level to the amount from a reservoir with the flow rate according to the moment of opening the floodgate at any instant. One limitation of this study is the absence of a quantitative comparison between the experimental and numerical results. Nevertheless, this does not invalidate the qualitative and visual assessment of the agreement between both sets of results. The computational results were similar to the results observed in the physical laboratory and allowed for a more detailed evaluation of the pressure and velocities in the floodgate, which are essential parameters for the study of hydrodynamics and structural calculations of the floodgate.
NOTATION
α – Volume fraction
Ai – Mesh adaptation criterion
b – Channel width
ε – Dissipation rate of turbulent kinetic energy
Fr – Froude number
g – Gravitational acceleration
h – Water level
hmax – Maximum head above spillway crest
hv – Piezometric reading
k – Turbulent kinetic energy
li – Mesh edge length
μ – Dynamic viscosity
μeff – Effective viscosity
μt – Turbulent viscosity
Q – Flow rate
Qmax – Maximum discharge
ρ – Density
ρeff – Effective density in mixed air–water cells
σ – Surface tension
τᵢⱼ – Viscous stress tensor
θ – Floodgate opening angle
uᵢ – Velocity component
V – Flow velocity
Vol – Reservoir volume
Volalt – Raised reservoir volume
y+ – Dimensionless wall-distance parameter
LIST OF ABBREVIATIONS
ANEEL – Brazilian Electricity Regulatory Agency
CFD – Computational Fluid Dynamics
CREAGER – Creager spillway profile
DME – Municipal Department of Energy (Poços de Caldas)
DOE – Design of Experiments
EBC – Brazil Communication Enterprise
EPE – Brazilian Energy Research Enterprise
FAPEPE – Foundation for Teaching, Research, and Educational Extension in Itajubá
GCI – Grid Convergence Index
LES – Large Eddy Simulation
RANS – Reynolds-Averaged Navier–Stokes
SAS – Scale-Adaptive Simulation
SST – Shear Stress Transport turbulence model
TR – Return Time (flood recurrence period)
URANS – Unsteady Reynolds-Averaged Navier–Stokes
VOF – Volume of Fluid method
ACKNOWLEDGEMENTS
The authors extend their thanks to ANEEL, the Municipal Department of Energy (DME) of Poços de Caldas, and the Foundation for Teaching, Research, and Educational Extension in Itajubá (FAPEPE), financed by project PD0051-1503/2015 – Development of a Mechanism for Capacity Gain in Reservoir Storage.
DATA AVAILABILITY STATEMENT
Research data is only available upon request.
REFERENCES
-
AGÊNCIA NACIONAL DE ENERGIA ELÉTRICA – ANEEL. (2025). Brasil supera a marca de 210 GW instalados Retrieved in 2025, February 11, from https://www.gov.br/aneel/pt-br/assuntos/noticias/2025/brasil-supera-a-marca-de-210-gw-instalados
» https://www.gov.br/aneel/pt-br/assuntos/noticias/2025/brasil-supera-a-marca-de-210-gw-instalados - ANSYS Inc. (2015). CFX Solver – Theory guide Canonsburg: ANSYS Inc.
- ANSYS Inc. (2010). ANSYS CFX Tutorials [ebook]. Canonsburg: ANSYS Inc.
-
ANSYS Inc. (2025). ANSYS CFX‑Solver Theory Guide, Release v252 Help System. Retrieved in 2025, December 8, from https://ansyshelp.ansys.com/public/account/secured?returnurl=/////Views/Secured/corp/v252/en/cfx_thry/i1307284.html
» https://ansyshelp.ansys.com/public/account/secured?returnurl=/////Views/Secured/corp/v252/en/cfx_thry/i1307284.html -
Apsley, D., & Hu, W. (2003). CFD simulation of two- and three-dimensional free-surface flow. International Journal for Numerical Methods in Fluids, 42(5), 465-491. https://doi.org/10.1002/fld.523
» https://doi.org/10.1002/fld.523 -
Associação Brasileira de Pequenas Centrais Hidrelétricas e Centrais Geradoras Hidrelétricas – ABRAPCH. (2019). Power plants Retrieved in 2022, February 2, from https://abrapch.org.br/2019/09/abrapch-defende-construcao-de-novos-reservatorios-para-enfrentar-crise-hidrica/
» https://abrapch.org.br/2019/09/abrapch-defende-construcao-de-novos-reservatorios-para-enfrentar-crise-hidrica/ -
Bennett, P., Chesterton, J., Neeve, D., Ucuncu, M., Wearing, M., & Jones, S. E. L. (2018). Use of CFD for modelling spillway performance. Dams & Reservoirs, 28(2), 62-72. https://doi.org/10.1680/jdare.18.00001
» https://doi.org/10.1680/jdare.18.00001 -
Botan, A. C. B., Camacho, R. G. R., & Tiago Filho, G. L. (2021). Optimization of a draft tube using statistical techniques- DOE and 2D computational fluid dynamic analysis. Journal of Applied Fluid Mechanics, 14(6), 1617-1633. https://doi.org/10.47176/jafm.14.06.32314
» https://doi.org/10.47176/jafm.14.06.32314 -
Caceres, A. L., Jaramillo, P., Matthews, H. S., Samaras, C., & Nijssen, B. (2021). Hydropower under climate uncertainty: characterizing the usable capacity of Brazilian, Colombian and Peruvian power plants under climate scenarios. Energy for Sustainable Development, 61, 217-229. https://doi.org/10.1016/j.esd.2021.02.006
» https://doi.org/10.1016/j.esd.2021.02.006 -
Chesterton, O. J., Ucuncu, M., & Borman, D. (2019). CFD modelling for dams and reservoirs – best practice workflows, specification and review. Dams & Reservoirs, 29(4), 148-157. https://doi.org/10.1680/jdare.19.00032
» https://doi.org/10.1680/jdare.19.00032 - Chevalier, S. (2004). Fusegates mitigate silting at Beni Amrane reservoir, Algeria. International Journal on Hydropower & Dams, 11(5), 118-119.
-
Coste, P., & Laviéville, J. (2015). A turbulence model for large interfaces in high Reynolds two-phase CFD. Nuclear Engineering and Design, 284, 162-175. https://doi.org/10.1016/j.nucengdes.2014.12.004
» https://doi.org/10.1016/j.nucengdes.2014.12.004 - Dias, V. S., Luz, M. P., Medero, G. M., & Nascimento, D. T. F. (2018). An overview of hydropower reservoirs in Brazil: current situation, future perspectives and impacts of climate change. Water (Basel), 10, 589.
-
Doustdar, M. M., & Kazemi, H. (2019). Effects of fixed and dynamic mesh methods on simulation of stepped planing craft. Journal of Ocean Engineering and Science, 4(1), 33-48. https://doi.org/10.1016/j.joes.2018.12.005
» https://doi.org/10.1016/j.joes.2018.12.005 -
Empresa Brasil de Comunicação - EBC. (2021). Brasil enfrenta a pior crise hídrica em 91 anos Retrieved in 2025, December 8, from https://agenciabrasil.ebc.com.br/radioagencia-nacional/economia/audio/2021-09/brasil-enfrenta-pior-crise-hidrica-em-91-anos
» https://agenciabrasil.ebc.com.br/radioagencia-nacional/economia/audio/2021-09/brasil-enfrenta-pior-crise-hidrica-em-91-anos -
Empresa de Pesquisa Energética - EPE. (2018). Considerações sobre a Expansão Hidrelétrica nos Estudos de Planejamento Energético de Longo Prazo Retrieved in 2025, December 8, from https://www.epe.gov.br/sites-pt/publicacoes-dados-abertos/publicacoes/PublicacoesArquivos/publicacao-227/topico-457/Considera%C3%A7%C3%B5es%20sobre%20a%20Expans%C3%A3o%20Hidrel%C3%A9trica%20nos%20Estudos%20de%20Planejamento%20Energ%C3%A9tico%20de%20Longo%20Prazo.pdf
» https://www.epe.gov.br/sites-pt/publicacoes-dados-abertos/publicacoes/PublicacoesArquivos/publicacao-227/topico-457/Considera%C3%A7%C3%B5es%20sobre%20a%20Expans%C3%A3o%20Hidrel%C3%A9trica%20nos%20Estudos%20de%20Planejamento%20Energ%C3%A9tico%20de%20Longo%20Prazo.pdf -
Empresa de Pesquisa Energética - EPE. (2021). Relatório Síntese 2022. Ano base 2021 Retrieved in 2025, December 8, from https://www.epe.gov.br/sites-pt/publicacoes-dados-abertos/publicacoes/PublicacoesArquivos/publicacao-675/topico-631/BEN_S%C3%ADntese_2022_PT.pdf
» https://www.epe.gov.br/sites-pt/publicacoes-dados-abertos/publicacoes/PublicacoesArquivos/publicacao-675/topico-631/BEN_S%C3%ADntese_2022_PT.pdf - Fox, R. W., & McDonald, A. T. (1998). Introdução à mecânica dos fluidos (5. ed.). Rio de Janeiro: LTC.
- Galvão, J., & Bermann, C. (2015). Water and energy crisis: conflicts in the multiple use of water. Advanced Studies, 29(84), 43-68.
-
Gernaat, D. E. H. J., Bogaart, W. P., Van Vuuren, D. P., Biemans, H., & Niessink, R. (2017). High-resolution assessment of global technical and economic hydropower potential. Nature Energy, 2(10), 821-828. https://doi.org/10.1038/s41560-017-0006-y
» https://doi.org/10.1038/s41560-017-0006-y - Goldenberg, J., & Prado, L. T. S. (2003). Reforma e crise do setor elétrico no período FHC. Tempo Social – USP, 221-235.
-
Hunt, J. D., Nascimento, A., Caten, C. S., Tomé, F. M. C., Schneider, P. S., Thomazoni, A. L. R., Castro, N. J., Brandão, R., Freitas, M. A. V., Martini, J. S. C., Ramos, D. S., & Senne, R. (2022). Energy crisis in Brazil: impact of hydropower reservoir level on the river flow. Energy, 239(Pt A), 121927. https://doi.org/10.1016/j.energy.2021.121927
» https://doi.org/10.1016/j.energy.2021.121927 -
HYDROPLUS. (2017). Fusegate project, 2017 Retrieved in 2025, December 8, from www.hydroplus.com/
» www.hydroplus.com/ -
Kumcu, S. Y. (2017). Investigation of flow over spillway modeling and comparison between experimental data and CFD analysis. KSCE Journal of Civil Engineering, 21(3), 994-1003. https://doi.org/10.1007/s12205-016-1257-z
» https://doi.org/10.1007/s12205-016-1257-z - López, D., & Lévy, B. (2012). Dynamic mesh optimization for free surfaces in fluid simulation. In Proceedings of the 21st International Meshing Roundtable (IMR). San José, Estados Unidos.
-
Mnasri, C., Hafsia, Z., Omri, M., & Maalel, K. (2010). A moving grid model for simulation of free surface behavior induced by horizontal cylinders exit and entry. Engineering Applications of Computational Fluid Mechanics, 4(2), 260-275. https://doi.org/10.1080/19942060.2010.11015315
» https://doi.org/10.1080/19942060.2010.11015315 - Mockmore, C. A., & Merryfield, F. (1949). The banki water turbine (Bulletin Series, No. 25). Corvallis: Oregon State College.
-
Moghadam, E. M., Saeidi, A., Rouleau, A., & Patarroyo, J. (2025). A numerical study on the effect of gate configuration on the hydraulic parameters of dam spillways. Results in Engineering, 25, 104446. https://doi.org/10.1016/j.rineng.2025.104446
» https://doi.org/10.1016/j.rineng.2025.104446 -
Muhammad, N., & Ullah, N. (2021). Simulation of flow on the hydroelectric power dam spillway via OpenFOAM. The European Physical Journal Plus, 136(11), 1191. https://doi.org/10.1140/epjp/s13360-021-02128-x
» https://doi.org/10.1140/epjp/s13360-021-02128-x -
Muralha, A., Melo, J. F., & Ramos, H. M. (2020). Assessment of CFD solvers and turbulent models for water free jets in spillways. Fluids (Basel, Switzerland), 5(3), 104. https://doi.org/10.3390/fluids5030104
» https://doi.org/10.3390/fluids5030104 -
NASA. (2008). Examining Spatial (Grid) Convergence. Tutorial Retrieved in 2025, December 8, from https://www.grc.nasa.gov/WWW/wind/valid/tutorial/spatconv.html
» https://www.grc.nasa.gov/WWW/wind/valid/tutorial/spatconv.html - Perot, B., & Nallapati, R. (2003). A moving unstructured staggered mesh method for the simulation of incompressible free-surface flows. Journal of Computational Physics, 184(1), 192-214.
-
Qiu, W., Li, Y., Zhang, Y., Wen, L., Wang, T., Wang, J., & Sun, X. (2024). Numerical investigation on the evolution process of cascade dam-break flood in the downstream earth-rock dam reservoir area based on coupled CFD-DEM. Journal of Hydrology (Amsterdam), 635, 131162. https://doi.org/10.1016/j.jhydrol.2024.131162
» https://doi.org/10.1016/j.jhydrol.2024.131162 -
Ross, E. J. (1998). WO 1998045539 A1. Geneva: World Intellectual Property Organization — WIPO. Water control gate. Retrieved in 2025, February 11, from https://patents.google.com/patent/WO1998045539A1/en
» https://patents.google.com/patent/WO1998045539A1/en -
Santos, I. F. S., Camacho, R. G. R., & Tiago Filho, G. L. (2021). Study of the wake characteristics and turbines configuration of a hydrokinetic farm in an Amazonian river using experimental data and CFD tools. Journal of Cleaner Production, 299, 126881. https://doi.org/10.1016/j.jclepro.2021.126881
» https://doi.org/10.1016/j.jclepro.2021.126881 - Santos, I. R. B. (2018). Development of a mechanism to gain storage capacity in reservoirs (Master's dissertation). Universidade Federal de Itajubá, Itajubá (In Portuguese).
-
Santos, I. R. B., Tiago Filho, G. L., Vasconcellos, B. T. C., Souza Júnior, O. H., & Santos, I. F. S. (2022). Energy and economic study of the increased energy production of cascaded hydroelectric plants due to the heightening of the upstream reservoir: a case study in Cipó-Rio das Antas dam. Renewable Energy, 198, 228-245. https://doi.org/10.1016/j.renene.2022.07.146
» https://doi.org/10.1016/j.renene.2022.07.146 -
Shaheed, R., Mohammadian, A., & Yan, X. (2022). Numerical simulation of turbulent flow in bends and confluences considering free surface changes using the volume of fluid method. Water (Basel), 14(8), 1307. https://doi.org/10.3390/w14081307
» https://doi.org/10.3390/w14081307 - Silva, P. M. (2021). Análise do comportamento hidráulico de vertedores na variação do número de Froude – simulação computacional (Dissertação de mestrado). Programa de Pós-graduação em Meio Ambiente e Recursos Hídricos, Universidade Federal de Itajubá, Itajubá.
-
Simsek, O., & Islek, H. (2023). 2D and 3D numerical simulations of dam-break flow problem with RANS, DES, and LES. Ocean Engineering, 276, 114298. https://doi.org/10.1016/j.oceaneng.2023.114298
» https://doi.org/10.1016/j.oceaneng.2023.114298 - Souza Junior, O. H. (2018). Development of a mechanism to gain storage capacity in reservoir. Research and development report Federal University of Itajubá (MG) and Poços de Caldas Municipal Energy Department (In Portuguese).
-
Tefera, W. M., & Kasiviswanathan, K. (2022). A global-scale hydropower potential assessment and feasibility evaluations. Water Resources and Economics, 38, 100198. https://doi.org/10.1016/j.wre.2022.100198
» https://doi.org/10.1016/j.wre.2022.100198 - Tiago Filho, G. L., & Souza Junior, O. H. (Orgs.). (2018). Floodgates and hydromechanical components: types, behaviour, sizing and applications Itajubá: Ed. Acta (In Portuguese).
- Tu, J., Yeoh, G. H., & Liu, C. (2013). Computational fluid dynamics: a practical approach (2nd ed). Elsevier.
- Versteeg, H. K., & Malalasekera, W. (1995) An introduction to computational fluid dynamics: the finite volume method England: Ed. Longman Scientific & Technical.
- White, F. M. (1999). Fluid mechanics (4th ed.). WCB/McGraw-Hill.
-
Ziemińska-Stolarska, A., Polańczyk, A., & Zbiciński, I. (2015). 3-D CFD simulations of hydrodynamics in the Sulejow dam reservoir. Journal of Hydrology and Hydromechanics, 63(4), 334-341. https://doi.org/10.1515/johh-2015-0033
» https://doi.org/10.1515/johh-2015-0033
Edited by
-
Editor-in-Chief:
Adilson Pinheiro
-
Associated Editor:
Iran Eduardo Lima Neto