 Historical and probabilistic estimation of frequency factors for the daily Probable Maximum Precipitation (PMP) in Minas Gerais, Brazil
ABSTRACT
Extreme precipitation events directly affect public safety, infrastructure, and the economy, and are influenced by regional hydrometeorological conditions. In hydrology, design flows may be estimated using deterministic or probabilistic approaches. Under the statistical method, the Probable Maximum Precipitation (PMP) is traditionally interpreted as a theoretical upper limit obtained by maximizing the frequency factor (K). However, this statistical formulation was developed from datasets and assumptions that may not fully represent other climatic regions. More recent discussions have highlighted the importance of probabilistic definitions of extreme precipitation, which interpret the PMP as a rainfall depth associated with very low exceedance probabilities. This study developed envelope curves for frequency factors in Minas Gerais, Brazil, using historical and synthetic daily precipitation series from 481 stations. The synthetic series enabled a probabilistic characterization of extremes, with estimates obtained for exceedance levels of 5% and 1%. The results showed maximum K values of 8.98 in historical data and higher values in synthetic series, reaching 14.04 and 14.62. The curves also revealed spatial differences across climatic regions. Overall, the findings indicate that Hershfield’s classical envelope, when applied to Minas Gerais, may assume a conservative character, while region-specific curves can offer a more representative basis for local PMP estimation.
Keywords:
Probable Maximum Precipitation (PMP); Frequency Factor (K); Climatic classification; Synthetic series; Envelope curves
RESUMO
Eventos de precipitação extrema afetam diretamente a segurança pública, a infraestrutura e a economia, sendo condicionados por características hidrometeorológicas regionais. Na hidrologia, as vazões de projeto podem ser estimadas por meio de abordagens determinísticas ou probabilísticas. No método estatístico, a Precipitação Máxima Provável (PMP) é tradicionalmente interpretada como um limite superior teórico obtido pela maximização do fator de frequência (K). No entanto, essa formulação estatística foi desenvolvida a partir de conjuntos de dados e pressupostos que podem não representar adequadamente outras regiões climáticas. Discussões mais recentes têm destacado a importância de definições probabilísticas da precipitação extrema, nas quais a PMP é interpretada como uma altura de chuva associada a probabilidades de excedência muito baixas. Este estudo desenvolveu curvas envoltórias para os fatores de frequência em Minas Gerais, Brasil, utilizando séries históricas e sintéticas de precipitação diária provenientes de 481 estações. As séries sintéticas permitiram uma caracterização probabilística dos extremos, com estimativas obtidas para níveis de excedência de 5% e 1%. Os resultados indicaram valores máximos de K iguais a 8,98 nos dados históricos e valores mais elevados nas séries sintéticas, alcançando 14,04 e 14,62. As curvas também evidenciaram diferenças espaciais entre as regiões climáticas. De modo geral, os resultados indicam que a envoltória clássica de Hershfield, quando aplicada a Minas Gerais, pode assumir um caráter conservador, enquanto curvas específicas por região oferecem uma base mais representativa para a estimativa local da PMP.
Palavras-chave:
Precipitação Máxima Provável (PMP); Fator de frequência (K); Classificação climática; Séries sintéticas; Curvas envoltórias
INTRODUCTION
Extreme precipitation events, such as heavy rainfall, are hydrometeorological phenomena associated with low probabilities of occurrence, whose frequency, spatial distribution, and intensity may vary under different climatic conditions (Intergovernmental Panel on Climate Change, 2023). Their occurrence is strongly conditioned by regional climatic characteristics, shaped by atmospheric circulation patterns, topographic influences, and ocean–atmosphere interactions (Nimer, 1979). In Brazil, the spatial and temporal variability of precipitation extremes is strongly influenced by large-scale modes of climate variability that modulate rainfall patterns across multiple temporal scales (Lima et al., 2025). Within Minas Gerais, intense rainfall events arise from the interaction of distinct large-scale atmospheric systems. During winter, the South Atlantic Subtropical Anticyclone (ASAS) suppresses precipitation and promotes prolonged dry conditions. In contrast, during summer, precipitation extremes are primarily associated with the South American Monsoon System (SAMS) and with the South Atlantic Convergence Zone (SACZ), a northwest–southeast-oriented moisture band responsible for persistent and intense rainfall over the region (Silva et al., 2020; Rosa et al., 2020; Tavares, 2024).
Considering the regional atmospheric mechanisms that modulate extreme rainfall in Minas Gerais, it becomes essential to characterize the climatic contexts in which these events occur. Climate Classification Systems provide a structured framework for synthesizing the dominant climatic features of specific regions. Among these, the Köppen–Geiger system is widely employed for delineating climate zones based on average monthly temperature and precipitation patterns, enabling the identification of areas with similar climatic behavior and supporting analyses of climate variability (Martins et al., 2018). In a country with pronounced climatic heterogeneity such as Brazil, identifying regions with similar climate risk characteristics is fundamental for understanding the spatial patterns of hydrometeorological extremes and improving regional water resources management strategies (Lima et al., 2025). This climatic stratification is particularly relevant because regional climate regimes influence the frequency and magnitude of extreme rainfall events and, consequently, the generation of high magnitude streamflows.
The estimation of extreme flows is an essential step in the design of hydraulic structures. While smaller infrastructures may tolerate some degree of overtop, critical works such as dam spillways require precise estimates to avoid structural failure (Koutsoyiannis & Papalexiou, 2017). Historical cases of dam failures caused by overtopping in Brazil highlight the severity of such events and reinforce the need for stringent safety criteria in hydraulic design (Saliba, 2009). Although dams provide essential services such as water supply, flood control, irrigation, and hydropower generation, failures can result in severe downstream consequences, including loss of life, environmental damage, and significant socioeconomic impacts (Salgado et al., 2025). To mitigate these risks, national guidelines, such as the Manual do Empreendedor – Volume V of the Agência Nacional de Águas (ANA, National Water Agency) (Agência Nacional de Águas e Saneamento Básico, 2016) and Resolution No. 95 of the Agência Nacional de Mineração (ANM, National Mining Agency) (Brasil, 2022), establish the requirement that critical structures be designed based on the Probable Maximum Flood (PMF). The PMF is determined from the Probable Maximum Precipitation (PMP), in accordance with WMO (World Meteorological Organization, 2009) recommendations.
According to WMO (World Meteorological Organization, 2009), the estimation of the PMP can be carried out through two main approaches: hydrometeorological models and statistical models. The first one is based on the maximization of physical processes, such as the saturation of the air mass responsible for extreme precipitation, considering the most severe possible meteorological conditions. Statistical models, on the other hand, are based on the study developed by Hershfield (1961a, 1961b, 1965) and estimate the PMP through the maximization of the frequency factor (K), using historical precipitation records and envelope curves fitted from observed data.
However, the limitation of long and reliable historical records may compromise the accuracy of extreme precipitation estimates, especially in regions with limited rainfall coverage, as occurs in several areas of Brazil. In this context, the generation of synthetic series has been shown in the literature to be an effective alternative, as it allows for the simulation of the statistical variability of observed data and, consequently, provides more robust estimates of extreme events (Costa, 2015).
Synthetic series generation relies on stochastic modeling to represent hydrological variables that exhibit randomness and temporal dependence. Classical models such as AR, MA, ARMA, and ARIMA (Box & Jenkins, 1970) have long been applied to precipitation and other hydrological data.
For daily precipitation, bipartite models are widely used, combining (i) the simulation of wet and dry day sequences, often via Markov chains or alternating-renewal processes, and (ii) the simulation of rainfall amounts on wet days using probability distributions such as Gamma, Exponential, or Lognormal. Hybrid models extend this framework by modeling moderate and extreme rainfall separately, acknowledging that distinct physical mechanisms may govern each regime. This dual treatment allows the representation of typical precipitation patterns while retaining the ability to reproduce heavy-tailed behavior associated with hydrometeorological extremes.
In the contemporary context of PMP estimation, the report Modernizing Probable Maximum Precipitation Estimation (National Academies of Sciences, Engineering, and Medicine, 2024) highlights that traditional approaches, based on fixed upper bounds derived from historical records and deterministic assumptions, have become increasingly insufficient given the growing influence of climate variability and the availability of more advanced modeling tools. As an alternative, the report proposes redefining the PMP as the precipitation depth associated with extremely low exceedance probabilities, replacing the concept of a fixed physical ceiling with a probabilistic framework more consistent with the dynamic nature of hydrometeorological extremes.
Under this probabilistic formulation, the traditional interpretation of the PMP as an absolute upper physical limit becomes conceptually difficult to justify. Any non-negative precipitation value, including the PMP, inherently presents a nonzero probability of exceedance according to statistical theory, empirical evidence, and principles such as maximum entropy that guide probability distribution modeling. Although physical constraints undeniably exist in hydrology, as classically illustrated by Horton (1931, as cited in Klemeš, 2000) in distinguishing the potential of small and large basins, such constraints do not align with the deterministic notion of an immutable precipitation ceiling. These considerations reinforce the need to reinterpret PMP estimation methods in a way that incorporates both physical plausibility and probabilistic coherence.
This broader context underscores the importance of revisiting widely used PMP estimation methodologies, particularly the statistical approach developed by Hershfield (1965). That method was based on precipitation records from the United States, a region with predominantly temperate climatic conditions and rainfall driven by frontal systems and hurricanes. In contrast, Brazilian rainfall extremes are controlled by mechanisms such as the Intertropical Convergence Zone (ITCZ), the South Atlantic Convergence Zone (SACZ), and orographic effects (Braga & Ambrizzi, 2022), which may produce frequency factors distinct from those reported for Northern Hemisphere climates.
Significant disparities in extreme precipitation across climatic zones have been repeatedly documented. Using GHCN data, Koutsoyiannis and Papalexiou (2017) demonstrated large variations in record precipitation among climate regimes, with maximum K values exceeding those originally proposed by Hershfield. Similar deviations have been reported in regional studies (Desa & Rakhecha, 2007; Sarkar & Maity, 2020; Silva Neto et al., 2020; Burger, 2014; Martins, 2024; Barbosa et al., 2023), particularly in tropical and monsoonal regions. Collectively, these findings highlight the need for region-specific envelope curves capable of representing local climatic behavior and reducing uncertainties in the design of critical hydraulic structures.
Within this scientific context, the objective of the present study is to develop envelope curves for the frequency factor (K) tailored to the climatic conditions of Minas Gerais, using both observed and synthetic daily precipitation series. The analysis is structured according to the Köppen climate classification adapted for the state by Martins et al. (2018), allowing the assessment of variability across distinct climatic domains. To ensure temporal representativeness, the study incorporates an expanded and updated pluviometric database that includes recent decades, thereby capturing possible climate-related shifts in extreme precipitation.
Furthermore, by integrating synthetic series into the analysis, the study introduces a probabilistic framework that enhances the representation of extreme-event variability. This approach aligns with the recommendations of the National Academies of Sciences, Engineering, and Medicine (2024), which advocate replacing deterministic PMP limits with estimates derived from extremely low exceedance probabilities. In accordance with this perspective, the present work adopts the 5% and 1% exceedance percentiles to derive probabilistic PMP estimates that are more flexible, robust, and better suited to regional climatic conditions.
AREA UNDER STUDY
The state of Minas Gerais was selected as the study area due to its national relevance, standing out in Brazil’s mining and hydropower sectors. According to the Sistema Integrado de Gestão de Barragens de Mineração (2024) (SIGBM, Integrated Mining Dam Management System), Minas Gerais is the state with the largest number of registered mining dams. Furthermore, as reported by the Sistema Nacional de Informações sobre Segurança de Barragens (SNISB, National Dam Safety Information System) (Sistema Nacional de Informações sobre Segurança de Barragens, 2024), it ranks third in the total number of dams in Brazil.
In addition to its economic and hydrological relevance, the state of Minas Gerais has also become a central point of discussion regarding dam safety in Brazil, particularly after the catastrophic failures of the Fundão tailings dam in Mariana (2015) and the Córrego do Feijão dam in Brumadinho (2019). These events exposed structural, regulatory, and governance weaknesses in the management of mining dams, triggering profound social, environmental, and institutional consequences (Pereira et al., 2020). Earlier dam failures in the state, such as the rupture of the Mineração Rio Pomba Cataguases tailings dam in Miraí (2007) (Centro de Tecnologia Mineral, 2012), the failure of the waste containment dam of the Indústria Cataguases de Papel e Celulose in Cataguases in March 2003 (Miquelito & Quelhas, 2014), and the collapse of the Mineração Rio Verde tailings dam in Nova Lima (2001) (Centro de Tecnologia Mineral, 2016), had already revealed the high environmental and social vulnerability associated with inadequate dam safety practices in Minas Gerais.
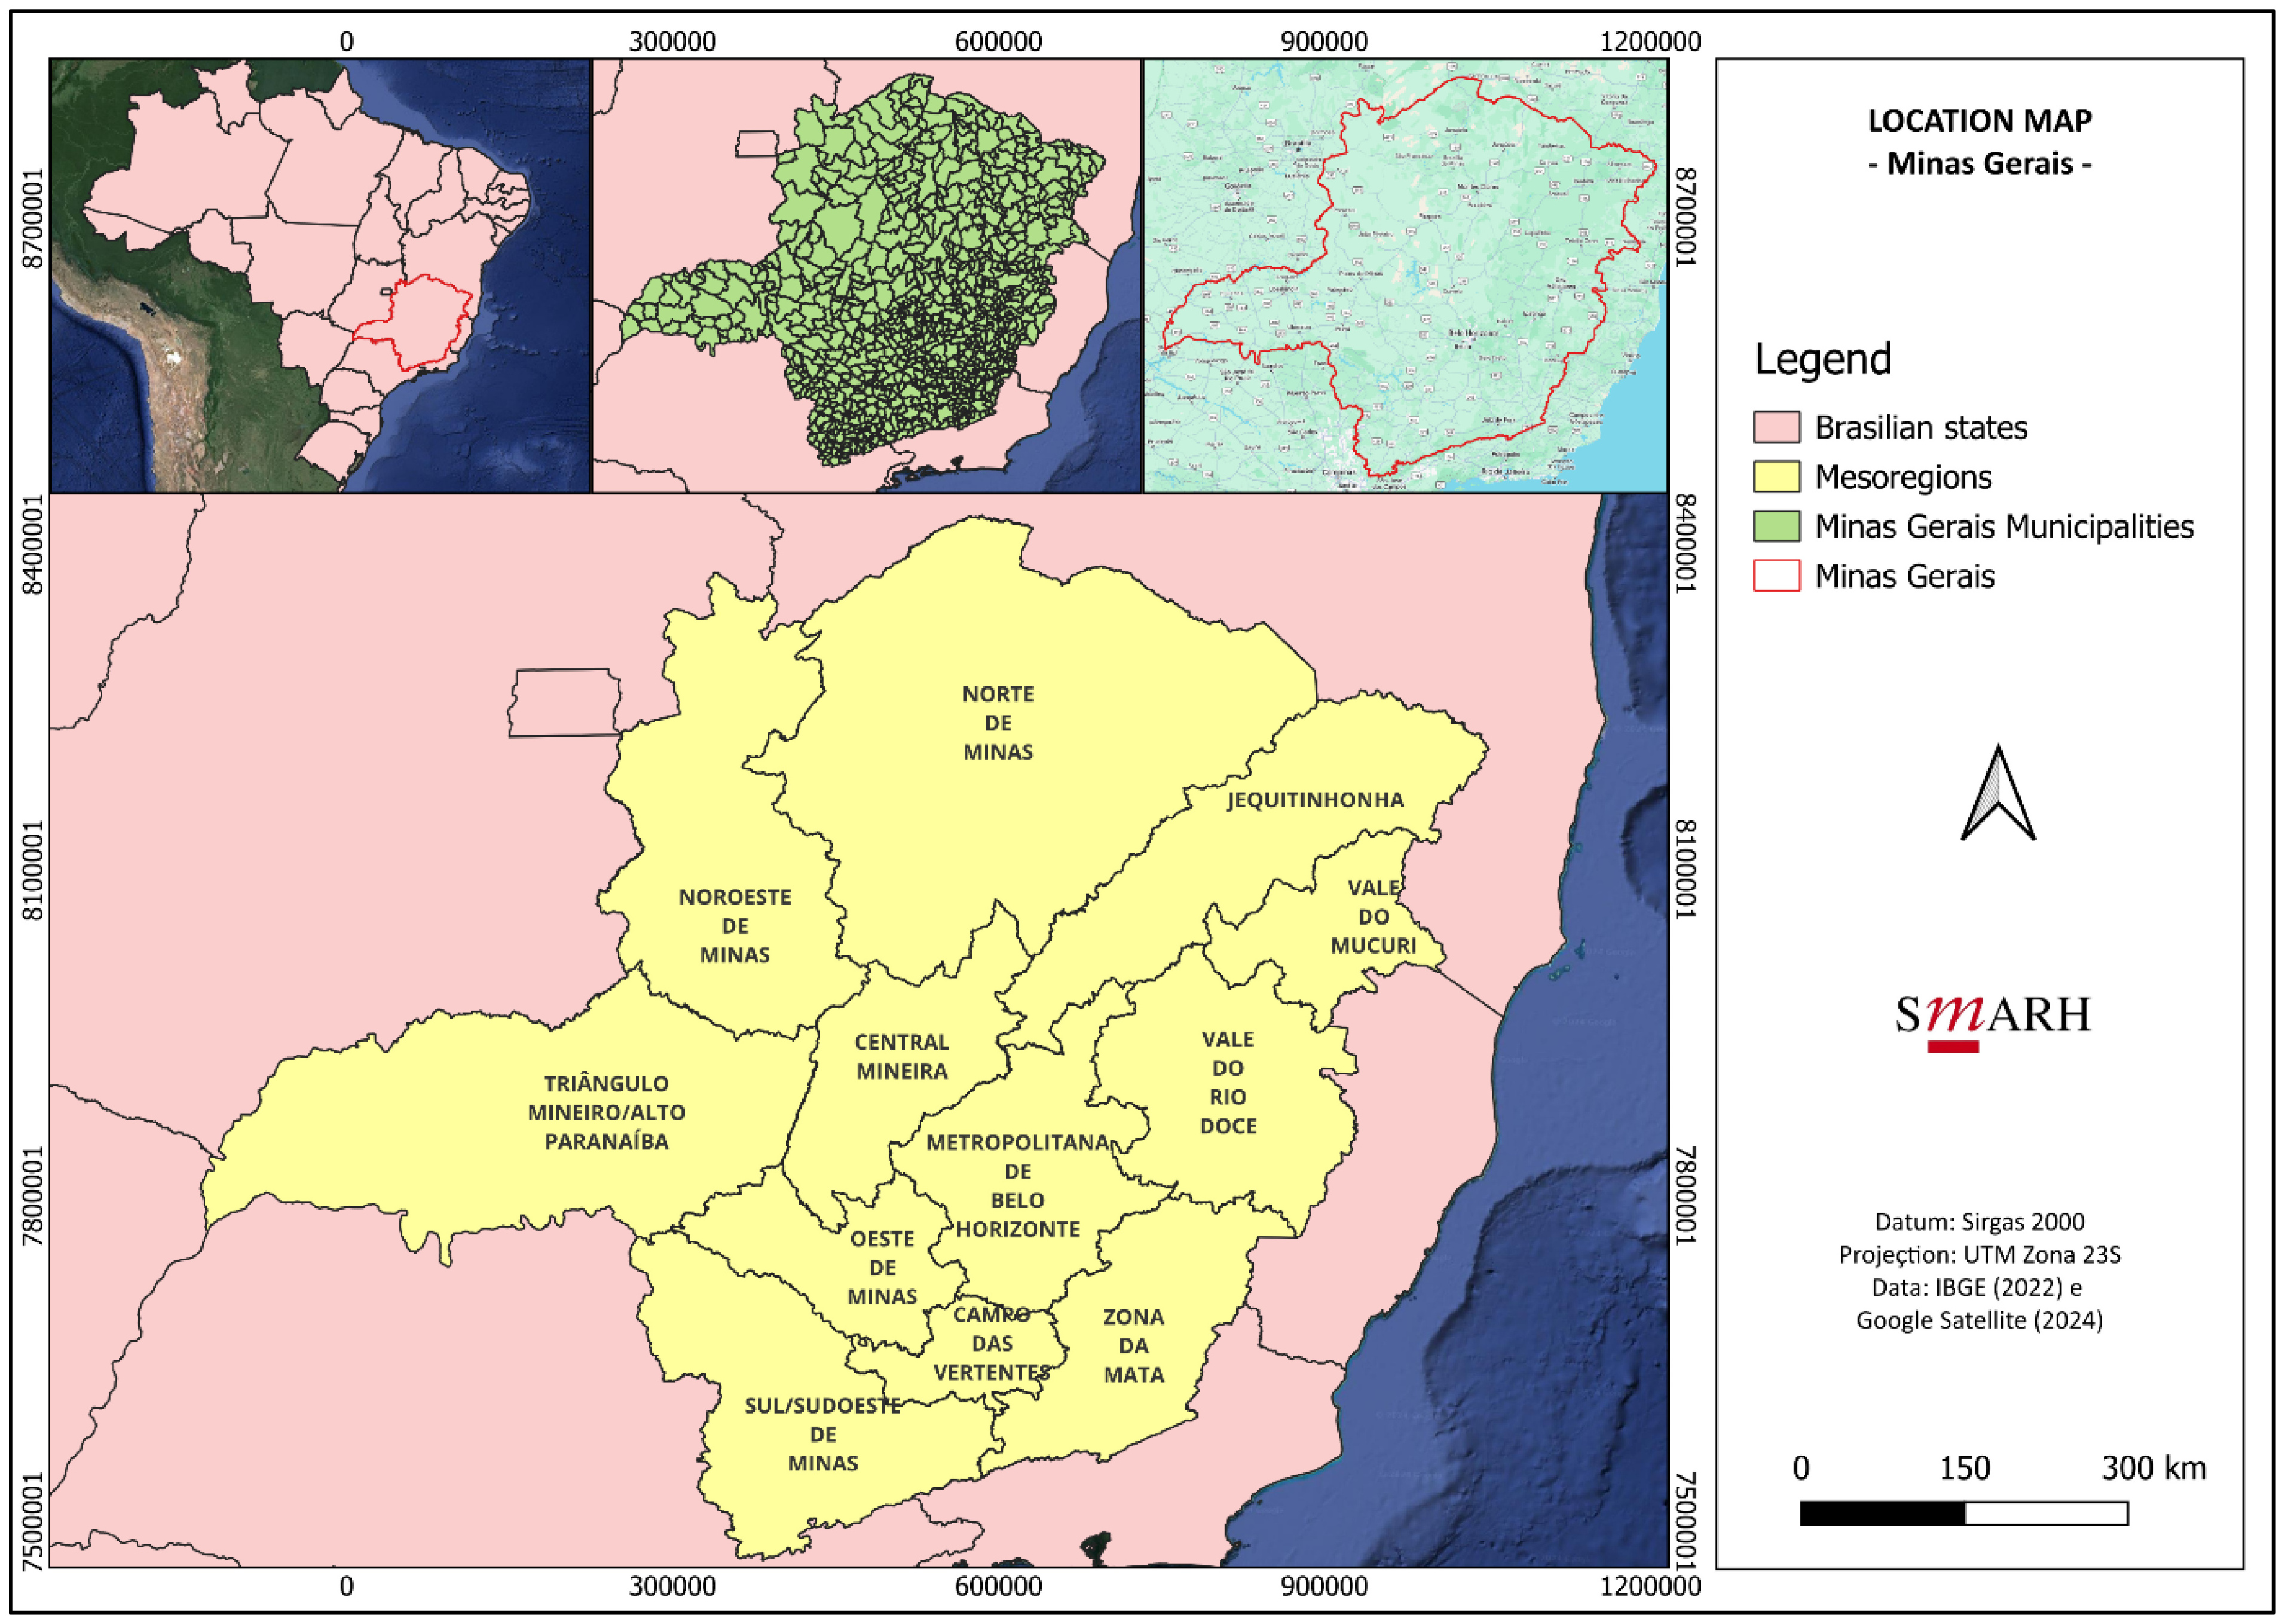
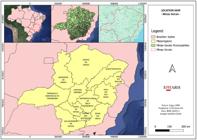
Located in the Southeast region of Brazil, the state covers an area of 586,513.983 km2 (Instituto Brasileiro de Geografia e Estatística, 2022), between latitudes 14º13’57’’ and 22º55’47’’ South and longitudes 39º51’24’’ and 51º02’56’’ West. Minas Gerais borders the states of São Paulo, Rio de Janeiro, Espírito Santo, Bahia, Goiás, and Mato Grosso do Sul, as well as the Federal District. From a hydrological perspective, the state encompasses four National Hydrographic Regions, as classified by the Instituto Mineiro de Gestão das Águas (2006) (IGAM, Minas Gerais Water Management Institute: the São Francisco Hydrographic Region, which covers 40% of the state’s area; the Paraná Hydrographic Region, with 27%; the East Atlantic Hydrographic Region, with 17%; and the Southeast Atlantic Hydrographic Region, covering the remaining 16%. The Instituto Brasileiro de Geografia e Estatística (IBGE, Brazilian Institute of Geography and Statistics) (Instituto Brasileiro de Geografia e Estatística, 2022) provided the official geographic and cartographic data. Figure 1 shows the geographical location of the study area.
METHODOLOGY
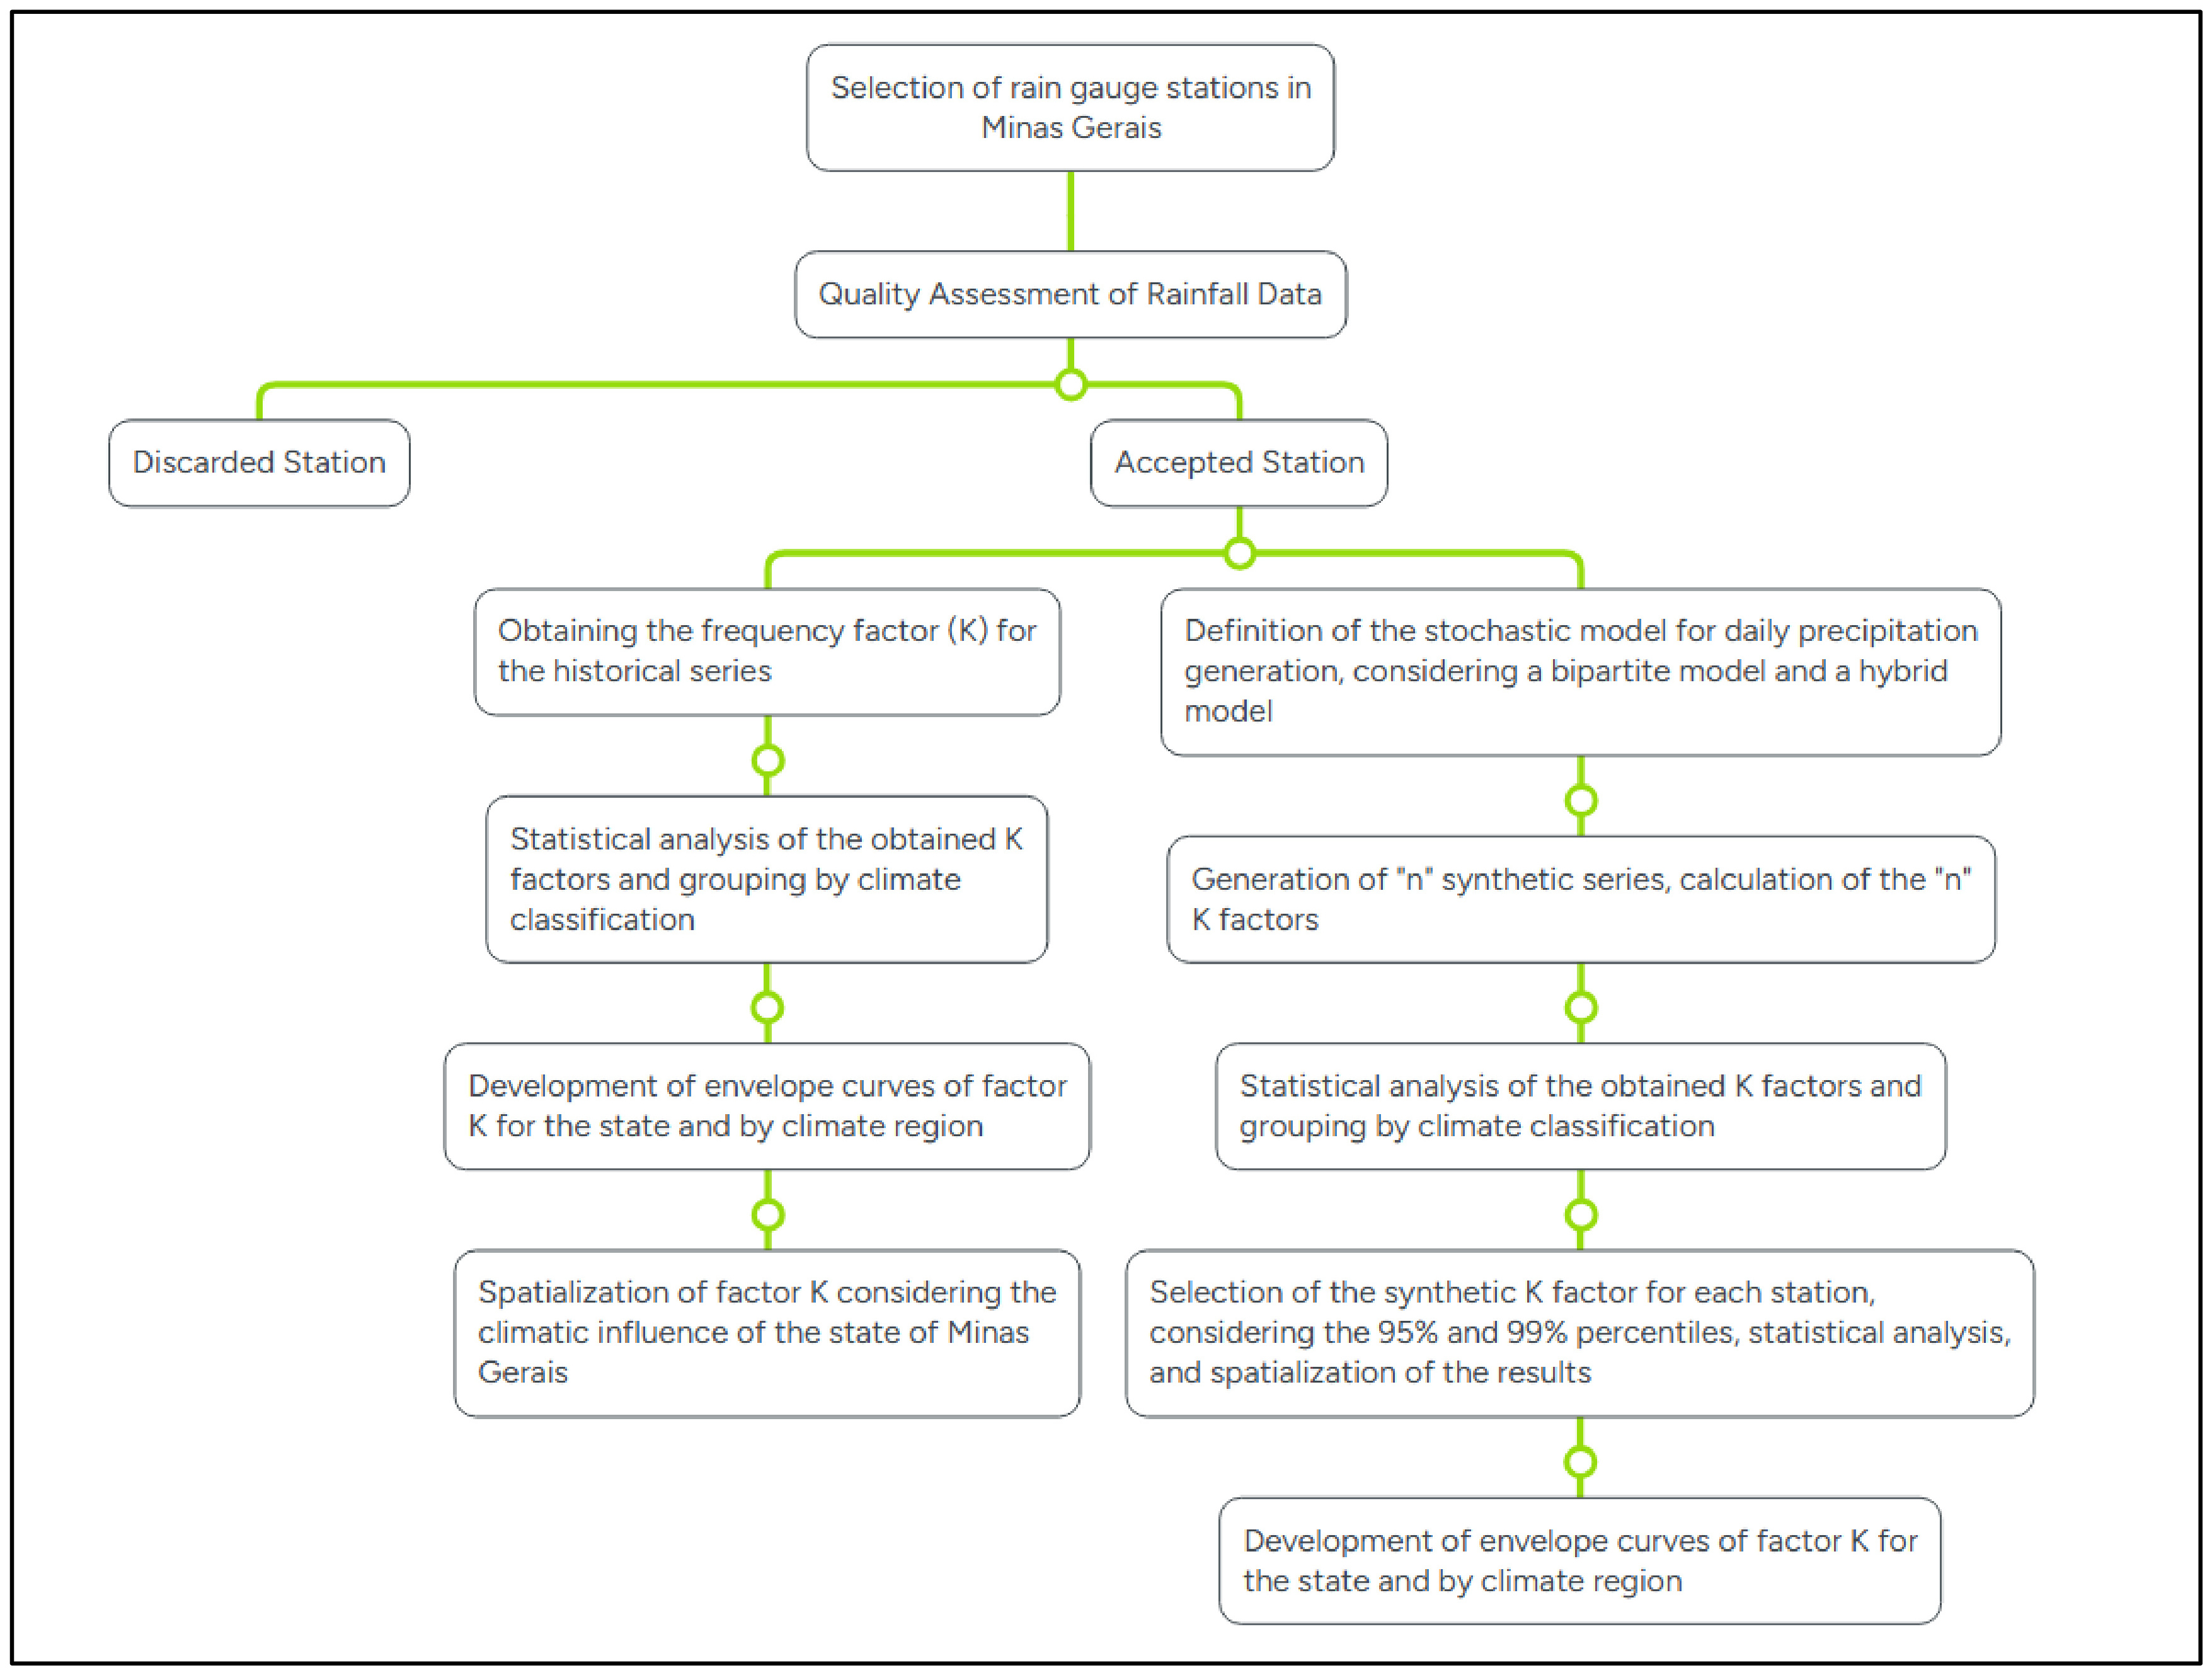
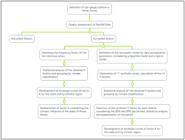
The methodology of this study was structured into three main stages: (i) data selection, (ii) envelope curves for frequency factors from historical series, and (iii) envelope curves for frequency factors from synthetic precipitation series.
Data selection
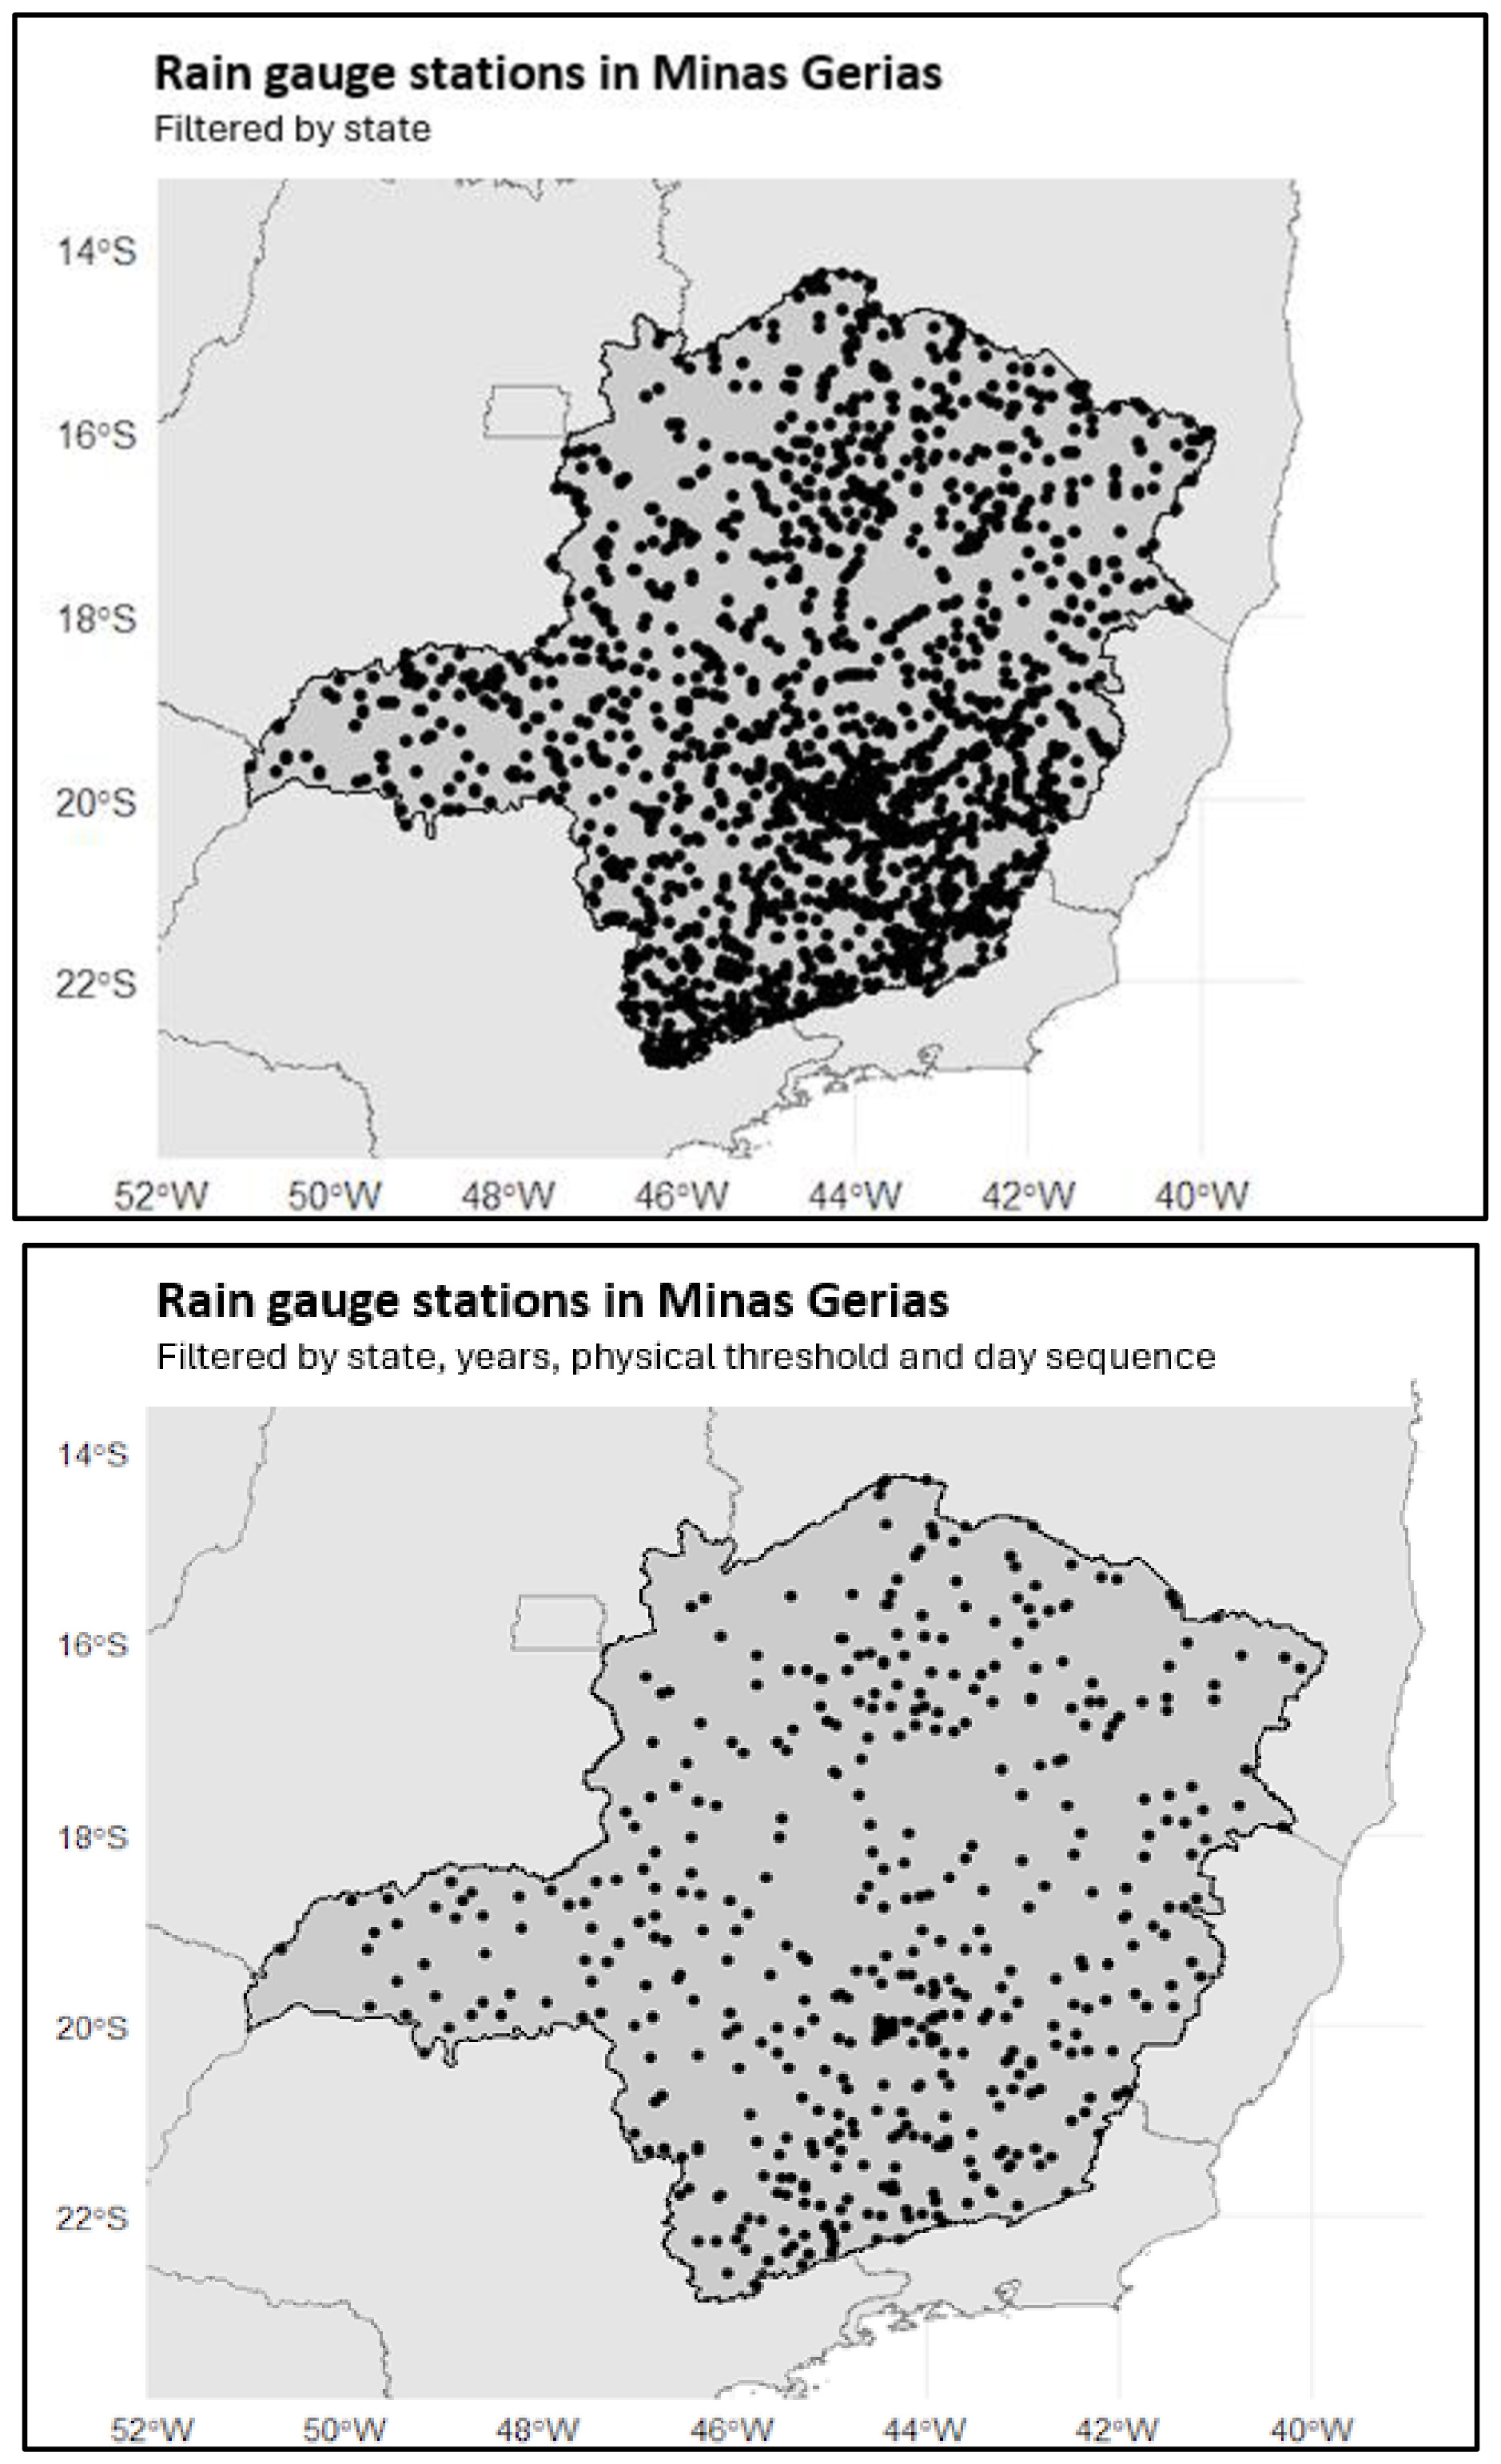
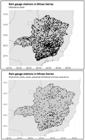
Rainfall data from the HidroWeb/SNIRH system (Sistema Nacional de Informações sobre Recursos Hídricos) were used to represent the entire state of Minas Gerais. A preliminary geographic screening identified 2,415 pluviometric stations located within the administrative boundaries of the state; however, many of these were deactivated or contained short and inconsistent records. To ensure adequate temporal representativeness, only stations with at least 30 years of valid data were initially retained. Subsequently, the quality-control guidelines proposed by Llabrés-Brustenga et al. (2019) were applied, involving verification of the physical plausibility of precipitation values and the identification of inconsistencies associated with measurement or data-recording errors.
The first quality-control step consisted of verifying the physical plausibility of extreme daily rainfall values. As an upper limit, the event recorded in Passa Quatro/MG on January 3, 2000 with 322.6 mm in one day (Pinheiro, 2011) was adopted. After applying this threshold, 16 stations presented values above this limit (01443000, 01541002, 01643001, 01647008, 01845013, 01845027, 01942032, 01943000, 01943003, 01945004, 02042024, 02143015, 02144003, 02145033, 02244065, and 02246057). Each of these cases underwent an individual assessment, which revealed that the anomalous values were mostly associated with errors or with accumulated precipitation measured after several days and registered on a single date. Once these inconsistencies were corrected, the number of valid stations was reduced to 523.
A second verification was then performed to identify artificial repetition patterns, a common issue in manual rainfall measurements. To detect such inconsistencies, a criterion was applied in which series presenting more than three consecutive identical values greater than 0.2 mm were flagged as unreliable. This step allowed the identification and removal of additional series affected by systematic measurement failures or automatic filling. After this final filtering stage, 481 stations met all quality requirements and were considered suitable for analysis, resulting in a total of 26,321 station-years of accumulated historical data.
Figure 2 presents the results of the data selection.
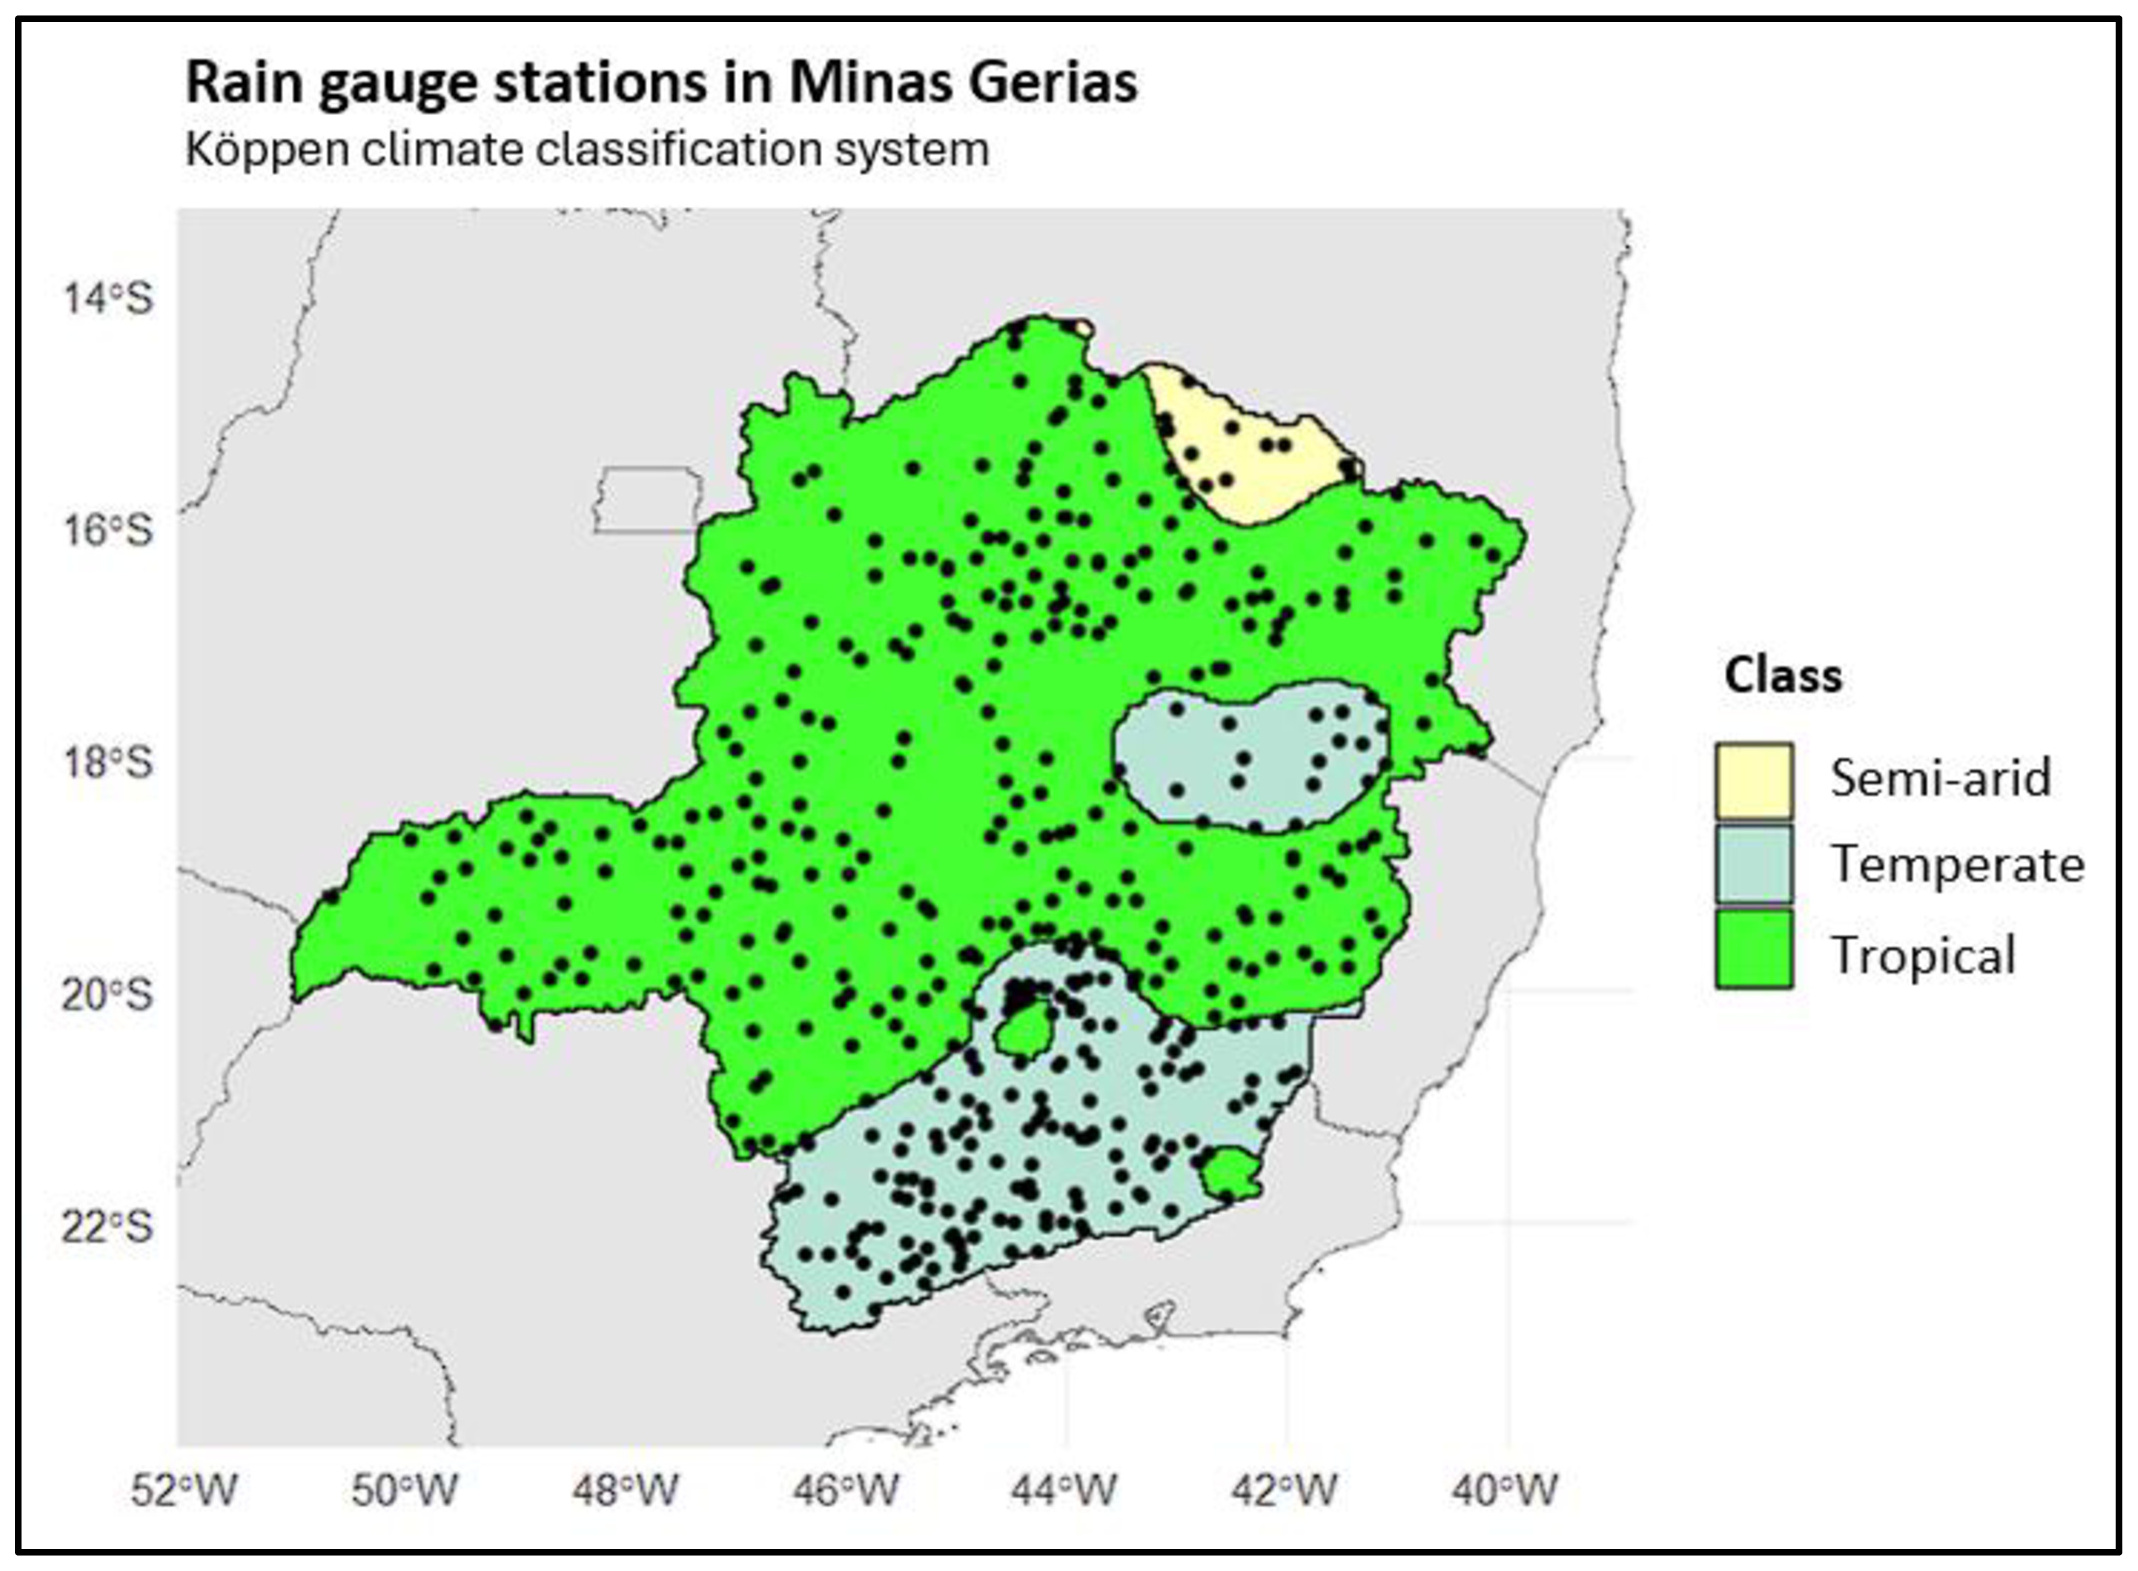
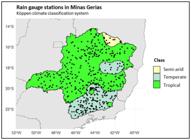
The climatic classification of the stations was carried out according to the Köppen-Geiger system (Martins et al., 2018). The results indicated 15 stations in semi-arid regions (BSh and BWh), 186 in temperate climates (Cwa and Cwb), and 280 in tropical climates (Aw). The classification is detailed in Figure 3.
Frequency factor envelope – Historical series
The Hershfield (1965) method was applied for the calculation of the frequency factor (K), defined as in (1) for an annual maximum series:
where corresponds to the highest value of the annual maximum series, is the mean of the series excluding the maximum value, and is the standard deviation of the same series.
The stations were grouped by climatic zones according to the Köppen-Geiger classification (Martins et al., 2018), reorganized into three categories: semi-arid (BSh/BWh), tropical (Aw), and temperate (Cwa/Cwb). Subsequently, envelope curves for the frequency factors were generated following the approach of Sarkar and Maity (2020), which combines a constant plateau with an exponential curve, allowing all observed frequency factors to be encompassed while simultaneously preventing excessively high values in low-precipitation regions. For this study, the Sarkar and Maity method was slightly modified: the plateau of the curve ranges from the lowest mean among the enveloped stations to the transition for the exponential segment, which extends to the highest mean among the stations, thereby covering only the interval effectively represented by the data. Spatial interpolation of the K factors was performed using the Inverse Distance Weighted (IDW) method, as described by Mello et al. (2003).
Frequency factor envelope – Synthetic series
Synthetic series generation models
To incorporate the probabilistic nature into the PMP estimation, synthetic precipitation series were generated. The selection of the most suitable model was carried out through a comparative statistical analysis with historical data, considering annual and monthly means, as well as maximum values, evaluated using metrics such as RMSE and MAE (Carmo and Silva, 2023).
Two models were tested:
-
Bipartite Model – Adapted from Wilks (1998), this model generates synthetic daily precipitation series by considering both rainfall occurrence and intensity. Occurrence is simulated using a first-order, two-state Markov chain (dry or wet day), where the probability of a wet day depends on the state of the previous day, capturing the persistence of wet or dry periods. The amount of rainfall on wet days is generated from a gamma distribution fitted individually for each month, ensuring accurate representation of seasonal precipitation variations; and
-
Hybrid Model – Adapted from Costa (2015), the hybrid model extends the bipartite approach by distinguishing between moderate and extreme rainfall events. Daily occurrence is modeled using a three-state Markov chain (no rain, moderate rain, and extreme rain). For precipitation amounts, moderate rainfall (below the 95th percentile) is simulated using bootstrap resampling to preserve observed variability, while extreme rainfall (above the 95th percentile) is modeled parametrically using a gamma distribution fitted individually for each month.
Both the Exponential and Gamma distributions, widely employed in the literature for modeling precipitation and stochastic components of daily rainfall series (Chen and Brissette, 2014; Detzel, 2009) were evaluated, and their adherence to the observed data was verified using the Kolmogorov–Smirnov test at the 5% significance level (Naghettini and Pinto, 2007). The results indicated a clear superiority of the Gamma distribution, with approximately 91% of the stations presenting p-values greater than 0.05, compared to only 7% for the Exponential distribution. Based on this performance, the Gamma distribution was adopted for modeling daily precipitation volumes.
Generation of synthetic series and envelope curves
After selecting the most suitable model, 1,000 synthetic series with the same length as the corresponding historical series were generated for each station, from which the frequency factors were calculated using Equation 1. The 95th and 99th percentiles of the resulting K-factor distributions were extracted to represent, respectively, the 5% and 1% exceedance probabilities. This procedure aligns with recommendations from the National Academies of Sciences, Engineering, and Medicine (2024), which advocate substituting deterministic PMP limits with estimates based on extremely low exceedance probabilities. Within this framework, the adoption of the 5% and 1% exceedance percentiles provides probabilistic PMP estimates that reflect a more flexible and conceptually robust interpretation of extremes. Finally, the K factors associated with these percentiles were used to construct envelope curves for each climatic region, following a methodology analogous to that applied to the historical series. Figure 4 presents the methodological flowchart.
RESULTS AND DISCUSSION
Frequency factor envelopes of historical series
Table 1 presents the main descriptive statistics of historical data for the State of Minas Gerais as a whole and for each climatic type.
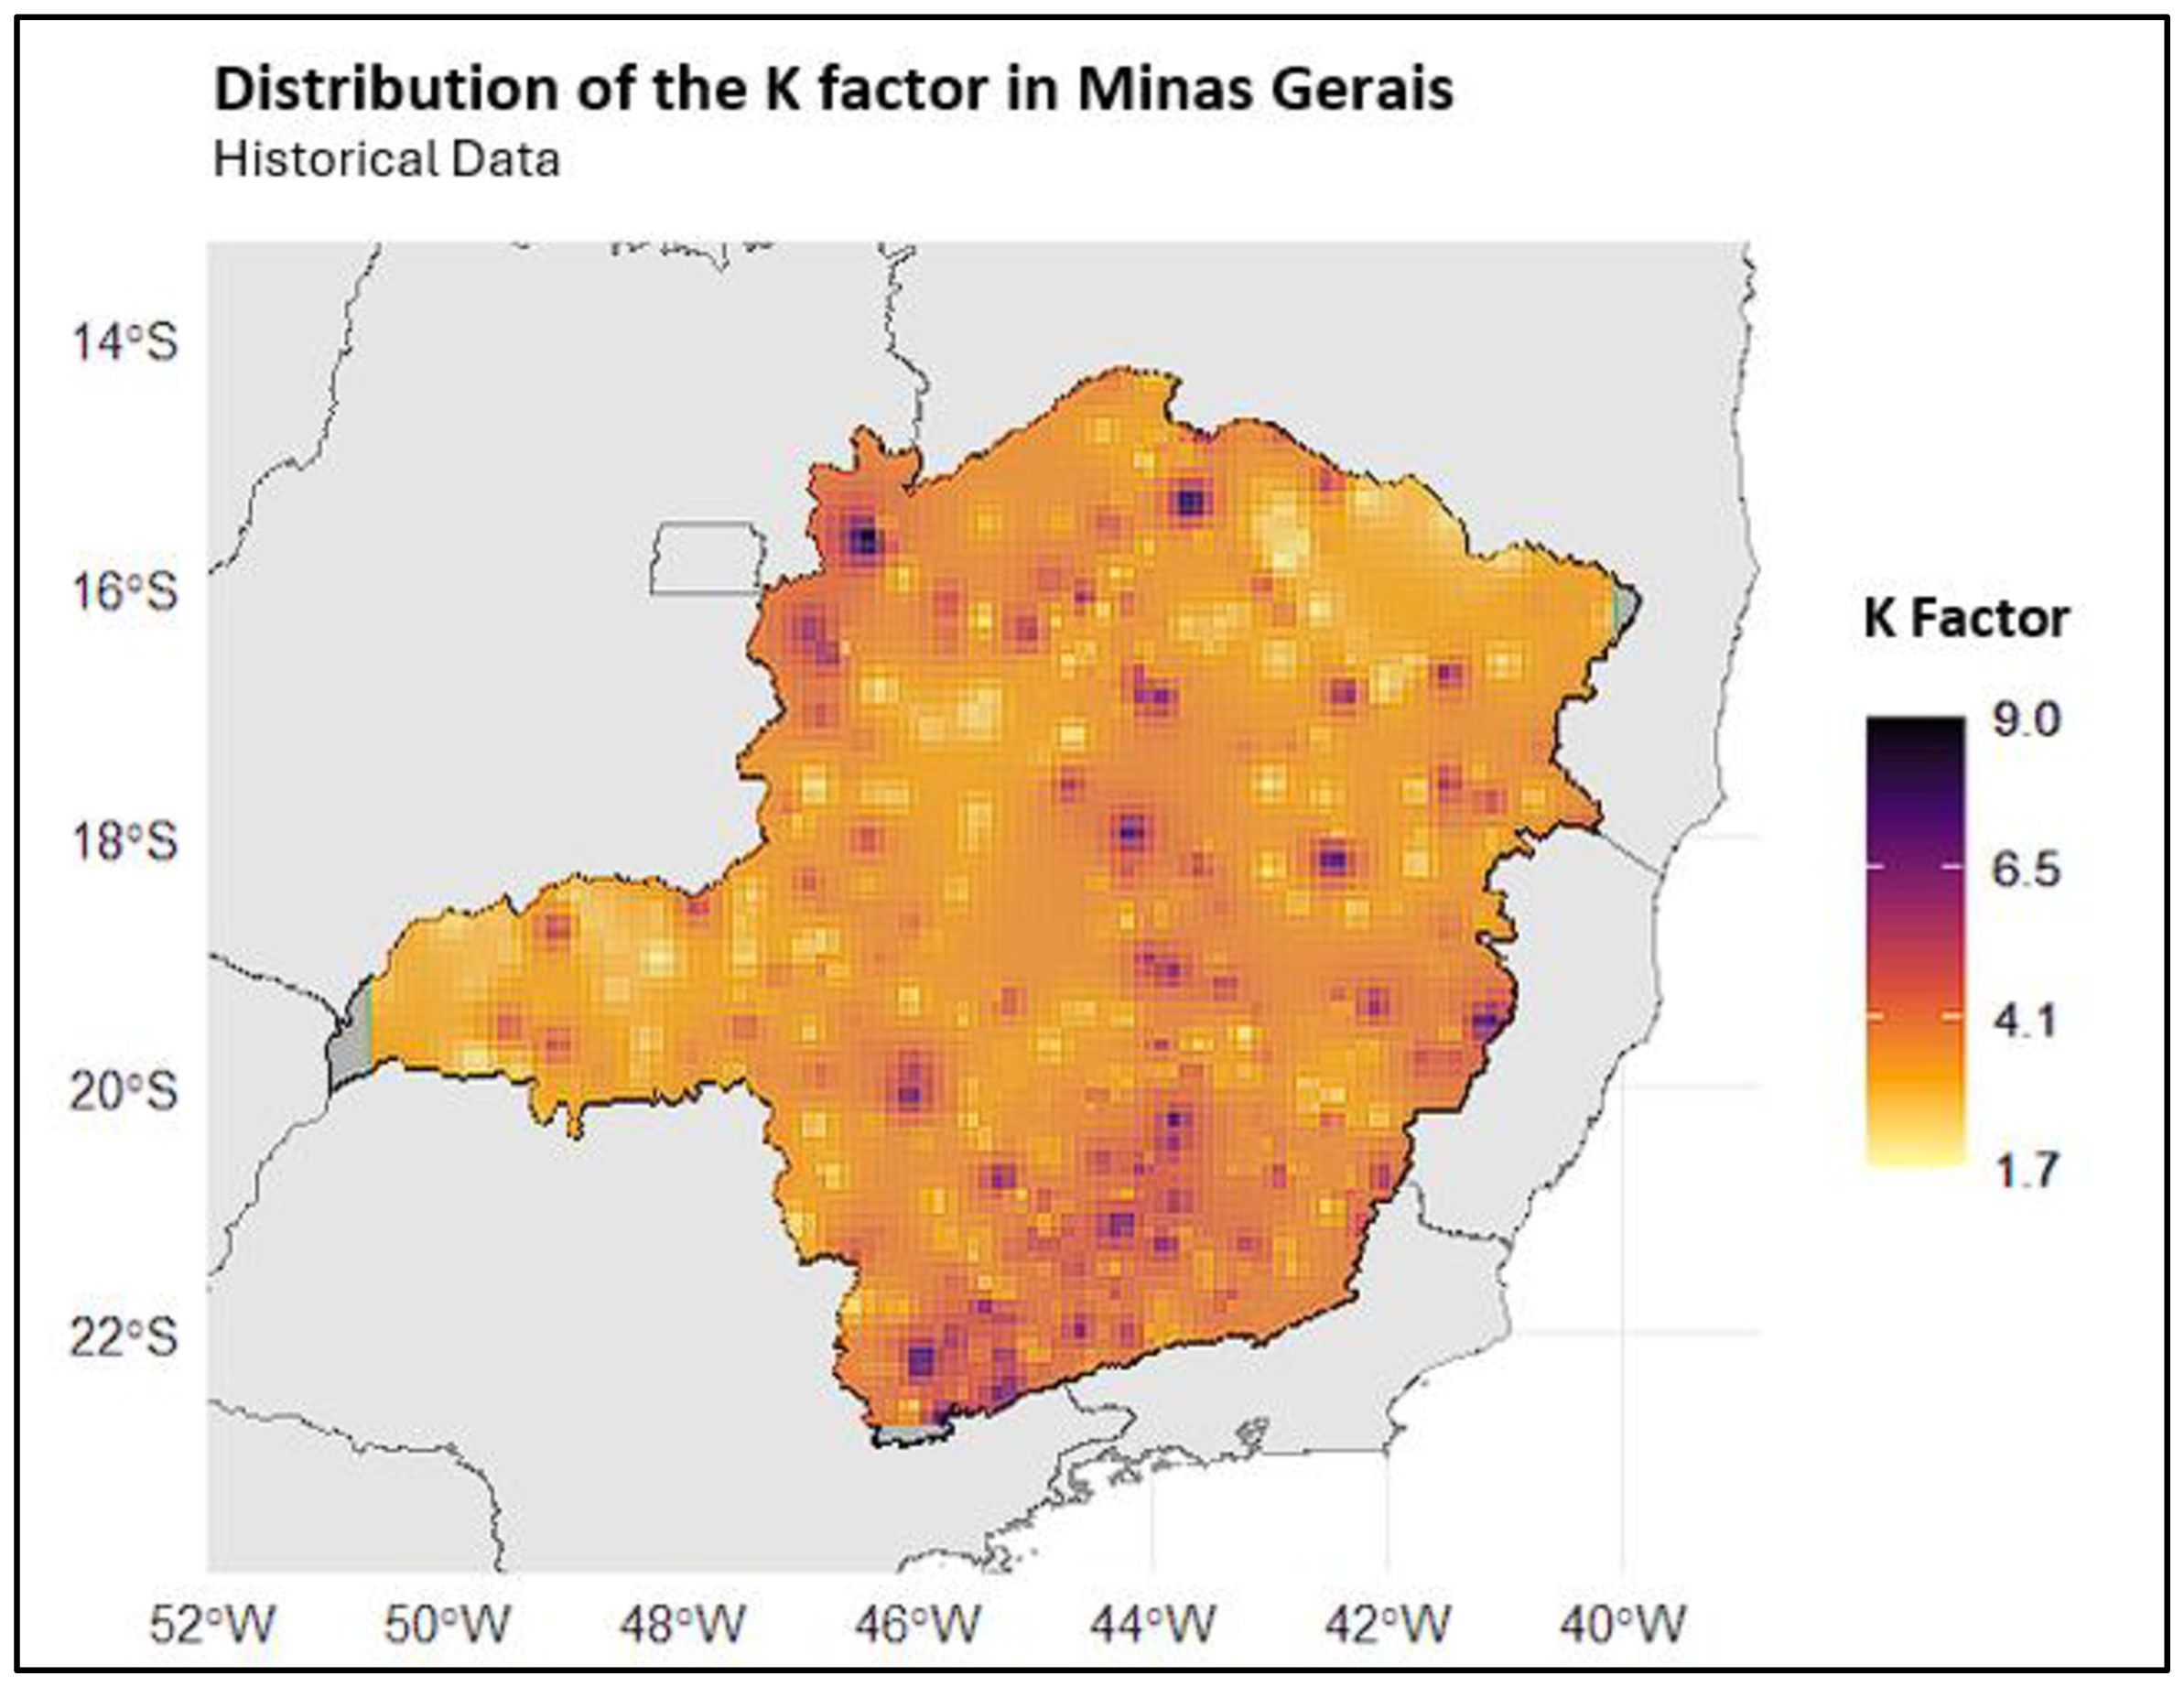
Figure 5 presents the IDW-interpolated map, which depicts the spatial distribution of the K factors across the entire state.
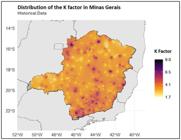
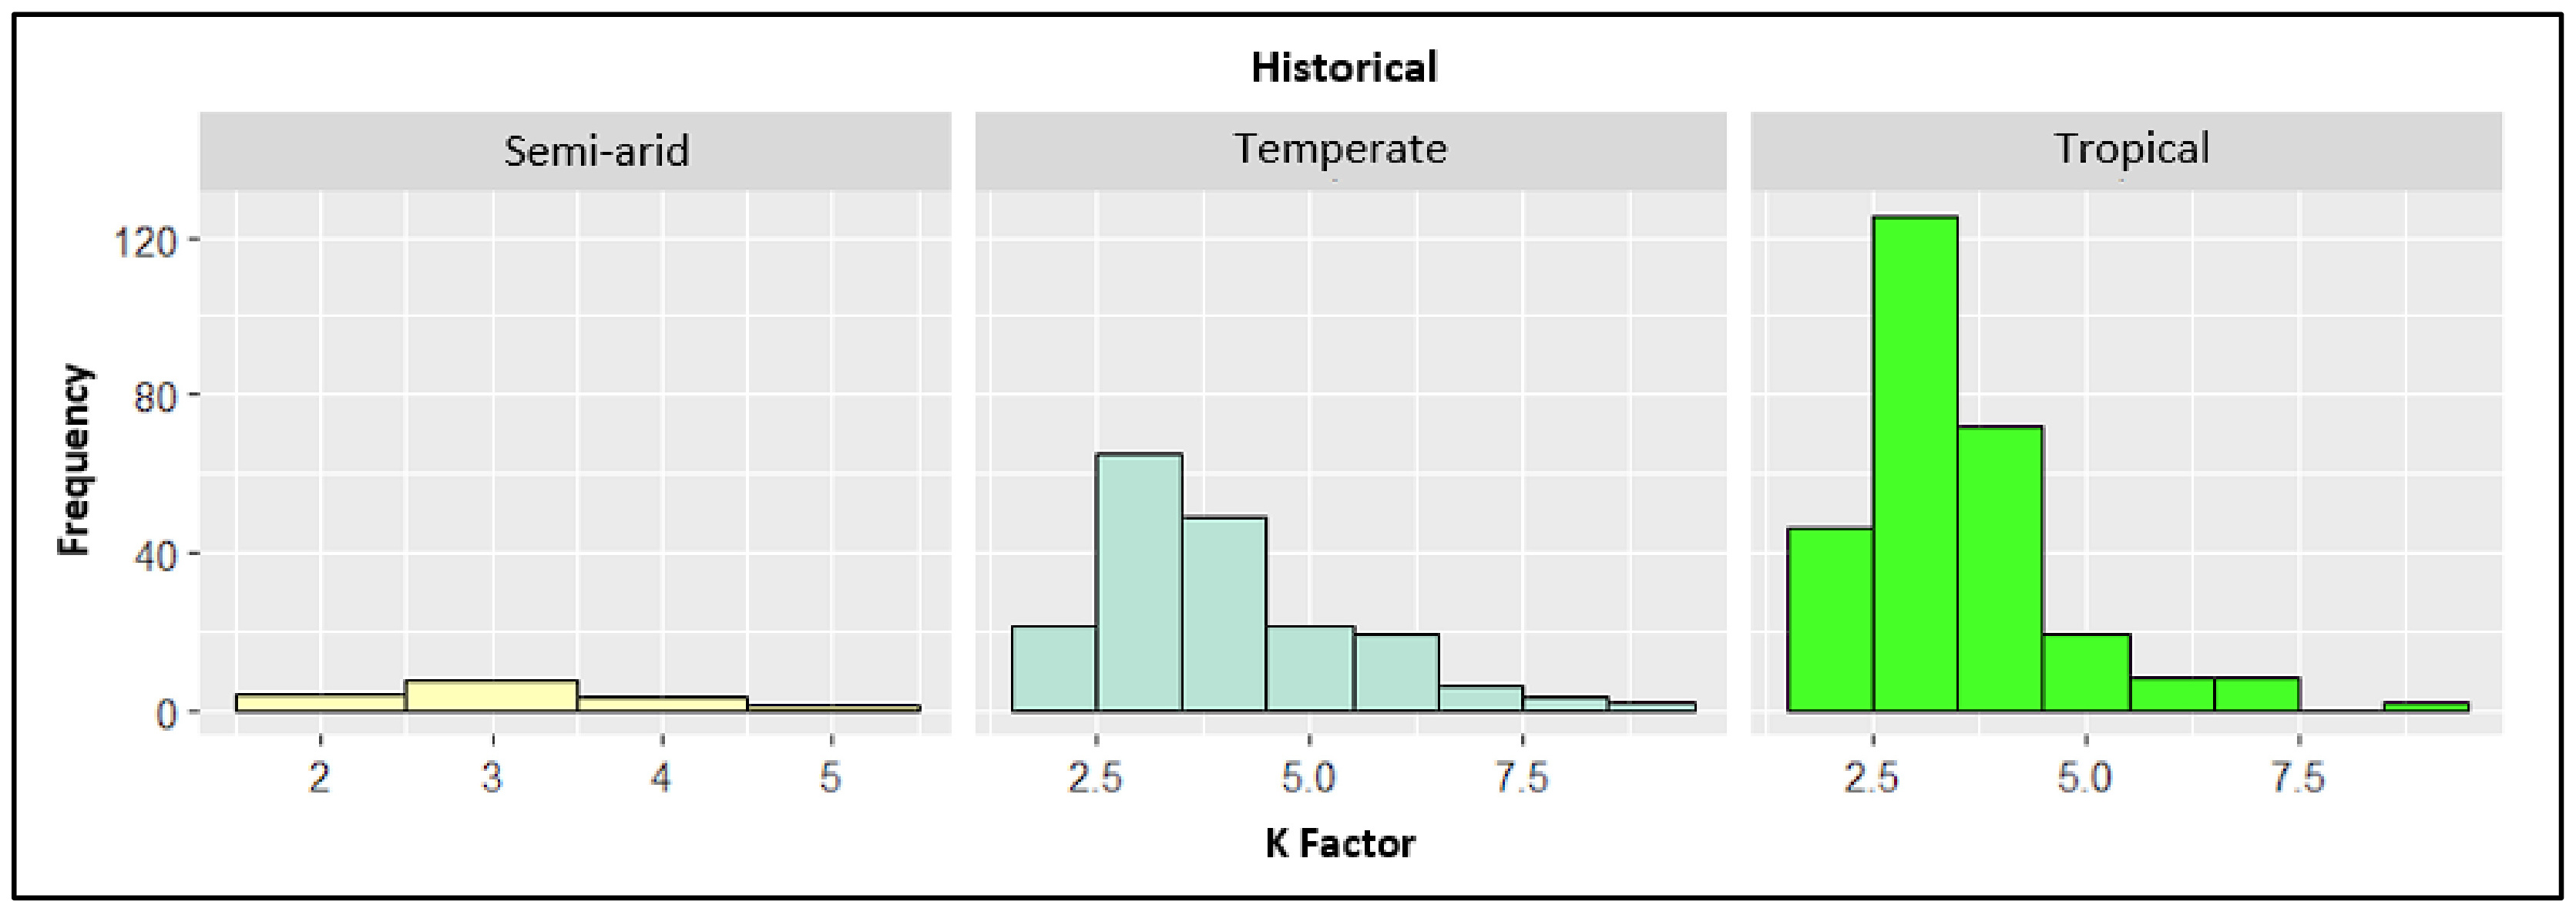
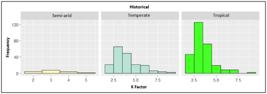
Figure 6 presents the histogram of the data by climatic type.
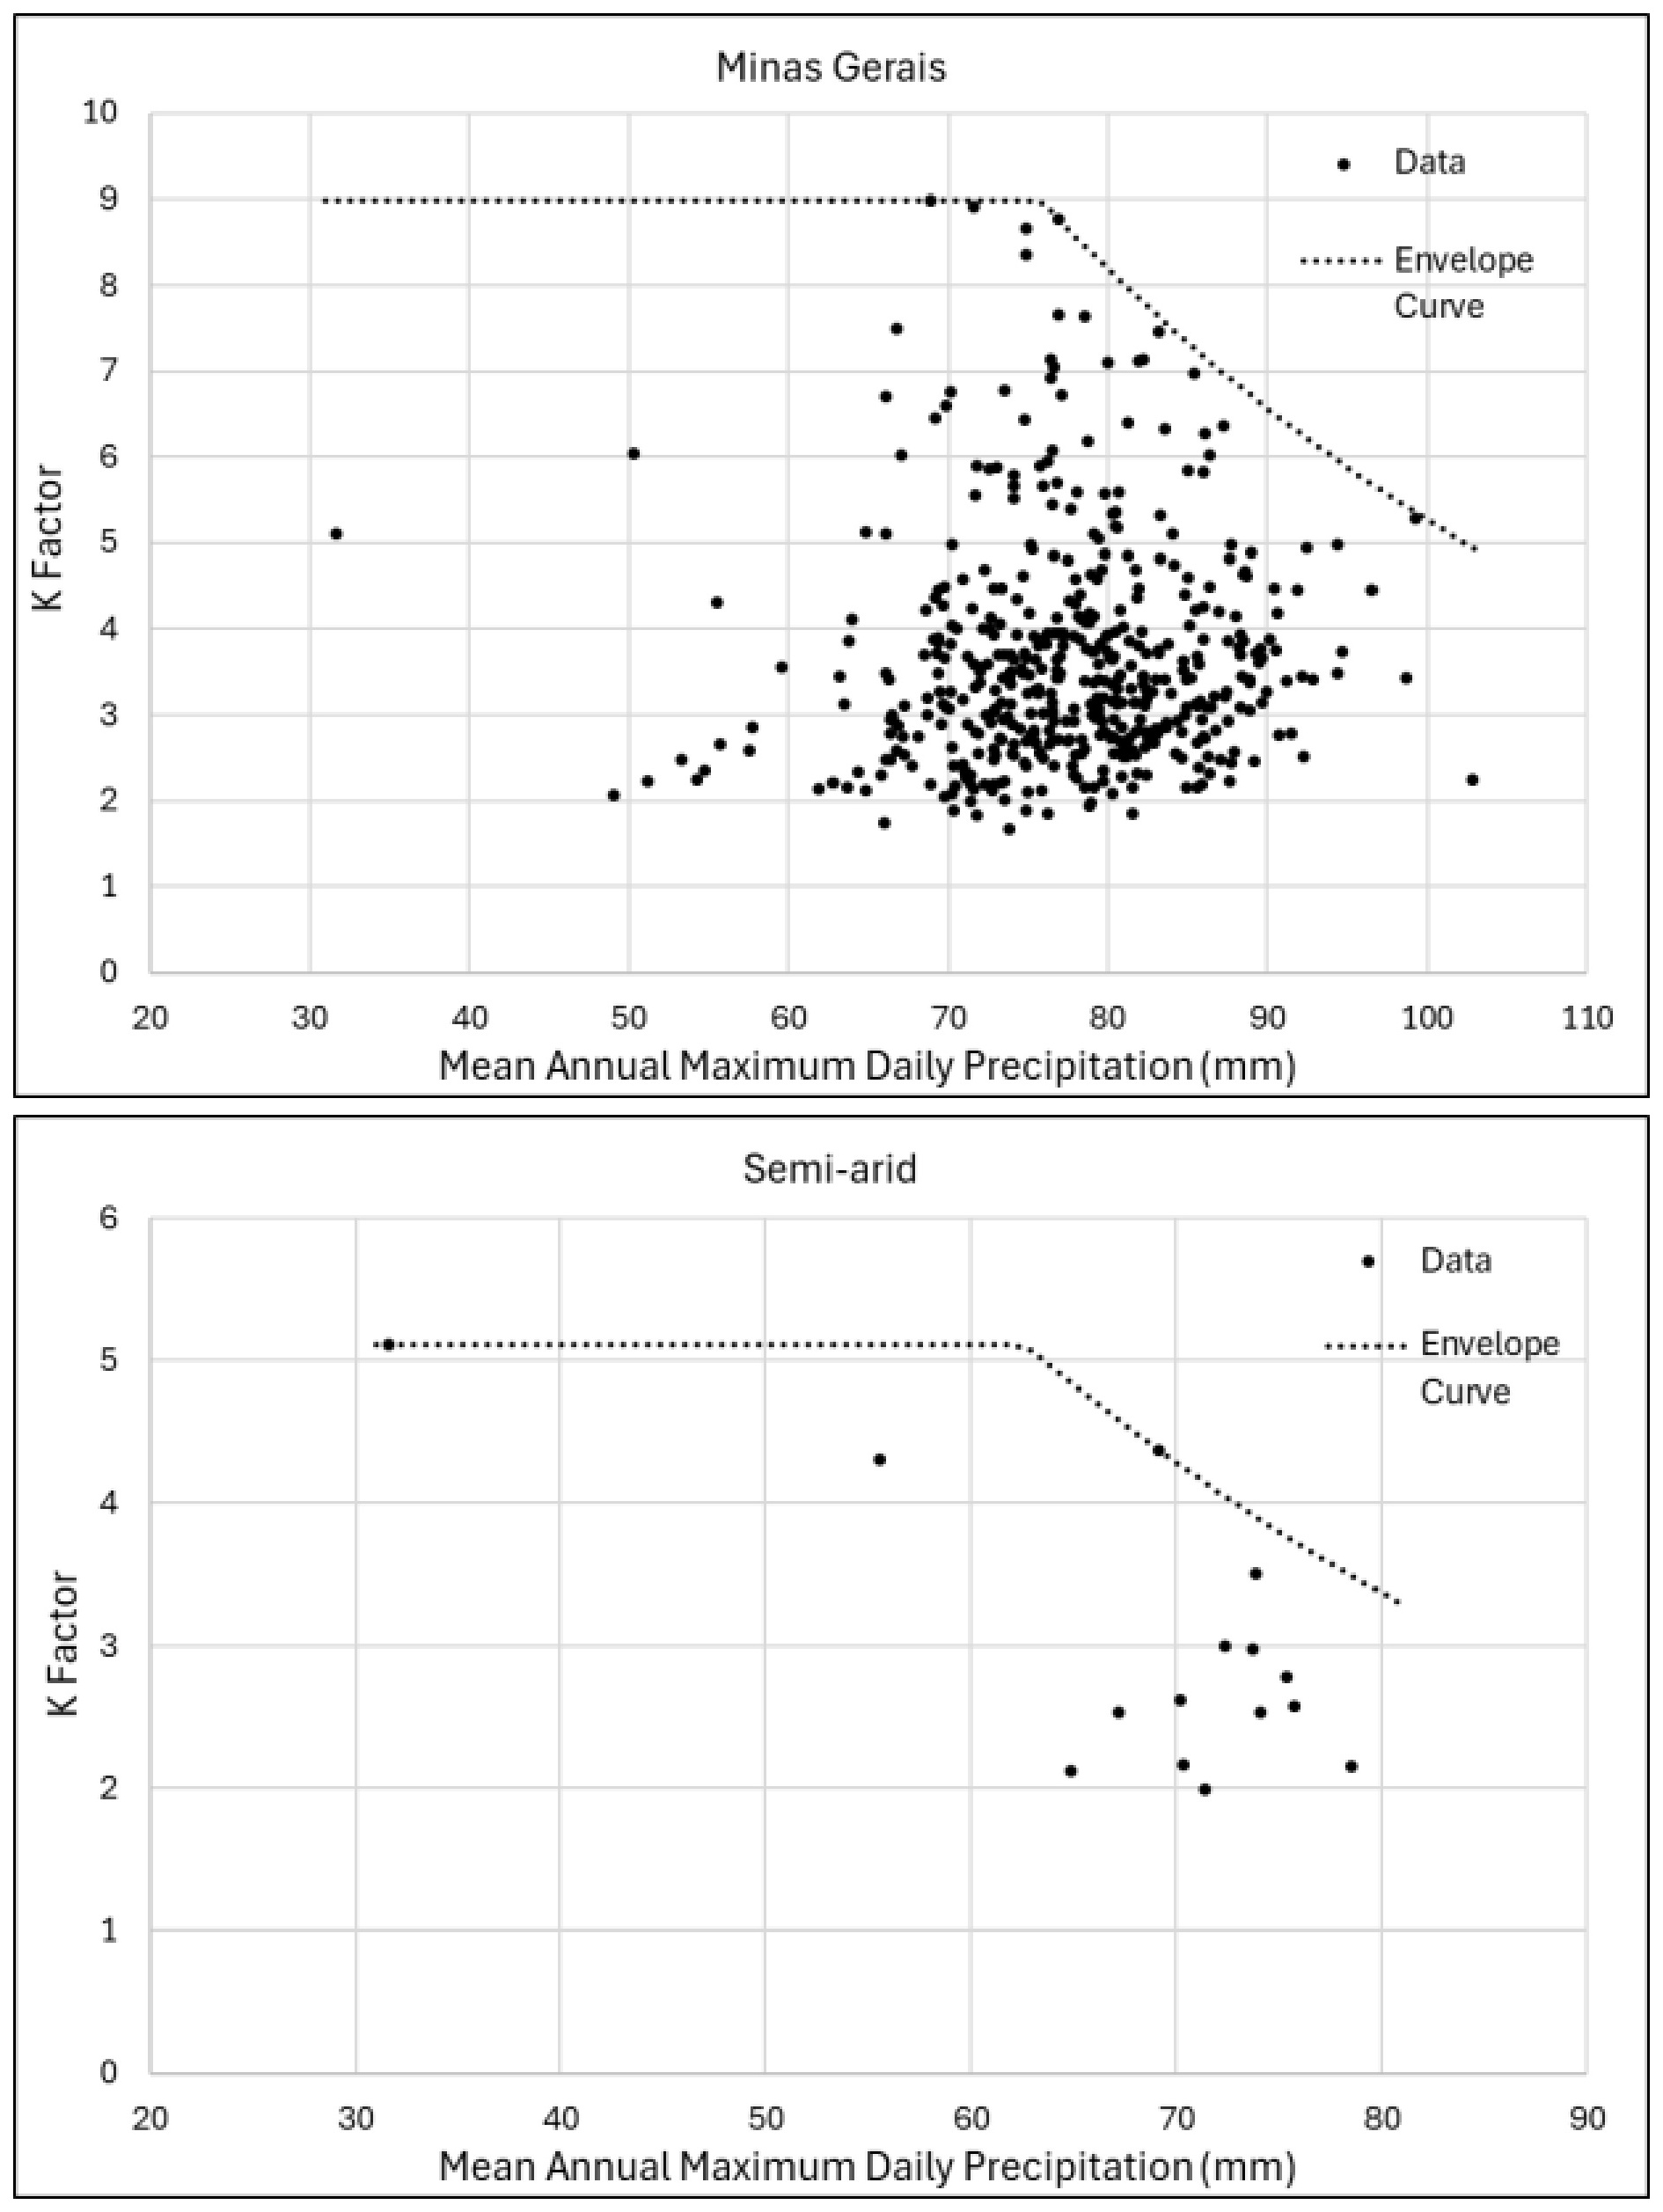
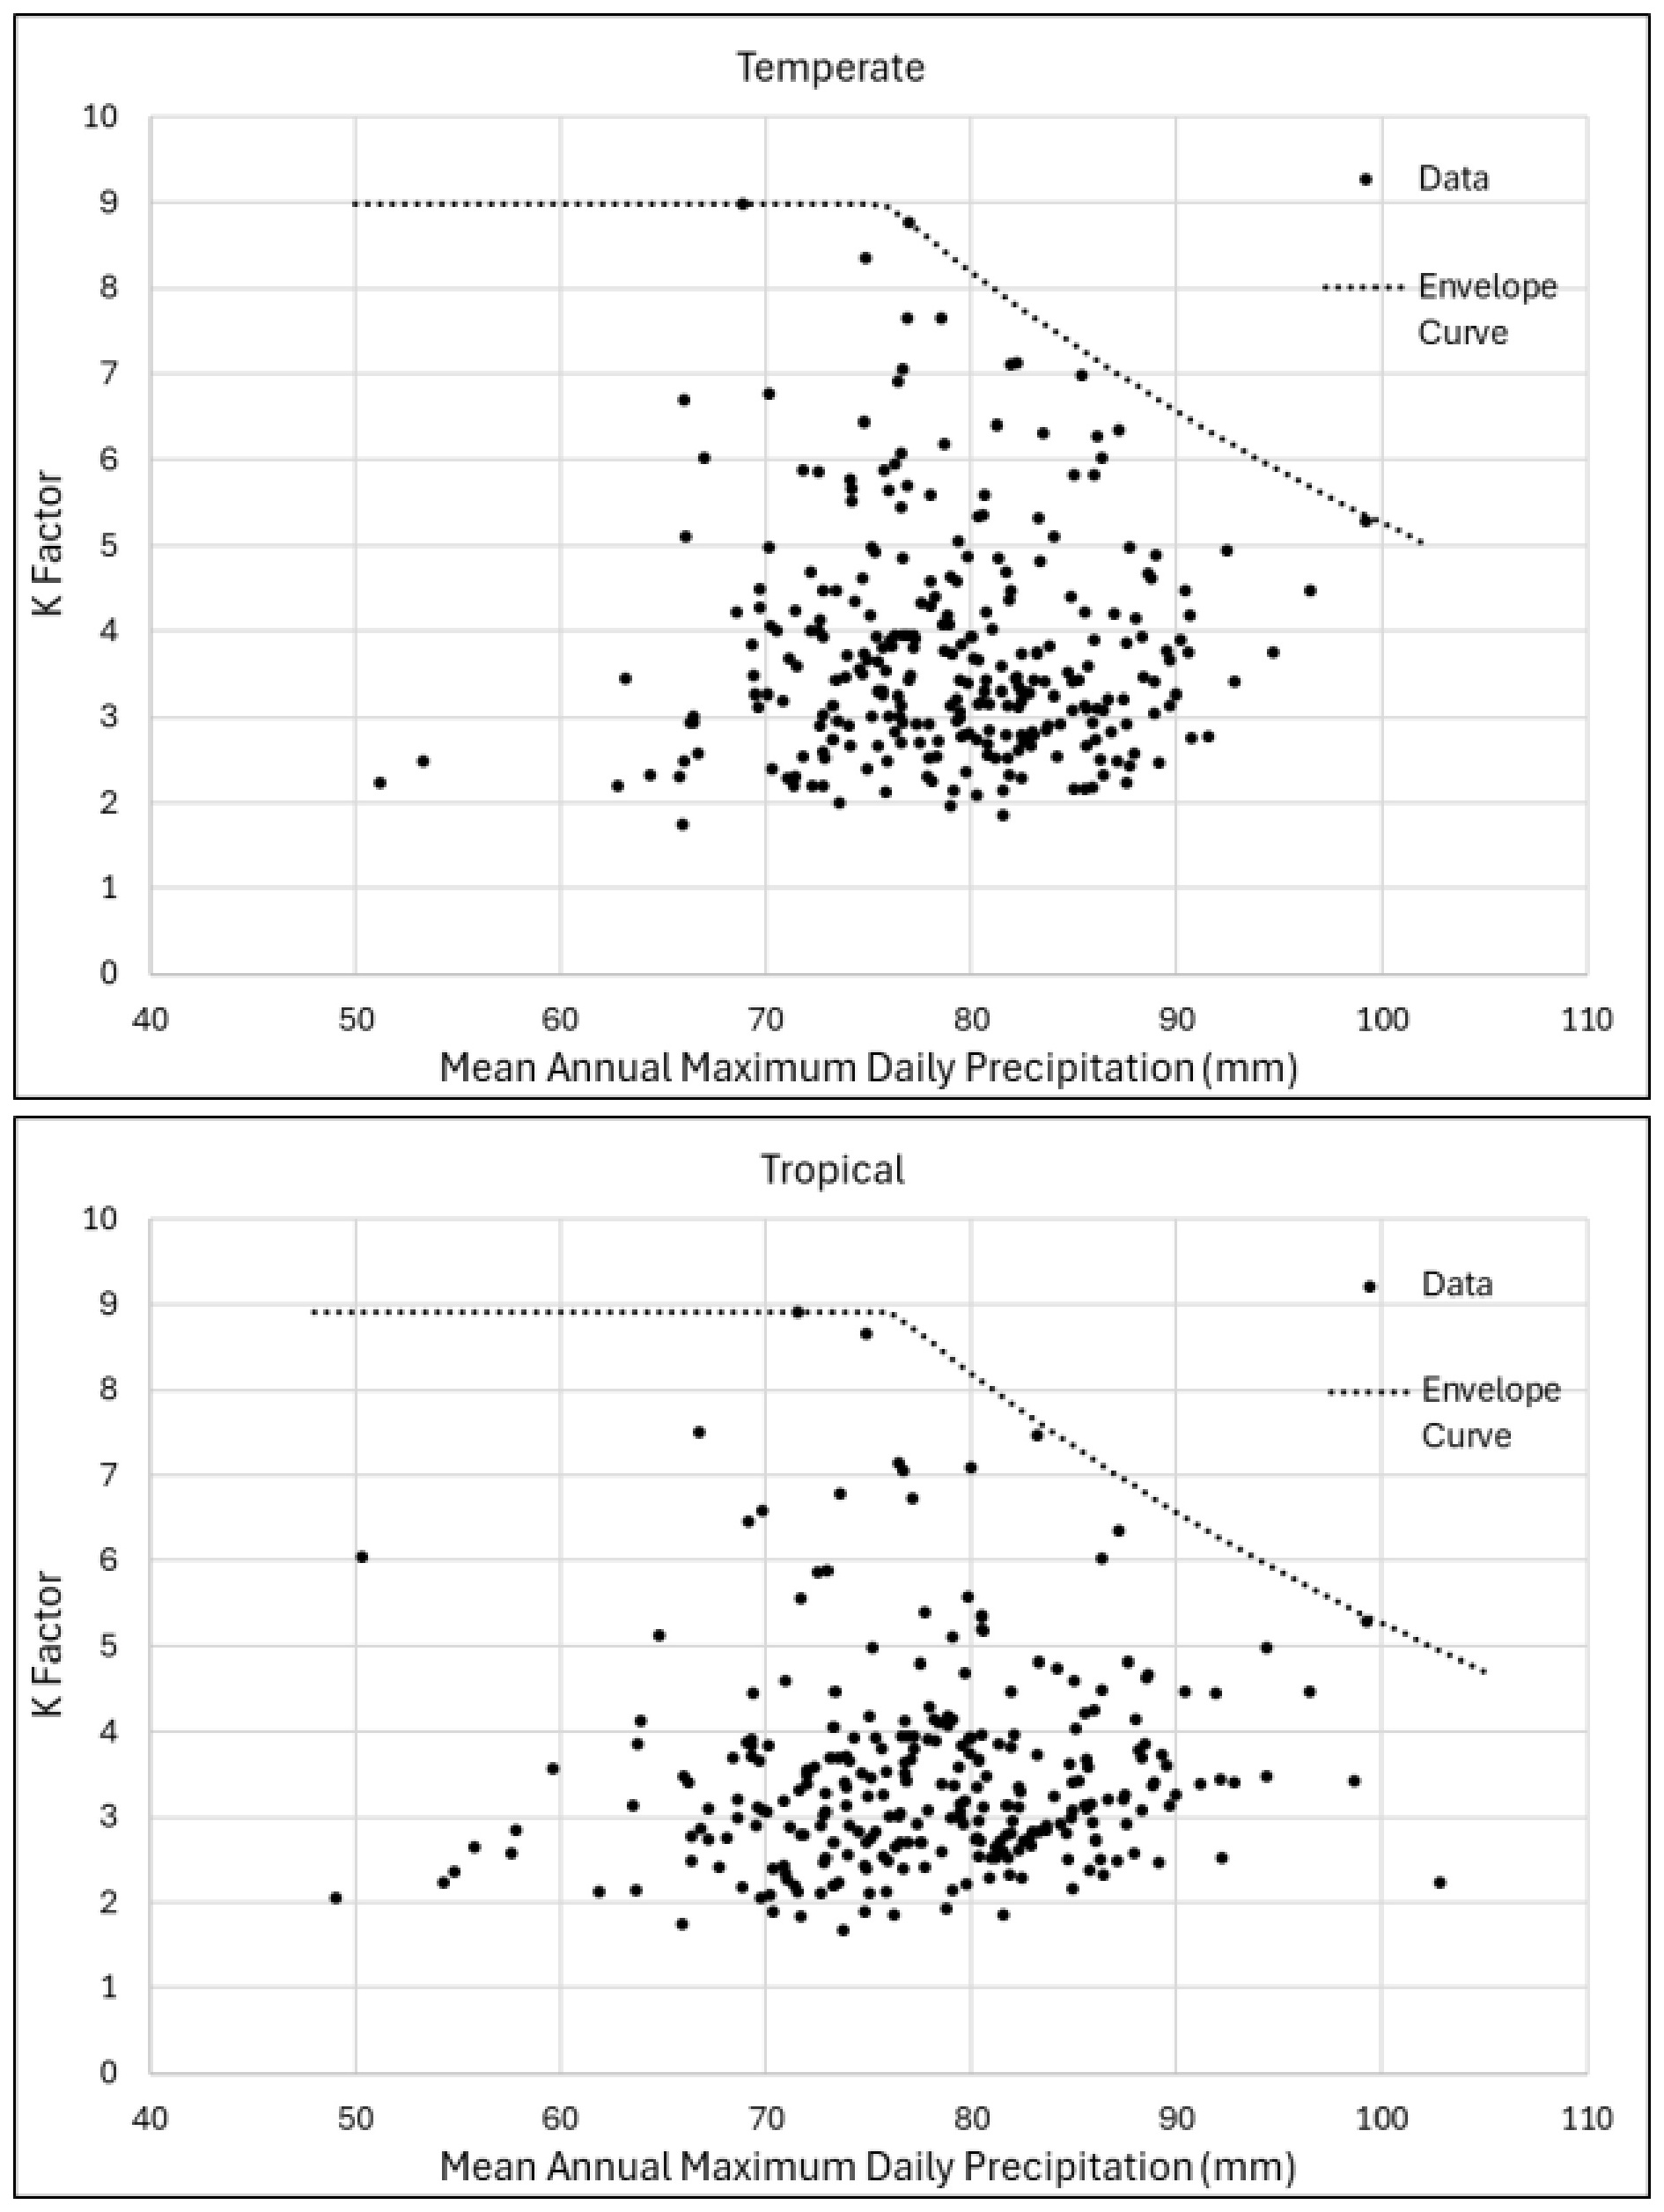
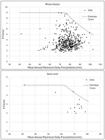
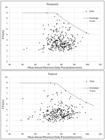
Based on the selected pluviometric stations and their climatic classification, regional envelopes of the frequency factors were developed for the state as a whole and for each climatic region. The results are presented in Figure 7 and Figure 8.
The database selection revealed that, out of the 2,415 rain gauge stations registered in the HidroWeb system in Minas Gerais, only 481 met the established quality and completeness criteria. This represents approximately 20% of the total, which was sufficient to ensure spatial coverage and climatic representativeness. Among the selected stations, 15 are located in semi-arid regions, 186 in temperate climates, and 280 in tropical climates, reflecting the limited data coverage for the semiarid zone in the state.
The analysis of the results reveals a wide variability in the K factor across the evaluated stations, with values ranging from 1.68 to 8.98, reflecting the heterogeneity of pluviometric conditions in Minas Gerais. In the semi-arid climate, the frequency factors exhibit the lowest magnitudes, with an average of 2.98 and a maximum value of 5.11, in addition to the lowest mean annual maximum daily precipitation. It is important to note that the semi-arid region is characterized by a limited number of pluviometric stations, which constrains the derivation of categorical conclusions. In this context, complementary analyses incorporating regions with arid climatic behavior may be relevant to corroborate and reinforce the observed patterns.
In the temperate and tropical climates, the K factor values are higher and display similar patterns. The temperate climate shows the highest mean (3.97) and the highest observed value (8.98), while the tropical climate presents a mean of 3.47 and a maximum of 8.92. In both cases, the histograms exhibit right-skewed distributions, indicating a greater concentration of values between 2.5 and 4.5, although significantly higher values occur with lower frequency.
In summary, K factors are lower in the semi-arid region and higher in the temperate and tropical climates, which exhibit similar statistical behavior, though the temperate climate presents slightly higher values. It is worth noting that the results obtained for the historical series revealed a maximum K factor very close to those reported in other studies. Martins (2024), analyzing the Barcarena/PA region, identified a maximum K factor of 8.4; Barbosa et al. (2023), in a nationwide study of Brazil, based on INMET data, reported a K factor of 8.8; Sugai (1989), assessing southern Brazil, obtained a maximum historical K of 9.0; and, finally, Burger (2014), in Paraná state, observed a maximum historical K of 10.17.
This proximity may indicate a potential agreement regarding the maximum value of the K factor derived from historical precipitation records in Brazil. However, it is important to emphasize that such agreement still lacks robust scientific support, particularly given that precipitation series may be influenced by the impacts of climate change, as discussed by Dalagnol et al. (2021). In this context, similarly to frequency analyses of hydrological variables, PMP estimates require periodic updates. These revisions are essential to expand and update the database, thereby enabling more reliable analyses that are consistent with current climatic conditions.
Synthetic series
Synthetic series generation models
Among the evaluated stochastic approaches, the bipartite model showed superior performance for the majority of the 481 stations, presenting lower MAE and RMSE values than the hybrid model (Table 2) and outperforming it in a larger number of cases, while also requiring lower computational effort.
Table 3 presents a comparison of statistical metrics derived from the synthetic series generated by the bipartite model and from the historical series.
Table 3 summarizes daily and annual precipitation statistics derived from historical and bipartite synthetic series. The mean of absolute daily maxima represents the average of the highest daily precipitation values observed in each series across all stations and years, characterizing typical extreme daily events. The mean of the mean annual daily maxima (hydrological year) corresponds to the average of the annual maximum daily precipitation values calculated for each station and hydrological year, while the maximum of the mean annual daily maxima highlights the highest of these station-averaged extremes, representing the upper bound of annual daily behavior reproduced by the model. For precipitation totals, the mean annual precipitation total (hydrological year) denotes the average accumulated precipitation over the hydrological year across all stations, whereas the maximum mean annual precipitation total represents the highest annual accumulation among these station-averaged totals. Overall, the results indicate that the bipartite model preserves the general magnitude of daily extremes and annual totals, with differences in upper-end metrics reflecting changes in variability at the annual scale.
The assessment of the statistical properties of the historical daily annual maximum precipitation series indicated that 17% of the records were classified as non-homogeneous according to the Mann-Whitney test (Mann & Whitney, 1947), 11% as non-random based on the NERC (National Environmental Research Council, 1975) test, 14% as non-stationary according to the KPSS test (Kwiatkowski et al., 1992), and 19% exhibited significant monotonic trends as identified by the Mann–Kendall test (Kendall & Stuart, 1967), considering a 5% significance level. Although these results indicate departures from classical statistical assumptions commonly associated with hydrological time series, the proportion of series failing to meet these criteria remains relatively small. Consequently, all stations were retained in the subsequent analyses, as the exclusion of these records is not expected to substantially alter the overall statistical behavior of the dataset.
It should be emphasized that the methodology adopted for estimating the frequency factors, as standardized by the WMO (World Meteorological Organization, 2009), does not strictly require the annual maximum series to be simultaneously homogeneous, independent, random, and stationary. Nonetheless, deviations from these properties represent an inherent limitation of the synthetic series generation model employed, which is based on simplifying assumptions, such as the use of fixed parameters throughout the simulated period. Given the predominance of historical series that satisfy these assumptions, the influence of these limitations on the overall results of the study is expected to be limited within the context of the available dataset.
Generation of synthetic series and envelope curves
Table 4 presents the resulting frequency factors at the 95% and 99% percentiles obtained for all selected stations, reflecting the distributional behavior derived from the generated synthetic series for the state of Minas Gerais as a whole and for each climatic type.
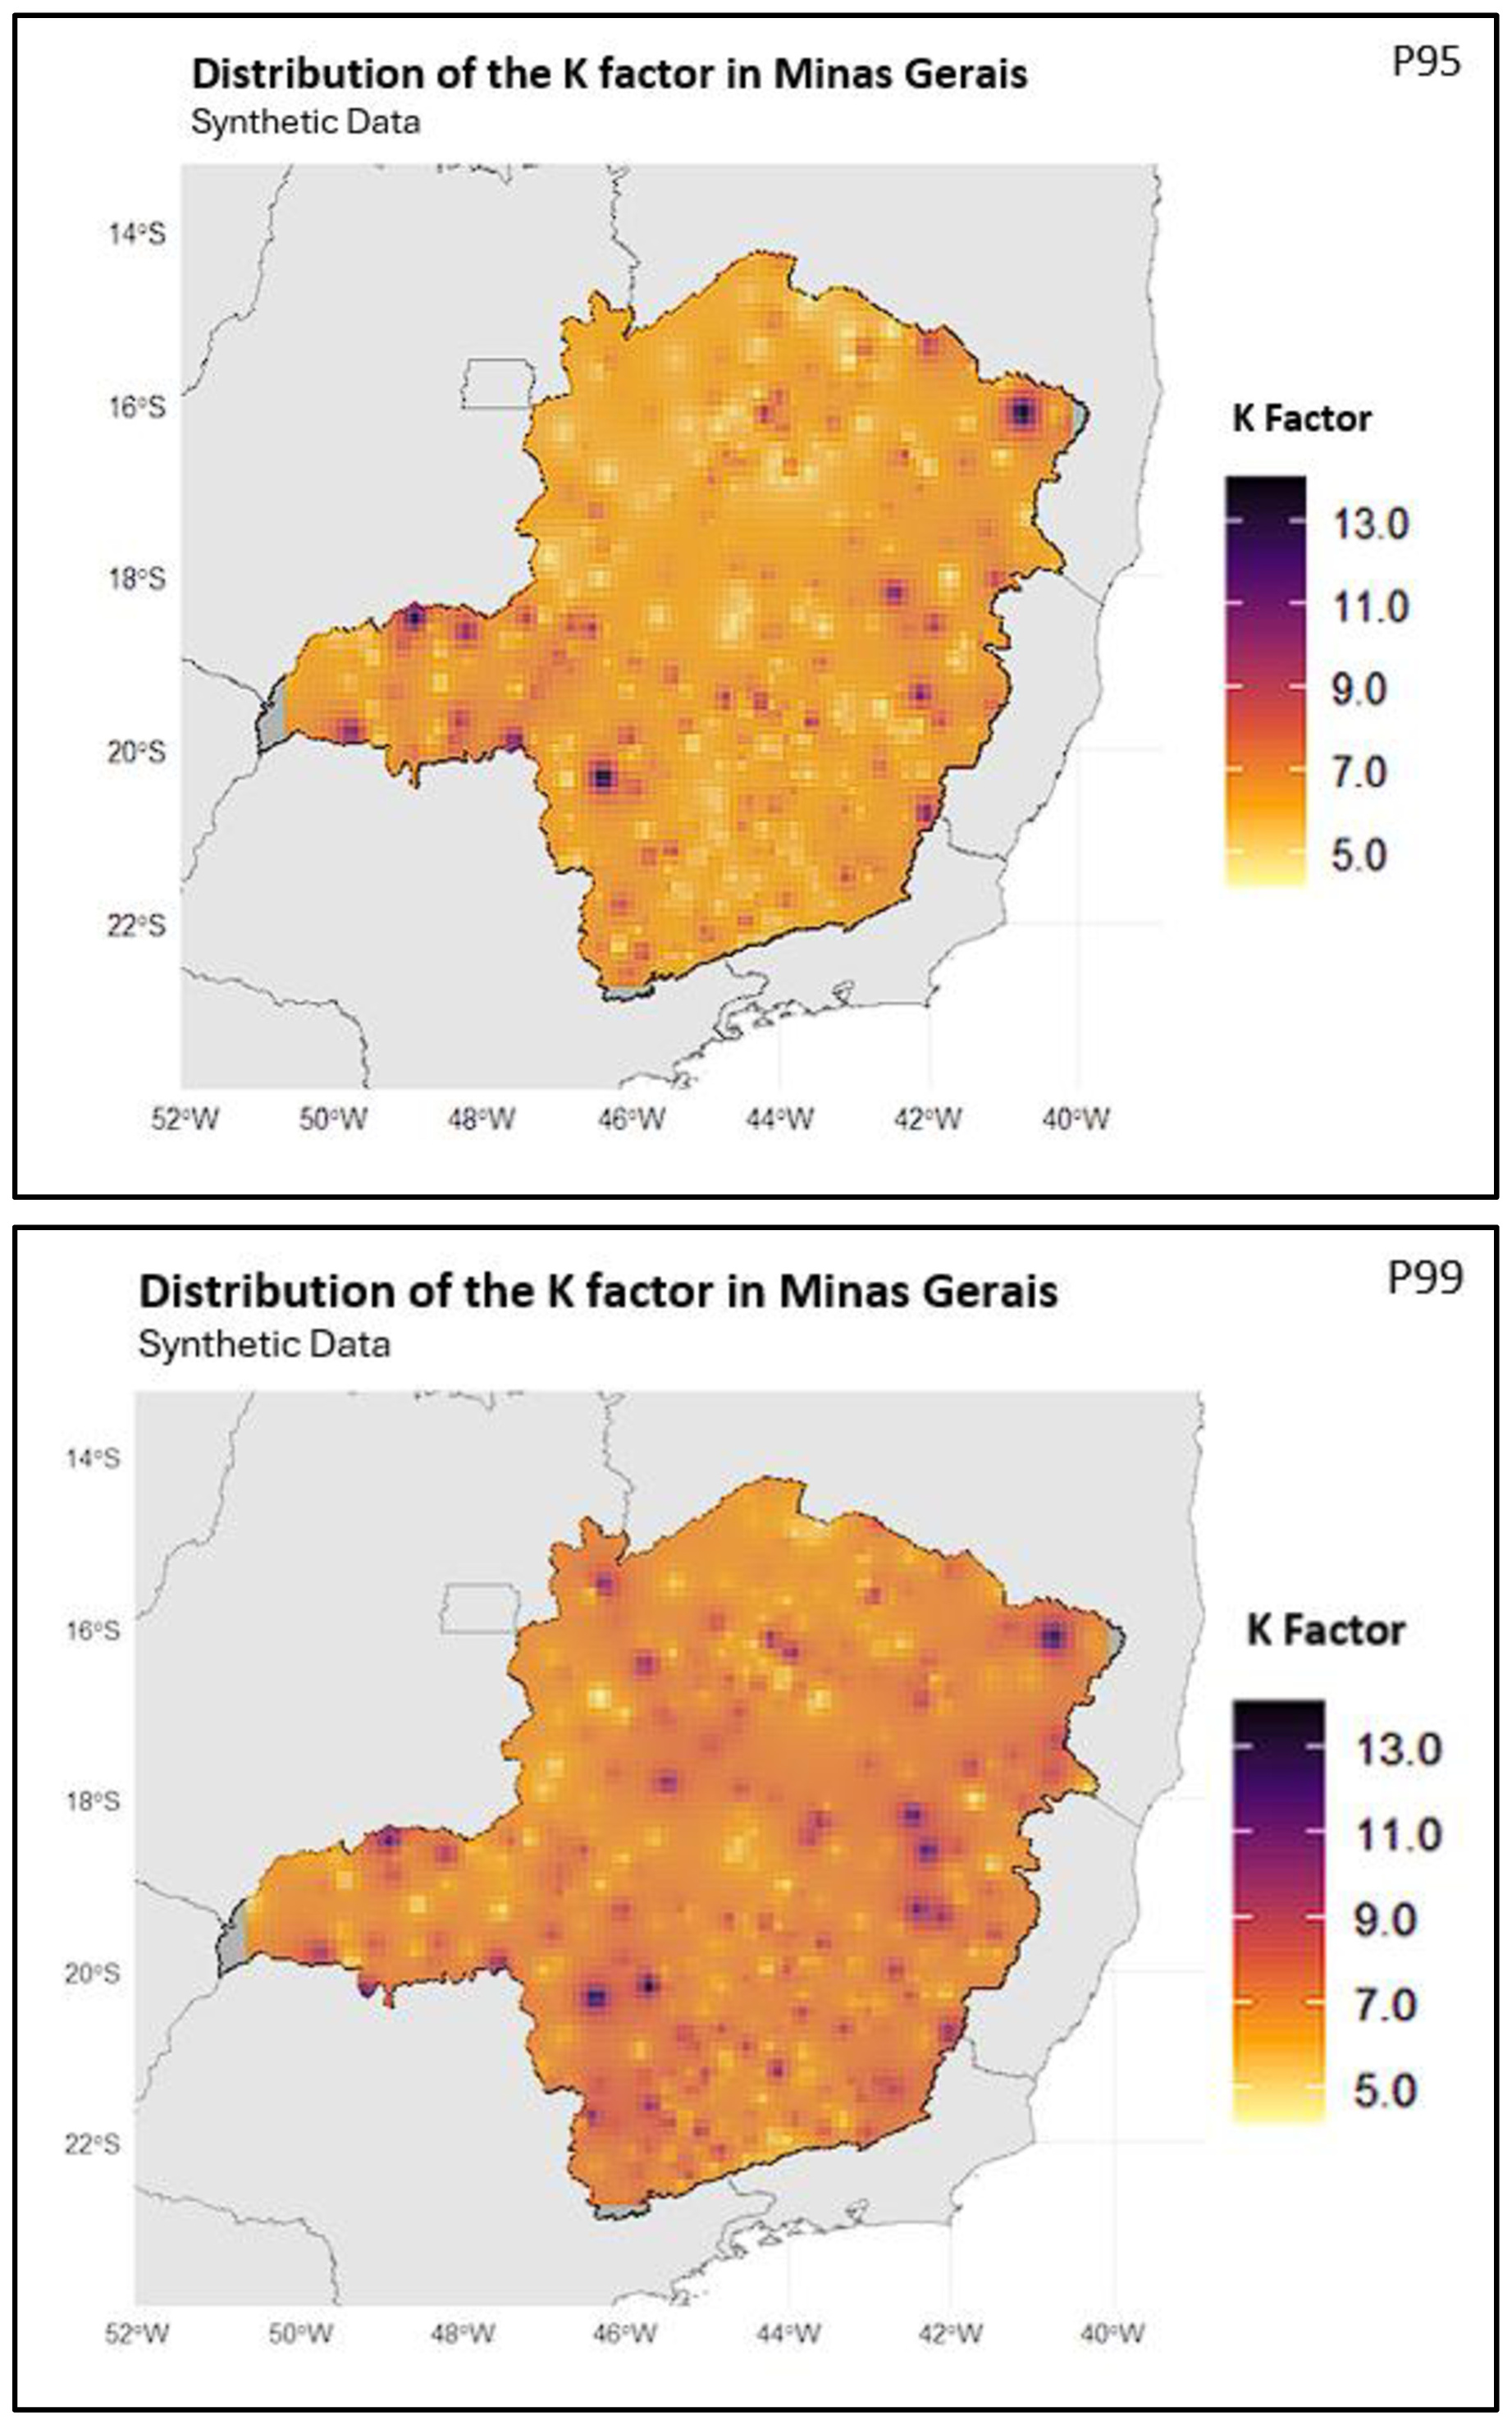
Figure 9 presents the resulting interpolation map for both percentiles.
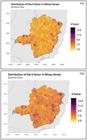
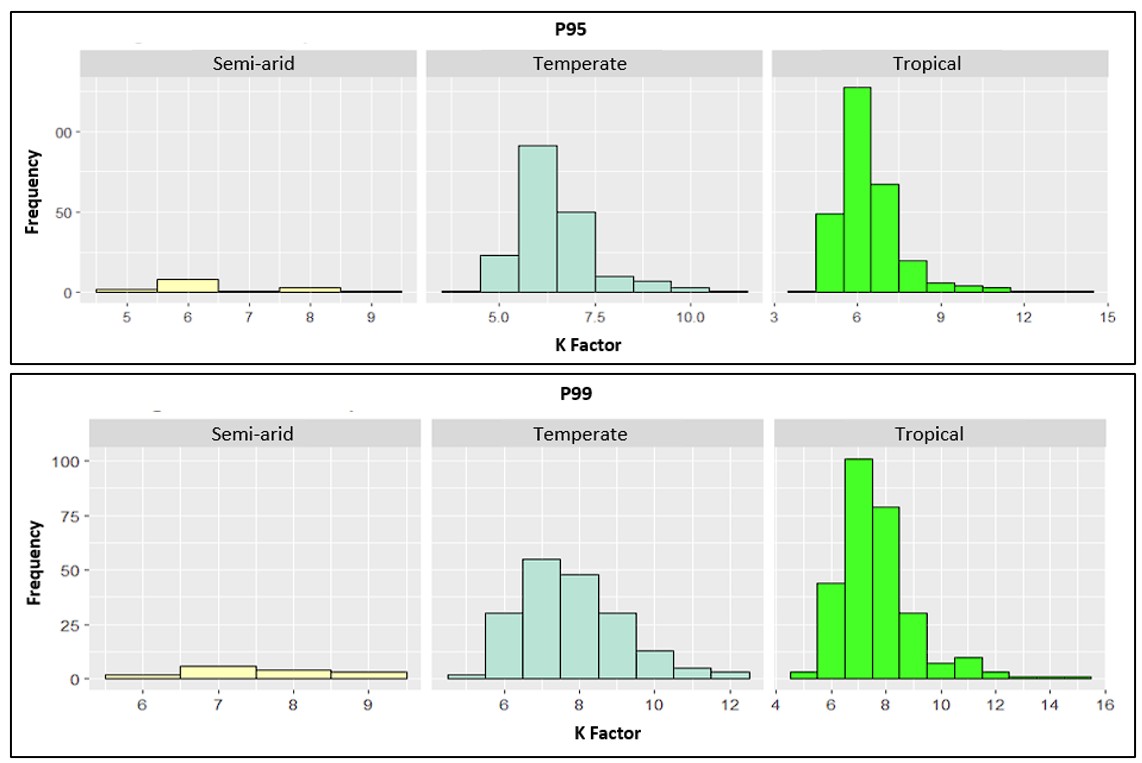
Figure 10 presents the histogram of the synthetic data by climate type.
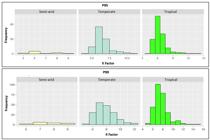
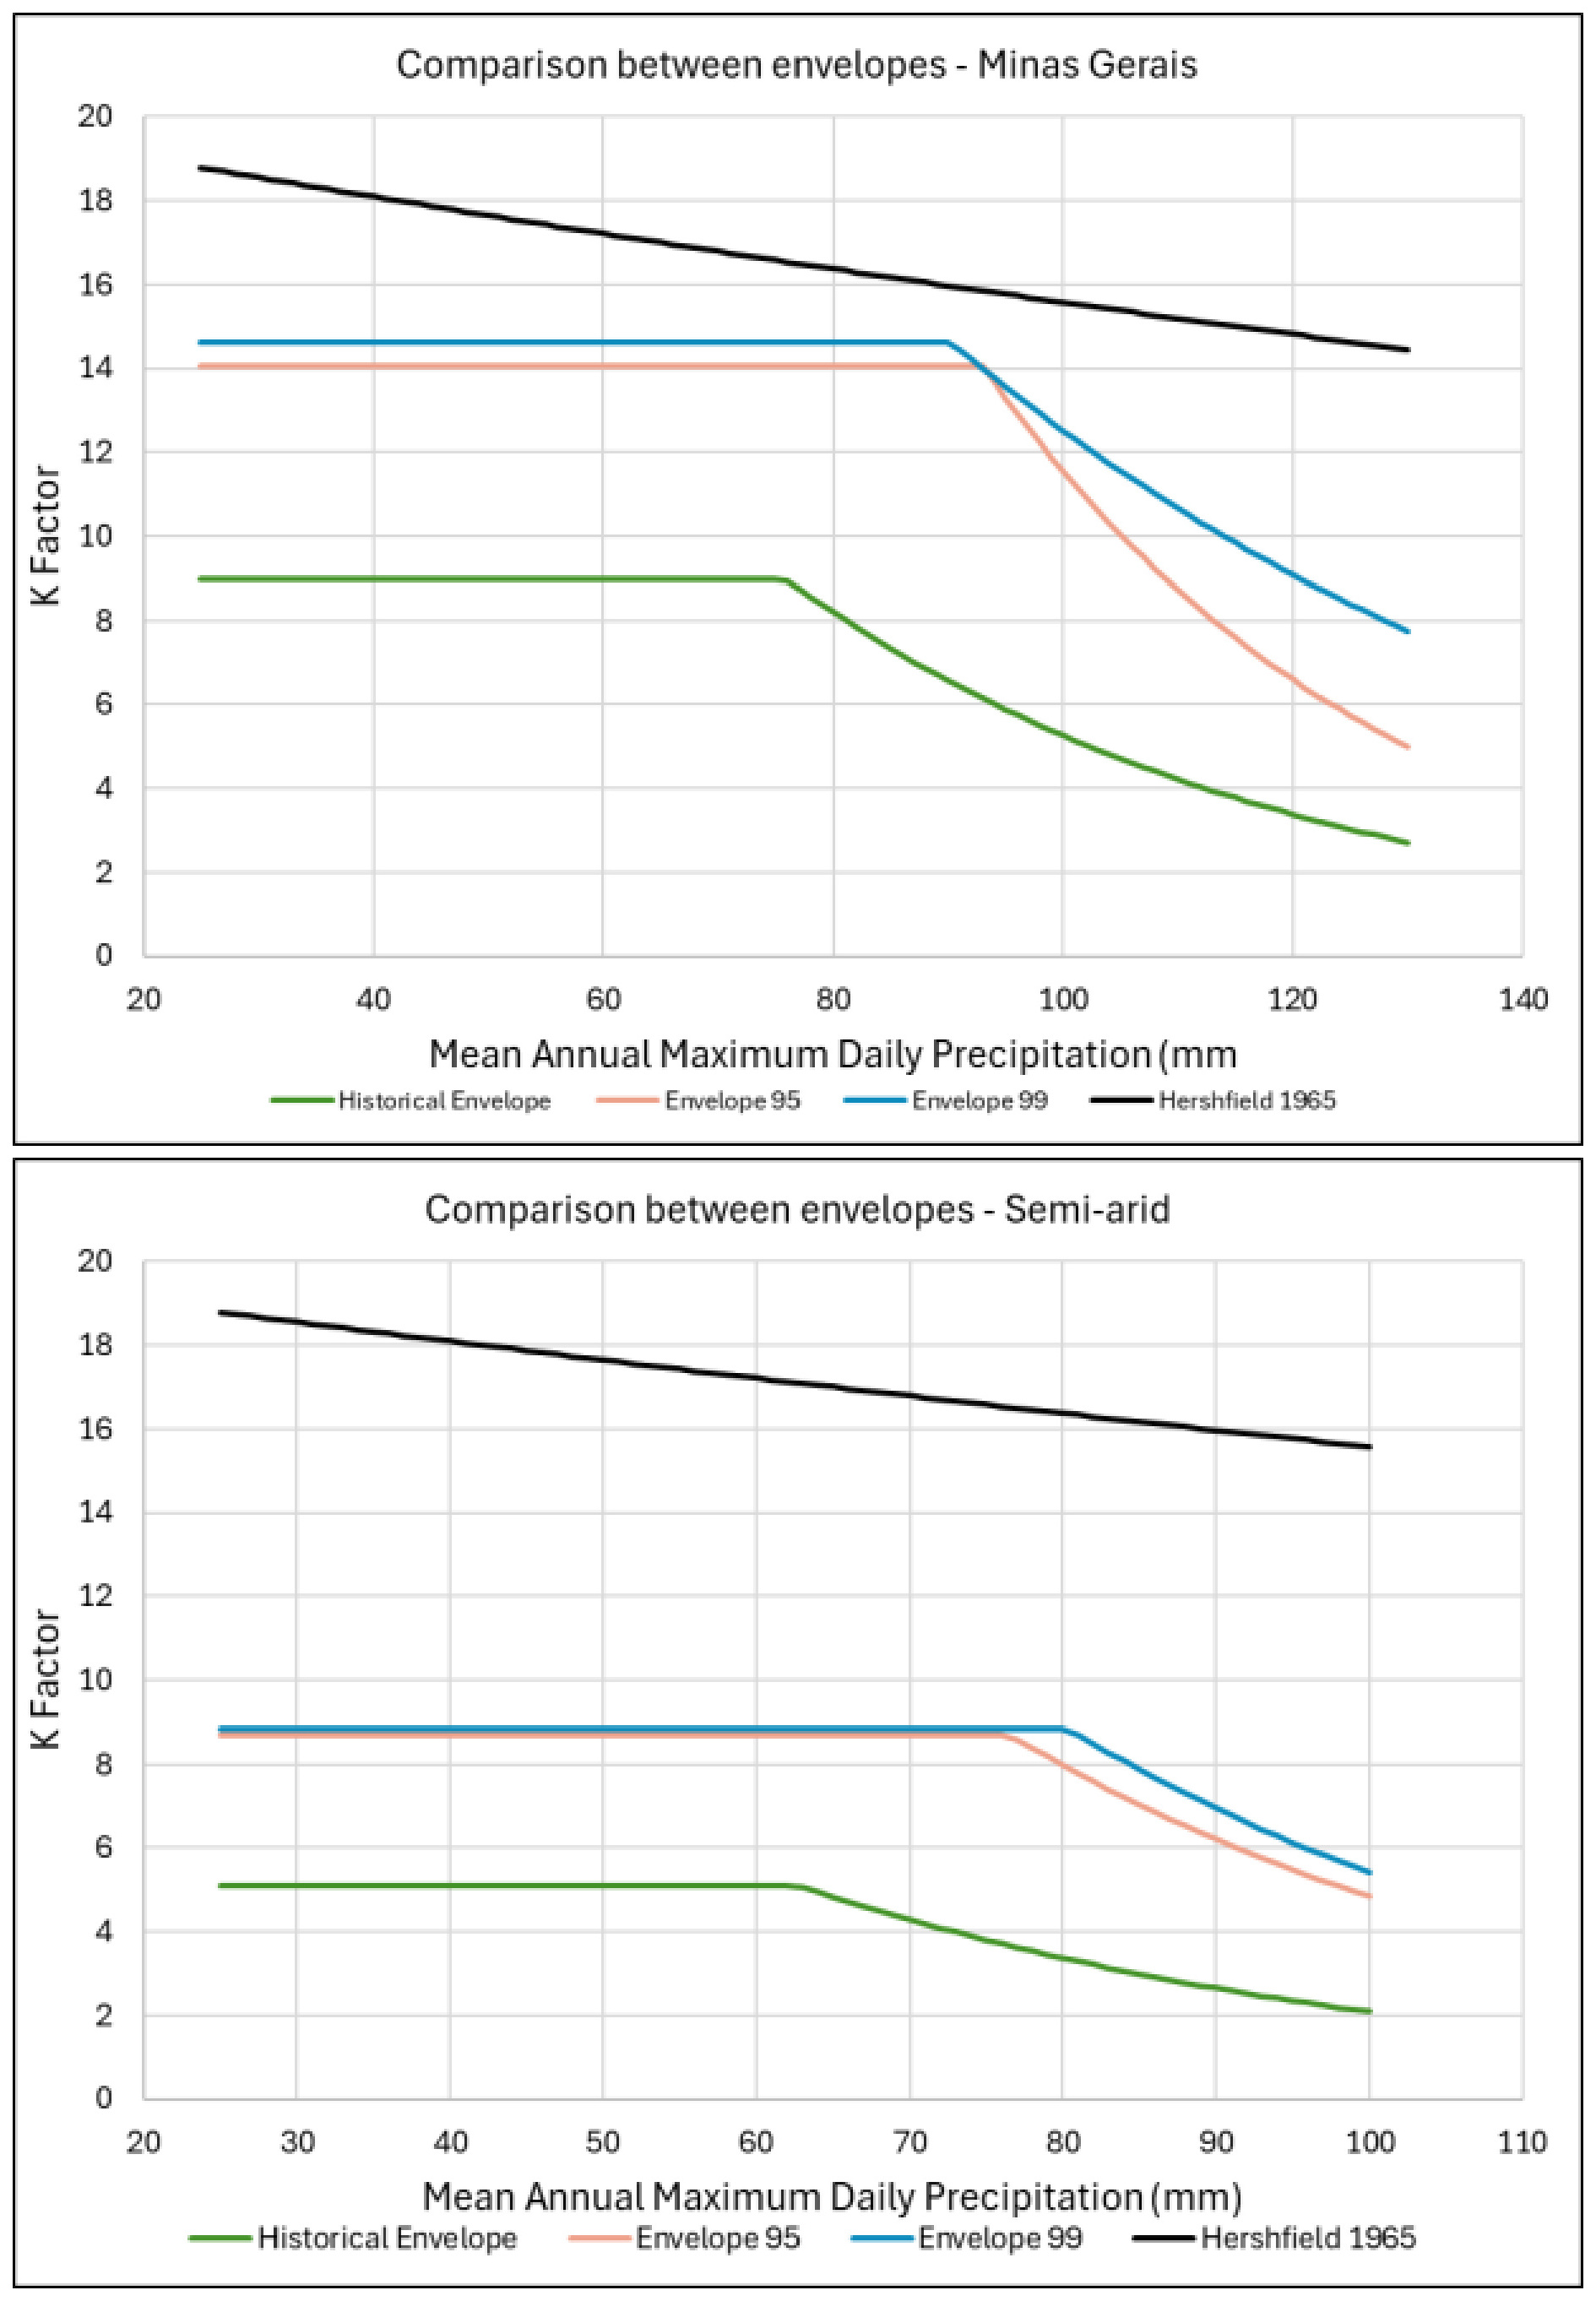
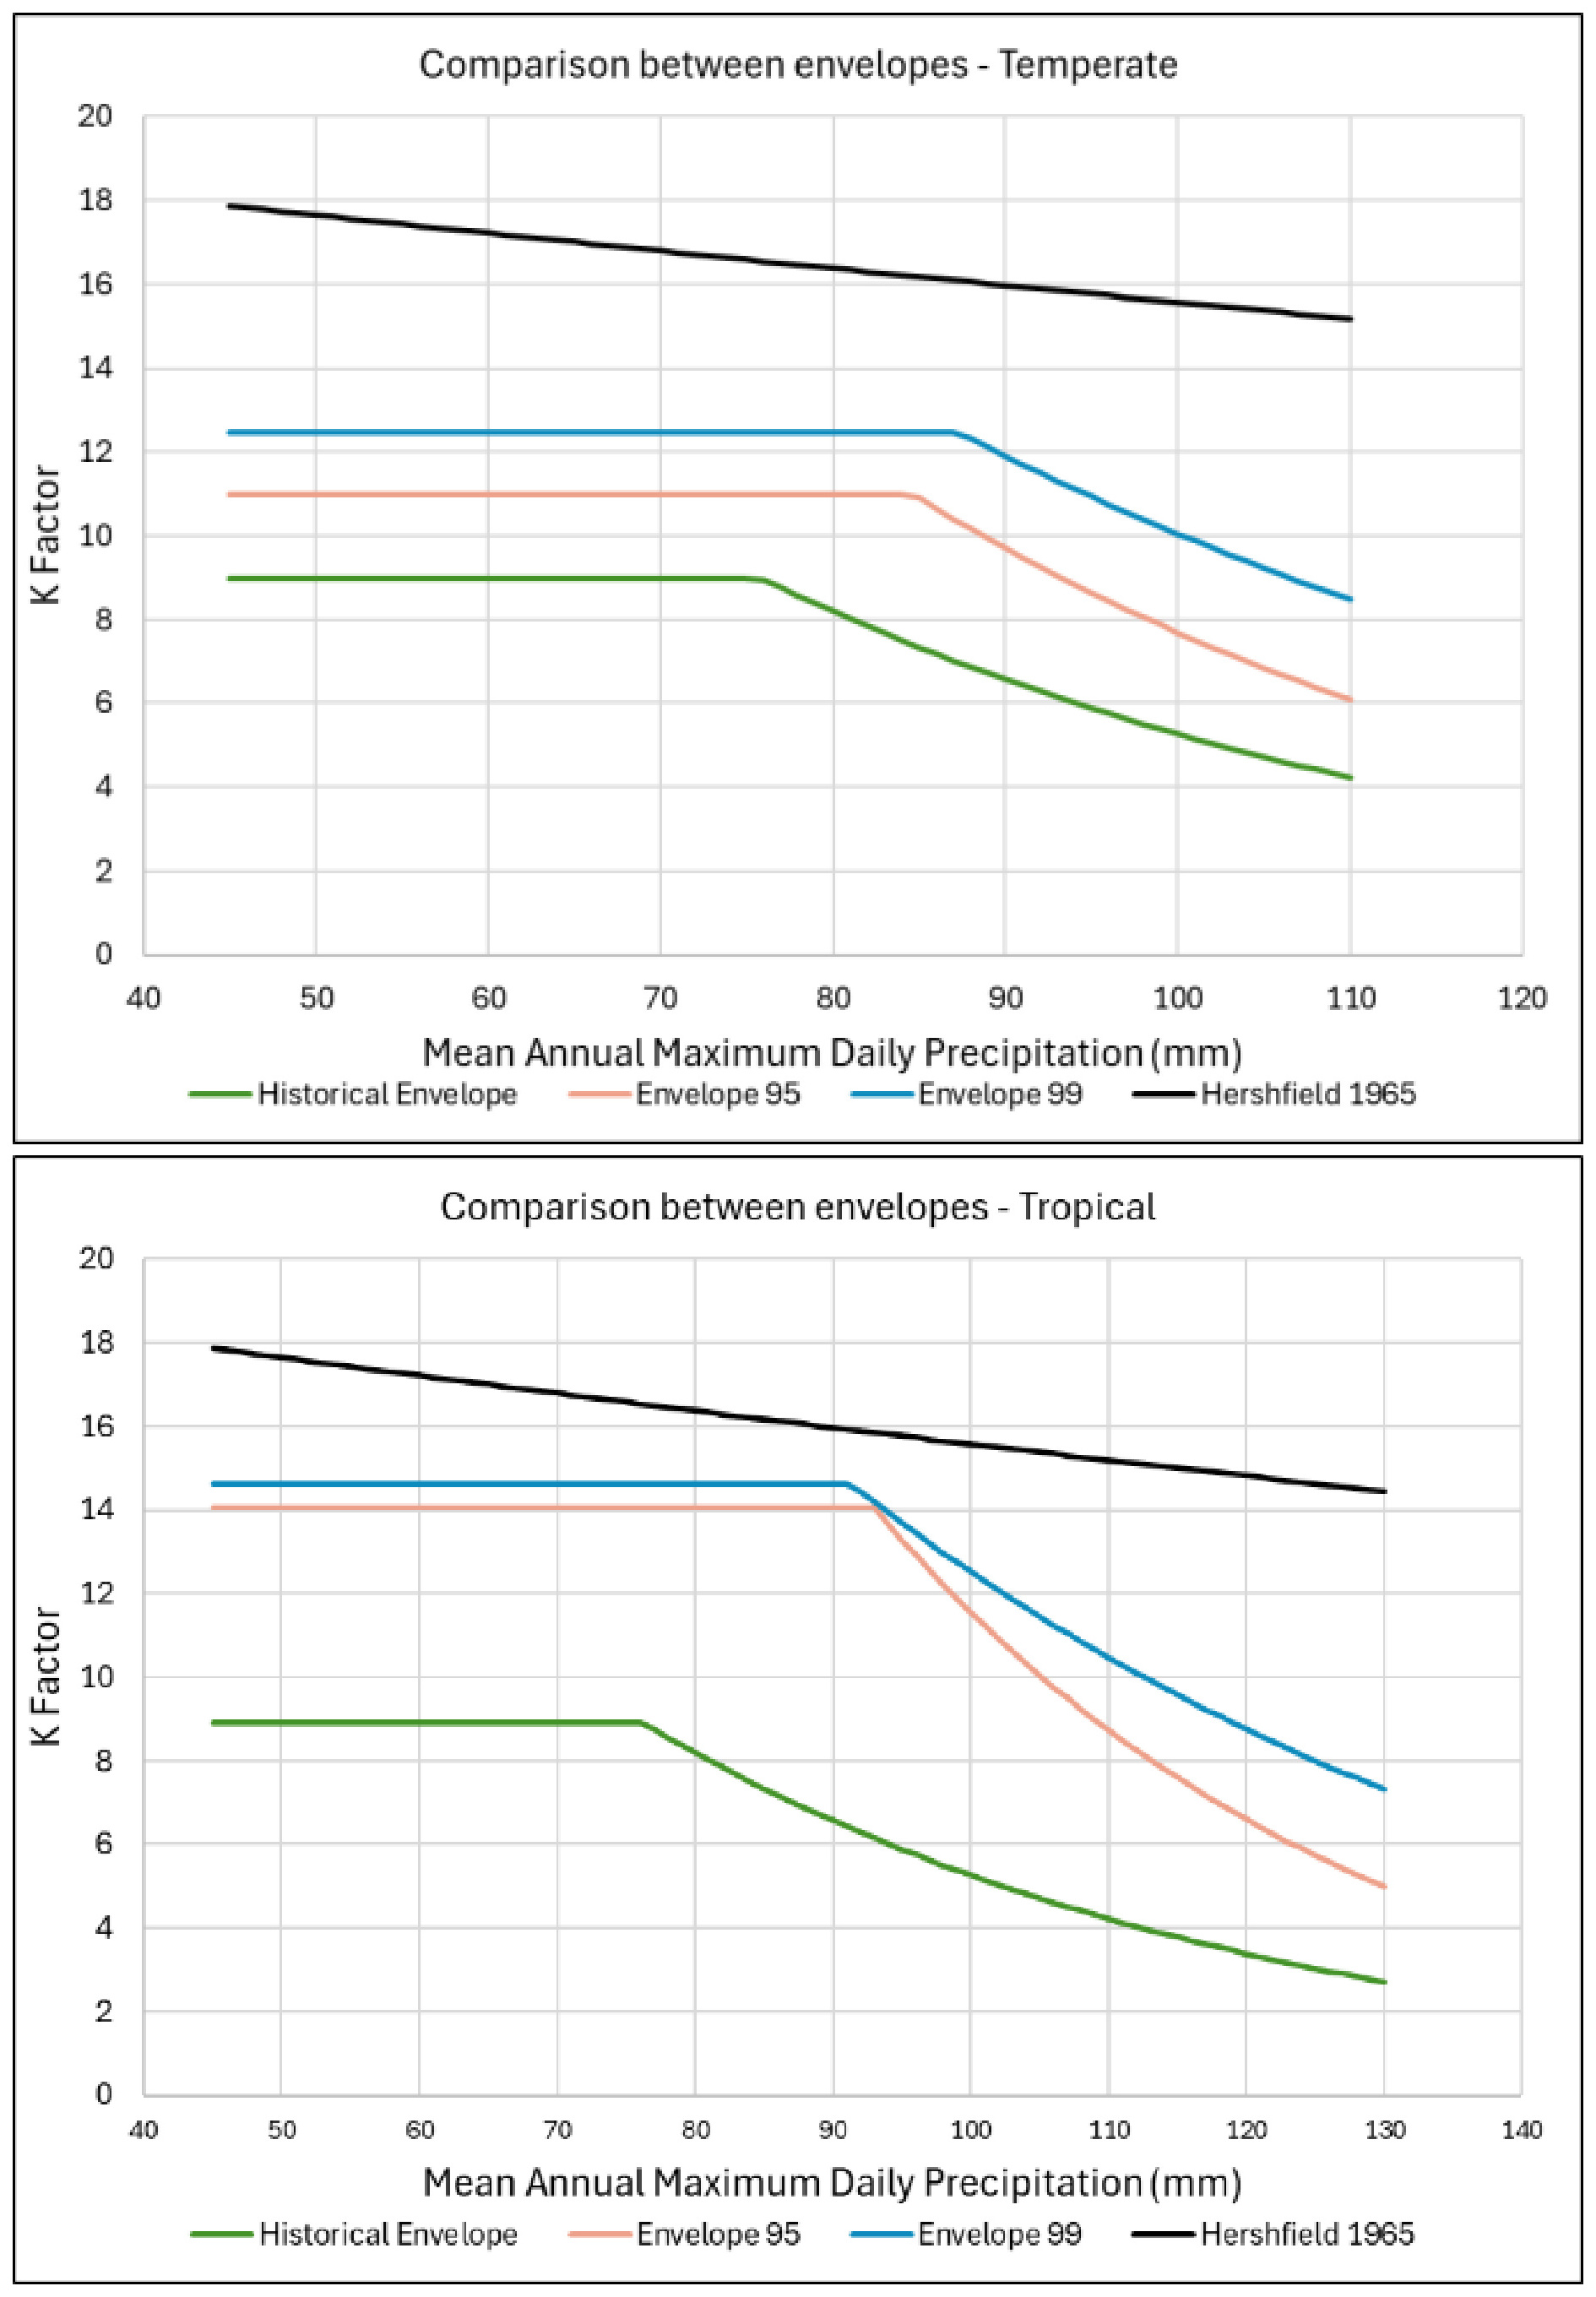
Figure 11 and Figure 12 present a comparative analysis of the envelopes obtained from the historical data, from the synthetic series with the selection of the K factor based on the 95% and 99% percentiles, as well as the envelope proposed by Hershfield (1965).
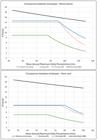
Comparison between results and the Hershfield envelope (1965) – Minas Gerais and Semiarid.
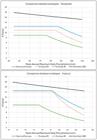
Comparison between results and the Hershfield envelope (1965) – Temperate and Tropical Climate.
The results obtained corroborate the recommendations of the National Academies of Sciences, Engineering, and Medicine (2024), which advocate the adoption of a probabilistic framework for Probable Maximum Precipitation estimation based on percentiles associated with very low exceedance probabilities. Using only historical records, the maximum frequency factor K reached 8.98. When synthetic series were incorporated, the maximum K values increased to 14.04 for the 95th percentile and 14.62 for the 99th percentile, corresponding to exceedance probabilities of 5% and 1%, respectively.
Within this context, the methodology applied in this study offers an alternative to the traditional statistical approach for estimating K factors, enabling their evaluation under different exceedance probability levels. In this regard, Koutsoyiannis (1999), using the published Hershfield data, showed that Hershfield’s PMP estimates can be reproduced by the generalized extreme value (GEV) distribution, with the shape parameter defined as a linear function of the mean of the annual maximum precipitation series, and associated with an equivalent return period of approximately 60,000 years.
The increase in K values was accompanied by statistical changes in the series:
-
Historical data: K ranged from 1.68 to 8.98 (mean = 3.65; median = 3.41; CV = 0.35; skewness = 1.41).
-
95th percentile: K ranged from 4.16 to 14.04 (mean = 6.42; median = 6.12; CV = 0.19; skewness = 1.97).
-
99th percentile: K ranged from 4.95 to 14.62 (mean = 7.71; median = 7.49; CV = 0.18; skewness = 1.25).
From a climatic perspective, the maximum K factors were lower in the semiarid region, contrary to Hershfield’s (1965) envelope, which suggests higher values in arid climates. However, this finding is consistent with the conclusions reported by Sarkar & Maity (2020) and Martins (2024). It should be noted that the semiarid region is characterized by a limited number of pluviometric stations, which may constrain the robustness of the results. In this regard, a dedicated investigation focusing on the Brazilian semiarid region, such as the Brazilian Northeast, could help to corroborate the observed patterns. In temperate and tropical regions, the maximum K factors were similar, although higher values were observed in tropical climates when synthetic series were considered.
The analysis revealed that, although the maximum frequency factor values in the synthetic series were more pronounced in tropical regions, the means and medians of the K factors across different climatic classifications showed very similar results. This similarity was observed both in historical data and in values corresponding to the 95th and 99th percentiles, suggesting a certain uniformity in the magnitude of extreme precipitation events when considering mean and median values across Minas Gerais. Such behavior can be explained by the influence of large-scale meteorological systems, particularly the South Atlantic Convergence Zone (SACZ) and the South American Monsoon System, which dominate the seasonal rainfall regime in the region and create conditions favorable to intense precipitation events in multiple areas (Tavares, 2024). These systems act as homogenizing agents, reducing regional differences and reinforcing the occurrence of extreme rainfall patterns throughout the state.
A limitation of the approach based on the generation of synthetic daily precipitation series is related to the inability of the adopted models to fully reproduce some statistical properties observed in the historical series, particularly non-stationarity, which was identified in a portion of the analyzed records. This limitation arises from the fact that the synthetic models employed are based on first-order Markov chains, in which the occurrence of precipitation on a given day depends exclusively on the state of the previous day, implicitly assuming long-term independence and statistically constant parameters over time. As highlighted by Jale et al. (2019), such models rely on fixed transition probabilities and equilibrium conditions, which characterize the rainfall process through stable long-term behavior. This simplification restricts the model’s ability to represent structural changes, persistent trends, and gradual variations in the rainfall regime. Furthermore, the adoption of probability distributions with fixed parameters defined on a monthly basis prevents the representation of changes in the statistical characteristics of precipitation associated with climate variability and climate change. Recent studies indicate that such changes may affect both the frequency and intensity of extreme events, challenging the classical assumption of stationarity in hydrological analyses (Intergovernmental Panel on Climate Change, 2023; Dalagnol et al., 2021). In this context, an evolution of this line of research involves the development or adoption of stochastic models that incorporate time-varying parameters or structures capable of representing trends and regime shifts in a more realistic manner.
The constructed envelope curves demonstrated the expected coherence: the curve based on historical data showed the lowest values, followed by the curves of the 95th and 99th percentiles. The Hershfield (1965) curve was positioned above all, although its methodology does not include the linear segment proposed by Sarkar & Maity (2020). The adoption of this linear threshold avoided distortions in the lower portion of the curve and allowed for a more accurate representation of the observed means, keeping all analyzed data within the proposed envelope. It is also observed that, if the curves were constructed considering only the exponential segment, there would be a tendency to exceed the Hershfield envelope in more arid regions.
CONCLUSIONS
This study aimed to estimate envelope curves for the frequency factors K associated with the Probable Maximum Precipitation of daily duration in Minas Gerais using both historical and synthetic precipitation series. Based on the analysis of 481 rain gauge stations, the proposed approach enabled the derivation of regionalized K-factor envelopes that reflect the spatial and climatic variability observed across the state.
The methodology adopted allowed the estimation of K factors under different exceedance probabilities (95th and 99th percentiles), providing an alternative to the traditional statistical procedure typically based on a single deterministic value. The incorporation of synthetic series broadened the representation of extreme precipitation behavior, complementing the information derived from historical records.
The results show that the maximum K values estimated for Minas Gerais can be lower than those suggested by the classical Hershfield envelope, indicating the potential for more regionally representative PMP estimates. Systematic differences were also observed among climatic zones: semiarid areas exhibited the lowest K factor magnitudes and the smallest annual maxima, whereas temperate and tropical regions showed higher and statistically similar values. However, the semiarid classification includes a comparatively small number of stations, which limits the robustness of inferences for this region and warrants caution when interpreting its envelope estimates.
Overall, the findings support the development of region-specific PMP estimation tools and demonstrate the applicability of the proposed methodology for improving the representation of extreme rainfall conditions in Minas Gerais within a probabilistic framework.
DATA AVAILABILITY STATEMENT
Research data supporting this study are available in the following repository: https://drive.google.com/drive/folders/1Qx0E64Qm0fEa5jwlgMzq8xvU0yzCQCES?usp=sharing
REFERENCES
- Agência Nacional de Águas e Saneamento Básico – ANA. (2016). Manual do empreendedor sobre segurança de barragens (Vol. V: Diretrizes para a elaboração de projeto de barragens). Brasília: Ministério do Meio Ambiente e Mudança do Clima.
- Barbosa, A. G., Silva, A. F. R., & Costa, V. A. F. (2023). Estimativa espacial da precipitação máxima provável com duração de 24 horas para o território brasileiro. In Anais do XXV Simpósio Brasileiro de Recursos Hídricos Rio de Janeiro: ABRH.
- Box, G. E. P., & Jenkins, G. M. (1970). Time series analysis: forecasting and control San Francisco: Holden-Day.
-
Braga, H. A., & Ambrizzi, T. (2022). A variabilidade intrassazonal e interanual do acoplamento entre a Zona de Convergência do Atlântico Sul e o Vórtice Ciclônico de Altos Níveis. Revista Brasileira de Meteorologia, 37(3), 145-158. https://doi.org/10.1590/0102-77863730060
» https://doi.org/10.1590/0102-77863730060 - Brasil. Ministério de Minas e Energia. Agência Nacional de Mineração – ANM. (2022, 7 de fevereiro). Resolução ANM nº 95. Consolida os atos normativos que dispõem sobre segurança de barragens de mineração. Diário Oficial [da] República Federativa do Brasil, Brasília.
- Burger, L. C. (2014). Adaptação e análise do método de Hershfield para estimativa da precipitação máxima provável (PMP) (Dissertação de mestrado). Universidade Federal do Paraná, Curitiba.
- Carmo, C. R. S., & Silva, J. R. M. (2023). Machine learning and provision of data storage services: metrics for analysis and validation of predictive algorithms. Revista GETEC, 12(38), 123-144.
- Centro de Tecnologia Mineral – CETEM. (2012). Rompimento de barragem da Mineradora Rio Pomba Cataguases Rio de Janeiro: CETEM/MCTI.
- Centro de Tecnologia Mineral – CETEM. (2016). Rompimento de barragem da Mineração Rio Verde, em Nova Lima (MG) Rio de Janeiro: CETEM/MCTI.
-
Chen, J., & Brissette, F. P. (2014). Stochastic generation of daily precipitation amounts: Review and evaluation of different models.Climate Research, 59, 189-206. https://doi.org/10.3354/cr01214
» https://doi.org/10.3354/cr01214 - Costa, V. (2015). Estimação indireta de quantis de enchentes extremas a partir de modelos chuva-vazão com emprego conjunto de um gerador estocástico de precipitação diária, análise bayesiana e distribuições limitadas superiormente (Tese de doutorado). Universidade Federal de Minas Gerais, Belo Horizonte.
-
Dalagnol, R., Gramcianinov, C. B., Crespo, N. M., Chiquetto, J. B., Marques, M. T. A., Dolfi Neto, G., Abreu, R. C., Li, S., Cott, F. L., Anderson, L. O., & Sparrow, S. (2021). Extreme rainfall and its impacts in the Brazilian Minas Gerais state in January 2020: can we blame climate change? Climate Resilience and Sustainability, 1(1), e15. https://doi.org/10.1002/cli2.15
» https://doi.org/10.1002/cli2.15 -
Desa, M. N., & Rakhecha, M. P. (2007). Probable maximum precipitation for 24-h duration over an equatorial region: Part 2 – Johor, Malaysia. Atmospheric Research, 84(1), 84-90. https://doi.org/10.1016/j.atmosres.2006.06.005
» https://doi.org/10.1016/j.atmosres.2006.06.005 - Detzel, D. H. M. (2009). Geração de séries sintéticas de precipitação (Dissertação de mestrado). Universidade Federal do Paraná, Curitiba.
- Hershfield, D. M. (1961a). Rainfall frequency atlas of the United States (Technical Paper, No. 40). Washington, DC: Weather Bureau.
-
Hershfield, D. M. (1961b). Estimating the probable maximum precipitation. Journal of the Hydraulics Division, 87(5), 99-106. https://doi.org/10.1061/JYCEAJ.0000651
» https://doi.org/10.1061/JYCEAJ.0000651 -
Hershfield, D. M. (1965). Method for estimating probable maximum precipitation. Journal - American Water Works Association, 57(8), 965-972. https://doi.org/10.1002/j.1551-8833.1965.tb01486.x
» https://doi.org/10.1002/j.1551-8833.1965.tb01486.x - Instituto Brasileiro de Geografia e Estatística – IBGE. (2022). Censo demográfico 2022 Rio de Janeiro: IBGE.
- Instituto Mineiro de Gestão das Águas – IGAM. (2006). Plano estadual de recursos hídricos de Minas Gerais Belo Horizonte.
- Intergovernmental Panel on Climate Change - IPCC. (2023). Climate change 2023: synthesis report Geneva: IPCC.
-
Jale, J. S., Xavier Júnior, S. F. A., Xavier, É. F. M., Stošić, T., Stošić, B., & Ferreira, T. A. E. (2019). Application of Markov chain on daily rainfall data in Paraíba-Brazil from 1995-2015. Acta Scientiarum. Technology, 41(1), e37186. https://doi.org/10.4025/actascitechnol.v41i1.37186
» https://doi.org/10.4025/actascitechnol.v41i1.37186 - Kendall, M. A., & Stuart, A. (1967). The advanced theory of statistics (2nd ed.). London: Charles Griffin.
-
Klemeš, V. (2000). Tall tales about tails of hydrological distributions. Journal of Hydrologic Engineering, 5(3), 227-239. https://doi.org/10.1061/(ASCE)1084-0699(2000)5:3(227)
» https://doi.org/10.1061/(ASCE)1084-0699(2000)5:3(227) -
Koutsoyiannis, D. (1999). A probabilistic view of Hershfield’s method for estimating probable maximum precipitation. Water Resources Research, 35(4), 1313-1322. https://doi.org/10.1029/1999WR900002
» https://doi.org/10.1029/1999WR900002 - Koutsoyiannis, D., & Papalexiou, S. M. (2017). Extreme rainfall: global perspective. In V. P. Singh (Ed.), Handbook of applied hydrology (pp. 74.1-74.16). New York: McGraw-Hill.
-
Kwiatkowski, D., Phillips, P. C. B., Schmidt, P., & Shin, Y. (1992). Testing the null hypothesis of stationarity against the alternative of a unit root. Journal of Econometrics, 54(1-3), 159-178. https://doi.org/10.1016/0304-4076(92)90104-Y
» https://doi.org/10.1016/0304-4076(92)90104-Y -
Lima, C. E. S., Souza Filho, F. A., & Rocha, R. V. (2025). Homogeneous climate risk zones in Brazil. Revista Brasileira de Recursos Hídricos, 30, e36. http://dx.doi.org/10.1590/2318-0331.302520240102
» http://dx.doi.org/10.1590/2318-0331.302520240102 -
Llabrés-Brustenga, A., Rius, A., Rodríguez-Solà, R., Casas-Castillo, M. C., & Redaño, A. (2019). Quality control process of the daily rainfall series available in Catalonia from 1855 to the present. Theoretical and Applied Climatology, 137(3-4), 2715-2729. https://doi.org/10.1007/s00704-019-02772-5
» https://doi.org/10.1007/s00704-019-02772-5 -
Mann, H. B., & Whitney, D. R. (1947). On a test of whether one of two random variables is stochastically larger than the other. Annals of Mathematical Statistics, 18(1), 50-60. https://doi.org/10.1214/aoms/1177730491
» https://doi.org/10.1214/aoms/1177730491 -
Martins, F. B., Gonzaga, G., Santos, D. F., & Reboita, M. S. (2018). Classificação climática de Köppen e de Thornthwaite para Minas Gerais: cenário atual e projeções futuras. Revista Brasileira de Climatologia, 17, 1-15. https://doi.org/10.5380/abclima.v1i0.60896
» https://doi.org/10.5380/abclima.v1i0.60896 - Martins, V. M. P. (2024). Emprego da simulação de Monte Carlo na estimativa do fator de frequência adotado no cálculo da precipitação máxima provável (PMP) pontual em uma região de clima equatorial sujeita à atuação convectiva (Dissertação de mestrado). Universidade Federal de Minas Gerais, Belo Horizonte.
-
Mello, C. R., Lima, J. M., Silva, A. M., Mello, J. M., & Oliveira, M. S. (2003). Krigagem e inverso do quadrado da distância para interpolação dos parâmetros da equação de chuvas intensas. Revista Brasileira de Ciência do Solo, 27(5), 925-933. https://doi.org/10.1590/S0100-06832003000500017
» https://doi.org/10.1590/S0100-06832003000500017 -
Miquelito, A. C., & Quelhas, O. L. G. (2014). Ações relacionadas aos acidentes ambientais: estudo de caso do acidente da Indústria Cataguases de Papel e Celulose/MG em 2003. Gestão & Produção, 21(4), 845-858. https://doi.org/10.5935/2177-4560.20140009
» https://doi.org/10.5935/2177-4560.20140009 - Naghettini, M., & Pinto, E. J. A. (2007). Hidrologia estatística Belo Horizonte: CPRM.
- National Academies of Sciences, Engineering, and Medicine. (2024). Modernizing probable maximum precipitation estimation Washington, DC: The National Academies Press.
- National Environmental Research Council – NERC. (1975). Flood studies report (Vol. 1). London: NERC.
- Nimer, E. (1979). Climatologia do Brasil Rio de Janeiro: IBGE.
- Pereira, D. M., Guimarães, H. O. R., Freitas, S. M. C., & Mângia, A. A. M. (2020). Brumadinho: muito mais que um desastre tecnológico. Revista da UFMG, 27(2), 332-355. https://doi.org/10.35699/2316-770X.2020.21649.
- Pinheiro, M. C. (2011). Diretrizes para elaboração de estudos hidrológicos e dimensionamentos hidráulicos em obras de mineração Belo Horizonte: ABRH.
-
Rosa, E. B., Pezzi, L. P., Quadro, M. F. L., & Brunsell, N. (2020). Automated detection algorithm for SACZ, oceanic SACZ and their climatological features. Frontiers in Environmental Science, 8, 18. https://doi.org/10.3389/fenvs.2020.00018
» https://doi.org/10.3389/fenvs.2020.00018 -
Salgado, S. R. T., Carvalho, E., Viseu, M. T., & Oliveira, O. F. (2025). Evaluating dam safety in Brazil: a comparative analysis of international classification systems. Revista Brasileira de Recursos Hídricos, 30, e46. http://dx.doi.org/10.1590/2318-0331.302520250024
» http://dx.doi.org/10.1590/2318-0331.302520250024 - Saliba, A. P. M. (2009). Uma nova abordagem para análise de ruptura por galgamento de barragens homogêneas de solo compactado (Tese de doutorado). Universidade Federal de Minas Gerais, Belo Horizonte.
-
Sarkar, S., & Maity, R. (2020). Estimation of probable maximum precipitation in the context of climate change. MethodsX, 7, 100904. PMid:32435603. https://doi.org/10.1016/j.mex.2020.100904
» https://doi.org/10.1016/j.mex.2020.100904 -
Silva Neto, V. L., Viola, M., Mello, C. R., Silva, D. D., & Giongo, M. V. (2020). Precipitação máxima provável no estado do Tocantins: primeira aproximação pelo método estatístico de Hershfield. Revista Brasileira de Climatologia, 27, 10-21. http://dx.doi.org/10.5380/abclima.v27i0.69590.
» https://doi.org/. http://dx.doi.org/10.5380/abclima.v27i0.69590 -
Silva, P. N., Escobar, G. C. J., & Reboita, M. S. (2020). Eventos extremos de precipitação no estado de Minas Gerais associados com episódios de Zona de Convergência do Atlântico Sul. Revista Brasileira de Geografia Física, 13(3), 624-635. https://doi.org/10.26848/rbgf.v13.3.p1013-1023
» https://doi.org/10.26848/rbgf.v13.3.p1013-1023 - Sistema Integrado de Gestão de Barragens de Mineração - SIGBM. (2024). Base de dados do Sistema Integrado de Gestão de Barragens de Mineração (SIGBM) Brasília: Agência Nacional de Mineração.
- Sistema Nacional de Informações sobre Segurança de Barragens - SNISB. (2024). Base de dados do Sistema Nacional de Informações sobre Segurança de Barragens (SNISB). Brasília: SNISB.
- Sugai, M. R. V. B. (1989). Tempo de recorrência associado à precipitação máxima provável na Região Sul do Brasil (Dissertação de mestrado). CEHPAR/UFPR, Curitiba.
-
Tavares, M. G. (2024). Analysis of trends in extreme precipitation in the State of Minas Gerais. Revista Brasileira de Meteorologia, 39, e39240033. http://dx.doi.org/10.1590/0102-77863910033
» http://dx.doi.org/10.1590/0102-77863910033 -
Wilks, D. S. (1998). Multisite generalization of a daily stochastic precipitation generation model. Journal of Hydrology (Amsterdam), 210(1-4), 178-191. https://doi.org/10.1016/S0022-1694(98)00186-3
» https://doi.org/10.1016/S0022-1694(98)00186-3 - World Meteorological Organization – WMO. (2009). Manual on estimation of probable maximum precipitation (PMP) Geneva: WMO.
Edited by
-
Editor in-Chief:
Adilson Pinheiro
-
Associated Editor:
Carlos Henrique Ribeiro Lima