Biometrics and phenotypic characterization of cowpea genotypes for green pod production
ABSTRACT
Cowpea [Vigna unguiculata (L.) Walp] is widely cultivated in Brazil, with diverse genotypes, which make it adaptable to different production systems and cultivation purposes, whether for grain or pod production. The objective of this study was to evaluate the genetic diversity of cowpea genotypes based on phenotypic traits for green pod production in southern Tocantins, Brazil. Two experiments were conducted, in Gurupi, Tocantins, and in Dianópolis, Tocantins. Twenty cowpea genotypes were evaluated using a randomized complete block design with four repetitions. The following traits were evaluated: pod length and width, number of grains per pod, number of pods per plant, weight of 100 green grains, wet and dry weight of 15 pods, pod moisture content, and green pod yield. The experimental data were subjected to analysis of variance, principal component analysis, Pearson's linear correlation analysis, path analysis, and cluster analysis. Green pod yield was the trait that contributed the most to the total variability observed in the study. Correlation analysis and path analysis demonstrated that green pod yield was most directly affected by the number of pods per plant and wet pod weight. Cluster analysis based on the Mahalanobis distance matrix formed four distinct groups. The genotypes MNC11-1013E-16, MNC11-1019E-8, MNC11-1020E-16, MNC11-1026E-15 and MNC11-1026E-19 stood out with the highest green pod yield values.
Keywords:
Vigna unguiculata; Genotype selection; Path analysis; Principal component analysis; Cluster analysis.
RESUMO
O feijão-caupi [Vigna unguiculata (L.) Walp] é amplamente cultivado no Brasil, com diversos genótipos que o torna adaptável para os diferentes sistemas de produção e a finalidade do cultivo, seja para produção de grãos ou vagens. O objetivo deste estudo foi de avaliar a diversidade genética de genótipos de feijão-caupi com base em características fenotípicas para produção de vagem verde no sul do Tocantins. Dois experimentos foram conduzidos, em Gurupi, Tocantins, e em Dianópolis, Tocantins. Avaliou-se vinte genótipos de feijão-caupi utilizando o delineamento em blocos casualizados com quatro repetições. Foram avaliadas as características de comprimento e largura de vagem, número de grãos por vagem, número de vagens por planta, peso de 100 grãos verdes, peso úmido e seco de quinze vagens, teor de umidade de vagens e produtividade de vagem verde. Os dados experimentais foram submetidos à análise de variância, análise de componentes principais, análise de correlação linear de Pearson, análise de trilha e análise de agrupamento. A produtividade de vagem verde foi a variável que mais contribuiu para a variabilidade total observada no estudo. A análise de correlação e a análise de trilha demonstraram que a produtividade sofreu maior efeito direto do número de vagem por planta e do peso úmido de quinze vagens. A análise de agrupamento com base na matriz de distâncias de Mahalanobis formou quatro grupos distintos. Os genótipos MNC11-1013E-16, MNC11-1019E-8, MNC11-1020E-16, MNC11-1026E-15 e MNC11-1026E-19 se destacaram com os maiores valores de produtividade de vagem verde.
Palavras-chave:
Vigna unguiculata; Seleção de genótipos; Análise de trilha; Análise de componentes principais; Análise de agrupamento.
INTRODUCTION
Cowpea [Vigna unguiculata (L.) Walp] originates from Africa (HERNITER; MUNOZ-AMATRIAIN; CLOSE, 2020) and has great socioeconomic importance in several regions of Brazil, particularly in tropical and subtropical areas, such as the North and Northeast (SILVA; BRANDÃO; MOREIRA-ARAÚJO, 2025). Throughout Brazil, most family farmers in the North and Northeast regions cultivate cowpea under rainfed conditions (SILVA et al., 2018; SOUZA et al., 2020). However, there is still a demand for the production of cowpea genotypes adapted to the local conditions of southern Tocantins, considering limiting factors such as high temperatures and different growing conditions.
By 2024, Brazil had registered more than 250 varieties of beans, of which more than 50 are cowpea varieties (MAPA, 2025). The genetic diversity of beans is a valuable resource for breeding programs, particularly for creating varieties that are adaptable to different environmental conditions and resistant to pathogens (ALENCAR et al., 2021; PESSOA et al., 2023). The development of new cowpea genotypes with desirable traits makes it possible to consolidate and expand production in the North and Northeast regions of Brazil.
Considering the scarcity of cowpea varieties with desired attributes for green pod production in the Brazilian market, the development of genotypes with traits more suitable for this purpose gains importance (SOUZA et al., 2019). Among the desired attributes for green pod production are the average length of green pods, the mean weight of pods, the number of pods per plant, and green pod yield. Thus, information obtained through the characterization of plants in germplasm bank collections is important for identifying genotypes geared towards higher green pod yield and for the development of new cultivars (SANTANA et al., 2019).
The objective of this study was to evaluate and select superior cowpea genotypes for green pod yield, with potential for use in the southern region of the state of Tocantins, Brazil.
MATERIAL AND METHODS
The first experiment was set up in August 2023 in the municipality of Gurupi, Tocantins, while the second was set up in November 2023 in Dianópolis, Tocantins. The municipality of Gurupi is located in the southern region of the state of Tocantins, at coordinates 11º43’ S and 49º04’ W, with an altitude of approximately 278 meters. Dianópolis, on the other hand, is located in the southeastern region of the state with an altitude of approximately 624 meters. The climate of both locations, according to Köppen’s classification, is tropical with a dry season (Aw), characterized by humid summers and a dry season that extends from May to September. Rainfall and temperature data obtained by NASA Power (SPARKS, 2018) in Gurupi and Dianópolis are presented in Figure 1.

Maximum (red line), average (black line) and minimum (green line) temperature data, as well as rainfall (blue column) in Dianópolis (A) and Gurupi (B), Tocantins states, Brazil, during the experiments in the 2023/24 and 2023 growing seasons, respectively (SPARKS, 2018).
The physical and chemical properties of the soil are described in Table 1. Soil preparation in both areas was carried out conventionally. In Gurupi, sowing fertilization included the application of 600 kg ha-1 of limestone, 30 kg ha-1 of nitrogen in the form of urea, 112.5 kg ha-1 of P2O5 in the form of single superphosphate, and 30 kg ha-1 of K2O in the form of potassium chloride. In addition, 0.1 kg of molybdenum, 1 kg of boron, and 3 kg of zinc were used. Topdressing fertilization with 40 kg ha-1 of nitrogen in the form of urea was carried out 20 days after sowing. In Dianópolis, the application of limestone and fertilization was not necessary due to the good soil fertility (Table 1).
Chemical and physical attributes of soils for the experimental sites in Gurupi and Dianópolis. pH CaCl2 is the hydrogen ion potential in CaCl2 solution, P meh is the available phosphorus by the Mehlich method, K is the potassium content, Ca is the calcium content, Mg is the magnesium content, Al is the aluminum content, H+Al is the potential acidity, O.M. is the organic matter content, O.C. is the organic carbon, and V is the base saturation.
Phytosanitary management was carried out using products recommended for the crop only in Gurupi, while in Dianópolis there was no need due to the absence of pests and diseases. Phytosanitary management products were applied with a backpack sprayer, with a flow rate of 50 L min-1, in two stages. The first application in Gurupi was carried out 21 days after emergence (DAE) and the second 34 DAE, using the insecticide Deltamethrin, aiming at the control of Diabrotica speciosa (cucurbit beetle) and Bemisia tabaci strain B (silverleaf whitefly), at a dose of 120 mL ha-1 of the commercial product. At 40 DAE, control of Euschistus heros (neotropical brown stink bug) was also carried out in Gurupi, using Thiamethoxam (141 g L-1 a.i.) associated with Lambda-cyhalothrin (106 g L-1 a.i.), applied at a dose of 20 mL ha-1 of the commercial product. Weed control was carried out by manual weeding and following the technical recommendations for the crop in the region (TEIXEIRA JUNIOR et al., 2020).
The experiment was conducted in a randomized block design at both locations with four repetitions. Seventeen genotypes and three commercial cowpea cultivars were evaluated, totaling 20 genotypes (Table 2). The evaluated genotypes were provided by Embrapa Meio-Norte. Each experimental plot consisted of four rows, four meters long, with a spacing of 0.40 m between rows. The usable area was delimited by the two central rows, disregarding 0.50 m from each end to minimize border effects. Subsequently, plants were thinned 20 days after sowing, at the V4 development stage (third trifoliate leaf, with expanded leaflets) to 8 plants per meter. This resulted in a population of 200,000 plants per hectare.
Cowpea genotypes evaluated in Gurupi and Dianópolis. ML stands for mulatto subclass, EG stands for evergreen subclass, and CA stands for canapu subclass.
Harvesting was carried out manually when the plants in each treatment were at the end of the R8 stage (after pod filling and approximately 40 days after emergence). After harvesting, the pods were grouped and packed in paper bags to protect them from physical damage during transport and storage until they were evaluated. The following traits were evaluated: length (PL, in cm) and width (PW, in cm), average of 15 pods measured in each plot using a ruler and caliper, respectively; average number of grains per pod (NGP), which is the ratio between the total number of grains and the number of pods; number of pods per plant (NPP), which was evaluated by counting the average number of pods produced by 15 plants in each plot; moisture content of the pods (PMC, in %), which was determined according to the method of the Adolfo Lutz Institute (IAL, 2008), by drying the pods in an oven at 105 °C until reaching constant weight; wet weight of pods (WW, in g), obtained by weighing 15 pods before drying.; dry weight of pods (DW, in g), measured by weighing 15 pods after the drying process; weight of 100 green grains (W100G, in g), determined by weighing a sample of 100 beans for each plot; and green pod yield (GY, in kg ha-1), obtained by weighing the pods harvested in the plot and extrapolated to an area of one hectare.
The data were analyzed using individual analysis of variance, and it was verified that the grouping of the two experiments was possible according to Hartley's maximum F test (PEARSON; HARTLEY, 1956). Thus, the joint analysis of variance was performed considering the following statistical model:
where yijk is the response variable, μ is the effect of the overall mean, ω k(i) is the effect of the k-th block within the i-th environment, αi is the effect of the i-th environment, βj is the effect of the j-th genotype, αβij is the effect of the genotype x environment interaction, and ɛijk is the effect of random error. When necessary, means were compared using the Scott-Knott test (1974) at a 5% probability level. The coefficient of variation was calculated for each trait using the expression:
where MSResidual is the mean square of the residual and X̅ is the overall mean of the trait.
Principal component analysis was used to study the importance of traits on the total variability of the data. The highest absolute value of the linear correlation coefficient between a trait and the principal component indicates the trait that has the greatest contribution to this component (REGAZZI; CRUZ, 2020). The number of principal components was determined using Kaiser's criterion (KAISER, 1958), which determines that the selected components must be associated with eigenvalues greater than 1 (λi > 1) (REGAZZI; CRUZ, 2020).
To determine the genetic divergence between genotypes, the Mahalanobis distance matrix was obtained and the genotypes were grouped into a dendrogram, which was performed based on the UPGMA method (Unweighted Pair-group Method using Arithmetic Averages). The number of groups was determined using Mojena's criterion (MOJENA, 1977). The UPGMA method is categorized as hierarchical and agglomerative, where lower distances between materials indicate that genotypes are genetically closer, while higher distances signal a greater discrepancy between genotypes (CRUZ; CARNEIRO; REGAZZI, 2014). An advantage of the UPGMA method is that it seeks to maximize the cophenetic correlation coefficient, which reduces the distortion in the representation of similarities between genotypes in the dendrogram (SOKAL; ROHLF, 1962).
A Pearson linear correlation analysis was performed between the variables to study the relationship between them. To further develop the linear correlation analysis, a path analysis was used to investigate the effect of each variable on green pod yield. All analyses were performed and graphs were constructed using R software (R CORE TEAM, 2025).
RESULTS AND DISCUSSION
The Genotype x Environment (G x E) interaction was significant for pod length (PL, in cm), number of grains per pod (NGP), and weight of 100 green grains (W100G, in g) (Table 3). The G x E interaction was not significant for pod width (PW, in cm), number of pods per plant (NPP), wet weight of pods (WW, in g), dry weight of pods (DW, in g), pod moisture content (PMC, in %), and green pod yield (GY, in kg ha-1) (Table 3). Considering the traits for which the G x E interaction was not significant, the genotype effect was significant for number of pods per plant (NPP), pod wet weight (WW, in g), and green pod yield (GY, in kg ha-1) (Table 3). The significant G x E interaction demonstrates the importance of selecting genotypes adaptable to different growing conditions, combined with appropriate agronomic practices, to promote sustainable and efficient production (TORRES FILHO et al., 2017; ARAÚJO et al., 2024). On the other hand, the non-significant interaction facilitates the selection of genotypes for a given region (CRUZ; CARNEIRO; REGAZZI, 2014).
Summary of the joint analysis of variance for pod length (PL, in cm), pod width (PW, in cm), number of grains per pod (NGP), number of pods per plant (NPP), pod wet weight (WW, in g), pod dry weight (DW, in g), weight of 100 green grains (W100G, in g), pod moisture content (PMC, in %) and green pod yield (GY, in kg ha-1) of cowpea genotypes grown.
Pod length showed the lowest coefficient of variation (5.28%, Table 3), indicating greater experimental precision (PESSOA et al., 2023). In contrast, green pod yield showed the highest coefficient of variation (36.79%), suggesting greater variability among genotypes for this trait. The presence of this variability among genotypes for green pod yield is also confirmed by principal component analysis (Table 4).
Linear correlation coefficient, eigenvalue and percentage of cumulative explained variance and linear correlation coefficient between the variables pod length (PL) and pod width (PW), number of grains per pod (NGP), number of pods per plant (NPP), wet weight of fifteen pods (WW) and dry weight (DW) of fifteen pods, weight of 100 green grains (W100G), pod moisture content (PMC) and green pod yield (GY) with the principal components PC1, PC2, PC3 and PC4. The highest absolute correlation value for each principal component is in bold, highlighting the variable with the greatest contribution to each component.
Mean pod length (PL) was 21.68 cm, a value higher than those reported by Públio Júnior et al. (2017) and Pessoa et al. (2023), who observed means of 17.25 cm and 17.51 cm, respectively. However, there were no significant differences for PL among genotypes in the experiment conducted in Dianópolis (Figure 3A). In Gurupi, the genotypes MNC11-1013E-15, MNC11-1013E-16, MNC11-1013E-33, MNC11-1020E-16, MNC11-1026E-19, and MNC11-1034E-2 showed the highest PL values (Figure 3B). The results for the pod width (PW) trait show greater homogeneity among the locations, since the G x E interaction was not significant (Table 3). There was also no statistically significant difference between the genotypes for this characteristic (Figure 2A). Similar results are presented by Oliveira, Castro, and Lima (2019), who highlighted the greater variability in pod length as a function of the growing environment, while the width showed greater stability.

Bar graph for pod width (PW, in cm), number of pods per plant (NPP), wet weight of pods (WW, in g), dry weight of fifteen pods (DW, in g), pod moisture content (PMC, in %) and green pod yield (GY, in kg ha-1) of cowpea genotypes grown. Different letters indicate a significant difference between the means by the Scott-Knott test (p-value < 0.05).
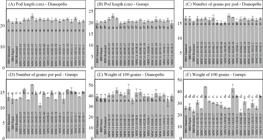
Pod length (PL, in cm), number of grains per pod (NGP) and weight of 100 green grains (W100G, in g) of cowpea genotypes. Different letters indicate a significant difference between the means by the Scott-Knott test (p-value < 0.05).
The number of grains per pod (NGP) averaged 15.20 grains, a value higher than those found by Públio Júnior et al. (2017) and Pessoa et al. (2023). There was no significant difference between genotypes in the experiment carried out in Dianópolis (Figure 3C). In Gurupi, the MNC11-1013E-35 genotype stood out for having the highest number of grains per pod (Figure 3D). The second group with the highest average number of grains per pod in Gurupi was formed by nine experimental genotypes and no control, highlighting the superiority of these genotypes compared to the commercial ones (Figure 3D).
For the trait number of pods per plant (NPP), the mean was 10.38 pods with a coefficient of variation of 33.89% (Table 3). The genotypes MNC11-1013E-16, MNC11-1019E-8, MNC11-1020E-16, MNC11-1026E-15, and MNC11-1026E-19 showed the highest means for this trait (Figure 2B). The overall mean NPP was higher than the value reported by Públio Júnior et al. (2017), who observed a mean of 9 pods per plant. However, it was lower than the value observed by Alencar et al. (2021), of 22.90 pods per plant. Públio Júnior et al. (2017) attributed the lower observed NPP value to the influence of temperature during the flowering period, which was close to 25 ºC, since high temperatures influence flower abortion, pod setting, and final pod retention, also affecting the number of grains per pod. In Gurupi, the mean temperatures were close to 30 ºC, while in Dianópolis, the mean temperatures were around 25 ºC (Figure 1).
For the traits wet weight (WW) and dry weight (DW) of fifteen pods, the G x E interaction was not significant (Table 3). No statistically significant difference was observed between genotypes for dry weight of the pods (Figure 2C). For WW, there was a significant difference for genotypes, where it is possible to observe a higher mean for half of the genotypes (Figure 2D). It is noteworthy that in this group of ten genotypes, nine are experimental and only one is commercial (Figure 2D). The wet weight of the pod is an important indicator of commercial quality and commercial acceptance, impacting aspects such as appearance, texture, flavor and post-harvest durability, reinforcing the importance of environments that favor the accumulation of wet mass (ALMEIDA; SILVA; CARDOSO, 2016). The overall mean wet weight of fifteen pods was 139.06 g (Table 3), which is higher than that found by Pessoa et al. (2023).
For the weight of 100 green grains (W100G), the mean was 35.11 g, higher than the value of 22.59 g found by Públio Júnior et al. (2017). The G x E interaction was significant for this trait (Table 3). In Gurupi, the genotypes MNC11-1013E-33 and MNC11-1022E-58 stood out, being superior to the others (Figure 3F). In Dianópolis, ten experimental genotypes outperformed the commercial testers, with the highest mean W100G recorded in this location (Figure 3E).
The results obtained for pod moisture content (PMC, in %) showed that the G x E interaction was not significant (Table 3), and the genotype effect was also not significant (Table 3 and Figure 2E). This indicates that the genotype response is stable in relation to this trait, regardless of where and which genotype was cultivated. For green pod yield (GY, in kg ha-1), the G x E interaction was also not significant. However, it is possible to identify that the genotypes MNC11-1020E-16 (8,822.29 kg ha-1), MNC11-1013E-16 (8,615.49 kg ha-1), MNC11-1026E-19 (8,066.33 kg ha-1), MNC11-1026E-15 (7,496.51 kg ha-1) and MNC11-1019E-8 (7,283.03 kg ha-1) were superior to the others (Figure 2F). The overall mean green pod yield was 5,836.66 kg ha-1 (Table 3). These results exceeded the values found by Souza et al. (2019), who obtained an overall mean of 1,760.15 kg ha-1 and Torres Filho et al. (2017), who presented an overall mean of 2,451.96 kg ha-1. It is noteworthy that the plant density in both experiments was 100,000 plants ha-1 (SOUZA et al., 2019; TORRES FILHO et al., 2017).
Principal component analysis (PCA) was used to study the influence of each trait on the total observed variability. The first four components, following Kaiser's criterion (KAISER, 1958), were considered in the selection of the principal components. These first four components explained approximately 83.20% of the total variability of the data (Table 4). The Pearson linear correlation coefficient between each component and the traits under study represents the individual contributions of each trait to the total variability observed in the study (REGAZZI; CRUZ, 2020). Thus, the trait with the greatest relative importance will be the one with the highest absolute correlation value (REGAZZI; CRUZ, 2020). Considering the first four components, the traits that contributed the most were green pod yield in PC1, weight of 100 green grains (W100G) in PC2, dry weight of pods (DW) in PC3, and number of grains per pod (NGP) in PC4 (Table 4). The traits pod length (PL) and number of pods per plant (NPP) also showed a high linear correlation with the first component (Table 4). Therefore, these traits are considered to be the main traits responsible for the total variability observed in the study.
With Pearson's linear correlation analysis, it is possible to observe the presence or absence of linear relationships between traits and whether these correlations are significant using Student's t-test (Figure 4). Among the significant correlations, we can highlight the strong and positive correlation (0.98) between the number of pods per plant (NPP) and green pod yield (GY; Figure 4). Therefore, aiming to increase yield, genotypes with a higher number of pods per plant should be selected. Green pod yield also showed a positive correlation (0.65) with pod length (Figure 4). Pod length had positive correlations with pod wet weight (0.58) and number of pods per plant (0.56) (Figure 4). Aliyu et al. (2022) also observed a significant positive linear correlation of the number of pods per plant and pod length with grain yield.

Estimated Pearson linear correlation coefficient between the traits pod length (PL) and width (PW), number of grains per pod (NGP), number of pods per plant (NPP), wet weight of fifteen pods (WW) and dry weight (DW) of fifteen pods, weight of 100 green grains (W100G), pod moisture content (PMC) and green pod yield (GY). Coefficients marked with “x” in the figure are non-significant values by the Student's t-test, while the others are significant.
We can observe several important correlations that help us understand the biology and yield of green pods in cowpea. The positive correlation of the number of pods per plant (0.56) and the wet weight of the pod (0.58) with pod length (Figure 1) suggests that plants that produce longer pods tend to have a greater number of pods and a greater pod weight. This makes sense, as larger pods generally have more space to develop grains, increasing their weight and consequently contributing to greater pod yield of the plant. These correlations demonstrate the interdependence of different morphological traits of the plant, highlighting the importance of each in determining the final yield.
Path analysis allows for decomposing the Pearson linear correlation coefficient between the traits under study and green pod yield (Table 5). To validate the path analysis, a multicollinearity check was performed between the variables using the condition number (CN) (MONTGOMERY; PECK, 2012). When CN ≤ 100, multicollinearity is considered weak, and as the value increases, the classification changes, being considered moderate to strong when 100 < CN < 1000 and severe when CN ≥ 1000 (MONTGOMERY; PECK, 2012). In the presence of multicollinearity, the variances associated with certain estimators, such as path coefficients, which measure the direct effects of explanatory variables on a main variable, can reach very high values (CRUZ; CARNEIRO; REGAZZI, 2014). Very high variance values are evidence of unreliable estimates and, consequently, no biological interpretation (MONTGOMERY; PECK, 2012).
Path analysis where the dependent variable was green pod yield (GY, kg ha-1) and the independent traits were pod length (PL) and width (PW), number of grains per pod (NGP), number of pods per plant (NPP), wet weight (WW) and dry weight (DW) of fifteen pods, and weight of 100 green grains (W100G). The effects in bold on the diagonal are the direct effects, and those outside the diagonal are the indirect effects. At the end of each row, the Pearson linear correlation coefficient of each variable with green pod yield is presented. VIF represents the variance inflation factor.
A condition number of 330.65 was obtained when considering the path analysis in which the dependent variable was green pod yield and all other characteristics of this study were independent variables. When analyzing the variance inflation factor (VIF) values, it was observed that the highest value was obtained for the pod moisture content (PMC) trait. Thus, a new path analysis was performed removing this trait (PMC) and obtaining a condition number equal to 10.64 (Table 5). It is observed that VIF values remained below 10, which allows us to conclude that there is no multicollinearity in the remaining traits (Table 5).
Path analysis demonstrates that the traits with the greatest direct positive effect on green pod yield were the number of pods per plant (NPP) and pod wet weight (WW; Table 5). The direct negative effects (PW, DW and W100G) were insignificant for green pod yield, since their values were close to zero. Aliyu et al. (2022) found that the traits with the greatest direct effects in path analysis on grain yield were the number of pods per plant and seed weight. Therefore, path analysis reinforces the selection of genotypes with a higher number of pods per plant and higher pod wet weight to increase green pod yield.
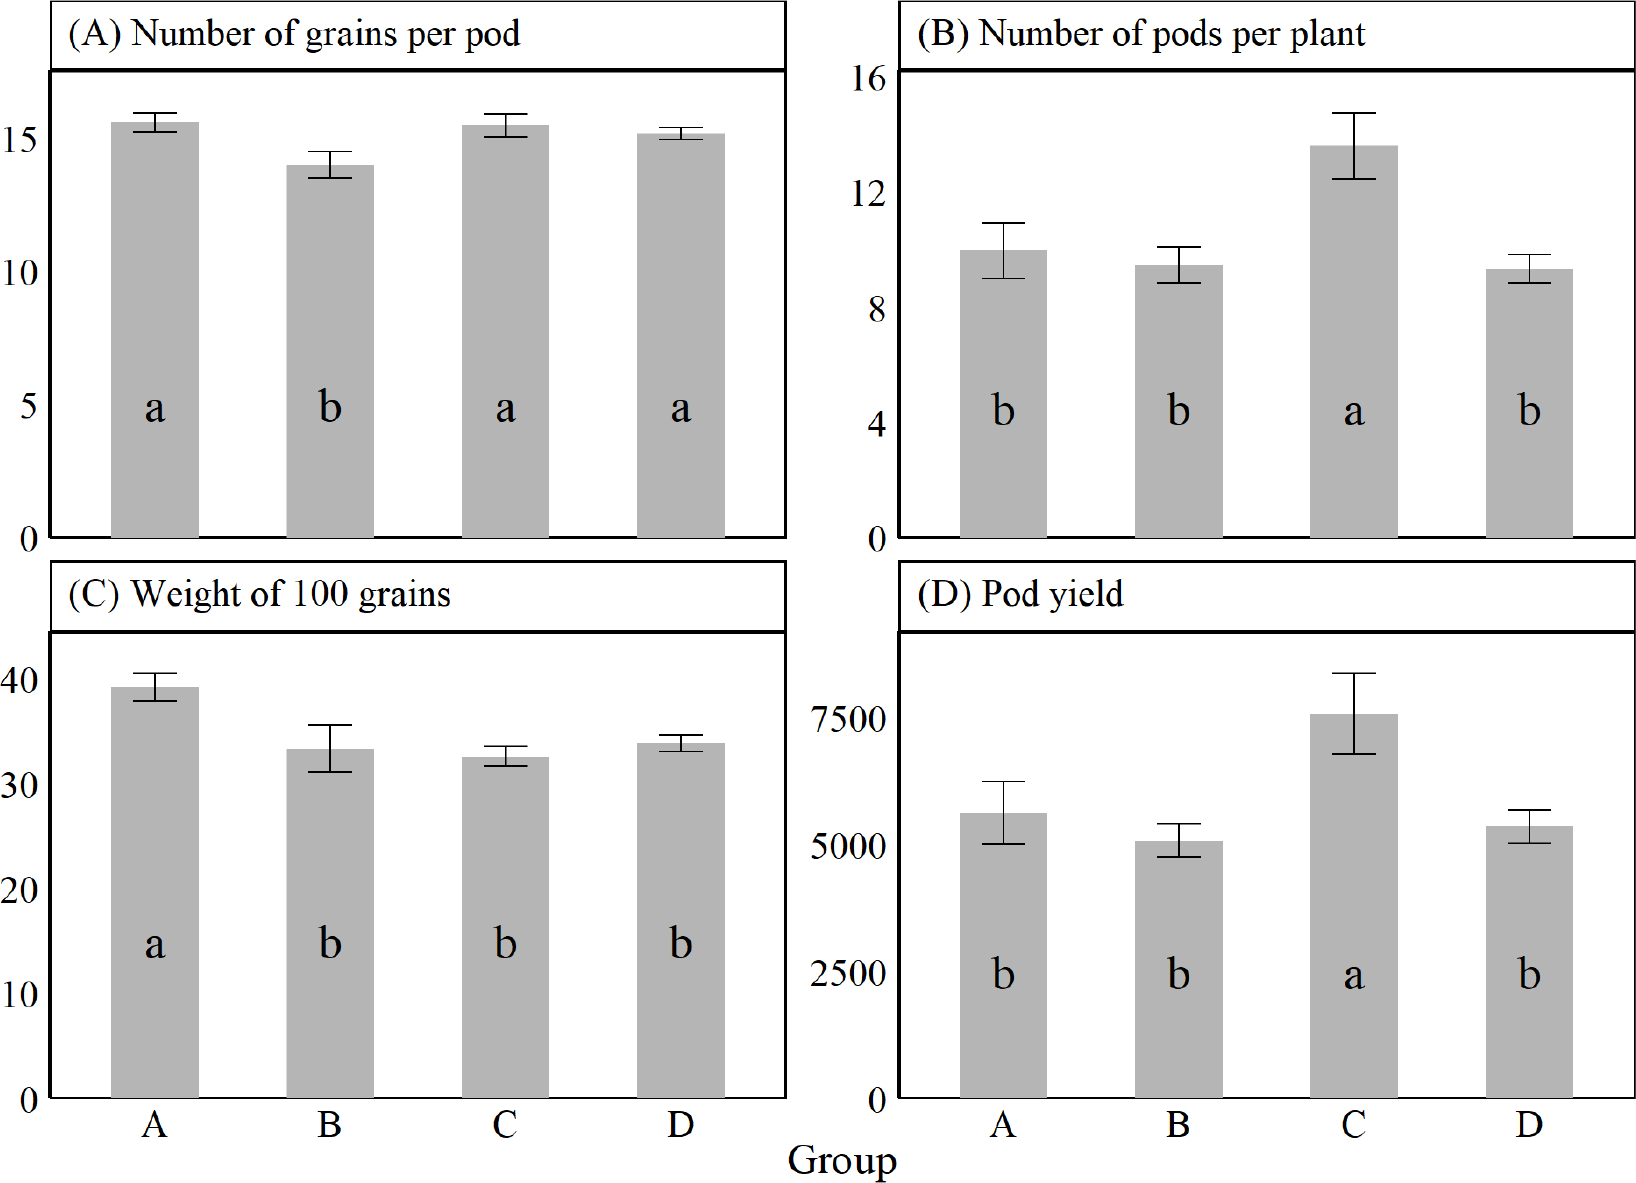
Based on the Mahalanobis distance matrix, the cluster analysis using the UPGMA method divided the twenty evaluated genotypes into four distinct groups, according to Mojena's criterion (Figure 5). The first group (A) is composed of six genotypes, the second group (B) of three genotypes, the third group (C) of four genotypes, and the fourth group (D) of seven genotypes (Figure 5). The means of the traits among the groups formed were compared using the Scott-Knott test (Figure 6). The means for the traits pod length, pod width, pod wet weight, pod dry weight, and pod moisture content were equal among the groups formed. Therefore, the traits that discriminate the groups formed are the number of grains per pod, number of pods per plant, weight of 100 green grains, and green pod yield (Figure 6).

Cluster analysis of the set of genotypes evaluated. Clustering was performed using the UPGMA method and the Mahalanobis distance matrix between genotypes. The genotypes were divided into four groups, with the cutoff point being 27.65 according to Mojena's (1977) criterion. Group A was formed by the genotypes MNC11-1052E-3, MNC11-1022E-58, MNC11-1024E-1, MNC11-1013E-33, MNC11-1026E-19, and MNC11-1013E-35; group B was formed by the genotypes MNC11-1019E-46, MNC11-1019E-12, and BRS Rouxinol; group C was formed by the genotypes BRS Pajeú, MNC11-1026E-15, MNC11-1020E-16, and MNC11-1013E-16; and group D was formed by the genotypes MNC11-1034E-2, BRS Marataoã, MNC11-1091E-8, MNC11-1031E-11, MNC11-1013E-15, MNC11-1031E-5 and MNC11-1018E-17.

Bar graph for the traits that showed a significant difference between the means of the groups formed. Different letters indicate a significant difference between the means by the Scott-Knott test (p-value < 0.05).
Group B, which was formed by the genotypes MNC11-1019E-46, MNC11-1019E-12, and BRS Rouxinol, had the lowest mean among the groups for the number of grains per pod (Figure 6A). The other groups showed higher means that were equal to each other (Figure 6A). Group A had the highest mean for the trait weight of 100 green grains (Figure 6C). This group included the genotypes MNC11-1052E-3, MNC11-1022E-58, MNC11-1024E-1, MNC11-1013E-33, MNC11-1026E-19, and MNC11-1013E-35 (Figure 5).
For the traits number of pods per plant and green pod yield, group C had the highest mean in both characteristics (Figures 6B and 6D). The coincident result of the Scott-Knott test between the clusters for NPP and GY reflects the strong and positive correlation found between these two traits (Figure 4). The last three genotypes showed some of the highest means for green pod yield and number of pods per plant (Figure 2).
In general, a certain agreement was observed in the grouping of genotypes in relation to the analyzed traits. The cluster analysis made it possible to identify genetically contrasting materials with potential for future crosses in breeding programs, aiming at obtaining even more productive genotypes with other desirable characteristics.
CONCLUSIONS
There is genetic diversity among the evaluated genotypes and potential for selecting genotypes for green pod yield in the southern region of Tocantins. The genotypes MNC11-1013E-16, MNC11-1019E-8, MNC11-1020E-16,
MNC11-1026E-15, and MNC11-1026E-19 stood out with the highest green pod yield values. Future crosses can be carried out between genotypes from divergent groups, such as the genotypes from group B (MNC11-1019E-46 and MNC11-1019E-12) and group A (MNC11-1013E-16 and MNC11-1020E-16).
ACKNOWLEDGEMENTS
We thank the Coordenação de Aperfeiçoamento de Pessoal de Nível Superior (CAPES) for the financial support.
Data Availability:
The data that support the findings of this study can be made available, upon reasonable request, from the corresponding author.
REFERENCES
- ALENCAR, F. R. G. et al. Parental selection and descriptor evaluation in the identification of superior cowpea genotypes. Agronomia Colombiana, 39: 313-321, 2021.
- ALIYU, O. M. et al. Variance components, correlation and path analyses in cowpea (Vigna unguiculata L., Walp). Journal of Crop Science and Biotechnology, 25: 173-182, 2022.
- ALMEIDA, R. T.; SILVA, J. F.; CARDOSO, L. G. Qualidade de grãos de feijão-caupi em diferentes sistemas de manejo. Revista Brasileira de Agricultura, 41: 215-228, 2016.
- ARAÚJO, L. B. R. et al. Recommendation of cowpea genotypes based on adaptability, stability and grain darkening. Revista Ciência Agronômica, 56: 1-9, 2024.
- CRUZ, C. D.; CARNEIRO, P. C. S.; REGAZZI, A. J. Modelos biométricos aplicados ao melhoramento genético 3. ed. Viçosa, MG: Editora UFV, 2014. 668 p.
- HERNITER, I. A.; MUNOZ-AMATRIAIN, M.; CLOSE, T. J. Genetic, textual, and archeological evidence of the historical global spread of cowpea (Vigna unguiculata [L.] Walp.). Legume Science, 2: 1-10, 2020.
- IAL - Instituto Adolfo Lutz. Métodos físico-químicos para análise de alimentos 4. ed. São Paulo, SP: Instituto Adolfo Lutz, 2008. 1020 p.
- KAISER, H. F. The varimax criterion for analytic rotation in factor analysis. Psychometrika, 23: 187-200, 1958.
-
MAPA - Ministério da Agricultura, Pecuária e Abastecimento. Registro Nacional de Cultivares - RNC Available at: <https://sistemas.agricultura.gov.br/snpc/cultivarweb/cultivares_registradas.php>. Access on: Sep. 21, 2025.
» https://sistemas.agricultura.gov.br/snpc/cultivarweb/cultivares_registradas.php - MOJENA, R. Hierarchical grouping methods and stopping rules: an evaluation. The Computer Journal, 20: 359-363, 1977.
- MONTGOMERY, D.; PECK, E. Introduction to linear regression analysis 5. ed. New York: John Wiley e Sons, 2012. 679 p.
- OLIVEIRA, M. E.; CASTRO, S. A.; LIMA, V. O. Comparação de genótipos de feijão-caupi em sistemas de produção distintos. Revista Agroecologia, 10: 78-90, 2019.
- PEARSON, E. S.; HARTLEY, H. O. Biometrika tables for statisticians 3. ed. Cambridge: Biometrika Trust, 1956. 238 p.
- PESSOA, A. M. S. et al. Genetic parameters and selection indices of cowpea genotypes for green grain production. Revista Caatinga, 36: 310-319, 2023.
- PÚBLIO JÚNIOR, E. et al. Características agronômicas de genótipos de feijão-caupi cultivados no sudoeste da Bahia. Científica, 45: 223-230, 2017.
-
R CORE TEAM. R: A language and environment for statistical computing R Foundation for Statistical Computing. Vienna: R Foundation for Statistical Computing. 2025. Available at: <https://www.r-project.org/>. Access on: Sep. 21, 2025.
» https://www.r-project.org/ - REGAZZI, A. J.; CRUZ, C. D. Análise multivariada aplicada 1. ed. Viçosa, MG: Editora UFV, 2020. 401 p.
- SANTANA, S. R. A. et al. Genetic divergence among cowpea genotypes by morphoagronomic traits. Revista Caatinga, 32: 841-850, 2019.
- SCOTT, A. J., KNOTT, M. A Cluster Analysis Method for Grouping Means in the Analysis of Variance. Biometrics, 30: 507-512, 1974.
- SILVA, D. T. S.; BRANDÃO, A. C. A. S.; MOREIRA-ARAÚJO, R. S. R. Avaliação do potencial tecnológico do feijão-caupi no desenvolvimento de produtos alimentícios: uma revisão integrativa. Aracê, 7: 2849-2858, 2025.
- SILVA, M. B. O. et al. Desempenho agronómico de genótipos de feijão-caupi. Revista de Ciências Agrárias, 41: 201-210, 2018.
- SOKAL, R. R.; ROHLF, F. J. The comparison of dendrograms by objective methods. Taxon, 11: 30-40, 1962.
- SOUZA, K. N. et al. Avaliação de genótipos de feijão-caupi para a produção de grãos verdes em Mossoró-RN. Colloquium Agrariae, 15: 9-14, 2019.
- SOUZA, P. J. O. P. et al. Trocas Gasosas do Feijao-Caupi Cultivado no Nordeste Paraense em Resposta à Deficiência Hídrica Forçada Durante a Fase Reprodutiva. Revista Brasileira de Meteorologia, 35: 13-22, 2020.
- SPARKS, A. H. nasapower: A NASA POWER Global Meteorology, Surface Solar Energy and Climatology Data Client for R. The Journal of Open Source Software, 3: 1-3, 2018.
- TEIXEIRA JUNIOR, D. L. et al. Ocorrência de plantas daninhas na cultura do feijão-caupi sob quatro manejos na Amazônia Ocidental. Nativa, 8: 427-435, 2020.
- TORRES FILHO, J. et al. Genotype by environment interaction in green cowpea analyzed via mixed models. Revista Caatinga, 30: 687-697, 2017.
-
Editor in Chief:
Aurélio Paes Barros Júnior
-
Section Editor:
Lindomar Maria da Silveira