 Variability characterization of a gold tailings deposit considering piezocone soundings interpretation
Abstract
Geotechnical properties vary spatially owing to their mineralogical composition, stress history, and deposition processes, even within homogeneous soil layers. This high degree of variability imposes considerable limitations on the calculation and simulation of models based on deterministic parameters extracted from the field. Mine tailings exemplify this scenario, where the difficulty of sample extraction and laboratory characterization further complicates the challenges. Consequently, field investigation becomes a crucial factor in determining the behavior to be used in geomechanical models. To address this issue, this study focuses on quantifying statistical parameters, including the mean, standard deviation, probability density function, and fluctuation scale-scarce in the literature-derived from direct measurements of piezocone tests and related strength parameters. The results indicate that despite the high variability of the deposit, after a careful profile evaluation considering the characteristic behavior of coarse and fine materials, it was feasible to evaluate the adherence of both normal and lognormal distributions for strength parameters. The fluctuation scales also show high dispersion, ranging from 0.1 to 3.3 meters. This research contributes to a comprehensive understanding of the spatial variability in mine tailings and provides practical insights for future applications.
Keywords:
site investigation; tailings; statistical characterization; random fields.
1. Introduction
The influence of soil variability on slope stability and the structural response of large constructions is widely acknowledged (Griffiths et al., 2012). Using homogeneous soil models for deterministic or probabilistic analyses to represent strength and stiffness may lead to nonconservative outcomes due to the inherent randomness in soil properties (Liu et al., 2018). In such scenarios, random field theory becomes an essential tool in slope stability analysis, allowing for a more realistic depiction of the randomness and failure modes of soil properties.
Various approaches have been proposed in literature to account for spatial variability in soils during slope stability analysis and foundation problems. Among these methods, the random field finite element method (RFEM), introduced by Fenton and Griffiths (2008), stands out as a widely accepted approach (Belo et al., 2022). It involves generating random fields of soil properties via the local average subdivision (LAS) method and employs finite element analysis for stress and strain computations.
Despite the progress made in implementing routines that facilitate the modeling of random soil properties, many reported cases still rely on theoretical data to define appropriate statistical characterizations, such as theoretical Probability Density Functions (PDFs) and correlation structures. To address these data limitations, piezocone tests, which provide continuous measurements along a vertical profile, offer a substantial dataset that enables the establishment of reliable relationships and minimizes potential biases in statistical and probabilistic applications (Salgado et al., 2015).
Within this context, this article delves into the statistical characterization of key parameters, including the mean (μ), coefficient of variation (COV), fluctuation scales (ρv), and characteristic probability density functions (PDFs), by analyzing piezocone data soundings. A series of tests conducted on a gold mining tailings storage facility (TSF) that belongs to the Fazenda Brasileiro Mine, located in the eastern region of Bahia state, northern Brazil, is considered in this study. Statistical analysis considering parameters, such as the cone tip resistance qc, sleeve friction fs, and excess pore pressure u2, and their residual values (after trend removal), were derived. Additionally, after a careful profile evaluation considering the characteristic behavior of coarse and fine materials, strength parameters were derived, and the adherence of both normal and lognormal distributions was investigated. The obtained results contribute to a comprehensive understanding of spatial variability in mine tailings and provide practical insights for future applications.
2. Site characterization
2.1 General view
The Tailings Storage Facility (TSF) that belongs to the Fazenda Brasileiro Mine, is located in northeastern Brazil in the eastern portion of Bahia state, 180 km north-northwest of the state capital city of Salvador. The Fazenda Brasileiro mine has been the subject of a research project to explore the geomechanical behavior of tailings over the years. This project included site evaluation, field exploration, and laboratory testing. Characterization in the field comprises eleven (11) different investigation islands, from which samples were collected (for characterization). Triaxial and oedometer tests, along with in situ tests, such as conventional piezocone tests (CPTu), piezocone with seismic measurements (SCPTu), seismic dilatometer tests (SDMT), and vane tests, were performed.
Laboratory tests revealed a predominantly silty sand material with an average in situ solid content of approximately 30% (by weight) and an in situ water (w) content of 35%. The material is characterized as low to nonplastic with a high specific gravity (Gs) ranging from 2.79 to 3.30 g/cm3. Triaxial tests were performed under monotonic loading under both compression and extension. The tests were conducted on reconstituted samples, and an effective critical state friction angle (φ') of approximately 30 degrees was defined. The complete characterization of laboratory tests can be found in Bedin et al. (2012), Schnaid et al. (2013) and Nierwinski (2019). Field characterization considering piezocone tests is discussed in more detail herein, since it was considered to define the statistical characterization of the deposit.
2.2 Piezocone test interpretation
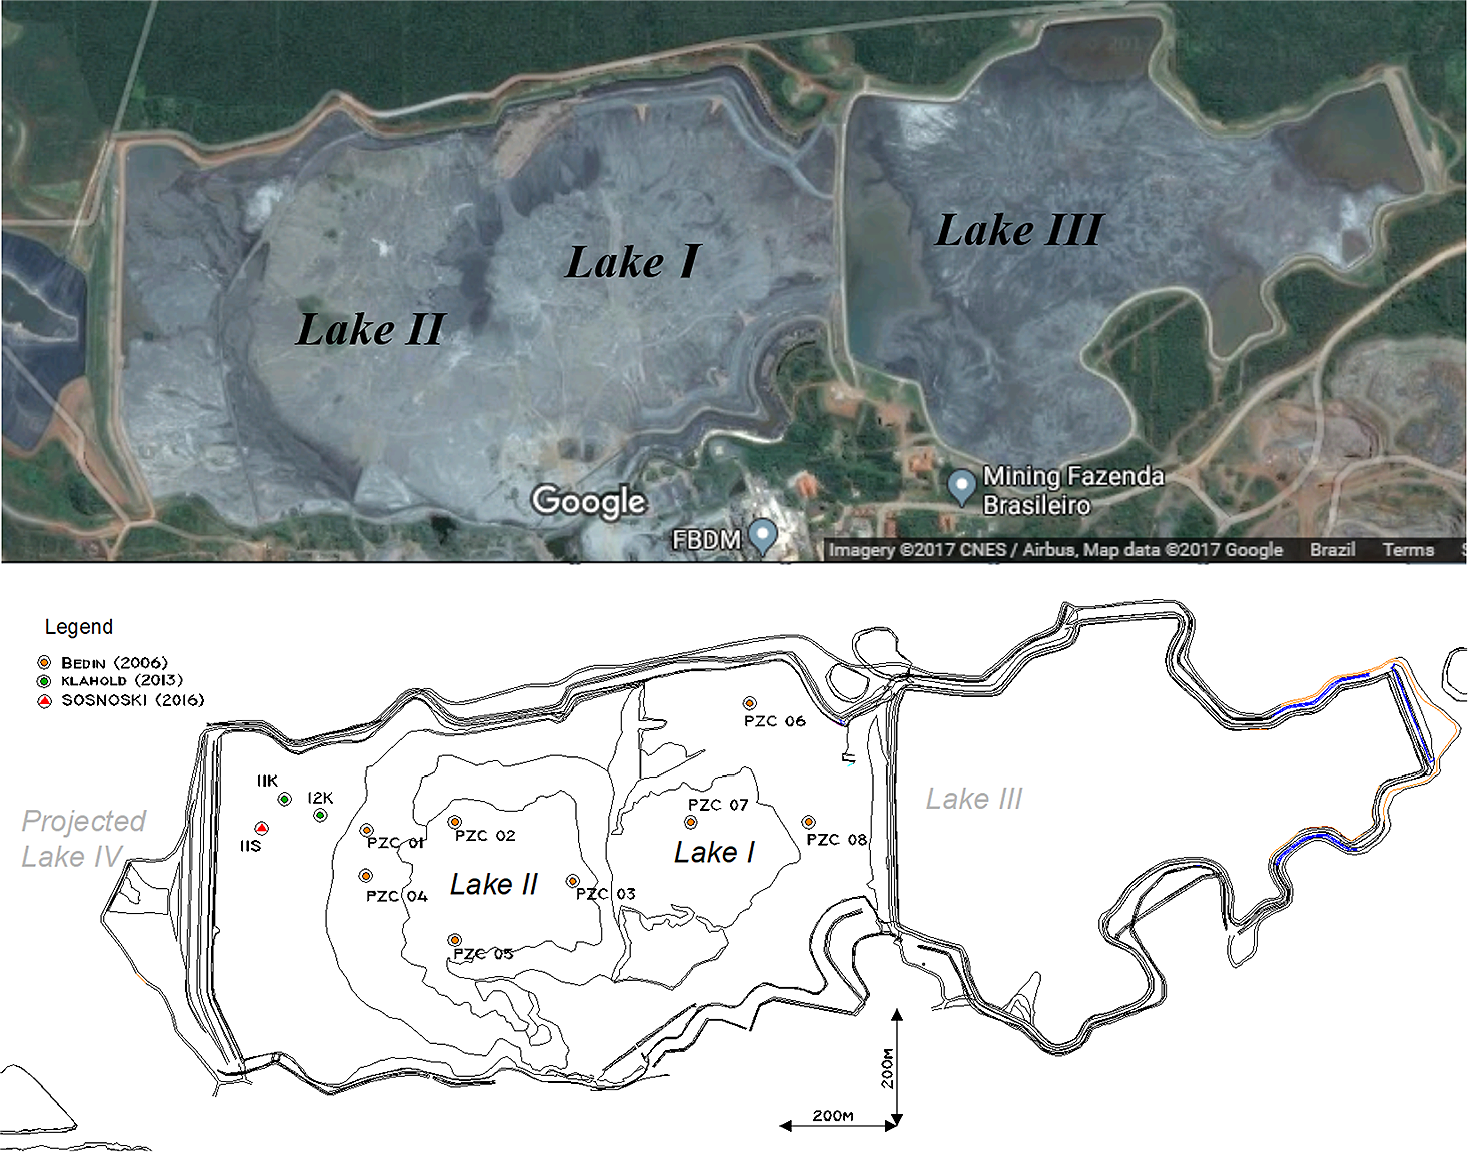
Piezocone tests in the field were considered to investigate the general mechanical behavior of the deposit through the execution of standard tests (at a standard velocity of 20 mm/s) followed by a set of tests with varying penetration rates to define the general behavior considering drainage. Recent research has explored the influence of rate effects on in situ tests, including both piezocone (CPTu) and seismic dilatometer tests (SDMT) (Schnaid et al., 2016; Schnaid et al. 2020; Mafra and Dienstmann, 2022; Dienstmann et al., 2017, 2018a, 2018b; 2024). The present article focuses on the statistical characterization of the deposit for spatial variability modeling, particularly in the context of vertical spatial variability. The following nomenclature is used to represent piezocone tests from different campaigns: PZC01 to PZC08 from Bedin (2010); I1K and I2K from Klahold (2013); and I1S from Sosnoski (2016). Figure 1 presents a general view and location of the investigated islands.
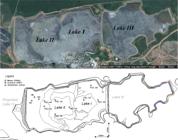
General view and location of site investigation clusters at the Fazenda Brasileiro tailings dam.
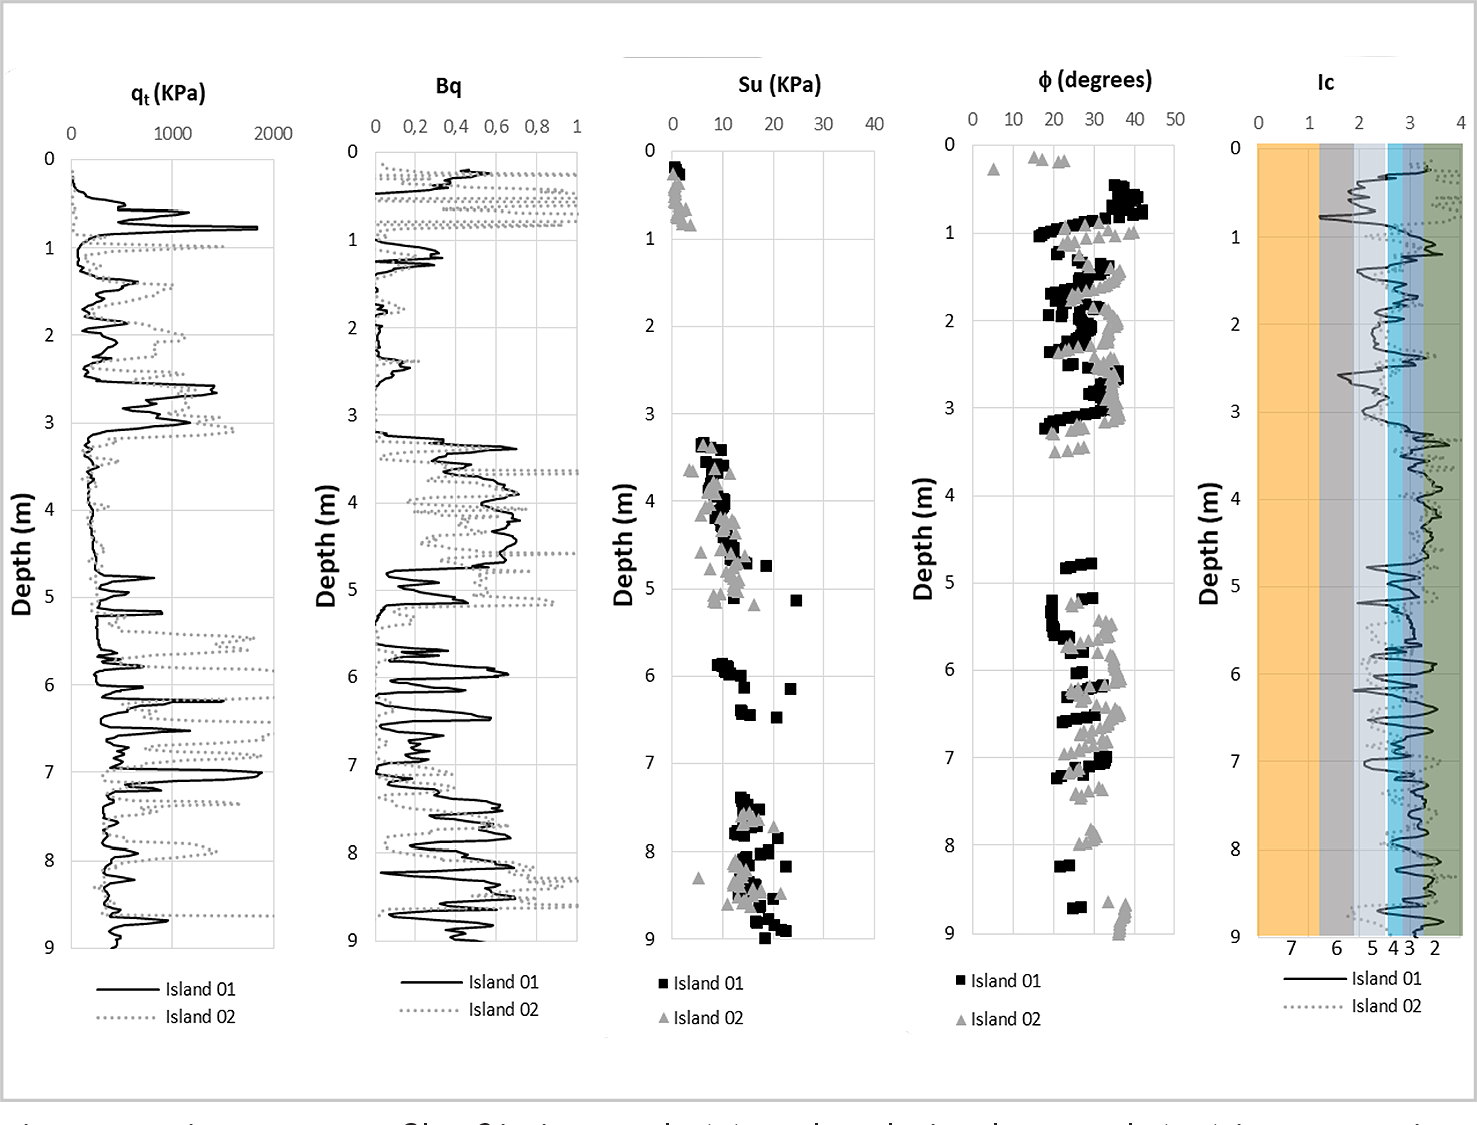
To assess the spatial variability of the site, a direct comparison of piezocone tests from various investigation islands was performed, as shown in Figure 2. Dienstmann et al. (2018a) categorized the results into two characteristic behaviors: coarse and fine particles. Soundings exhibiting coarse particle behavior (labeled PZC02, PZC03, and PZC05) were carried out in the central portion of the deposit, with elevations of 359 m and a water table depth of 7 m. In this region, borehole tests revealed higher cone penetration resistance, qt (total tip resistance), lower pore pressure, u2 (pore pressure measured at the cone shoulder position), a reduced pore pressure ratio, Bq (Bq=(u2 - u0)/(qt - σ’v)), in which u0 is the hydrostatic pore pressure and σ’v is the effective vertical stress), and lower sleeve friction values (fs). In contrast, the outer part of the deposition lake, with elevations ranging from 352 to 356 m and containing fine particles, presented a lower cone total tip resistance (qt), a greater undrained response (higher u2 and Bq), and increased sleeve friction (fs). Soundings displaying these characteristics are labeled PZC01, PZC04, PZC06, PZC07, PZC08, IK01, IK02, and IS01. These differences are a result of the depositional process, with coarse particles settling from the slurry during transport, whereas finer particles settle only when they reach the still water of the decant.

The characteristic behavior of the coarse and fine materials, as defined by Dienstmann et al. (2018a), was utilized to determine the resistance parameters. Piezocone penetration data were employed to derive the effective friction angle (φ’) and undrained shear strength (Su) via established correlations from literature, e.g., the solutions proposed by Kulhawy and Mayne (1990), Mayne and Campanella (2005), and the Norwegian University of Science and Technology (NTNU) method described by Senneset et al. (1988; 1989).
For friction angle determination, the approaches of Kulhawy and Mayne (1990), Mayne and Campanella (2005), and the Norwegian University of Science and Technology (NTNU) method (Senneset et al., 1988; 1989) were considered, with Equations 1 for clean sands and Equation 2 for mixed soil types. Equation 1 was applied when the Bq values were less than 0.1, whereas Equation 2 was used for Bq values ranging from 0.1--1. The undrained shear strength (Su) was determined via Equation 3 when the Bq values were greater than 0.4, indicating undrained behavior. Equation 3 allows for the direct determination of Su based on the cone factor Nkt, which can be derived through direct comparison with vane shear test results (Schnaid, 2008):
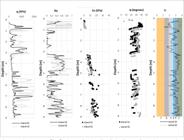
In these equations, qt represents the total tip resistance, σv0 and σ’v0 are the total and effective vertical stresses, respectively, and Nkt is a correction coefficient. The undrained shear strength was determined from calibrations against vane tests in finer material yielding an Nkt factor of 12 (Klahold 2013, Dienstmann et al. 2018a). Figure 3 illustrates the outcomes of the resistance parameters derived from investigations on islands I1K and I2K. It depicts a variation in the undrained shear strength (Su) ranging from approximately 5 to 25 kPa and friction angles ranging from 20 to 42 degrees. Furthermore, the figure presents a Soil Behavior Type (SBT) classification index (Ic), according to Robertson and Wride (1998), which demonstrates the suitability of the Su calculations for regions 3 and 2, corresponding to clay and organic clays.
Considering the high variability of the material, the next section presents the statistical quantification of the main parameters of this specific site.
3. Statistical characterization
The statistical characterization of gold tailings variability was carried out for each vertical standard piezocone sounding. A total of eleven (11) soundings were evaluated, each providing a varying number of measurements, ranging from 370 to 1047. This characterization involved calculating the mean values, coefficient of variation (COV), and vertical scale of fluctuation for measurements, including cone resistance (qc), sleeve friction values (fs), and pore pressure (u2). The analysis also included the assessment of residual values. The probability density functions (PDFs) for each parameter, as well as the derived friction angle and undrained shear strength, were investigated.
Basic statistics (means and standard deviations) of the test measurements were computed via spreadsheet software, which was also used to implement methods for determining the vertical fluctuation scales. The following approaches were implemented: Vanmarcke’s expedition method (VXP), theoretical autocorrelation fitting models (AMFs), and direct integration of the sample autocorrelation function (SAI).
A fundamental step for the implemented methods (VXP, AMF and SAI) is the calculation of the autocorrelation function (ρ), as shown in Eq. (4), which is derived from the covariance (C) between the separation distance (τ) and the target parameter. The covariance is obtained via Eq. (5), and the separation distance is calculated via Eq. (6) (Salgado et al., 2015).
where μX is the mean value of X, i.e., the data of interest; j ≥ 1 is the total number associated with the separation distance; ∆z is the minimum distance between two consecutive points; and C(τ1) is the covariance for the null separation distance.
Autocorrelation fitting models (AMFs) are mathematical expressions that define the relationship between separation distance and autocorrelation. In geotechnical practice, the most widely adopted models-namely, the exponential, second-order Markov, and exponential cosine functions-are summarized in Table 1. However, there is no autocorrelation model that undoubtedly stands out in relation to the others (Milan and Dienstmann, 2025). These theoretical models should be directly compared with the experimental autocorrelation values computed via Eq. (4). In general, the parameter θ is varied within the mathematical equations to achieve the best fit between the experimental (field) curves and the theoretical models. An R2 analysis can be used to optimize the functions and quantify the quality of the fit.
The direct integration of the sample autocorrelation function SAI method also relies on the sample autocorrelation data calculated via Eq. (4) to determine the fluctuation scale. According to this method, which is supported by Salgado et al. (2019), the autocorrelation distance (θ) can be estimated as twice the area under the positive portion of the sample autocorrelation function (ρ).
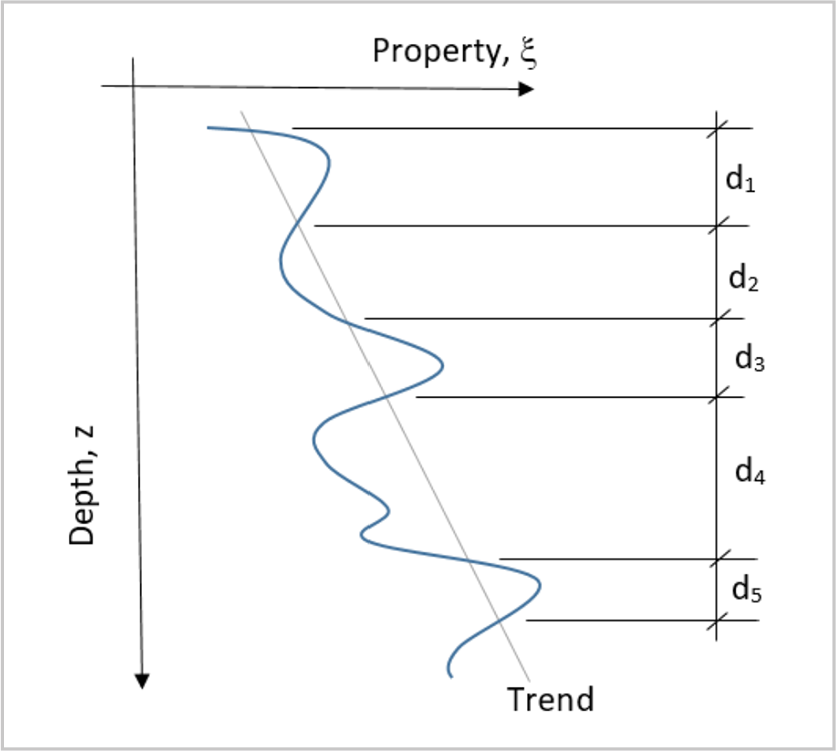
In Vanmarcke’s expedition method (VXP), it is assumed that the fluctuation scale can be correlated with the trend line related to the variation in the parameter along the soil profile (Figure 4). The estimation of the fluctuation scale is performed by evaluating the crossing distance between the trend line and the results obtained from the test.
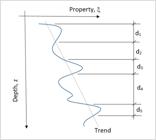
To determine the fluctuation scale value via the VXP, which is based on cone test resistance, Kenarsari, Chenari, and Eslami (2013) proposed the following equations:
where d is the average crossing distance and θ is the fluctuation scale value.
The evaluation of the fitted probability density functions (PDFs) involves direct comparisons between the histograms of the empirical data and the theoretical probability density functions, which are supported by quantile-quantile (Q-Q) plots. The analysis of the PDFs was performed via RStudio, an open-source software environment that supports statistical computing through a wide range of built-in functions and user-contributed packages. Further details are provided in Section 3.3.
3.1 Mean and COV
Table 2 presents an overview of the results for the mean and COV across the evaluated islands. The mean values of qc ranged from 392.50 to 4467.74 kPa, the fs mean values ranged from 3.13 to 34.40 kPa, and the u2 mean values ranged from 36.52 to 132.88 kPa. The COVs and residual COVs (COVres), which were calculated after the measurement trend was removed (see Figure 5a), ranged from 0.18 to 5.27 (equivalent to 18% to 527%). Notably, the values obtained after removing trends, known as COVres, displayed statistics similar to those of the pure parameters of the deposit. This observation is consistent with the findings of Uzielli et al. (2005), who noted changes in variability when normalized parameters were used. Compared with the range of variation reported in literature for cone penetration test (CPT) measurements, Liu and Chen (2010) reported COV values ranging from 0.65 to 2.55 for qc and 0.46 to 2.16 for fs across a range of sandy, silty, and clayey materials.
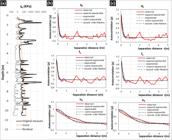
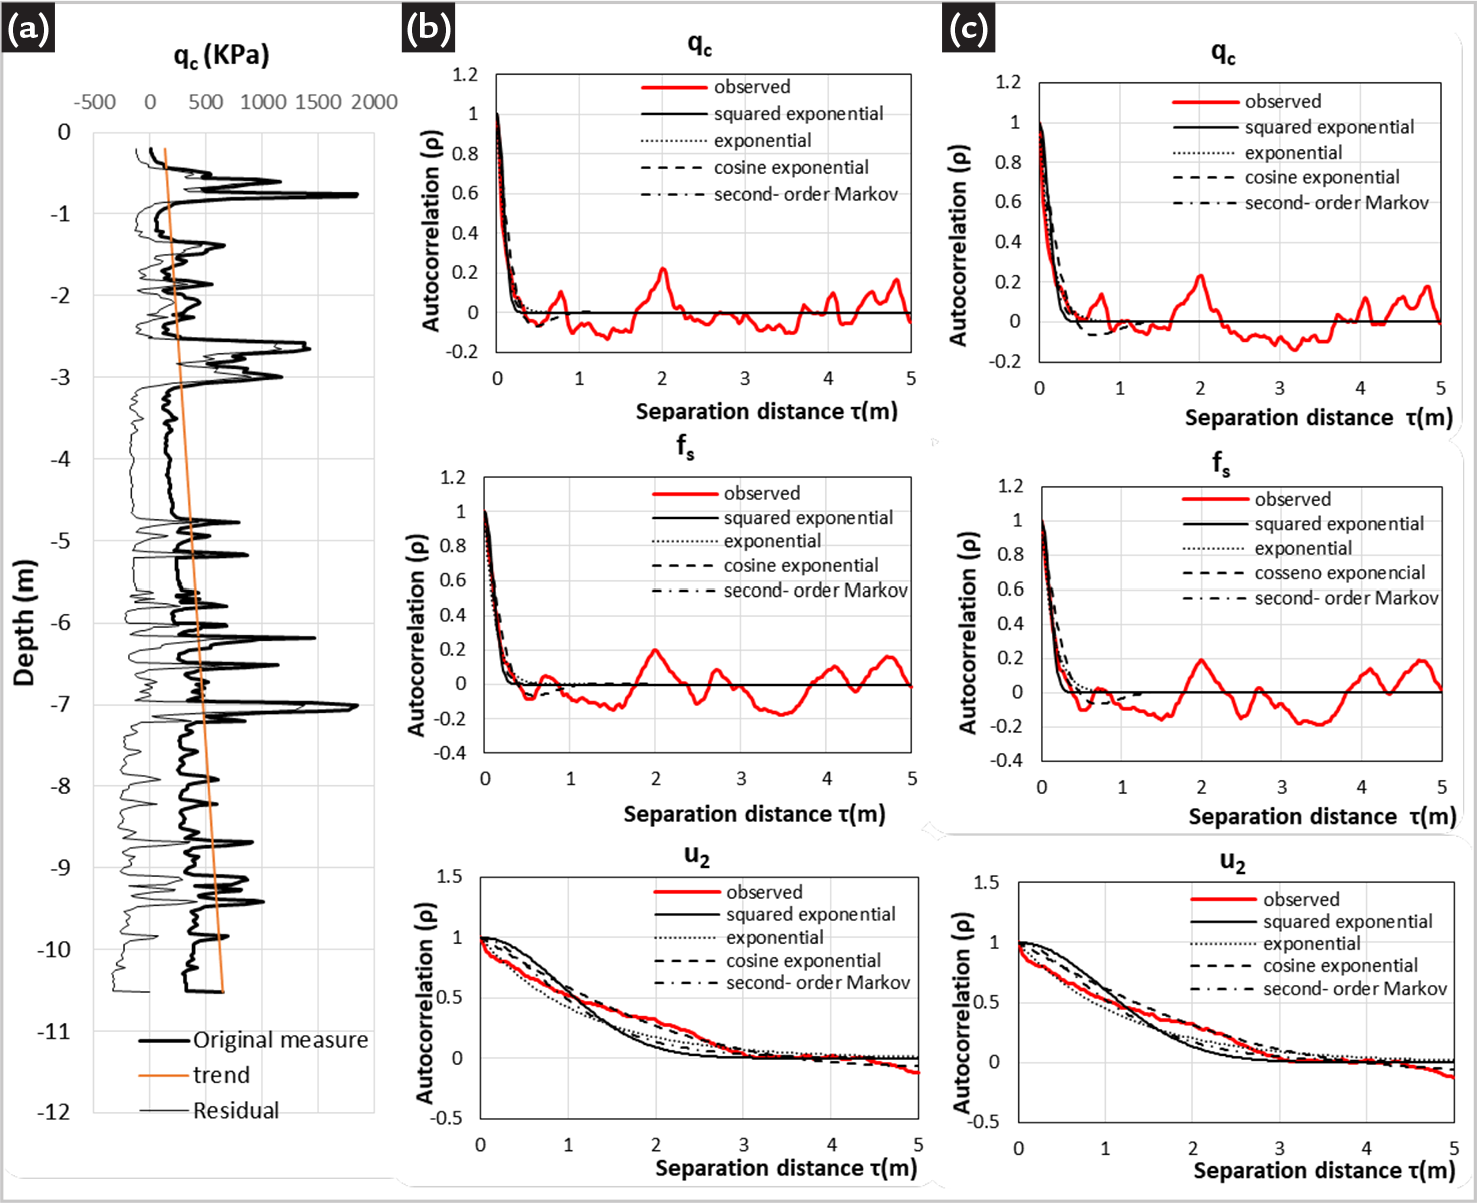
Variability analysis: (a) typical definition of trend and residual values for qc; (b) autocorrelation functions considering original measurements; and (c) autocorrelation functions considering residual values.
In a study by Villavicencio et al. (2011) on Chilean copper mine tailings, both laboratory and dynamic penetration tests were employed to examine variability. The authors reported a wider range of COV values, extending from 0.02 to 8.22, indicating a higher level of dispersion, as observed in the gold tailings of Fazenda Brasileiro. Moreover, Villavicencio et al. (2011) used dynamic tests to estimate the coefficients for friction and predict its variability, a method that parallels the approach detailed in Section 3.3.
3.2 Vertical scales of fluctuation
The standard autocorrelation function ρ(τ), commonly referred to as the autocorrelation function (ACF), was employed to calculate the vertical scales of fluctuation, denoted as θv and measured in meters. These calculations were based on parameters, such as qc, fs, and u2 and their residuals. The process involves the use of theoretical autocorrelation fitting models (AMFs) to determine correlation lengths. In addition to AMFs, the classical Vanmarcke’s method (VXP) and direct integration of the sample autocorrelation function (SAI) were considered to ensure robust results (for definitions, see Uzielli et al., 2005; Kenarsari et al., 2013; Tan et al., 2020; and Zhang et al., 2021). To ensure the significance of the fit of AMFs, only functions producing R2 > 0.9, with at least four initial autocorrelation coefficients greater than , were accepted, where rb = 1.96 / ⊡ nb is the number of data points of a given profile (Uzielli et al., 2005).
Table 3 compiles the calculated values obtained from each of the referenced methods and presents average values for each sounding. These values range from 0.1 to 3.3 meters. The results reveal a general consensus between the SAI and AMF methods, although some disparities are observed when the VXP is used. Notably, the calculated values considering the original data and residual values displayed very similar correlation scales. These methods can be visualized in Figure 5, which uses data from a typical result as an illustrative example. Figure 5a depicts the definitions of the trend and residual values, alongside the measured data. The average tip resistance (qc) clearly increases with depth (z). To address this trend, a linear function (e.g., qc = az + b, where 'a' and 'b' are fitting parameters) was applied to fit the CPTu data. After removing the trend component (az + b) from the original CPTu data, the residual tip resistance forms a stationary random field with a zero-mean, as commonly used in random field theory for stationary fields (Fenton and Griffiths, 2008).
Figures 5b and 5c highlight the determination of correlation lengths for qc, fs, and u2. The figures consider both the measurement (Figure 5b) and residual values (Figure 4c). Notably, when observing the scales calculated for each evaluated parameter, there is a greater dispersion when considering the pore pressure measurement u2. In contrast, scales derived from qc and fs measurements tend to exhibit more consistent values.
3.3 Probability density functions
To establish appropriate statistical laws to model the variability of the tailings data, histogram representations of parameters qc, fs and u2 were explored and directly compared with theoretical probability density functions (PDFs). Table 2 provides a summary of the statistical data and the best-fit PDFs for each sounding. When considering the measurements qc, fs and u2, the analysis revealed that the great variability of the material led to different potential applications of the PDFs. The analysis was performed in RStudio software and prioritized the examination of normal, lognormal, exponential, gamma, and Weibull functions and PDFs with established applications in the geotechnical engineering literature. RStudio is an integrated development environment (IDE) for the R programming language, a free software environment for statistical computing and graphics (R Core Team, 2023). The analysis involved the use of various packages, including ggplot2 and fitdistrplus.
The analysis considering measurements of the tests is discussed in more detail in Dienstmann et al. (2023) and (2024). However, among the evaluated soundings, some parameters for some piezocone profiles were possibly in accordance with the lognormal distribution (e.g., qc and fs data for I1K and PZC03), whereas for the same soundings, a normal distribution was more appropriate for modeling u2 data. A normal distribution appears to be more suited to model qc, fs, and u2 measurements for islands PZC05 and PZC06. In some cases, the exponential distribution proved to be adequate for modeling certain parameters in specific soundings, such as qc in I1S, I2K, and PZC08. However, the high variability of the material in some soundings made it challenging to determine the best representation function, as indicated in Table 2.
Considering the high variability of the measurements, the profiles were separated into characteristic behaviors, and the adherence of the theoretical functions was analyzed, considering the typical behavior of coarse and fine materials. This analysis was performed by deriving values of the friction angle and undrained shear strength through classical literature proposals (Equations 1 and 2).
For the derived strength parameters, Figure 6 visually presents the distributions of the calculated friction angles and undrained shear strengths. This presentation is accompanied by histogram plots and theoretical functions, complemented with quantile plots (Q-Q plots). Q-Q plots are valuable for comparing the distribution of a variable with a selected theoretical distribution. A good fit is indicated when the points on the graph approximately form a straight line.
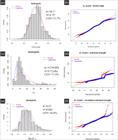
The friction angle, as shown in Figure 6a and 6b, is generally well represented by either a normal or lognormal distribution with a mean value of 30.1 degrees and a standard deviation of 4.71 degrees (COV = 15.7%). Importantly, the correlations considered to determine the friction angle, Equations 1 and 2, have not been developed for tailings and must be carefully evaluated for various applications. For the present data, a good match was observed between the average calculated value of 30.1 degrees and the average value obtained from triaxial tests by Bedin (2010) and Nierwinski (2019), which was approximately 30 degrees. In this way, the obtained distribution was considered consistent. Furthermore, the observed variation was consistent with literature, which indicates variations of approximately 5-20% for the effective friction angle obtained for different mine tailings through laboratory tests (Baecher and Christian, 2003).
For the undrained shear strength (Figure 6c and 6d), two analyses were performed: derived parameter (Su) and normalized parameter by the vertical effective stress (Su / σ’v0), as shown in Figure 6c and 6d. Considering the undrained shear strength, the lognormal distribution was deemed more appropriate for representing the general distribution, which was characterized by a mean value of 12.94 kPa and a standard deviation of 9.74 kPa (COV=71.9%).
For modeling the normalized undrained strength (Figures 6e and 6f), both normal and lognormal distributions showed adherence, considering the direct analysis of the histogram representation (Figure 6e), although the Q-Q plots (Figure 6f) showed a better fit when the lognormal distribution was considered. Another advantage of adopting the lognormal distribution is that it does not return negative values. This should be taken into account for future applications, especially considering the high dispersion of the undrained strength. Furthermore, the dispersion was reduced when the undrained resistance parameter was normalized. In this case, the distribution was characterized by a COV of 36.8%, in contrast to the value of 71.9% obtained by direct analysis of the undrained resistance. The mean values, standard deviations, and coefficients of variation are presented in the accompanying figure.
Recently, Becker et al. (2024) presented statistical data that characterize the variability in the undrained shear strength of iron tailings from Germano dam, which is located in the town of Mariana, Minas Gerais state, Brazil. The authors performed a careful analysis to separate the data from several profiles and analyzed the distribution of the normalized undrained shear strengths. Only the layers considered to have plastic behavior were analyzed, and the influence of layer thickness was also examined. The results revealed that the distribution of the Su / σ’v0 ratio of the plastic tailings from the Germano dam is lognormal and that the thicker a layer of plastic tailings is, the lower its Su / σ’v0 and its variability. The variation range of the Su / σ’v0 ratio obtained by the authors was 0.11-0.24, with COVs ranging from 29-47%, values that are generally consistent with those obtained in the present study, with a mean Su / σ’v0 ratio of 0.25 and a COV of 36.8%.
4. Discussion and conclusions
The present study aims to analyze the spatial variability of mine tailings deposits via piezocone testing data. Statistical parameters were derived from measurements of piezocone testing data, such as cone tip resistance (qc), sleeve friction (fs), and excess pore pressure (u2), as well as their residual values (after trend removal). Results showed that the variation ranges considering the coefficient of variation (COV) were similar when the original measurements and residual values were considered, ranging from 0.18 to 5.27 (equivalent to 18% to 527%). This high variation range is as expected and is consistent with what has been reported in literature.
Based on the measurements from the tests (qc, fs and u2), the adherence to the theoretical functions was also analyzed, and this analysis was performed for each profile. The results showed that the high variability of the deposit makes it difficult to define a single representative function. Therefore, the approach was to separate behaviors and analyze the adherence to theoretical functions while considering the typical behavior of fine and coarse materials. This analysis was performed by deriving values for the friction angle and undrained shear strength through classical literature proposals.
Although the classical literature proposals for deriving strength parameters, especially from the friction angle, were developed for natural materials, they were used for characterizing the strength parameters of gold mine tailings and proved to be adequate, since they resulted in predicted average values for the friction angle that were very close to those characterized in the laboratory. In this sense, their use was considered valid for analyzing the distribution of strength parameters. After this validation, the adherence to normal and log-normal theoretical distributions was verified. Both methods are suitable for use, with characteristic values of means of 30.1 degrees and a standard deviation of 4.72 degrees, resulting in a COV of approximately 15%, which is consistent with the variation ranges indicated in literature for frictional parameters.
To evaluate the undrained shear strength, the pore pressure ratio (Bq) was used to separate data in profiles with drained (coarse) and undrained (fine) behavior. The distribution of Su obtained via this separation resulted in a mean value of 12.94 kPa with a standard deviation of 9.74 kPa (COV = 71.9%). Normalizing the undrained shear strength by effective stress proved useful, significantly reducing data dispersion (COV = 36.8%) and allowing better visualization of the adequacy of the theoretical functions.
With respect to the fluctuation scale, the dispersion of the results was large, as expected. The analysis was validated by calculating both the scales from test measurements and their residual values. The calculation of residual values can be understood as a method that removes the expected trend of parameter increases, such as qc, along the depth because of the self-weight of the materials and should be preferred over other normalizations for analyzing fluctuation scales (vertical dispersion).
Finally, the present study aims to contribute tools for the statistical characterization of variability through the use of piezocone tests. The presented approach can be applied to profiles of natural materials and is not limited to the statistical characterization of mine tailings deposits.
Acknowledgement
The authors would like to thank the Federal University of Santa Catarina UFSC, which provided the necessary structure for carrying out the research. Thanks are extended also to the National Council for Scientific and Technological Development (CNPq), Coordination for the Improvement of Higher Education Personnel (CAPES) and Santa Catarina Research Foundation (FAPESC) for financial support.
-
Funding information
Conselho Nacional de Desenvolvimento Científico e Tecnológico Processo: 408889/2021-7.
Data availability
The datasets generated during and/or analyzed during the current study are available from the corresponding author upon reasonable request.
References
- BAECHER, G.; CHRISTIAN, J. Reliability and statistics in geotechnical engineering. John Wiley & Sons Ltd, The Atrium, Southern Gate, Chichester, West Sussex PO19 8SQ, England, 2003.
-
BECKER, L. B.; AGUIAR, A. L. S.; LACERDA, W. A. Variability of the undrained strength of the plastic tailings from the Germano dam in Mariana, Brazil. Geomechanics and Geophysics for Geo-Energy and Geo-Resources, v. 10, n. 25, 2024. Disponível em: https://doi.org/10.1007/s40948-024-00750-4
» https://doi.org/10.1007/s40948-024-00750-4 - BEDIN, J. Estudo do comportamento geomecânico de resíduos de mineração. 2010. 207 f. Tese (Doutorado) - Universidade Federal do Rio Grande do Sul. Escola de Engenharia. Programa de Pós-Graduação em Engenharia Civil. Porto Alegre, RS, Brasil, 2010.
-
BEDIN, J.; SCNHAID, F.; FONSECA, A. J. P. V.; COSTA FILHO, L. M. Gold tailings liquefaction under critical state soil mechanics. Geotechnique, v. 62, n. 3, p. 263-267, 2012. Disponível em: https://doi.org/10.1680/geot.10.P.037
» https://doi.org/10.1680/geot.10.P.037 -
BELO, J. L. dos P.; QUEIROZ, P. I. B. DE .; SILVA, J. L. da . Geostatistical-based enhancement of RFEM regarding reproduction of spatial correlation structures and conditional simulations. Soils and Rocks, v. 45, n. 4, p. E2022076121, 2022. DOI: https://doi.org/10.28927/SR.2022.076121
» https://doi.org/10.28927/SR.2022.076121 -
DIENSTMANN, G.; MAGHOUS, S.; SCHNAID, F. Theoretical analysis and finite element simulation for nonlinear poroelastic behavior of cylinder expansion in infinite media under transient pore-fluid flow conditions. International Journal of Geomechanics, v. 17, n. 7, 2017. Disponível em: https://doi.org/10.1061/(ASCE)GM.1943-5622.0000834
» https://doi.org/10.1061/(ASCE)GM.1943-5622.0000834 -
DIENSTMANN, G.; SCHNAID, F.; MAGHOUS, S.; DEJONG, J. Piezocone penetration rate effects in transient gold tailings. Journal of Geotechnical and Geoenvinronmental Engineering, v. 144, n. 2, p. 04017116, 2018a. Disponível em: https://doi.org/10.1061/(ASCE)GT.1943-5606.000182
» https://doi.org/10.1061/(ASCE)GT.1943-5606.000182 -
DIENSTMANN, G.; MAGHOUS, S.; SCHNAID, F. Assessment of rate effects in piezocone tests from poroelastic cavity expansion analysis. Soils and Rocks, v. 41, n.3, p. 319-332, 2018b. Disponível em: https://doi.org/10.28927/SR.413319
» https://doi.org/10.28927/SR.413319 -
DIENSTMANN, G.; ZIESMANN, N.; MEIER, A. L.; PASA, J. P. Análise da variabilidade inerente através de ensaios de piezocone: aplicação a resíduos de mineração. Contribuciones a Las. Ciencias Sociales, v. 16, n.11, p. 28547-28564, 2023. Disponível em: https://doi.org/10.55905/revconv.16n.11-227
» https://doi.org/10.55905/revconv.16n.11-227 -
DIENSTMANN, G.; PERINI, L.; MEIER, A.L.; ZIESMANN, N.; PASA, J.P. Incorporating inherited variability into drainage effect analysis of piezocone tests in gold tailings. Geotechnical Engineering (Proceedings of the ICE), 2024. Disponível em: https://doi.org/10.1680/jgeen.23.00082
» https://doi.org/10.1680/jgeen.23.00082 - FENTON, G. A.; GRIFFITHS, D. V. Risk assessment in geotechnical engineering. Hoboken: John Wiley and Sons Ltd., 2008. ISBN 0470178205.
- KENARSARI, A. E.; CHENARI, R. J.; ESLAMI, A. Characterization of the correlation structure of residual CPT profiles in sand deposits. International Journal of Civil Engineering, v. 11, n. 1, p. 29-37, 2013.
- KLAHOLD, P.A. Interpretação de ensaios de campo em solos com permeabilidade intermediária. 2013. 103 f. Dissertação (Mestrado) - Universidade Federal do Rio Grande do Sul. Escola de Engenharia. Programa de Pós-Graduação em Engenharia Civil. Porto Alegre, RS, Brasil, 2013.
- KULHAWY, F.H.; MAYNE, P. W. Manual on estimating soil properties for foundation design, Report EPRI EL6800, Electric Power Research Institute, Palo Alto, California, 1990, 306 p.
-
LIU, C. N.; CHEN, C. H. Spatial correlation structures of CPT data in a liquefaction site. Engineering Geology, 111, n. 1-4, p. 43-50, 2010. Disponível em: https://doi.org/10.1016/j.enggeo.2009.12.002
» https://doi.org/10.1016/j.enggeo.2009.12.002 -
LIU; Y.; ZHANG, W.; ZHANG, L.; ZHU, Z.; HUE, J.; WEI, H. Probabilistic stability analyses of undrained slopes by 3D random fields and finite element methods. Geoscience Frontiers, v. 9, n. 6, p. 1657-1664, 2018. Disponível em: https://doi.org/10.1016/j.gsf.2017.09.003
» https://doi.org/10.1016/j.gsf.2017.09.003 -
MAFRA, V.; DIENSTMANN, G. Cavity expansion solutions applied to help assess the partial drainage behavior characterization of the piezocone test. Computers and Geotechnics, v. 152, p. 105017, 2022. Disponível em: https://doi.org/10.1016/j.compgeo.2022.105017
» https://doi.org/10.1016/j.compgeo.2022.105017 - MAYNE, P. W.; CAMPANELLA, R. G. Versatile site characterization by seismic piezocone, INTERNATIONAL CONFERENCE ON SOIL MECHANICS AND GEOTECHNICAL ENGINEERING, 16, v. 2 (Osaka), p. 721-724l. [Proceedings…]. Millpress, Rotterdam, The Netherlands, 2005.
-
MILAN, H.; DIENSTMANN, G. Assessment of vertical spatial variability in a marine sedimentary deposit based on standard penetration tests. Marine Georesources & Geotechnology, 1-11, 2025. DOI: https://doi.org/10.1080/1064119X.2025.2481494
» https://doi.org/10.1080/1064119X.2025.2481494 - NIERWINSKi, H. P. Caracterização e comportamento geomecânico de rejeitos de mineração. 2019. 230 f. Tese (Doutorado) - Universidade Federal do Rio Grande do Sul. Escola de Engenharia - Programa de Pós-Graduação em Engenharia Civil. Porto Alegre, RS, Brasil, 2019.
- ROBERTSON, P. K.; WRIDE, C. E. Evaluating cyclic liquefaction potential using the cone penetration test. Canadian Geotechnical Journal, v. 35, n. 3, p. 442-459, 1998.
-
R CORE TEAM. R: a language and environment for statistical computing. R Foundation for Statistical Computing, Vienna, Austria, 2023. Disponível em: <https://www.R-project.org/>
» https://www.R-project.org/ - SALGADO, R.; PREZZI, M.; GANJU, E. Assessment of site variability from analysis of cone penetration test data. West Lafayette, IN: Purdue University, 2015.
- SALGADO, R.; GANJU, E.; PREZZI, M. Site variability analysis using cone penetration test data, Computers and Geotechnics, Elsevier, v, 105, p, 37-50, Jan. 2019,
-
SCHNAID, F. In situ testing in geomechanics: the main tests. CRC Press, 2008. DOI: https://doi.org/10.1201/9781482266054
» https://doi.org/10.1201/9781482266054 -
SCHNAID, F.; BEDIN, J.; VIANA DA FONSECA, A. J. P.; COSTA FILHO, Moura, L. Stiffness and strength governing the static liquefaction of tailings. Journal of Geotechnical and Geoenvironmental Engineering, v. 139, n. 12, p. 2136-2144, 2013. Disponível em: https://doi.org/10.1061/(ASCE)GT.1943-5606.000092
» https://doi.org/10.1061/(ASCE)GT.1943-5606.000092 -
SCHNAID, F.; ODEBRECHT, E.; SOSNOSKI, J. and ROBERTSON, P.K. Effects of test procedure on flat dilatometer test (DMT) results in intermediate soils. Canadian Geotechnical Journal. 53(8): 1270-1280, 2016. https://doi.org/10.1139/cgj-2015-0463
» https://doi.org/10.1139/cgj-2015-0463 -
SCHNAID, F.; DIENSTMANN, G.; ODEBRECHT, E.; MAGHOUS, S. A simplified approach to normalization of piezocone penetration rate effects. Geotechnique, v. 70, n. 7, p. 630-635, 2020. Disponível em: https://doi.org/10.1680/jgeot.18.T.033
» https://doi.org/10.1680/jgeot.18.T.033 - SENNESET K.; SANDVEN, R.; LUNNE, T.; AMUNDSEN, T. Piezocone tests in silty soils. In: RUITER, J. de (ed.). Penetration testing 1988. Balkema, Rotterdam, the Netherlands, v. 2, p. 955-974, 1988.
- SENNESET, K.; SANDVEN, R.; JANBU, N. Evaluation of soil parameters from piezocone tests. Transportation Research Record, 1235. Transportation Research Board, National Research Council, Washington, D.C, p. 24-37, 1989.
- SOSNOSKI, J. Interpretação de ensaios de CPTU e DMT em solos com permeabilidade intermediária. 2016. 137 f. Dissertação (Mestrado) - Universidade Federal do Rio Grande do Sul. Escola de Engenharia. Programa de Pós-Graduação em Engenharia Civil. Porto Alegre, RS, Brasil, 2016.
- TAN, X.; PENG, L.; MUZI, H.; XIAOLIANG, H.; HAICHUM, M. Evaluation of the spatial variability characteristics of the unsaturated clay in Hefei, China. Soils and Foundations, v. 60, n. 2, p. 454-465, 2020.
-
UZIELLI, M.; VANNUCCHI, G.; PHOON, K. K. Random field characterization of stress-nomalised cone penetration testing parameters. Géotechnique, v. 55, n. 1, p. 3-20, 2005. Disponível em: https://doi.org/10.1680/geot.2005.55.1.3
» https://doi.org/10.1680/geot.2005.55.1.3 - VILLAVICENCIO, A. G.; BREUL, P.; BACCONNET, C.; BOISSIER, D.; ESPINACE, A.R. Estimation of the variability of tailings dams properties in order to perform probabilistic assessment. Geotechnical and Geological Engineering, v. 29, p. 1073-1084, 2011.
-
ZHANG, J. Z.; PHOON, K. K.; ZHANG, D. M.; HUANG, H. W.; TANG, C. Novel approach to estimate vertical scale of fluctuation based on CPT data using convolutional neural networks. Engineering Geology, v. 294, 2021. Disponível em: https://doi.org/10.1016/j.enggeo.2021.106342
» https://doi.org/10.1016/j.enggeo.2021.106342
Edited by
-
Associate Editor
Marcio Fernandes Leão