Abstract
For the Brazilian iron ore mines, the presence of caves presents a challenge, since most of them are located within the ore deposit. The National Environment Commission (CONAMA 347 Resolution/2004) establishes that the speleological heritage, as well as its area of influence, cannot sustain irreversible environmental impacts. The physical integrity of caves adjacent to mining operations is an issue of pivotal importance to be scrutinised in studies towards the delimitation of the cave’s protection radius. This article presents the study of various models of correlation between the RMR and Q systems used for the stability assessment of natural iron ore caves. In order to study a correlation between the RMR and Q systems, the most popular rock mass classifications, and their application as a validation tool, a selection of measurements of Q and RMR, organized in a database from seven natural caves of ferruginous lithology, are submitted to a study and statistical analysis. An empirical equation was obtained from the data, using a simple linear regression. The result of the regression was compared with selected correlation equations and the best fit for the data was chosen. The best fit was the Rutledge & Pearson correlation equation, which presented the best combination of R² and S, after the equation created on basis of the real values for RMR, though the other equations have results similar to it. As the results were quite similar, the recommendation still is that correlations should be used with caution, and associated to other methods and field analysis.
keywords:
rock mass classifications; iron ore; caves; correlation; linear regression model
1. Introduction
Caves are natural openings formed underground, as the speleological definition, wide enough for man's entrance. Caves are fragile and delicate ecosystems with their own dynamics, and precaution is mandatory when human interventions exist (Jaffé et al., 2018Jaffé, R.; Xavier, P.; Calux, A.; Gastauer, M.; Nicacio, G.; Zampaulo, R.; SOUZA-FILHO, P. W. M.; OLIVEIRA, G.; BRANDI, I. V.; SIQUEIRA, J. O. Conserving relics from ancient underground worlds: assessing the influence of cave and landscape features on obligate iron cave dwellers from the Eastern Amazon. PeerJ, 2018. DOI: https://doi.org/10.7717/peerj.4531
https://doi.org/10.7717/peerj.4531...
). The demand for protection of these structures, imposed by Brazilian legislation, has led to an intensification and deepening of speleological studies, but research concerning caves of ferruginous lithologies is recent. Although, these consisted of 14% of the Brazilian speleological potential (CECAV 2018CENTRO NACIONAL DE PESQUISA E CONSERVAÇÃO DE CAVERNAS (CECAV). Anuário estatístico do patrimônio espeleológico brasileiro. Brasilia: ICMBio, 2018. Available in: http://www.icmbio.gov.br/cecav/images/stories/downloads/Anuario/CECAV_-_Anuario_estatistico_espeleol%C3%B3gico_2018.pdf. Acessed at: 29 nov. 2018.
http://www.icmbio.gov.br/cecav/images/st...
), only recently did the scientific community consider iron formations as a lithology favorable to the formation of caves.
The determination of the degree of relevance and the area of protection of a cavity involves several aspects, including technical analyses of hydrological, geological and biological factors, among others. One of the criteria is the geotechnical fragility of the cavities - a factor linked to the stability of the cavities, their genesis and evolution. The stability assessment of a rock mass begins by understanding its behavior and the rock mass classification systems are considered the best tools for this (Barton et al., 1974BARTON, N.; LIEN, R.; LUNDE, J.. Engineering classification of rock masses for the design of tunnel support. Rock Mechanics, v. 6, n. 4, p.189-236, dec. 1974. DOI: http://dx.doi.org/10.1007/bf01239496. and Bieniawski, 1989BIENIAWSKI, Z. T. Engineering rock mass classifications: a complete manual for engineers and geologist in mining, civil, and petroleum engineering. New York: John Wiley & Sons, 1989.). There is no system developed specifically for application in underground cavities, but classifications can be applied for this purpose, with appropriate adaptations such as Genis e Çolak(2015GENIS, M.; ÇOLAK, B.. Stability Assessment of the Gökgöl Karstic Cave (Zonguldak, Turkey) by analytical and numerical methods. Rock Mechanics And Rock Engineering, [S.l.], v. 48, n. 6, p.2383-2403, 6 jan. 2015. DOI: http://dx.doi.org/10.1007/s00603-014-0700-z
http://dx.doi.org/10.1007/s00603-014-070...
), Noce (2016)NOCE, T. S. Proposta de zoneamento geotécnico de cavidades naturais em formações ferríferas. 2016. 174f. Dissertação (Mestrado em Engenharia Mineral) - Escola de Minas, Universidade Federal de Ouro Preto, Ouro Preto, 2016., Dutra (2017)DUTRA, G. M.. Análise de susceptibilidade de duas cavidades em litologia de ferro na Serra do Gandarela, MG: Estudo de caso: AP_0009 e AP_0038. 2017. 114f. Dissertação (Mestrado em Engenharia Geotécnica) - Escola de Minas, Universidade Federal de Ouro Preto, Ouro Preto, 2017., Jordá-Bordehore (2017)JORDÁ-BORDEHORE, L. Stability assessment of natural caves using empirical approaches and rock mass classifications. Rock Mechanics And Rock Engineering, [S.l.], v. 50, n. 8, p.2143-2154, 25 abr. 2017. DOI: http://dx.doi.org/10.1007/s00603-017-1216-0
http://dx.doi.org/10.1007/s00603-017-121...
and Paula et al. (2018)DE PAULA, A. Q.; PIRES, M. A.; CORREA, T. R.; BRANDI, I. V.; LIMA, H. M. Natural caves empirical stability assessments: application of Laubscher's diagram and Barton's support graph. In: Simpósio Brasileiro de Mecânica das Rochas, 8., 2018, Salvador. Anais[...] Salvador: ABMS, 2018..
Barton et al. (1974)BARTON, N.; LIEN, R.; LUNDE, J.. Engineering classification of rock masses for the design of tunnel support. Rock Mechanics, v. 6, n. 4, p.189-236, dec. 1974. DOI: http://dx.doi.org/10.1007/bf01239496. , Singh and Goel (1999)SINGH, B.; GOEL, R. K. Engineering Rock Mass Classification. Waltham, US: Elsevier, 2011. 381 p., and Bieniawski (1989)BIENIAWSKI, Z. T. Engineering rock mass classifications: a complete manual for engineers and geologist in mining, civil, and petroleum engineering. New York: John Wiley & Sons, 1989. recommend the use of two or more classification systems and at least one equation of correlation between them for the same excavation in order to validate the decisions taken. The objective of this study is to identify among the existing correlations, which one fits better for the study of the stability of ferruginous cavities, returning the smallest errors.
2. Material and methods
The most popular systems are the RMR (Bieniawski, 1989BIENIAWSKI, Z. T. Engineering rock mass classifications: a complete manual for engineers and geologist in mining, civil, and petroleum engineering. New York: John Wiley & Sons, 1989.) and the Q index (Barton et al. 1974BARTON, N.; LIEN, R.; LUNDE, J.. Engineering classification of rock masses for the design of tunnel support. Rock Mechanics, v. 6, n. 4, p.189-236, dec. 1974. DOI: http://dx.doi.org/10.1007/bf01239496. ). The Rock Mass Rating (RMR) is an empirical method for the design and support of engineering projects. It was developed by Bieniawski in 1973 and is applicable for different purposes, such as slopes, mining tunnels and construction projects. The rating is determined by the evaluation of six parameters, assigned with a range of values. The RMR system is the sum of the weights, varying from zero to 100. The considered parameters are the uniaxial compressive strength of rock material (s), the Rock Quality Designation (RQD), the spacing of discontinuities, the discontinuity condition and orientation, as well as the groundwater conditions. Table 1 shows the five rock mass classes of the RMR system.
Rock Mass Classification by the RMR system (Bieniawski, 1989BIENIAWSKI, Z. T. Engineering rock mass classifications: a complete manual for engineers and geologist in mining, civil, and petroleum engineering. New York: John Wiley & Sons, 1989.).
The Q index for the rock mass classifications was developed by Barton et al. in 1974BARTON, N.; LIEN, R.; LUNDE, J.. Engineering classification of rock masses for the design of tunnel support. Rock Mechanics, v. 6, n. 4, p.189-236, dec. 1974. DOI: http://dx.doi.org/10.1007/bf01239496. at the Norwegian Geotechnical Institute. Originally proposed on the basis of about 200 cases histories of tunnels and caverns, is defined as:
The Q index varies in a logarithmic scale from 0.001 to 1000, and classifies the rock mass in nine classes, as shown in Table 2.
The Q System Rock Mass Classification (Barton et al., 1974BARTON, N.; LIEN, R.; LUNDE, J.. Engineering classification of rock masses for the design of tunnel support. Rock Mechanics, v. 6, n. 4, p.189-236, dec. 1974. DOI: http://dx.doi.org/10.1007/bf01239496. ).
Although rock mass classification systems are useful and easy to apply, they do have a certain degree of uncertainty. Therefore, the use of more than one is recommended for a good design methodology and for anticipating possible problems. For a good engineering design (Barton et al., 2008BARTON, N.; BIENIAWSKI, Z. T. RMR and Q - Setting records straight. Tunnels & Tunnelling International, Manchester, p.26-29, 2008. ), recommended is not only use of more than one classification system, but also use of at least one correlation equation between the systems.
Several scholars and industrial professionals have developed correlations for the Q system and RMR, and some are quite popular. Among them, the equations 2, 3 and 4 are noted for those with the highest correlation coefficient (Sing and Goel, 1999SINGH, B.; GOEL, R. K. Engineering Rock Mass Classification. Waltham, US: Elsevier, 2011. 381 p.).
The equations have as coefficient correlation the value 0.77, 0.81 and 0.92, respectively.
The Rock Mass Number (N) is the Q index modification. The N does not consider the SRF value because of the problems and uncertainties in correctly obtaining this factor. The Rock Mass Number is defined by Equation 5.
Given the N, Goel et al. (1995)GOEL, R. K.; JETHWA, J. L.; PAITHANKAR, A. G. Correlation between Barton's Q and Bieniawski's RMR-A new approach. International Journal Of Rock Mechanics And Mining Sciences & Geomechanics Abstracts, [S.l.], v. 33, n. 2, p.179-181, feb. 1996. DOI: http://dx.doi.org/10.1016/0148-9062(95)00057-7
http://dx.doi.org/10.1016/0148-9062(95)0...
propose a correlation equation between this index and the Rock Condition Rating (RCR), a modification of the RMR without the ratings for the crushing strength of the intact rock material and the adjustment of joint orientation.
In order to evaluate the use of the correlation, RMR values were calculated using Equations 2, 3 and 4 and the measurements from the database. The data are from ferruginous natural caves, collected in the field. The selection of correlation models of the Equations 2, 3, and 4 are justified for the highest correlation coefficients as well as their common use. In addition to using a simple linear regression model, an experimental curve from these data values was proposed.
In order to identify the correlation that best fit for the case of ferruginous natural caves, a comparative analysis using a variability analysis and residual graphs was conducted. The parameters S, R² and R²-adjusted measures the quality of the model. The coefficient of determination (R²) can be interpreted as the ratio of the variability present in the observations of a response variable Y (in this case, RMR), which is explained by the independent variable X in the regression model. The S is the standard deviation and represents how far the real values are from the adjusted ones (Minitab, 2018).
3. Results and discussions
In a first step, 61 points from the caves’ database were classified according to the range of rock classes from Q and RMR systems. Figure 1 shows the histograms obtained.
Fair Rock is the predominant RMR class in the sample, which influenced the standard rating, 50.2. The histogram presents a small asymmetry, but it indicates a normal distribution. In the Q system rating, the Fair to Poor Rock masses predominate, with standard rating equals to 2.77 (poor rock). The Q system may be more sensitive to some factors, like the groundwater conditions, tending to be more conservative, as seen in Noce (2016)NOCE, T. S. Proposta de zoneamento geotécnico de cavidades naturais em formações ferríferas. 2016. 174f. Dissertação (Mestrado em Engenharia Mineral) - Escola de Minas, Universidade Federal de Ouro Preto, Ouro Preto, 2016. and Dutra (2017)DUTRA, G. M.. Análise de susceptibilidade de duas cavidades em litologia de ferro na Serra do Gandarela, MG: Estudo de caso: AP_0009 e AP_0038. 2017. 114f. Dissertação (Mestrado em Engenharia Geotécnica) - Escola de Minas, Universidade Federal de Ouro Preto, Ouro Preto, 2017..The sample is representative of the type of the rock mass lithologies, usually BIF and duricrust, ferruginous weathered rocks.
Through a regression, an experimental equation was obtained, represented in the scatter chart in Figure 2. The data present a bias, concentrating in the smallest values. The greatest discrepancies between the expected and the field data are in the lower quality or extreme quality classes, extreme values. A presence of outliers (red dots) is also noted. Equation 6 represents the curve generated from the experimental data.
Scatter chart and adjusted curve for experimental data of RMR and Q, represented for the black and red dots (outliers).
Table 3 presents the results from the variability analysis. R² equals 67.9% means that the proposed model explains 67.90% of the variable Y behavior. The lowest S corresponds to the experimental curve, and so is the highest value of R², 91.77, as expected. From the models used, the Rutledge and Preston’s and the Bieniawski’s had the same value of R², but the Rutledge has a lower S, which indicates a better adjustment to the data.
In order to determine if the models comply with what is expected, a residual analysis is proposed. Figures 3, 4, 5 and 6 represents the residual plots for each equation.
Results of Residuals Plots using the Rutledge and Preston’s correlation equation for the experimental data.
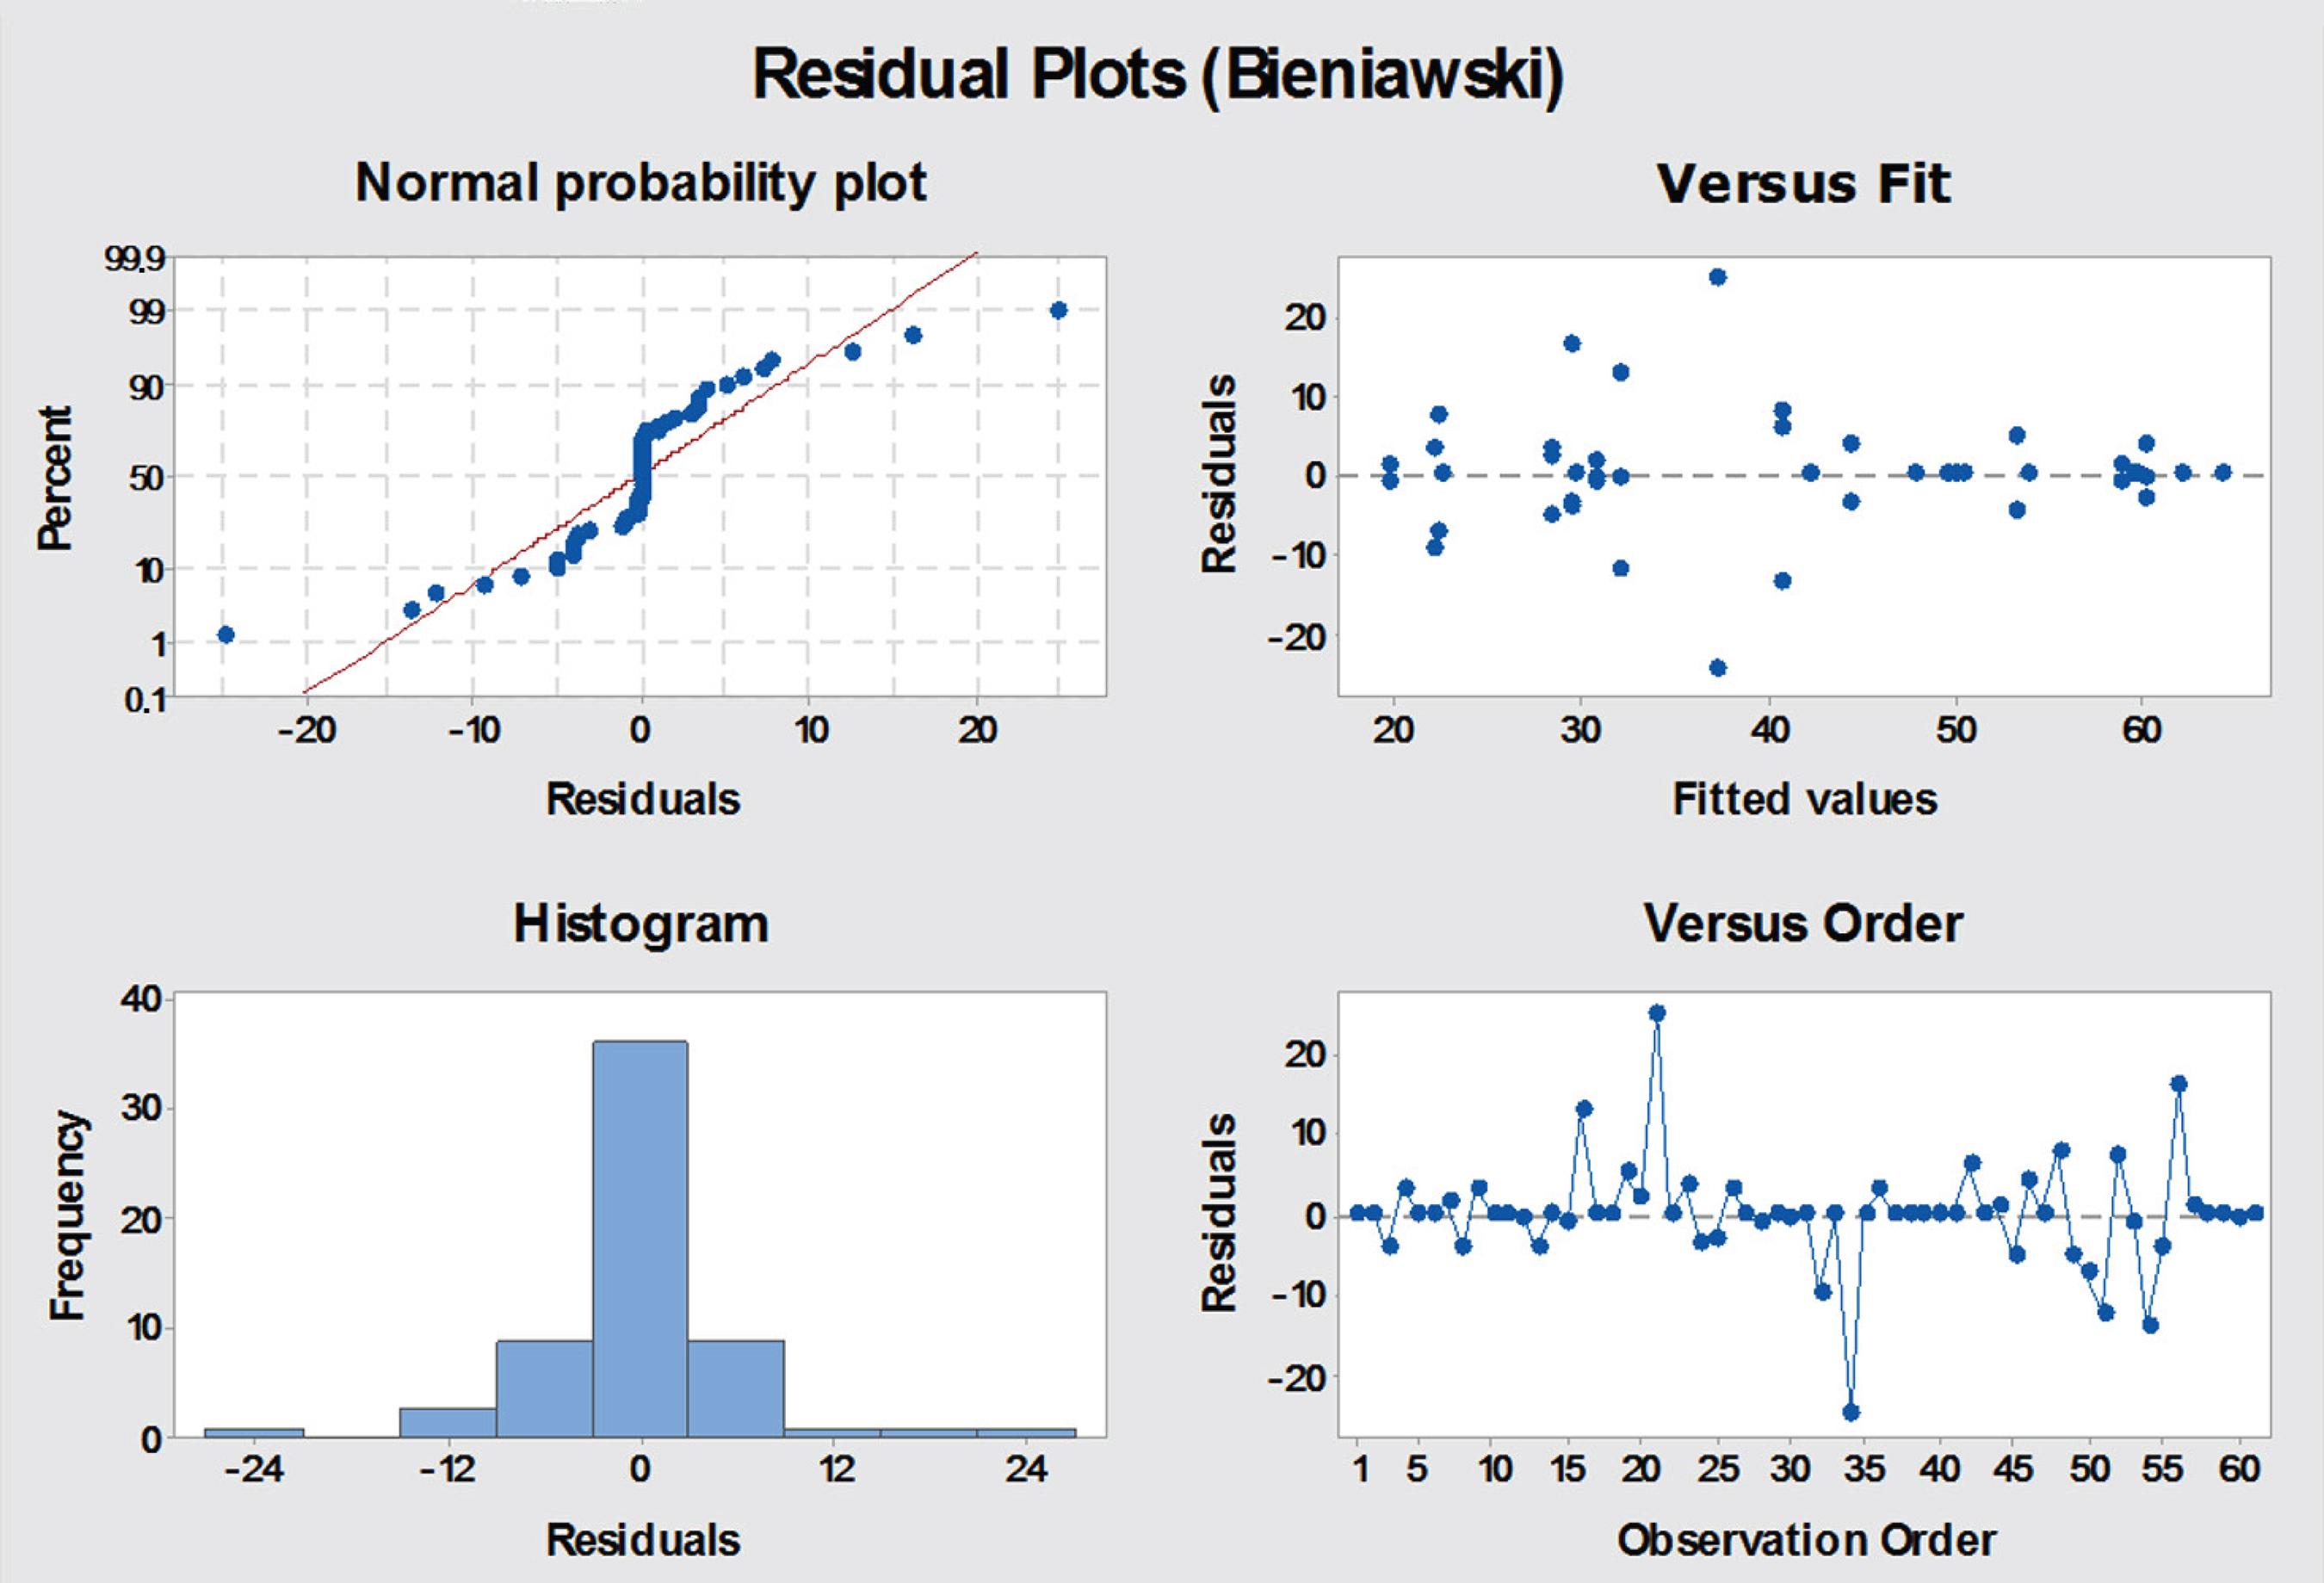
Results of Residuals Plots using the Bieniawski’s correlation equation for the experimental data.
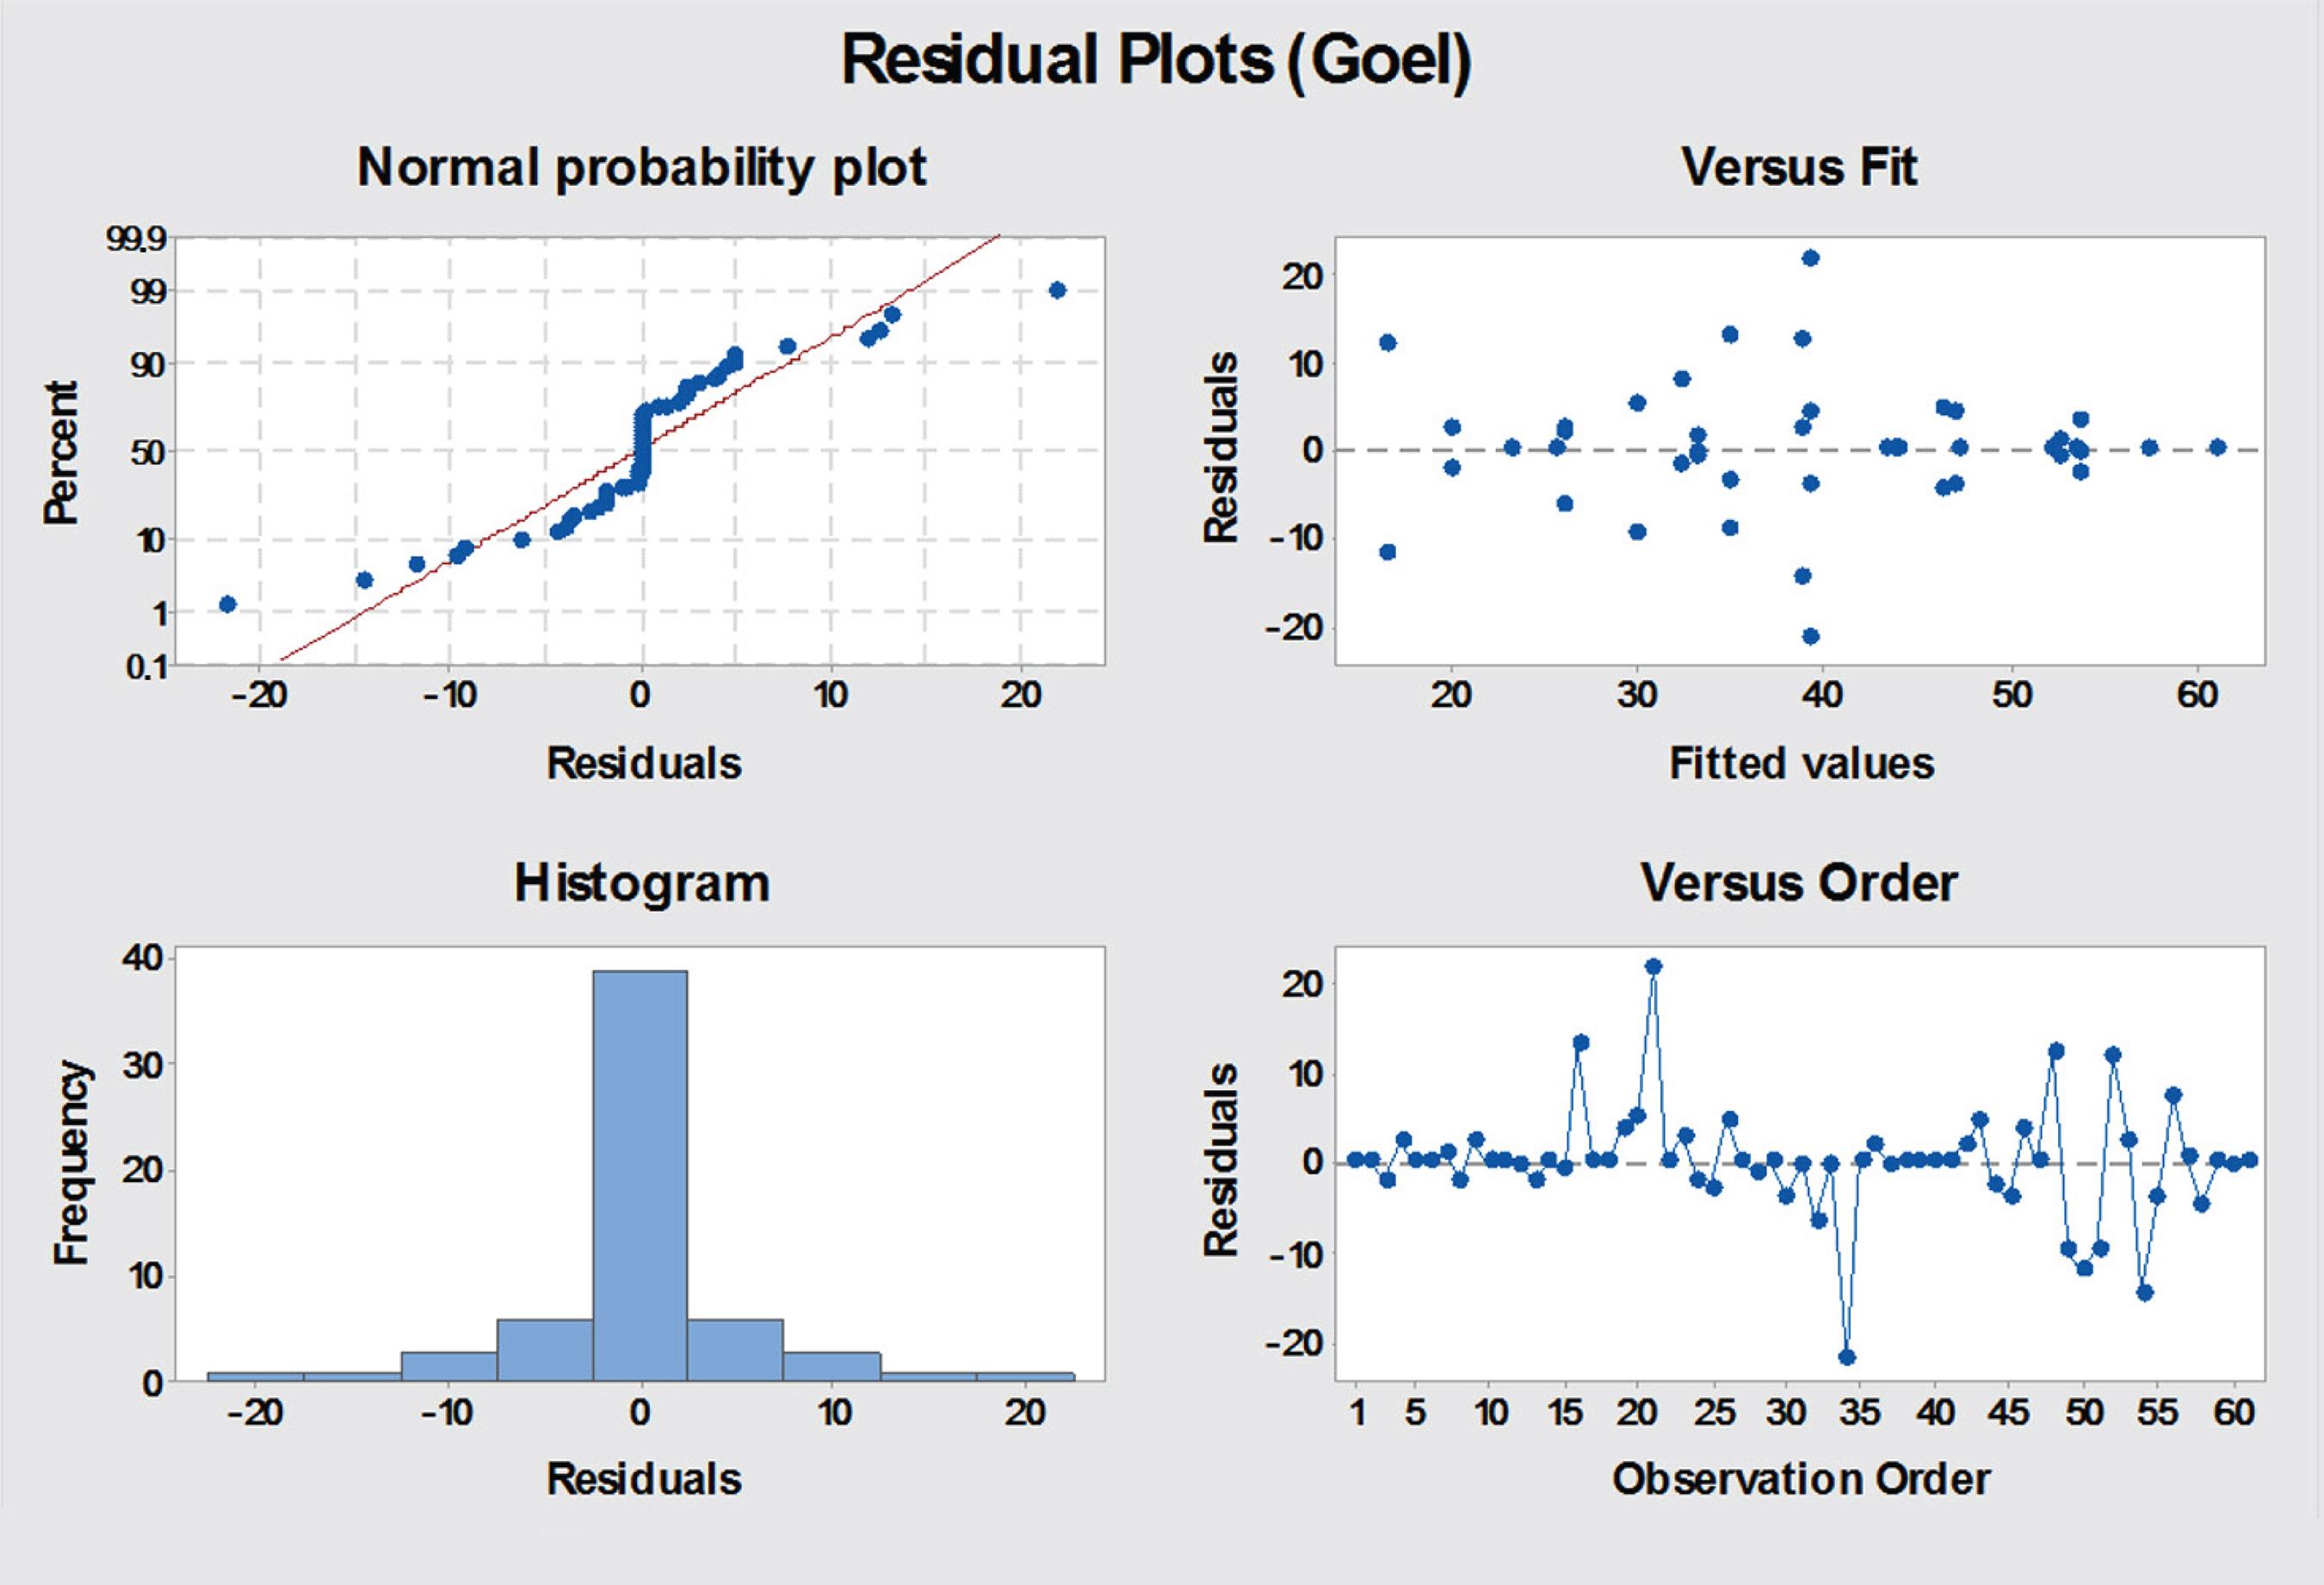
Results of Residuals Plots using the Goels’s correlation equation for the experimental data.
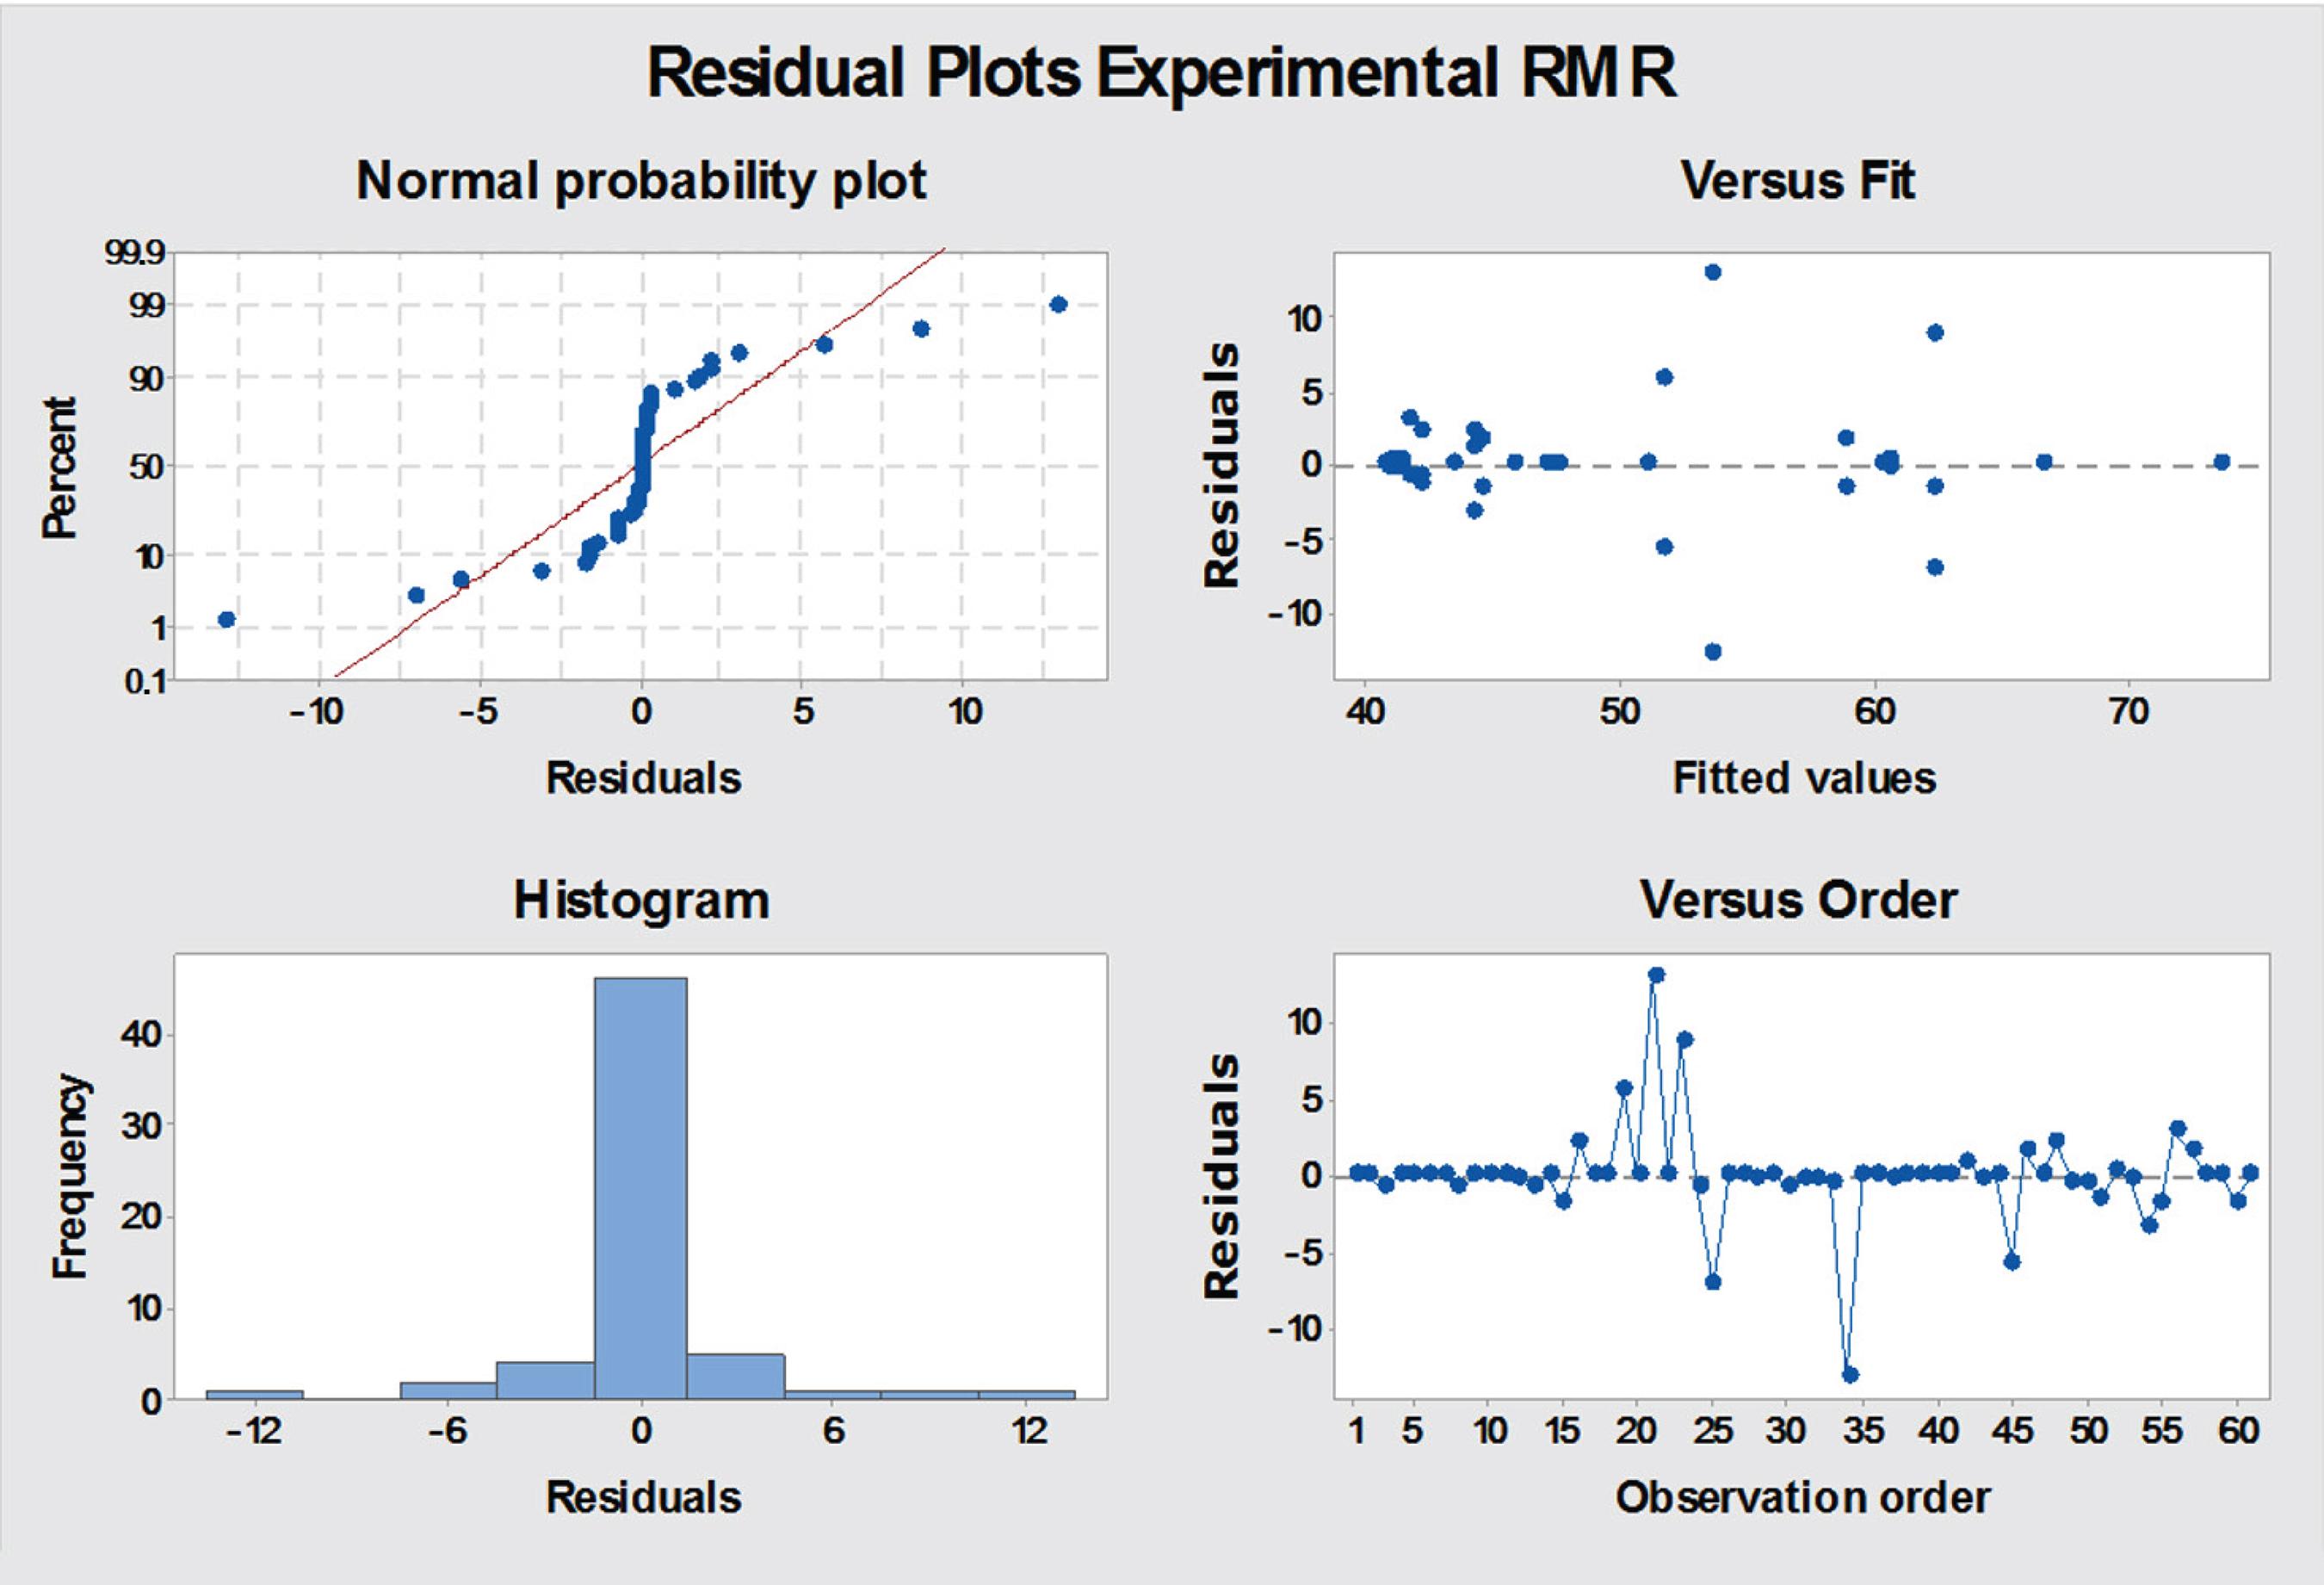
Results of Residuals Plots using the experimental correlation equation for the experimental data.
The four correlations had similar residuals plots. All histograms have a peak and small dispersion. The normal probability plot of the residuals shows problems with the normal distribution, since all the graphics have the form of an S, which demonstrates a curve with short tails (as seen in the histograms). A bias could been found in the plots of adjusted values and observation order, especially in the experimental correlation case that leads to the assumption the data does not have a constant variance. The residual analysis could not be used to determine which of the correlation equation fits best. The Rutledge model has the minor S and a good R², so, for the case, it is the best choice.
The Goel’s equation has the best correlation coefficient that supposedly overcomes uncertainties, but does not have the best parameters. As cited by Singh et al. (1999)SINGH, B.; GOEL, R. K. Engineering Rock Mass Classification. Waltham, US: Elsevier, 2011. 381 p., correlation equations are widely used, but it is easy to forget that these classifications are not equivalent. For example, while the RMR does not consider the field of stresses in the mass, the Q system does not consider the resistance of the intact rock. Nor does the orientation of the discontinuities, which is reflected in the adjustment of the proposed models. The Goel’s correlation does not make these classifications more precise in the case of this sampling.
4. Conclusions
There are many equations for correlations between the Q and RMR rock mass classifications, each one offering approximate values in the medium classes, but struggles, in general, with the extreme values.
As the database of this study, iron ore caves usually have rock masses with low ratings in the classification systems. Applying more than one classification, as correlation equations can provide better information of the ground conditions, and more reliability of the data. This is the importance of identifying the better model to be used in the stability assessment of a natural cave.
For the database used, the best equation was the Rutledge and Preston (1978)RUTLEDGE, J. C.; PRESTON, R. L. Experience with engineering classifications of rock. Proc. Int. Tunnelling Sym., Tokyo, p. A3, 1978., which provided the minor standard deviation (S) from the real values, after the equation created on basis of the real values for RMR, though the other equations have similar results. As the results were not so different, the recommendation still is that correlations should be used with caution, associated with other methods and field analysis.
Acknowledgments
This study is result of the research agreement "speleological studies" signed between the company VALE S/A and the UFOP and the authors would like to thank the support given for this study.
References
- AULER, A. S.; PILÓ, L. B. Caves and mining in Brazil: the dilemma of cave preservation within a mining context. In: Andreo, B.; Carrasco, F.; Durán, J.; Jiménez, P.; LaMoreaux, J. (ed.) Hydrogeological and environmental investigations in karst systems [S.l.]: Springer-Verlag, 2014. v.1, p.487-496. DOI: http://dx.doi.org/10.1007/978-3-642-17435-355
» http://dx.doi.org/10.1007/978-3-642-17435-355 - BARTON, N.; LIEN, R.; LUNDE, J.. Engineering classification of rock masses for the design of tunnel support. Rock Mechanics, v. 6, n. 4, p.189-236, dec. 1974. DOI: http://dx.doi.org/10.1007/bf01239496.
- BARTON, N.; BIENIAWSKI, Z. T. RMR and Q - Setting records straight. Tunnels & Tunnelling International, Manchester, p.26-29, 2008.
- BIENIAWSKI, Z. T. Engineering rock mass classifications: a complete manual for engineers and geologist in mining, civil, and petroleum engineering. New York: John Wiley & Sons, 1989.
- CENTRO NACIONAL DE PESQUISA E CONSERVAÇÃO DE CAVERNAS (CECAV). Anuário estatístico do patrimônio espeleológico brasileiro Brasilia: ICMBio, 2018. Available in: http://www.icmbio.gov.br/cecav/images/stories/downloads/Anuario/CECAV_-_Anuario_estatistico_espeleol%C3%B3gico_2018.pdf Acessed at: 29 nov. 2018.
» http://www.icmbio.gov.br/cecav/images/stories/downloads/Anuario/CECAV_-_Anuario_estatistico_espeleol%C3%B3gico_2018.pdf - DE PAULA, A. Q.; PIRES, M. A.; CORREA, T. R.; BRANDI, I. V.; LIMA, H. M. Natural caves empirical stability assessments: application of Laubscher's diagram and Barton's support graph. In: Simpósio Brasileiro de Mecânica das Rochas, 8., 2018, Salvador. Anais[...] Salvador: ABMS, 2018.
- DUTRA, G. M.. Análise de susceptibilidade de duas cavidades em litologia de ferro na Serra do Gandarela, MG: Estudo de caso: AP_0009 e AP_0038. 2017. 114f. Dissertação (Mestrado em Engenharia Geotécnica) - Escola de Minas, Universidade Federal de Ouro Preto, Ouro Preto, 2017.
- GENIS, M.; ÇOLAK, B.. Stability Assessment of the Gökgöl Karstic Cave (Zonguldak, Turkey) by analytical and numerical methods. Rock Mechanics And Rock Engineering, [S.l.], v. 48, n. 6, p.2383-2403, 6 jan. 2015. DOI: http://dx.doi.org/10.1007/s00603-014-0700-z
» http://dx.doi.org/10.1007/s00603-014-0700-z - GOEL, R. K.; JETHWA, J. L.; PAITHANKAR, A. G. Correlation between Barton's Q and Bieniawski's RMR-A new approach. International Journal Of Rock Mechanics And Mining Sciences & Geomechanics Abstracts, [S.l.], v. 33, n. 2, p.179-181, feb. 1996. DOI: http://dx.doi.org/10.1016/0148-9062(95)00057-7
» http://dx.doi.org/10.1016/0148-9062(95)00057-7 - Jaffé, R.; Xavier, P.; Calux, A.; Gastauer, M.; Nicacio, G.; Zampaulo, R.; SOUZA-FILHO, P. W. M.; OLIVEIRA, G.; BRANDI, I. V.; SIQUEIRA, J. O. Conserving relics from ancient underground worlds: assessing the influence of cave and landscape features on obligate iron cave dwellers from the Eastern Amazon. PeerJ, 2018. DOI: https://doi.org/10.7717/peerj.4531
» https://doi.org/10.7717/peerj.4531 - JORDÁ-BORDEHORE, L. Stability assessment of natural caves using empirical approaches and rock mass classifications. Rock Mechanics And Rock Engineering, [S.l.], v. 50, n. 8, p.2143-2154, 25 abr. 2017. DOI: http://dx.doi.org/10.1007/s00603-017-1216-0
» http://dx.doi.org/10.1007/s00603-017-1216-0 - NOCE, T. S. Proposta de zoneamento geotécnico de cavidades naturais em formações ferríferas 2016. 174f. Dissertação (Mestrado em Engenharia Mineral) - Escola de Minas, Universidade Federal de Ouro Preto, Ouro Preto, 2016.
- MINITAB. Getting started with Minitab 18 [S.l.]: Minitab, 2017. Available in: https://www.minitab.com/uploadedFiles/Documents/gettingstarted/MinitabGettingStarted_EN.pdf Acessed at: 12 jan. 2019.
» https://www.minitab.com/uploadedFiles/Documents/gettingstarted/MinitabGettingStarted_EN.pdf - RUTLEDGE, J. C.; PRESTON, R. L. Experience with engineering classifications of rock. Proc. Int. Tunnelling Sym, Tokyo, p. A3, 1978.
- SINGH, B.; GOEL, R. K. Engineering Rock Mass Classification Waltham, US: Elsevier, 2011. 381 p.
Publication Dates
-
Publication in this collection
17 Apr 2020 -
Date of issue
Apr-Jun 2020
History
-
Received
29 July 2019 -
Accepted
29 Jan 2020