 Impact of tax progressivity on regional income inequalities: a comparative analysis between Brazil and Germany
ABSTRACT
The progressivity of a country’s tax system can be crucial for reducing income and regional inequalities. Focusing on the cases of Germany and Brazil, in this article we analyze the tax system progressivity through an original indicator based on the Personal Income Tax (PIT) and the Value Added Tax (VAT) to determine its association with income and regional inequalities at the national and sub-national levels. We show that a progressive tax system reduces income and regional inequalities.
KEYWORDS:
Tax policy; personal income tax; value added tax; income inequality; Gini coefficient; progressivity indicator
RESUMO
A progressividade do sistema tributário pode ser vital para a redução das desigualdades regionais e de renda de um país. Com foco nos casos da Alemanha e do Brasil, este estudo analisou a progressividade do sistema tributário através de um indicador baseado no imposto de renda (IR) e no imposto sobre valor agregado (IVA) para determinar sua associação com as desigualdades regionais e de renda nos níveis nacional e subnacional. Observou-se que o sistema tributário progressivo ajuda reduzir as desigualdades regionais e de renda.
PALAVRAS-CHAVE:
Políticas tributárias; imposto de renda de pessoa física; imposto sobre valor agregado; desigualdade de renda; coeficiente de Gini; indicador de progressividade
1. INTRODUCTION
Every country needs to formulate a tax policy to generate revenues and fund government expenditures. Tax policies can also be designed as a multidimensional tool for sustainable economic development. The structure of a tax system should be supportive of resources allocation, income redistribution, increasing investment, job creation and economic growth. In addition, tax policies should have the flexibility and the capability to be adjustable to socioeconomic changes and evolving fiscal environments (ICC, 2015). A well-designed fiscal policy helps countries to achieve the Sustainable Development Goal 10 (SDG 10) of reducing inequality within and among countries by 2030. Under this goal, target 10.1 prioritizes the reduction of income inequality, whereas target 10.4 focuses on appropriate fiscal and social policies to ensure equality. Both targets clearly indicate the importance of tax policies for sustainable development (United Nations, 2020).
Depending on the bearer of the tax burden, taxes can be categorized as direct or indirect. Direct taxes are charged directly by the government on individuals’ profits and income, while indirect taxes are charged by an intermediary, such as marketplaces or vendors, on goods and services purchased by individuals. Taxes can also be classified according to the burden imposed on individuals from different economic classes, as proportional, progressive, and regressive (Varela, 2016). Progressive taxes have rates that increase with taxpayers’ income. On the other hand, rates of regressive taxes decrease with taxpayers’ income. For instance, personal income taxes tend to be progressive, because they impose higher rates to better-off taxpayers, while social security contributions, consumption taxes, and real estate taxes tend to be regressive, because their rates do not depend on taxpayers’ wealth (Joumard et al., 2012). Varela (2016) argues that the consumption tax is regressive when it is examined as a proportion of income. The higher-income group spends a lower percentage of their income in consumption, as compared to the lower-income group.
Personal Income Tax (PIT) and Value Added Tax (VAT) are the two most significant sources of revenue in most countries. Their rate, collection and apportionment systems are important components of a country’s fiscal policy, as they can significantly affect social inequality. Hemels (2009) defined the PIT as an instrument to achieve equality among taxpayers by using the ability to pay as its basic principle, and by using income as the criterion to establish the fair share which a taxpayer must contribute to government expenditure. The author also explained that the VAT is used to achieve equality among taxpayers by using consumption as the criterion to establish the fair share. The international think tank Tax Foundation uses the PIT as an example of a progressive tax, because the average tax burden increases with income.1 In contrast, the same foundation uses indirect taxes with flat rates as examples of regressive taxes, because the average tax burden decreases with income.2 The VAT is a significant type of regressive tax, where the rates are often flat. As a result, lower-income groups bear a higher tax burden than higher-income groups with the same consumption. The total revenue collected by the government results from different tax policies made by policymakers. Tax policies may vary from country to country, and within the same country across sub-national units.
The literature proposes different ways of measuring the level of progressivity of a tax system. Slitor (1948) introduced the effective rate of progressivity, measured as the difference between marginal and effective tax rates, divided by the net income before exemption. However, the author considers only individual income taxes in his formula. According to his approach, a tax system is progressive (or regressive) when the marginal tax rate is greater (or lower) than the average tax rate. On the other hand, Kakinaka and Pereira (2006) measured tax progressivity as the proportional standard deviation of tax revenues relative to the proportional standard deviation of income. According to them, the tax system is progressive when more tax revenues are raised during expanding phases of business cycles. Piketty and Saez (2007), Diamond and Saez (2011) also provided their own estimates of tax systems’ progressivity, and Creedy and Subramanian (2024) measured tax progressivity through a tax concentration curve. In many countries, tax rates are higher for labour or wage income than capital income, favoring high income groups. For this reason, Hourani et al. (2023) and Hebous et al. (2024) have encouraged that effective tax rates be levied both at the firm and at the individual level to assure progressivity. Kakwani and Son (2021) argued that the tax system level of progressivity has direct social welfare implications. Duncan and Peter (2012), Heathcote et al. (2020), Papanikolaou (2021), and Jalles and Karras (2024) assessed the association between tax progressivity and income inequalities, while Tafenau and Paas (2011), Manduca (2019), Panzera and Postiglione (2021), and Ouedraogo et al. (2024) assessed its impact on economic growth and regional income inequality.
In terms of tax collection, tax policies, and income inequality, neighboring countries tend to have similar traits. European countries are more similar among themselves than they are with countries outside Europe. The same applies to Latin America. Within these regions, Germany is a large federative country, whose tax structure and level of social inequality is typical of Europe, whereas Brazil is also a large federative country, whose tax structure and level of social inequality is typical of Latin America. More importantly, these countries are very different from each other in those regards, as descriptive statistics presented below will demonstrate. Brazil is the largest country by area and population in Latin America (World Atlas, 2021), and Germany is one of the largest countries (7th largest by area and 2nd by population size) in Europe (World Atlas, 2020). Both countries have the largest GDP of their geographic regions. As typical countries of developed and developing economies have several similarities (relative size in terms of area, population, and economy, as well as a federative system) with consequences for their tax policies and distribution of income, we regarded Germany and Brazil as the ideal choices for comparison in this article.
Our study aims at analyzing the impact of the tax system on income and regional inequality, focusing on the comparison between Germany and Brazil. We developed a parsimonious system-wide indicator of tax system progressivity, based on the participation of the Personal Income Tax (PIT), a progressive component of their tax systems, and the Value Added Tax (VAT), a regressive component of their tax systems, in the overall tax revenue collected. Similarly to Kakinaka and Pereira (2006), our indicator has the advantage of being based on easily accessible aggregate data of tax collection. We estimated the association between this indicator and levels of income and regional inequality, through straightforward Pearson’s correlation coefficients. We find that tax system progressivity, as measured by our index, is strongly related to levels of inequality at the subnational level in both countries.
2. RESEARCH FRAMEWORK
2.1 Data Collection Methods
Data on revenue and inequality in Germany and Brazil were collected from the OECD database and the Standardized World Income Inequality Database (SWIID). We also collected complementary data on several indicators from the Federal Ministry of Finance, Population Census, IBGE, Ipeadata, Deutschland in Zahlen (Germany in numbers), and Worldwide Tax Summaries were also collected.
2.2 Data Analysis Methods
PIT is a progressive tax, and VAT a regressive tax, both in Brazil and in Germany, which entails that more revenue collected through PIT and less revenue collected through VAT enhance the progressivity of the tax system. These two tax components are the primary sources of revenue in both countries. Ideally, we would also take other taxes with progressive or regressive biases into consideration, such as the inheritance tax, recurrence tax on real estate properties, and tax on net wealth, but the gain in explanatory power would be too slim for the time and effort required to collect and analyze those data. Focusing on the major sources or revenues in both countries, one progressive and the other regressive, already provides us with valuable insights and a good understanding of the impact of the tax system on regional and income inequality. Differently from other studies, we did not analyze indicators such as tax rates, differences in labour and capital income, and redistribution policies to calculate the progressivity of the tax system. Despite the parsimony of our methodology, which we consider to be a virtue, the results reported below are noteworthy and have clear policy implications.
The Progressivity Indicator (PI) for each country was calculated as the rate between total revenues collected through PIT and through VAT in the same year. The higher the PI of a country/year, the larger was the participation of PIT, comparatively to VAT, in total revenues, and the more progressive we considered the tax system to be. We used this rate as an indicator of progressivity, although it does not represent the whole system, as we already explained. Other components of the German and Brazilian tax systems, which could have some impact on their level of progressivity, were left aside. The following equation was used as a proxy for the tax system level of progressivity.
Keeping other factors constant, the PI indicates how progressive a country’s tax system is. Country/years with a PI higher than 1 are considered progressive, because more revenues were collected through its major progressive component (PIT) than through its major regressive component (VAT). Not necessarily it means that the system reduces the tax burden on lower-income groups, as a function of a lower VAT rate, but it may help this group, as the main source of revenues comes disproportionately from higher-income groups. Bach et al. (2017) demonstrated that the consumption share of a household income, and consequently the share paid in indirect taxes, decreases as the income increases. Lower-income households consume almost their whole income, and they must pay the highest percentage of their income in VAT, as compared to other income groups. Country/years with a PI lower than 1 are classified as regressive. Being one of our contributions to the literature, we contend that the proposed indicator of progressivity is suitable to countries such as Brazil and Germany, where the main sources of tax revenues are a large PIT and a large VAT. We also acknowledge that other methodologies for measuring the overall level of progressivity of a tax system, although more complicated, could be more useful in research involving other countries and other goals.
Our study uses the Gini coefficient as the indicator of income inequality. The Gini index is simply the Gini coefficient multiplied by 100. The Gini index based on nominal income and the Gini index based on disposable income indicate the pre-tax and post-tax levels of inequality, respectively. The difference between them indicates how strongly the tax system influence the distribution of income and levels of income inequality. Solt (2020) used the Gini index of household disposable income and the Gini index of household market income to better understand trends in income inequalities. The author analyzed Luxembourg Income Study data and estimated Gini indices in equivalized or square root scales. The main difference is that the Gini index of household disposable income considers only household post-tax or post-transfer income, while the market income considers only household pre-tax or pre-transfer income.
We also determined the level of Regional Inequality (RI) in each country by applying three methods developed by McCann (2019). The first indicator is the ratio between the GDP per capita of the most developed state and the least developed state. The second one is the absolute difference between the GDP per capita of the most and the least developed states, divided by the average GDP per capita of the country’s states. The third ones are the ratio between the GDP per capita of the 10% most developed regions and the 10% least developed regions, and the ratio between the GDP per capita of the 20% most developed regions and the 20% least developed regions. The country’s regions are more equal when the RI indicator approaches zero (McCann, 2019). Likewise, higher RI values indicate higher levels of inequality across country’s regions.
The Pearson’s correlation coefficient was used to analyze the association between regional inequality indices and the progressivity indicator. According to Glen (2021), the value of the formula ranges from -1 to 1, where 1 indicates a strong positive association, -1 indicates a strong negative association, and zero indicates no association at all. Correlation analysis was performed on various regional inequality indices of 16 German states and 27 Brazilian states separately. The indices that were considered as variables for the correlations are per capita household income, the Human Development Index (HDI), GDP per capita, and State expenditure per capita. The first three regional inequality indices indicate the difference in development among different states. The last one indicates the capacity and financial power of different states based on expenditure. We expect that the PI are positively correlated with development indices, because salaries are higher in more developed states. The more resources a family controls, the more they pay in income taxes, and the less they pay in VAT as a proportion of their income. Therefore, the PI is expected to be higher in more developed states. On the other hand, low-income families pay zero to low amounts of income taxes, while they spend high percentages of their income in VAT. Figure 1 represents the conceptual framework of the study.

Time-series data on countrywide revenues and inequalities of Germany and Brazil were analyzed comprehensively. Moreover, this research reviewed relevant documents that included policies and strategies, government reports, international reports, and national and region-wide statistics to understand the comparative context of the taxation system, revenue pattern, and regional inequalities in the study areas.
3. RESULTS AND DISCUSSION
3.1 Trend of Revenue Collection
Figure 2 (a) displays the PIT and VAT, as percentages of Total Taxes (TT) collected in Germany and Brazil, from 2010 to 2018. In 2010, the total amount of PIT collected in Germany was 219.387 billion Euro, a figure that increased 60.4% by 2018. On the other hand, the total amount of VAT collected in Germany was 180.533 billion Euro in 2010. The growth rate of this tax collection was comparatively lower, and by 2018 the total amount collected was only 30.41% higher. In 2018, revenues from PIT were 49.46% higher than revenues from VAT. This figure shows that, as a percentage of TT, PIT increased from 24% to 27% during the period. In the same period, VAT decreased from 20% to 18%. The PIT and VAT are the two major sources of tax revenues in Germany, but the PIT is always prioritized. As a result, the collection of PIT increased steadily over time.

Figure 2 (b) shows that the Brazilian tax system has opposite traits relatively to Germany. In 2010, the total PIT collected was 13.626 billion Euro, a figure that increased 118% by the end of the period. On the other hand, the total VAT collected in 2010 was 41.597 billion Euro; by 2018, it increased 77.4%. Notably, the total amount of PIT collected in Brazil was 205% lower than the VAT in 2010. This difference decreased to 149% in 2018, which may indicate a trend towards more progressivity. Figure 2 (b) also shows that PIT, as a percentage of total tax revenues, increased slightly from 7.01% to 8.47% during the period. At the same time, the VAT remained circa 21% of total taxes during the whole period. In Brazil, the PIT and VAT are the two major sources of revenues, but the VAT is considerably more important, as compared to PIT.
Germany had a much higher share of revenues coming from PIT than Brazil during the last decade. Brazil collected only 7.01% of total taxes through PIT in 2010, whereas this percentage was 3.4 times higher for Germany. The difference was nearly the same in 2018. In both countries, the percentage of PIT to TT increased, but it remained below 10% during the whole period in Brazil. In contrast to PIT, Brazil had a higher share of tax revenues coming from VAT than Germany during the last decade. The percentage of VAT to TT in Germany decreased from 19.81% in 2010 to 18.2% in 2018. On the other hand, the same percentage for Brazil varied slightly over time, but remained above 20%. We observe a clear trend of decreasing VAT, as a percentage of TT, whereas the percentage of direct taxes kept growing in Germany. The scenario in Brazil is considerably different. Total tax revenues increased nearly 80% by 2018, as compared to 2010. However, revenues from VAT increased significantly and remained the largest contributor to total taxes. This high dependency on indirect taxes makes Brazil a country with a regressive tax system.
Germany’s economy had grown during the period, and its citizens have earned more and consumed less. Therefore, without changing the rates, the government would still collect more PIT and less VAT over time. In Brazil, the economy had not been as stable as Germany’s in the last decade, and income remains highly concentrated. Therefore, more PIT was collected every year, but VAT remained considerably more important. Poor people spent everything they earn in consumption, carrying most of the burden of the Brazilian tax system.
3.2 Revenue Apportionment Policy
Regulations for tax administration, tax collection authorities, and tax-apportionment among the federal, state (Lander), and local governments are established by the German Constitution. Articles 106 and 107, under chapter ten (Finance) of the German Constitution of 1949, fixed the share of collected taxes that are allocated to each of the three different jurisdictional bodies. Table 1 summarizes the way that different taxes are distributed among government tiers.
The Federative Republic of Brazil is formed by the indissoluble Union of States and Municipalities, as well as the Federal District. At the macro level, the country is divided into North, Northeast, Southeast, South, and Central-West regions (Ministry of Finance, Brazil, 2002). Administratively, the Republic is divided into one federal government or union, 26 states and one federal district, and 5,570 municipalities. Articles 145 to 162, under chapter one (Taxation and Budget) of the Brazilian Constitution of 1988, regulate the national tax system, through which revenues are allocated to each of the three different governmental tiers. Table 2 summarizes the apportionment of taxes among federal entities.
How effectively are the PIT and VAT distributed vertically and horizontally among the different tiers of government in each country? The states of Germany get a significantly higher share of income taxes from the total annual collection (42.5%), as compared to the states of Brazil (21.5%). Shares of the federal government and municipalities are comparatively higher in Brazil than in Germany. On the other hand, the federal government of Brazil does not receive any share of VAT revenues, while the federal government of Germany controls nearly half of it. Brazilian states receive the major share of VAT revenues (75%), whereas municipalities also receive a significant percentage (25%). In Germany, municipalities control only 3.2% VAT revenues.
Germany has several tools of horizontal fiscal equalization. The supplementary portion, the financial equalization scheme, general supplementary federal grants, and supplementary federal grants for special needs are mechanisms to reduce gaps of financial capacity among German states. For example, the least developed states receive adjustment transfers from the most developed ones through the financial equalization scheme. On the other hand, Brazil created the Regional Fund, the Federal District and States Participation Fund (FPE), and the Municipalities Participation Fund (FPM) for the horizontal distribution of revenues among states and municipalities. The regional fund is used for backward regions’ development programs, but the share is low (only 3% of income taxes and industrialized products taxes). Brazil does not have a financial equalization scheme to reduce the gaps among states, as Germany does. This is a major shortcoming of the Brazilian tax apportionment system.
3.3 Trends in Tax Progressivity
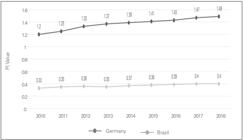
Figure 3 shows that the PI increased over the years in both countries. In Germany, it was 1.22 in 2010, gradually increased to 1.41 in 2015, and ultimately reached 1.49 in 2018. Therefore, the progressivity of the German taxation system has been rising steadily. In Brazil, the PI increased comparatively slower over the years. It was 0.33 in 2010, gradually increased to 0.38 in 2015, and ultimately reached 0.4 in 2018. The Brazilian taxation system is highly regressive, and the contrast between both countries is striking.
3.4 Regional Disparity in Income and Revenue Collection
3.4.1 General analysis of regional inequality
Revenues from PIT and VAT by the states of Germany are uneven. Some states can count on high revenues, while others cannot. Figure 4 (a) shows the distribution of population, per capita GDP, and revenues from PIT and VAT among states and the federal district in Germany. North Rhine-Westphalia and Bavaria are highly populated regions, where revenues from PIT and VAT were the highest. It is important to notice that revenues from taxes are not always proportional to the size of the population. For example, revenues from PIT in Lower Saxony and Hesse displayed different patterns. Lower Saxony has a larger population than Hesse, but its revenues from PIT and VAT were lower in 2017. Hamburg and Bremen had the highest per capita GDP, while Saxony-Anhalt and Mecklenburg-Vorpommern had the lowest. The per capita GDP of Germany was 41,474 Euro in 2019 (Focus-Economics, 2021), and nearly 63% of the states had a lower per capita GDP than the national figure.

São Paulo and Minas Gerais are highly populated Brazilian states, where 32% of the country’s population resides. As a result, São Paulo collected the highest amount of PIT and VAT, Minas Gerais collected the second-highest amount of VAT, but Rio de Janeiro and the Distrito Federal collected more PIT than Minas Gerais. The Distrito Federal and São Paulo had the highest per capita GDP, while Piauí and Maranhão had the lowest. The per capita GDP of Brazil was 9,380 Euro in 2012 (World Bank, 2021), and 74% of the states had a lower per capita GDP than the national figure. The per capita GDP of Brazil decreased to 8,282 Euro in 2016 (World Bank, 2021). In general, state-wide earnings and production are highly uneven in Brazil, with the majority of the states standing below the national value.
3.4.2 Regional inequality based on Gini Coefficient
We analyzed the variation of the Gini coefficient across states at two different times in both countries to assess trends in regional inequality. The Gini coefficient of Germany was 0.29 both in 2011 and 2017 (statistikportal.de, 2021). The map in Figure 5 shows that the level of inequality remained nearly the same for many of the states from 2011 to 2017. It also shows that the Gini coefficient for some of the states increased slightly in 2017, if compared with 2011. The state where it increased the most was Saarland: 7.4%. However, it increased from 0.27 to 0.29, which still indicates a low level of inequality in 2017. Lastly, the maximum (0.32) and the minimum (0.24) values indicate only a moderate variation across German states.

The Gini coefficient of Brazil decreased from 0.51 in 2011 to 0.49 in 2015 (IBGE, 2017). Therefore, despite this decrease, the level of inequality remains very high. The map in Figure 5 shows that the level of inequality declined in most of the states during the period, and Sergipe is the state where it declined the most. The Figure shows stark contrasts across states in 2015, with a maximum of 0.56 in the Distrito Federal, and a minimum of 0.42 in Santa Catarina. Despite these contrasts, the level of inequality remains extremely high in Brazil, with the most equal state being more unequal than the least equal German state.
Figure 6 shows the relative redistribution of the Gini Coefficient in Germany and Brazil from 2010 to 2018, that is, the differences between the pre-tax and post-tax Gini coefficients. It indicates how strongly taxation influences the distribution of income and reduces income inequalities. It is clear that the relative redistribution of income through the tax system was always much stronger in Germany than in Brazil. In Germany, the yearly average was 44.3%, whereas in Brazil it was 17.3%. The Figure indicates that the tax policy and cash transfers have a strong potential do reduce inequality, and that Germany used these instruments to accomplish a more egalitarian society in a more effective way than Brazil.

3.4.3 Regional inequality based on other indicators
McCann (2019) has proposed several methods to measure a country’s level of Regional Inequality (RI), based on the per capita GDP. Table 3 compares regional inequalities in Germany and Brazil according to different indicators.
The levels of RI were consistently lower in Germany than in Brazil, never surpassing 2.5, independently of the indicator. Over time, the values of all indicators decreased moderately, suggesting a consistent trend towards less regional inequality. In Brazil, despite the reduction of RI between 2012 and 2016, it remained high. States with a low per capita GDP were also the most inegalitarian, and all the RI indicators show that Brazil is a highly inegalitarian country. Moreover, the average RI decreased by 5% in Germany and by 17% in Brazil, which was far from enough to make both countries comparatively more similar in this regard.
3.5 Impact of Tax Progressivity on Income Inequality
We estimated correlations between the PI and indicators of development, such as household income per capita, Human Development Index (HDI), GDP per capita, and State expenditure per capita. The estimates presented in Table 4 are based on state-level data from Germany and Brazil. We expected that the PI is positively correlated with development indexes, and the results reported below support our expectations for Brazil, but not for Germany.
A possible explanation is that the PI is rather a function of families’ earnings than of families’ aggregate wellbeing. The more a family earn from their work, the more they will pay PIT and the less they will pay VAT in proportion to their income. Therefore, there should be a positive correlation between PI and household income per capita. On the other hand, the wellbeing of a family is not only a function of how much they earn, but also of public services and other welfare benefits provided by the state. At the state-level, the PI are positively correlated with per capita household income both in Germany and Brazil, as expected. Nevertheless, this association is more than twice stronger in Brazil than in Germany. Overall, these estimates show that states where families are better-off collect more taxes from PIT, relatively to VAT, but this effect is much stronger in Brazil, where the tax system is more regressive and the average household income per capita is much lower.
HDI and GDP per capita are broader development indicators, affected by factors going beyond families’ earnings. If the PI is positively correlated with those two development indicators, it may indicate that the country is not working hard enough to reduce inequalities, because families’ wellbeing remains highly dependent on their earnings. It could also be a consequence of states having a capacity of investments in public services proportional to its level of development, because the country does not have an efficient horizontal equalization mechanism. This rationale applies to Brazil, where the PI is strongly correlated with HDI and GDP per capita. The lack of association among these indicators in Germany suggests that the country is doing a better job in reducing regional inequalities, and that the least developed states are investing proportionately more in services that improve the wellbeing of their population.
Germany’s HDI was 0.947 (6th in the world ranking) in 2019, while Brazil had an HDI of 0.765 (84th position) in the same year (HDR, 2020). According to the Global Data Lab (2021), the difference between the states with the highest and lowest HDIs is higher in Brazil (0.12) than in Germany (0.07). The higher range of HDIs across Brazilian states indicates higher disparities in education, health, and standards of living. The positive correlation between the PI and HDI among Brazilian states is a strong sign that the country’s tax system is not contributing to reduce regional inequalities in terms of wellbeing and development. On the other hand, the lack of correlation among German states suggests that the government invests more revenues on poorer states. These investments help to reduce levels of regional inequality. If the PI is not associated with development indices, it means that these indices are as high where families earn less as they are where families earn more.
This rationale receives further support from the fourth estimate. The PI and state expenditure per capita is negatively associated in Germany, and positively associated in Brazil. These results attest to the fact that in Germany, government spending is directed to poorer states. In poor states, both the PI and development indices tend to be low. The PI is lower because residents pay less income taxes, but a higher proportion of their income in VAT. According to State government budget reports, Saxony-Anhalt and Mecklenburg-Vorpommern received the largest transfers from the central government in 2019: 1.258 Euro and 1037 Euro per inhabitant, respectively (Deutsche Bundesbank, 2020). Those two states are among the ones with lowest development indices and PI. The poorer states are prioritized by German government’s investments to minimize regional inequalities. On the other hand, the government of Brazil spends more in wealthier states. According to the Ministry of Finance (MOF) and IPEA data (2021), the Distrito Federal, São Paulo, Rio de Janeiro, and Rio Grande do Sul were the states with highest expenditure per capita in 2019. Moreover, they also have the highest development indices and PI. Therefore, Brazil spends more on developed states, making rich states even richer and contributing to maintain regional inequalities.
In 2017, state expenditure per capita was comparatively lower in Brazil, with an average of 929 Euro, than in Germany, with an average of 4.935 Euro (deutschland.de, 2020; Ipeadata, 2021). Brazilian states had both a very low per capita state expenditure, and indices of tax progressivity. As explained above, Germany has a better and more effective tax apportionment system. The system is effective because it reduces gaps of financial capacity across states. As a result, state expenditure per capita is higher among the least developed states. On the contrary, Brazil has a regional fund to help the less developed regions comprised of only 3% of income taxes and industrialized products taxes. Brazil does not have an effective financial equalization scheme to reduce gaps among states, in the same way as Germany does.
We sought to observe the association between the tax system and inequalities from different perspectives. The poor in Germany benefit not only from their income, but also from social policies and public services. Citizens have access to basic health and education facilities, independently of their income. This explains why the correlation between the PI and development indexes was negative or close to zero. In Brazil, the same estimates show that social policies and public services are not effective enough, enhancing disparities in society and across states. The Public Expenditure Review of Brazil by the World Bank Group (2017) argued that the Brazilian government spends more than the country can afford, and that it spends unequally. The poor are not receiving proper benefits to minimize levels of inequality. A high PI does not necessarily mean low inequality, but opportunities for reducing inequalities are comparatively higher when the tax system is progressive. In a progressive tax system, a higher percentage of taxes is collected from high-income groups, and the government can spend a higher percentage of revenues to help the poor.
4. CONCLUSION
In this study, we analyzed the association between tax systems and regional inequality, by comparing Germany and Brazil at their subnational level. We found this association to be multidimensional. Germany is a European country with a progressive tax system and efficient apportionment strategies among the federal government, states, and municipalities. Brazil is a typical Latin American country with a regressive tax system and high levels regional inequality. Our goal was to verify whether there is an association between a progressive tax system and regional inequalities. We proposed an original and parsimonious indicator of progressivity (PI), and calculated it for each state of Germany and Brazil. The indicator is a function of how much the tax system is dependent on its progressive component (PIT), as compared to its regressive component (IVA).
In order to assess the association between the PI and the level of regional inequality, we estimated a series of Pearson’s correlation coefficients between the PI and indicators of development at the state level. Then, we compared the results for Brazil and Germany to extract insights about the consequences of their tax policies. We found the PI and state-level indices of development to be positively associated only in Brazil, a country with poor mechanisms of horizontal fiscal equalization. We also speculated that the government’s budget allocation strategies, especially regarding public services and social welfare, may condition that association. In Germany, public services and the social welfare system are universal, with larger investments directed to the least developed areas. The poor receive generous benefits from the government, reducing gaps between poor and rich states. With a highly progressive tax system, Germany collects most of its revenue from the rich, which are primarily used to benefit the poor. As a consequence, its progressive tax system and a generous social welfare system reduce regional and income inequality. In Brazil, public expenditure policies are not as effective. Public services and social welfare benefits are comparatively too slim to guarantee social rights of the poor. Additionally, its regressive tax system contributes to make the rich richer and to increase gaps between them and the poor. Ultimately, a regressive tax system, poor public expenditure policies, weak public services, and the lack of an effective social welfare system make Brazilian states highly unequal in terms of development and wellbeing.
Germany and Brazil are completely different countries in terms of their tax system and inequality. Germany has successfully structured its tax system with a strong apportionment strategy among federal, state, and municipality levels. The system is reducing regional inequalities gradually over time. The Brazilian tax system is regressive and the apportionment strategy among federal, state, and municipal levels is not as efficient. States are not making enough investments to reduce inequalities, because the country’s tax system does not favor their efforts. Rich states are becoming more prosperous, while poor states are getting farther away in terms of general welfare.
REFERENCES
-
Bach, S., Beznoska, M., & Steiner, V. (2017). An integrated micro data base for tax analysis in Germany. http://dx.doi.org/10.2139/ssrn.3013633
» http://dx.doi.org/10.2139/ssrn.3013633 -
Creedy, J., & Subramanian, S. (2024). Income taxation and progressivity: A measure of equitability. Scottish Journal of Political Economy, 71(1), 28-40. https://doi.org/10.1111/sjpe.12361
» https://doi.org/10.1111/sjpe.12361 -
Deutsche Bundesbank. (2020). State government budgets: results for 2019, Monthly Report, October 2020, pp. 90-99. Retrieve from: https://www.bundesbank.de/en/publications/reports/monthly-reports/monthly-report-october-2020-848810
» https://www.bundesbank.de/en/publications/reports/monthly-reports/monthly-report-october-2020-848810 -
Deutschland.de. (2020). Federal States of Germany. Retrieve from: https://www.deutschland.de/en/topic/politics/germany-europe/federal-states
» https://www.deutschland.de/en/topic/politics/germany-europe/federal-states -
Diamond, P., & Saez, E. (2011). The case for a progressive tax: From basic research to policy recommendation. Journal of Economic Perspectives, 25(4), 165-190. https://www.aeaweb.org/articles?id=10.1257/jep.25.4.165
» https://www.aeaweb.org/articles?id=10.1257/jep.25.4.165 -
Duncan, D., & Peter, K. S. (2012). Unequal inequalities: Do progressive taxes reduce income inequality?. IZA. Discussion Paper No. 6910. Retrived from: https://repec.iza.org/dp6910.pdf
» https://repec.iza.org/dp6910.pdf -
Federal Ministry of Finance, Germany. (2018). The Federal Financial Equalization System in Germany. Retrieve from: https://www.bundesfinanzministerium.de
» https://www.bundesfinanzministerium.de -
Focus-Economics. (2021). GDP per capita in Germany. Retrieve from: https://www.focus-economics.com/country-indicator/germany/gdp-per-capita-EUR
» https://www.focus-economics.com/country-indicator/germany/gdp-per-capita-EUR -
Glen, S. (2021). Correlation coefficient: simple definition, formula, easy steps” from StatisticsHowTo.com: Elementary statistics for the rest of us. https://www.statisticshowto.com/probability-and-statistics/correlation-coefficient-formula/
» https://www.statisticshowto.com/probability-and-statistics/correlation-coefficient-formula/ -
Global Data Lab. (2021). Subnational Human Development Index (4.0). Retrieve from: https://globaldatalab.org/shdi/shdi/BRA/?levels=1%2B4&interpolation=0&extrapolation=0&nearest_real=0&years=2017
» https://globaldatalab.org/shdi/shdi/BRA/?levels=1%2B4&interpolation=0&extrapolation=0&nearest_real=0&years=2017 -
HDR. (2020). Latest Human Development Index Ranking, Human Development Reports, United Nations Development Programme. Retrieve from: http://hdr.undp.org/en/content/latest-human-development-index-ranking
» http://hdr.undp.org/en/content/latest-human-development-index-ranking -
Heathcote, J., Storesletten, K., & Violante, G. L. (2020). Presidential address 2019: How should tax progressivity respond to rising income inequality?. Journal of the European Economic Association, 18(6), 2715-2754. https://doi.org/10.1093/jeea/jvaa050
» https://doi.org/10.1093/jeea/jvaa050 -
Hemels, S. (2009). Influence of different purposes of value added tax and personal income tax on an effective and efficient use of tax incentives: Taking tax incentives for the arts and culture as an example. Value added tax and direct taxation. Similarities and differences, 35-57. https://papers.ssrn.com/sol3/papers.cfm?abstract_id=1959993
» https://papers.ssrn.com/sol3/papers.cfm?abstract_id=1959993 -
Hourani, D., Millar-Powell, B, Perret, S., & Ramm, A. (2023), The taxation of labour vs. capital income: A focus on high earners. OECD Taxation Working Papers No. 65. https://doi.org/10.1787/04f8d936-en
» https://doi.org/10.1787/04f8d936-en - Hebous, S., Klemm, A., Michielse, G. & Osorio-Buitron, C. (2024). How to Tax Wealth. IMF How to Note 2024/001, International Monetary Fund, Washington, DC.
-
IBGE. (2017). Sustainable Development Indicators, IBGE Automatic Recovery System - SIDRA, Brazilian Institute of Geography and Statistics. Retrieve from: https://sidra.ibge.gov.br/tabela/5642
» https://sidra.ibge.gov.br/tabela/5642 -
IBGE. (2019). Continuous National Household Sample Survey - 2018 (consolidated from first interviews), Brazilian Institute of Geography and Statistics. Retrieve from: https://www.ibge.gov.br/en/statistics/social/population/16833-monthly-dissemination-pnadc1.html?=&t=o-que-e
» https://www.ibge.gov.br/en/statistics/social/population/16833-monthly-dissemination-pnadc1.html?=&t=o-que-e -
ICC. (2015). ICC position paper: Tax and the United Nations’ Sustainable Development Goals, The International Chamber of Commerce. Retrieve from: https://iccwbo.org/publication/tax-united-nations-sustainable-development-goals
» https://iccwbo.org/publication/tax-united-nations-sustainable-development-goals -
Ipeadata. (2021). Regional: Public Finances-State expenditure. Retrieve from: http://www.ipeadata.gov.br/Default.aspx
» http://www.ipeadata.gov.br/Default.aspx -
Jalles, J. T., & Karras, G. (2024). Tax progressivity and income inequality in the US. Economics Letters, 238, 111715. https://doi.org/10.1016/j.econlet.2024.111715
» https://doi.org/10.1016/j.econlet.2024.111715 -
Joumard, I., Pisu, M., & Bloch, D. (2013). Tackling income inequality: The role of taxes and transfers. OECD Journal: Economic Studies, 2012(1), 37-70. https://doi.org/10.1787/19952856
» https://doi.org/10.1787/19952856 -
Kakinaka, M., & Pereira, R. M. (2006). A new measurement of tax progressivity. Graduate School of International Relations International University of Japan. http://gsir.iuj.ac.jp/publications/pdf/EDP06-7.pdf
» http://gsir.iuj.ac.jp/publications/pdf/EDP06-7.pdf -
Kakwani, N., & Son, H. H. (2021). Normative measures of tax progressivity: an international comparison. The Journal of Economic Inequality, 19(1), 185-212. https://doi.org/10.1007/s10888-020-09463-6
» https://doi.org/10.1007/s10888-020-09463-6 -
Manduca, R. A. (2019). The contribution of national income inequality to regional economic divergence. Social Forces, 98(2), 622-648. https://doi.org/10.1093/sf/soz013
» https://doi.org/10.1093/sf/soz013 -
McCann, P. (2020). Perceptions of regional inequality and the geography of discontent: Insights from the UK. Regional Studies, 54(2), 256-267. https://doi.org/10.1080/00343404.2019.1619928
» https://doi.org/10.1080/00343404.2019.1619928 -
Ministry of Finance, Brazil. (2002). Tax System and Administration in Brazil: An Overview, Tax Study 08, Federal Revenue Service. Retrieve from: https://www.gov.br/receitafederal/pt-br
» https://www.gov.br/receitafederal/pt-br -
OECD.stat. (2021). Public Sector, Taxation and Market Regulation: Taxation, Revenue Statistics - OECD member countries and Latin American countries. Retrieve from: Retrieve from: https://stats.oecd.org/ [Accessed 15 February 2021].
» https://stats.oecd.org/ - Ouedraogo, I., Dianda, I., Ouedraogo, P. P. R., Ouedraogo, T. R., & Konfe, B. (2024). The effects of taxation on income inequality in sub-Saharan Africa. Comparative Economic Studies, 1-66.
-
Panzera, D., & Postiglione, P. (2022). The impact of regional inequality on economic growth: a spatial econometric approach. Regional Studies, 56(5), 687-702. https://doi.org/10.1080/00343404.2021.1910228
» https://doi.org/10.1080/00343404.2021.1910228 -
Papanikolaou, N. (2021). Tax progressivity of personal wages and income inequality. Journal of Risk and Financial Management, 14(2), 60. https://doi.org/10.3390/jrfm14020060
» https://doi.org/10.3390/jrfm14020060 -
Piketty, T., & Saez, E. (2007). How progressive is the US federal tax system? A historical and international perspective. Journal of Economic Perspectives, 21(1), 3-24. https://www.aeaweb.org/articles?id=10.1257/jep.21.1.3
» https://www.aeaweb.org/articles?id=10.1257/jep.21.1.3 -
Slitor, R. E. (1948). The measurement of progressivity and built-in flexibility. The Quarterly Journal of Economics, 62(2), 309-313. https://doi.org/10.2307/1883224
» https://doi.org/10.2307/1883224 -
Solt, F. (2020). Measuring income inequality across countries and over time: The standardized world income inequality database. Social Science Quarterly, 101(3), 1183-1199. https://doi.org/10.1111/ssqu.12795
» https://doi.org/10.1111/ssqu.12795 -
statistikportal.de. (2021). Gini coefficient of equivalised income. Retrieve from: https://www.statistikportal.de/en/node/115090
» https://www.statistikportal.de/en/node/115090 -
Tafenau, E., and Paas, T., (2011). Regional inequality and economic growth: interactions of the relationship with the level of economic development and speed of growth. Retrieve from: https://www.researchgate.net/publication/254457349
» https://www.researchgate.net/publication/254457349 -
United Nations. (2020). Sustainable Development Goals. Goal 10: Reduce inequality within and among countries. Retrieve from: https://www.un.org/sustainabledevelopment/inequality
» https://www.un.org/sustainabledevelopment/inequality - Varela, P. (2016). What are progressive and regressive taxes. Tax and Transfer Policy Institute.
-
World Atlas. (2020). The Richest and Poorest States of Brazil. Retrieve from: https://www.worldatlas.com/articles/the-richest-and-poorest-states-of-brazil.html
» https://www.worldatlas.com/articles/the-richest-and-poorest-states-of-brazil.html -
World Atlas. (2021). Latin American Countries, Retrieve from: https://www.worldatlas.com/geography/latin-american-countries.html
» https://www.worldatlas.com/geography/latin-american-countries.html - World Bank Group. (2017). A Fair Adjustment: Efficiency and Equity of Public Spending in Brazil, Brazil Public Expenditure Review, Volume I: Overview, pp. 9-18.
-
World Bank. (2021). GDP per capita (current US$) - Brazil. Retrieve from: https://data.worldbank.org/indicator/NY.GDP.PCAP.CD?locations=BR
» https://data.worldbank.org/indicator/NY.GDP.PCAP.CD?locations=BR
-
1
https://taxfoundation.org/tax-basics/progressive-tax/ (accessed in August of 2024).
-
2
https://taxfoundation.org/taxedu/glossary/regressive-tax/ (accessed in August of 2024).
-
JEL Classification:
H20.


 Source:
  Source:
  Source: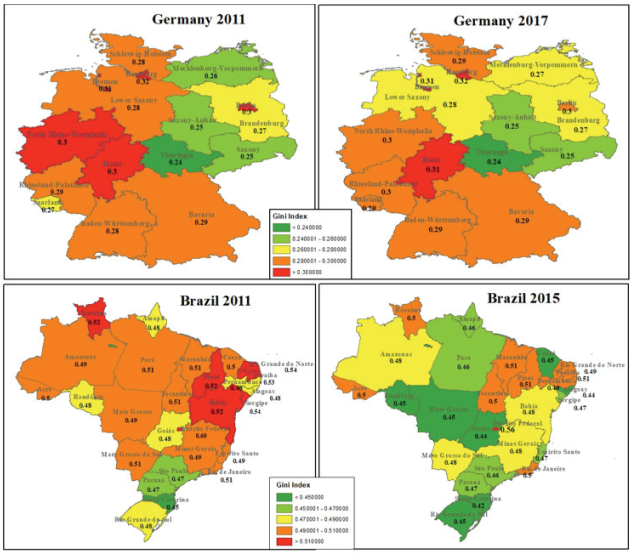
 Source: SWIID (2020).