 Sizing and sustainability of Forest-Based Agribusiness in Brazil in 2020: an analysis by the Input-Output Matrix
Abstract
Abstract This study aimed at sizing the Forest-Based Agribusiness in Brazil, which includes pulp, paper, wood and printing, using economic, social and environmental variables. The methodology was based on the National Input-Output Matrix for the year 2020. The results showed that Forestry Agribusiness was responsible for a gross value of production of about US$ 67 billion, US$ 28 billion in income, US$ 701 million in taxes, 2 million jobs and US$ 12 billion in labor income in 2020. The values corresponded to 9.49% of production, 8.74% of income, 11.59% of taxes on production, 7.7% of jobs and 8.25% of total agribusiness income. The environmental impacts measured were the consumption of blue water, which was 154 million m3 (0.91% of the total agribusiness) and carbon emissions of about 12,388 kilotons (kt) of CO2eq (1.76% of agribusiness). The sustainability indicators showed that Forestry Agribusiness consumed relatively less water and emitted less CO2eq per million dollars of income, in addition to presenting higher productivity and average workers income.
Keywords:
input-output; agribusiness; wood; cellulose
Resumo
Resumo O objetivo do estudo foi dimensionar o Agronegócio de Base Florestal no Brasil, que inclui celulose, papel, madeira e impressão, utilizando variáveis econômicas, sociais e ambientais. A metodologia foi baseada na Matriz Insumo-Produto Nacional do ano de 2020. Os resultados mostraram que o Agronegócio Florestal foi responsável por um valor bruto de produção de cerca de US$ 67 bilhões, US$ 28 bilhões em renda, US$ 701 milhões em impostos, 2 milhões de postos de trabalho e US$ 12 bilhões em rendimento do trabalho em 2020. Os valores correspondiam a 9,49% da produção, 8,74% da renda, 11,59% dos impostos sobre produção, 7,7% dos empregos e 8,25% do rendimento total do agronegócio. Os impactos ambientais mensurados foram o consumo de água azul, que foi de 154 milhões m3 (0,91% do total do agronegócio) e emissões de carbono de cerca de 12.388 Quilotoneladas (kt) de CO2eq (1,76% do agronegócio). Os indicadores de sustentabilidade mostraram que o Agronegócio Florestal consumiu relativamente menos água e emitiu menos CO2eq por milhão de dólares de renda, além de apresentar maior produtividade e rendimento médio dos trabalhadores.
Palavras-chave:
insumo-produto; agronegócio; madeira; celulose
1 Introduction
The modern concept of agribusiness defines it as an integrated chain that encompasses from farm production to processing, distribution, and commercialization, generating value through the interaction between its links (Davis & Goldberg, 1957). In Brazil, this approach is strategical, since agribusiness drives exports, employment, and innovation, including forest-based chains—cellulose, paper, wood, and print—which significantly contribute to the GDP and the trade balance, by transforming forest inputs into high earned value products.
The input-output matrix was introduced in the sizing of agribusiness by Furtuoso et al. (1998), with later studies displaying its shares growth in the GDP from 15% in the 1960s to 30% in 1995 (Montoya & Guilhoto, 1999) and 32% in 2000 (Furtuoso & Guilhoto, 2003). Guilhoto et al. (2006) indicated family farm with 25%–30% of the GDP from the sector. More recent studies incorporated environmental variables, such as Montoya et al. (2017), and estimated emissions of 1.5 kg of CO2 per Brazilian real generated and 35% of energy consumption; Luz & Fochezatto (2022) pointed out that agribusiness used to represent 21% of the economy’s value-added in 2010. Researches such as Sesso Filho et al. (2019, 2024), Amarante & Sesso Filho (2020) and Sesso et al. (2022) widened the scope to include emissions and water footprint, in addition to methodological innovations. Such evolution displays the use of the input-output matrix as a tool for policies that combine growth, inclusion and sustainability.
The Forest-Based Agribusiness merges the production sector with economic, social and environmental impacts. From an economic perspective, it generates jobs and regional development, especially in areas with forestry vocation. Regarding the environmental scope, it has made some advancement in sustainable practices such as reforestation, recycling, and reduction of water consumption and emissions (Carvalho et al., 2005; Soares et al., 2010; Moreira & Oliveira, 2017). Studies show economic cycles, with forestry GDP growth until 2000 and subsequent retraction (Soares et al., 2014). The cellulose and paper chain has a multiplier of 1.7 and sustainable management that reduced emissions in 18%. Regionally, it stands out the participation of 8% in the Espírito Santo’s GDP (Valverde et al., 2005) and strong vertical integration in Pará (Santos, 2006).
The Brazilian forestry sector is part of strategical production chains that generate economic, social, and environmental value, and is essential for regional development and the international competitiveness of agribusiness. However, there are still gaps in the combined measurement of its impacts, particularly when compared to the national agribusiness sector as a whole. In this context, the research problem that guides this study is sizing the Forest-Based Agribusiness and calculating sustainability indicators in order to estimate the relative importance of domestic agribusiness. Therefore, in view of its economic, social, and environmental importance, this study aims at measuring the Brazilian agribusiness and the Forest-Based Agribusiness in 2020, considering production, income, jobs, taxes, blue water consumption and greenhouse gas emissions, through the development of sustainability indicators. By widening the methodological scope, this study combines different variables, providing input for public policies and management strategies aimed towards sustainable development.
2 Theoretical Foundation
2.1 Sizing of agribusiness
The literature addressing the sizing of Brazilian agribusiness through input-output matrices displays both methodological and thematic evolution: it started from initial studies that established the basis to measure economic, social, and environmental impacts and moved forward incorporating environmental indicators and international comparative analyses. Furtuoso et al. (1998), introduced the methodology applied to Brasil, followed by Montoya & Guilhoto (1999), who documented the sector’s restructuring between 1959 and 1995, when agribusiness participation in the GDP rose from around 15% to ~30%. Furtuoso & Guilhoto (2003) refined the measurement for 1994–2000, showcasing direct and indirect effects and estimating shares between 28% and 35% (32% in 2000), thus, consolidating the basis for future studies.
Subsequent researches expanded their focus: Guilhoto et al. (2006, 2011) highlighted the relevance of family farm, with variable participation among states (15%–40%). Since 2010, works have been combining environmental and energy variables: Montoya et al. (2016, 2017) linked production, energy consumption, and CO2 emissions, estimating around 1.5 kg of CO2 per money unit and assigning to agribusiness ~35% of the domestic energy consumption. International and comparative studies (Sesso Filho et al., 2019, 2021; Amarante & Sesso Filho, 2020) extended the methodology to several countries, finding average income multipliers of around 1.8 and fluctuations in agribusiness's share of the GDP ranging from 15% to 35%,
In the sustainability field, recent investigations point out challenges and new metrics: Sesso Filho et al. (2024) pointed out that emissions from Brazilian agribusiness are ~1.2 times higher than the international average; Luz & Fochezatto (2022) estimated a GDP overflow coefficient of 1.4; and Sesso Filho et al. (2024) included the water footprint, showing that, in countries with intense agro-industry, the footprint can reach up to 45 m3 per GDP unit.
The input-output matrix proved to be an essential tool to attract sectorial inter-relations and multiplying effects, evolving to become part of environmental dimensions and international comparisons. Future researches must widen this integration—including technological innovation and climate changes—to support public policies that combine economic growth, social inclusion, and environmental sustainability.
2.2 Forest-Based Agribusiness in Brazil
The Brazilian forestry sector is part of a complex inter-sectorial network, in which inputs from petrochemistry and mining compose the productive base. Several studies analyze its economic components and flows, with an emphasis on quantitative approaches such as input-output matrices, time series, and econometric models. This review organizes works by Carvalho et al. (2005), Sousa et al. (2010), Valverde et al. (2005), Soares et al. (2010, 2014), Nunes Vieira et al. (2006), Santos (2006), Martins et al. (2003) and Moreira & Oliveira (2017), providing a methodological synthesis that underpins the study proposed for 2020.
Soares et al. (2014) identified cycles in the forestry GDP between 1994 and 2008: expansion up to 2000 (average growth of 4.5% per year) and subsequent retraction (decrease of 2.7% per year), influenced by credit, macroeconomy and external consumption. Soares et al. (2010) analyzes the cellulose and paper chain, with average growth of 3.8% and concentration of 55% of transactions in large companies. Moreira & Oliveira (2017) pointed out productivity of 28 m3/ha/year in commercial crops and decrease of 18% in emissions with environmental management.
Carvalho et al. (2005) indicated annual production of 3.5 million m3 of inputs, with 4.2% of the earned value resulting from petrochemistry and mining. Soares et al. (2010) estimated that 12.5% of forestry inputs were interdependent and that direct flows from the chain generated BRL 650 million in income, with multiplier of 1.7. Regional studies revealed relevant impacts: in Espírito Santo, the sector represented 8% of the economy (Valverde et al., 2005); in Minas Gerais, it generated 1.3 million jobs (Nunes Vieira et al., 2006); in Pará, Santos (2006) identified both a strong vertical integration and growth in the trade balance and formal employment between 1997 and 2005.
Martins et al. (2003) mapped the sector’s presence in Paraná, demonstrating that 9% of the inputs came from auxiliary sectors, with integration 3.2 times higher than in less-dependent chains. The analysis of the studies makes it possible to systematize data and methodologies that describe the evolution and inter-sectorial relations of the forestry sector. Carvalho et al. (2005), Sousa et al. (2010) and Soares et al. (2014) emphasize economic cycles, while Nunes Vieira et al. (2006), Santos (2006) and Martins et al. (2003) detail regional flows. Soares et al. (2010) and Moreira & Oliveira (2017) quantify operational parameters from specific segments.
The methodologies applied (input-output, time analysis, MCS) enable us to compare direct and indirect flows, economic cycles and regional impacts. The production chain and processes segmentation approach, present in Soares et al. (2010) and Moreira & Oliveira (2017), reveals industrial consolidation and integration patterns. This review provides a technical-quantitative overview of the forestry sector, giving emphasis to the importance of combining economic, social, and environmental variables for a systemic understanding. Despite the progress, there is still a lack of studies that articulate these dimensions. This works proposes sizing the Forest-Based Agribusiness in 2020 based on the domestic input-output matrix, aiming at supporting public policies and management aimed at forest chains.
International studies about the forestry sector use different methodologies. In addition to the input-output analysis, the methods employ national inventories, information systems, products labs, and statistical methodologies that combine environmental, economic, and social data—in order to reflect both regional specificities and the analysis objectives.
In Germany, for instance, Bösch et al. (2015) and Kies et al. (2010) employed input-output and spatial analyses models to understand the structure and dynamic of the forest cluster. They focused on identifying economic interdependencies and regional agglomeration patterns, making it possible to assess how the forestry sector fits into domestic production chains and how structural changes affect employment in lumber activities. This approach highlights the relevance of the quantitative analysis to attract economic flows and regional transformations.
In China, Chen et al. (2015) and Jia et al. (2023) applied input-output models geared specifically towards forestry resources and the forestry industrial chain. The goal was to measure the sector’s contribution for the domestic economy and identify bottlenecks or potentials for expansion. The Chinese methodology is characterized by a more direct use of the input-output model on natural resources, seeking to quantify environmental and economic impacts in an integrated manner. This perspective makes evident the concern in aligning economic growth with sustainability, while simultaneously providing support for industrial policies.
On the other hand, in Nordic and Baltic countries, Brizga & Räty (2024) and Tetere & Peerlings (2024) adopted methodologies that combine consumption and trade footprints with economic, social, and environmental indexes. They focused on measuring the pressure over natural resources, as well as assessing the forestry bioeconomy in terms of sustainability and competitiveness. Concurrently, Mattila et al. (2011) employed an environmentally-extended input-output analysis, which incorporated ecological fluctuations to the traditional economic model. These approaches broaden the perspective for beyond economy, combining it to environmental and social dimensions.
Trends in research on the forestry sector point out to more integrated methodologies, which combine economic input-output models with environmental and social indicators, in order to identify complex patterns of resource use. Furthermore, the increasing demand for sustainability and green bioeconomy will drive comparative studies between regions, promoting harmonized metrics and forward-looking scenarios to guide forestry policies and the sustainable economic development.
3 Methodology
3.1 Sizing of agribusiness
The sizing of Brazilian agribusiness and Forest-Based Agribusiness was based on the work by Furtuoso et al. (1998), applying it to data from Brazil. The database employed was the Global Resource Input-Output Assessment (Gloria), which makes available Brazil’s input-output matrix with 120 sectors and economic, social, and environmental satellite accounts, with data about value-added, production, employment, blue water consumption, and emissions of greenhouse gases (GHG). For more information about the database used in this work, see Lenzen et al. (2017, 2022).
The database used has 120 sectors, among them, 23 agricultural and livestock sectors and 21 agro-industrial sectors. The agribusiness production chains and the sector under analysis were divided into four aggregates: (I) Inputs, (II) Field, (III) Industry, and (IV) Commerce and Services. In the GDP calculation of Aggregate I, information regarding the costs of inputs purchased for field production is used (agricultural, forestry, livestock and fishing, and aquaculture sectors), which are available in the input-output tables. Aggregate II, field, is comprised of the primary agricultural and livestock sectors. The sectors from Aggregate III are part of the industry and Aggregate IV refers to the sectors related to commerce and services.
Estimates for Aggregate I and Agribusiness use the product of the values of the inputs used by the agricultural and livestock sectors and the respective Value-Added Coefficients (CVAi), where i = 120 sectors. In order to obtain the Value-Added Coefficients per sector (CVAi), one divides the Market-to-Market Value-Added (VAPMi) by the Sector Production (Xi), just as defined in Equation 1. The Market-to-Market Value-Added is the sum of the Basic Price Value-Added and the subsidies’ net indirect taxes on products, resulting in VAPM = VAPB + IIL. Where: VAPM = Market-to-Market Value-Added; VAPB = Basic Price Value-Added; IIL = Net Indirect Taxes.
Thus, the Gross Domestic Product of Agribusiness Inputs is estimated by Equation 2.
In Equation 2, GDP = Gross Domestic Product of the Agribusiness Aggregate I (Inputs) for all sectors part of agriculture and livestock (k, where k = 1,2,3, ..., 23), zik is the input amount of sector i for the agriculture and livestock sector k, where i = 1, 2, 3, ..., 120; and is the Value-Added Coefficient of sector i.
For the Agribusiness Aggregate II (Field), the calculation considers the value-added generated by the respective agriculture and livestock sector minus the amount used as inputs. In Equation 3, GDPII is the Gross Domestic Product of the Agribusiness Aggregate II (Field) calculated for the sectors part of agriculture and livestock (k).
In Equation 3, GDPII is the Gross Domestic Product of the Agribusiness Aggregate II (Field); is the Market-to-Market Value-Added for the k sectors.
Agribusiness Aggregate III is composed of industries whose main raw materials are originated in the field. For the GDP calculation of Aggregate III, it is estimated the sum of the value-added by agro-industrial sectors (22 sectors) minus the amounts used as inputs that were accounted for Aggregate I, just as defined in Equation 4. GDPIII is the Gross Domestic Product of Aggregate III for the agribusiness industrial sectors (q).
In Equation 4, is the sum of the Market-to-Market Value-Added of the agro-industrial sectors, numbered from 41 to 61; is the contribution from the Furniture sector and other industries for the Gross Domestic Product of the Agribusiness Aggregate III in Brazil; is the sum of the value-added of the industrial sectors used as inputs in Aggregate I; and is the sum of the amounts used as inputs of the Furniture sector and other industries for Aggregate I.
The Center for Advanced Studies on Applied Economics - CEPEA (Universidade de São Paulo, 2025) displays the evolution of calculation for sizing of agribusiness and the application of the amount 23.4% for the Furniture and other industries sector, given it is not mainly agricultural. The 25% weighting for the Furniture and other industries sector was obtained from the shares of inputs of forestry origin in relation to the other raw materials for this sector.
Regarding Aggregate IV, we consider for calculation purposes the sum of the earned value from sectors related to Transportation, Commerce, and Services. From the total amount obtained, the portion corresponding to agricultural and agro-industrial products is allocated to agribusiness during the final products demand. The systematic adopted in the calculation of the final distribution value of industrial agribusiness can be represented by Equations 5, 6 and 7.
In Equations 5, 6 and 7, the elements are defined as follows: DFG is the final global demand; IILDF is the net indirect taxes paid for the final demand; PIDF is the products imported by the final demand; DFD is the final domestic demand; VATPM is the value-added of the Market-to-Marked Transportation sector; VACPM is the Market-to-Market Value-Added of the Commerce sector; VASPM is the Market-to-Market Value-Added of the services sector; MC is the margin; DFk is the final demand from agricultural and livestock sectors k, where k = 1,2,3, ..., 23; DFq is the final demand from agro-industrial sectors q, where q = 41, 42, 43, ..., 61, 92; and GDPIV is the Gross Domestic Product of Aggregate IV (Services) for agriculture and livestock.
The total Agribusiness GDP is given by the sum of its aggregates, as well as defined by Equation 8.
Montoya et al. (2017) demonstrated that the evolution of the method for estimating agribusiness resulted in a methodology with no double counting, and its application to other economic complexes led to an accounting closing in 100% of the Gross Value-Added, employment, Gross Domestic Product, and other variables for Brazil.
3.2 Sizing of Forest-Based Agribusiness
For the estimate of Aggregate I for Forestry Agribusiness, the input amounts arising from the Forestry and Logging sector are considered (21st sector of the input-output matrix). The Gross Domestic Product of inputs (), named Aggregate I, is calculated by Equation 9.
For the Forestry and Logging sector, the field’s (Aggregate II) Gross Domestic Product is given by GDPII 21 and estimated by Equation 10.
In Equation 10, is the Market-to-Market Value-Added from the Forestry and Logging sector; is the amount of inputs used by the sector itself; and is the sector’s Value-Added Coefficient.
For Forestry Agribusiness, the Gross Domestic Product of Aggregate III (GDPIII 21) is given by the value-added from the (59) Sawmill Products, (60) Cellulose and paper, (61) Print sectors and 25% from the (92) Furniture and other industries sector minus the amounts used as inputs and respective value-added of Aggregate I. The calculation is given by Equation 11.
In Equation 11, is the sum of the Market-to-Market Value-Added of the Brazilian forest-based industry; is the contribution from the Furniture sector and other industries for the Gross Domestic Product of the Forestry Agribusiness Aggregate III; is the sum of the value-added of the forest-based industry sectors used as inputs in the Forestry Agribusiness Aggregate I; and is value-added from the Furniture and other industries sector used regarding inputs for the Forestry Agribusiness Aggregate I.
Equation 12 estimates the Gross Domestic Product of Aggregate IV for the Forestry Agribusiness (GDPIV 21), which is given based on the sector's share of total agricultural and livestock production.
The total Forest-Based Agribusiness GDP is given by Equation 12.
The calculation procedures developed to estimate the Agribusiness and the Forest-Based Agribusiness Gross Domestic Product are used for the other variables as well: employment, production, blue water consumption, and greenhouse gas emissions, and it is sufficient to replace the GDP for the other factors.
4 Results and Discussion
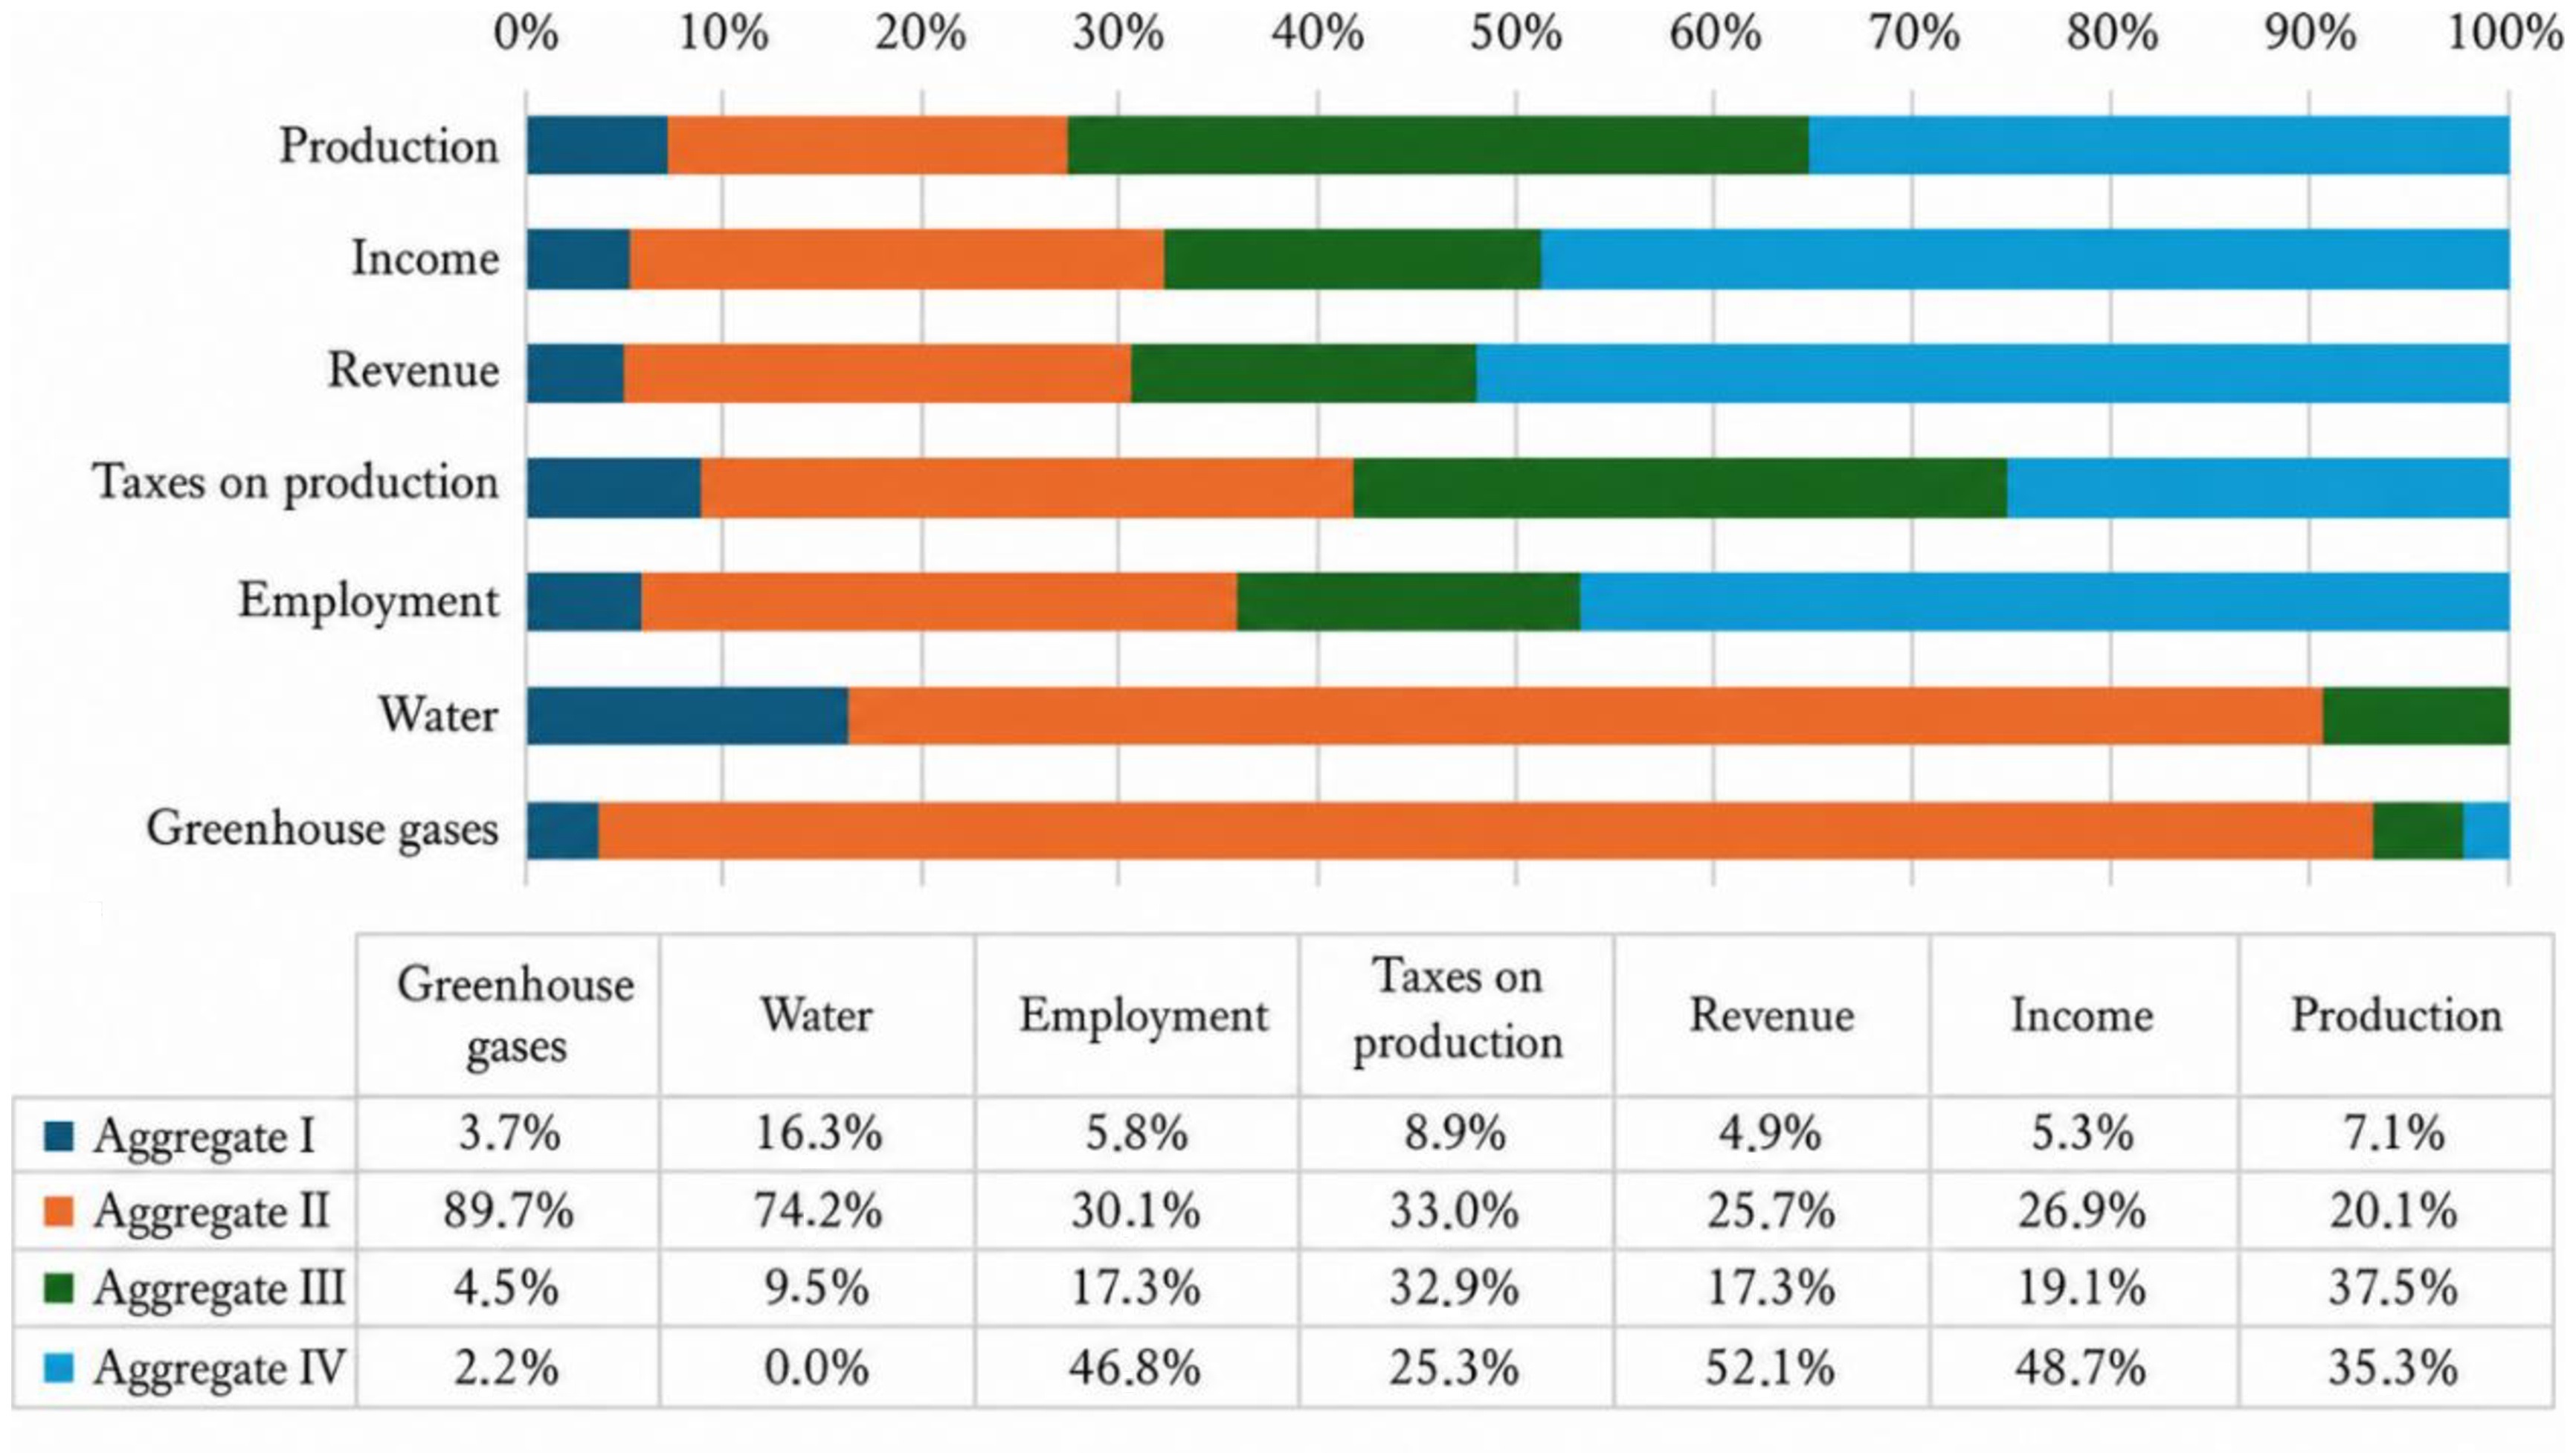
This section analyzes the results for the sizing of agribusiness and Forest-Based Agribusiness in Brazil, in total and relative amounts. The analysis on Table 1, which displays the sizing of Agribusiness in Brazil in 2020, alongside the shares of agribusiness aggregates illustrated by Figure 1, enables us to identify the four aggregates (Inputs, Field, Industry, and Services) composition and relevance for each variable analyzed, showcasing its economic, social and environmental importance.
Sizing of Agribusiness in Brazil, 2020. Aggregates: (I) Inputs, (II) Field, (III) Industry, and (IV) Services

Regarding the production’s gross amount (total of US$ 707,132.95 million), the Inputs were equal to around 7.1%; Field around 20.1%; Industry, 37.5%; and Services, 35.3%. It is therefore evident that the Industry and Services sectors accounted for most of the production’s earned value, indicating that processing activities and provision of services represented fundamental elements in the agribusiness production chain. This result highlights the sector’s economic relevance in the processing activity and value generation, decisively contributing for the agribusiness competitiveness.
The Brazilian agribusiness was sized in US$ 320 billion in Gross Domestic Product (income) in 2020, representing around 21.6% of the country’s total, which was of US$ 1.476 trillion. In terms of income generated by agribusiness, it accounts for about 5.3%; Field, 26.9%; Industry, 19.1%; and Services, around 48.7% of the total. Similarly, in the work Revenue variable (total of US$ 147,823.83 million), Inputs added up to approximately 4.85%; Field, 25.7%; Industry 17.3%; and Services, 52.1%. These data demonstrate that, although the agricultural and livestock sector (Field) is significant in primary production, the Services aggregate leads income generation and work revenue. This economic profile shows that the Services sector contributes in a relevant way for the economic boost of agribusiness.
Regarding generation of Taxes on production (total of US$ 6,047.18 million), the aggregates’ share was allocated in a relatively balanced way between Field and Industry, which equaled to around 33% and 32.9%, respectively. Services and Inputs equaled to around 25.3% and 8.9%. The allocation displays the combined relevance of aggregates that constitute both the field and the industrial chain for the tax base formation, emphasizing the importance of these sectors for tax revenue.
In the social sphere, the Employment variable (total of 24,906,441 jobs) displayed the following shares: Inputs, 5.8%; Field, 30.1%; Industry, 17.4%; and Services, 46.8%. Thus, the Services aggregate stood out as main job generator, followed by Field. The values showcase agribusiness’ relevant social impact, equaling to near 25% of the total of employed people during 2020, which contributes for social inclusion.
From an environmental perspective, the analysis of blue water Consumption (total of 16,996.30 million cubic meters) shows that Field equaled to around 74.1% of consumption, Inputs for around 16.3%, while Industry and Services accounted for marginal shares, of approximately 9.5% and 0.02%, respectively. This allocation emphasizes the intensity of water resources in the Field sector, which imposes challenges to the sustainable management of natural resources. Regarding Emissions of Greenhouse Gases (total of 704.885,30 kt of Co2eq), Field was the main responsible, accounting for around 89.7% of emissions, followed by Inputs (3.7%), Industry (4.5%) and Services (2.2%). This scenario reflects the environmental impact concentrated in agricultural and livestock activities, particularly those related to pasture management, crop, and livestock, highlighting the need for more sustainable production practices and strategies to reduce emission of pollutants.
The results show that, in the economic sphere, the Industry and Services aggregates account for most of the earned value in the gross value of agribusiness production, with contribution of 37.5% and 35.3%, respectively, and that Services lead in income generation (value-added) (48.7%) and work revenue (52.1%). These results indicate the importance of processing activities and adding value for the sector’s competitiveness. In comparison to previous studies, Furtuoso & Guilhoto (2003) and Montoya & Guilhoto (1999) demonstrated that the agribusiness share in the GDP ranged between 28% and 35%, reaching an estimate of around 32% in 2000, showcasing the sector’s robust economic impact in the Brazilian economy.
The Services sector was responsible for 46.8% of jobs, followed by Field activities, which equaled to 30.1% of jobs. Studies by Guilhoto et al. (2006, 2011) highlighted that this sector contributes with around 25% to 30% for the agribusiness complex, reinforcing the main role of rural activities in income and job generation in rural areas on family farms.
In the environmental sphere, this study’s analysis points out that the Field activities were responsible for approximately 71.1% of blue water consumption and 89.7% of greenhouse gas emissions, demonstrating that the environmental impacts are concentrated in primary operations. In parallel, Montoya et al. (2016, 2017) and Sesso Filho et al. (2024) combined environmental indicators, such as emission of approximately 1.5 kg of CO2 per monetary unit generated and water footprint of up to 45 m3 per GDP unit in intense agro-industrial contexts, highlighting the need for sustainable practices that mitigate these impacts.
The comparative analysis of the studies showcase the need for combined approaches that consider multiple aspects and inter-relations from the sector, essential for public policies that align economic growth, social inclusion, and environmental sustainability. The Brazilian agribusiness, in addition to being one of the pillars of the economy, serves a critical social function by generating millions of jobs and promoting regional development, as well as facing relevant environmental challenges, such as water consumption and greenhouse gas emissions. Its economic supremacy is a result from a strong share of the Industry and Services aggregates in the value and income creation, while the Field production base—essential for primary production—imposes greater environmental challenges. Thus, agribusiness is vital for Brazil’s economic and social-economic impetus, demanding sustainable practices that combine productivity and preservation of natural resources.
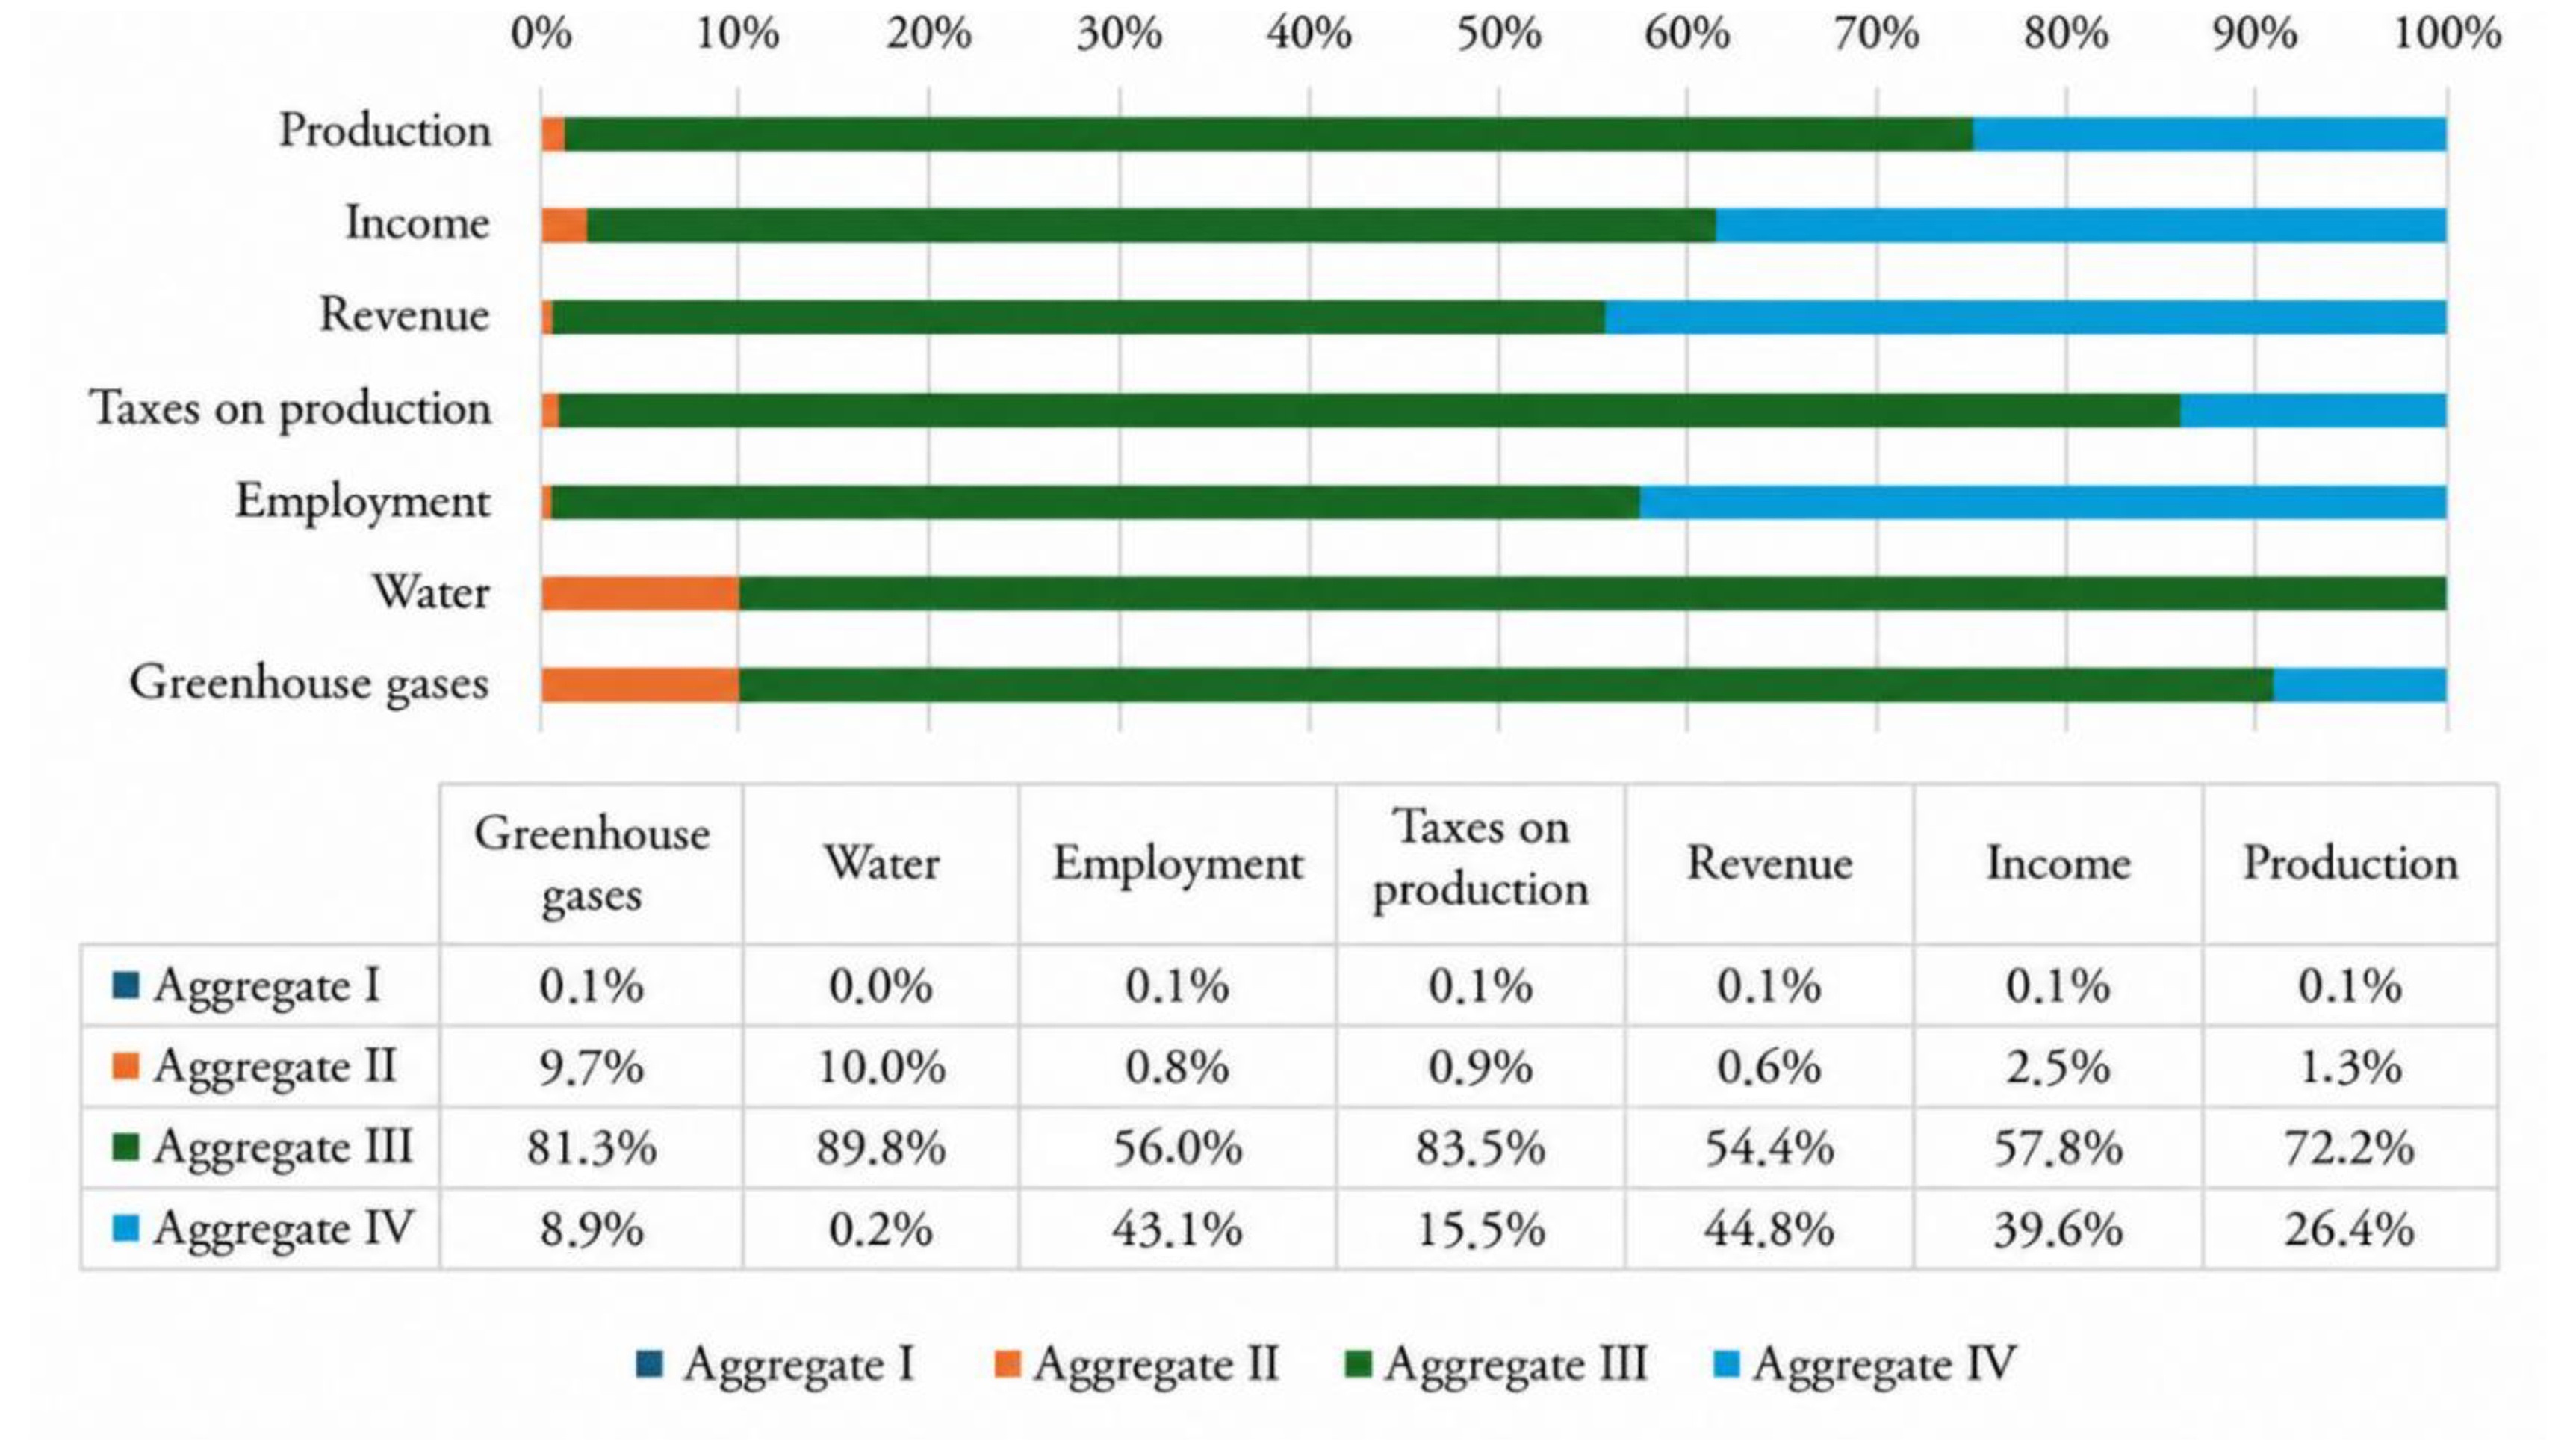
Table 2 displays the results from the sizing of Forest-Based Agribusiness in 2020. The amounts show the contributions from the four aggregates—Inputs, Field, Industry, and Services—enabling a detailed quantitative analysis under economic, social, and environmental terms. Figure 2, in turn, illustrates the share of each aggregate in the variables generation under analysis. Considering the economic variables, such as production gross value, whose total is determined in US$ 67,080.70 million, the Inputs aggregate represents around 0.12% of the total amount, while Field contributes with around 1.29%. This supremacy is observed in Industry, which equals to approximately 72.2% of production, and Services, which equals to approximately 26.4%. Thus, the industrial activity proves itself as the main generator of earned value in the production sphere.
Sizing of Forest-Based Agribusiness in Brazil, 2020. Aggregates: (I) Inputs, (II) Field, (III) Industry, and (IV) Services
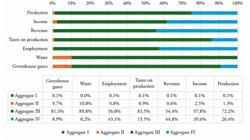
In regards to Income, totaling US$ 27,959.56 million, the Inputs aggregate equals to around 0.11% and Field for approximately 2.49%, while Industry and Services contribute with 57.8% and 39.6%, respectively. This allocation highlights the centrality of the industrial sector in income generation, with services also performing a relevant role, thus, demonstrating complementarity between the manufacturing and provision of services aggregates. The Taxes on Production variable, with a total of US$ 700.61 million, showcases a concentration of tax revenue in Industry, which accounts for around 83.4%, in comparison with Services (15.5%), while the Inputs and Field aggregates display a practically insignificant contribution—0.12% and 0.93%, respectively. This hierarchy emphasizes the tax weight of the industrial sector and its importance for the state tax revenue.
The social impact, employment and work revenue variables are important to measure the contribution from production chains for society. In the employment sphere, the complex employed 1,921,158 jobs, in which the relative share of aggregates was allocated in such a way that the Inputs sector accounted for approximately 0.11% and Field for around 0.83%. On the other hand, Industry was responsible for approximately 56.0% of the jobs, while Services for around 43.06%. This allocation showcases the centrality of the industrial activity in job generation, complemented in a significant way by the services sector, both essential for the job market dynamic. Regarding Revenue, which reaches a total of US$ 12,191.54 million, it is evident that the shares of Inputs and Field aggregates were marginal, representing approximately 0.12% and 0.60%, respectively. Industry accounted for 54.45% of this indicator, while Services for around 44.86%. These results indicate that, despite the industrial sector holding a slight advantage in productivity or in earned value per unit, the services play an important role in the production chain of the Forest-Based Agro-Industrial Complex.
Environmental impacts, such as blue water consumption and greenhouse gas emissions, are important to measure sustainability. The analysis of Blue Water Consumption, with a total of 154.11 million cubic meters, demonstrates that the Industry aggregate accounted for an expressive share, consuming approximately 89.83%, followed by Field with around 10%. The Inputs and Services aggregates displayed almost-marginal shares, of 0.03% and 0.15%, respectively. Therefore, industrial processes are highly dependent on water resources, emphasizing the need for sustainable water management practices. Taking into account the Emissions of Greenhouse Gases, expressed in 12,388.20 kt of CO2 equivalent, it is possible to verify that the Inputs aggregate represented approximately 0.10%; Field, 9.70%; and Services, around 8.86% and, prominently, Industry accounted for around 81.3% of the total emissions. Such concentration highlights the prominent role the industrial sector plays regarding emission of pollutants, indicating the urgent need for less carbon-intense technologies and processes that mitigate environmental impact.
The results show that, for all variables assessed in the sizing of Forest-Based Agribusiness in Brazil, the Industry aggregate plays a prominent role, constituting as main economic engine, job generator, and source of environmental impacts in Forest-Based Agribusiness. Despite the Services sectors being equally relevant in the income, revenue, and employment indicators, the intense consumption of resources and emissions in the industrial aggregate highlights the need for strategies that combine production efficiency and environmental sustainability. This integrated understanding can support the formulation of policies that balance economic growth and social-environmental responsibility by means of technological modernization and enhancement of production processes.
The data analysis of Figure 3 demonstrates that Forest-Based Agribusiness has a relevant share in several variables that compose the Brazilian agribusiness. From an economic perspective, the “Taxes on production” variable showcases a larger share, with 11.59% of the agribusiness total, indicating that the sector generates significant tax value for the country. Furthermore, “Production” equals to 9.49%, while “Income” and “Revenue” contribute with 8.74% and 8.25%, respectively, which highlights the complex’s importance in generating high earned value products, enhancing revenue and creating wealth. These numbers reinforce the sector’s role as economic engine that not only boosts the GDP, but also attracts investments and promotes integration with other sectors, such as packaging, export and related agribusiness sectors. Based on this fiscal burden, two policies able to reduce the sector’s tax burden are: (1) grant a partial and temporary tax exemption on operations employing forestry products in natura and forestry inputs for a definite period, dependent upon proof of the raw material’s legal origin and maintenance of sustainable management practices; and (2) institute a reimbursable fiscal credit mechanism equivalent to a percentage of proven investments in water efficiency, treatment of effluents, and reduction of carbon dioxide emissions. The benefit shall be released upon independent verification of the results and reinvestment of part of the benefit to local professional training programs.
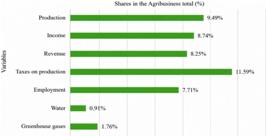
From a social and environmental perspective, the data also indicate relevant contributions. With 7.71% of shares in the agribusiness total in the “Employment” variable, the complex displays its capacity to create job opportunities—essential for the development of the regions its activities are located at. Regarding environmental aspects, although “Water” and “Greenhouse Gases” account for relatively small shares (0.91% and 1.76%, respectively), these values indicate there are impacts that, however modest, must be monitored and managed by means of sustainable practices. Together, these results showcase that Brazilian forest-based industries play an integrated role: economically robust by means of production, taxation, and income generation; socially efficient by means of job creation; and environmentally relevant, demanding the adoption of technologies and initiatives that minimize the impact on natural resources.
This study presents results that reinforce the importance of the manufacturing processes for the creation of earned value. In previous studies, Soares et al. (2014) demonstrated that the expansion cycles of the forestry sector GDP were driven by inter-sectorial investments and transactions, indicating the importance of industrial activities and its structural role in economy, which confirms the centrality of the industrial component showcased in this study.
From a social perspective, the industrial sector generated approximately 56% of jobs and 54.45% of work revenue, and Services accounted for approximately 43% of jobs and 44.86% of work revenue. Similar results from those observed by Santos (2006) and Martins et al. (2003), who demonstrated that the combination of the manufacturing and provision of services sector is decisive for job and income generation in the assessed regional contexts.
From an environmental perspective, the blue water consumption and greenhouse gases emission is concentrated in the industrial sector (89.83% and 81.3%, respectively), showcasing how highly dependent the industrial processes are of water resources and fossil fuel. These data complement the findings by Moreira & Oliveira (2017), who reported that investments in environmental management may significantly reduce emissions, and reinforce the analysis by Soares et al. (2010) and Carvalho et al. (2005), who emphasize the need to merge the productive flows in order to mitigate environmental impacts, keeping agribusiness competitiveness and sustainability.
The data analysis presented in Table 3—which contains sustainability indicators—reveals significant differences between Forest-Based Agribusiness and Agribusiness in Brazil, under economic, social and environmental terms. From an economic perspective, the “Income per production unit” indicators show that, despite the total amounts being similar (0.42 for Forest-Based Agribusiness against 0.45 for Agribusiness), there are differences in some aggregates. In Aggregate II (Field), for instance, Forest-Based Agribusiness displays an amount of 0.81 in comparison to 0.61 in Agribusiness, showcasing greater efficiency in earned value generation in field activities in the forestry sector. The “Work productivity (income per worker)” is also higher in Forest-Based Agribusiness, with total average of 14,550 US$/year, in comparison to 12,850 US$/year in Agribusiness; more relevant differences were seen in Aggregates I (13.89 against 11.68) and II (43.42 against 11.51). The “Average revenue per worker” and “Jobs per production unit” indicators reinforce this comparison, in which Forest-Based Agribusiness displayed a total average revenue of 6,350 US$/year (higher than 5.940 US$/year of Agribusiness) and, despite the total number of jobs being lower (28.64 jobs versus 35.22 jobs per US$ 1 million), the variable allocation per aggregate reveals that, for instance, in the industrial sector, Forest-Based Agribusiness (22.21 jobs) surpasses Agribusiness (16.28 jobs).
Sustainability indicators for Forest-Based Agribusiness and Agribusiness in Brazil, 2020. Aggregates: (I) Inputs, (II) Agriculture and Livestock, (III) Industry, and (IV) Services.
In the environmental sphere, the differences between both sectors are even more prominent. The total “Blue water consumption per income unit” is considerably lower in Forest-Based Agribusiness (5,512.02 m3/ US$ 1 million) in comparison to Agribusiness (53,114.45 m3/US$ 1 million), with emphasis on Aggregate I—where Forest-Based Agribusiness consumes 1,405.87 m3 of blue water against 164,345.43 m3 observed in Agribusiness—and Aggregate II— with 22,089.46 m3 versus 146,205.42 m3, respectively. Regarding “Emissions per income unit”, Forest-Based Agribusiness accounts for 443.08 tonnes of CO2eq/US$ 1 million, while Agribusiness accounts for 2,202.81 tonnes, showcasing an emission approximately 5 times higher in the latter. This trend continues when indicators are assessed “per worker”, because the total blue water consumption is of 80.22 m3 per job in Forest-Based Agribusiness (in comparison to 682.41 in Agribusiness), and total emissions are 6.45 tonnes of CO2eq per worker in Forest-Based Agribusiness, compared to 28.30 tonnes in Agribusiness.
In summary, these data indicate that Forest-Based Agribusiness has, in average, a better environmental performance, with lower water consumption and greater efficiencies in regards to emissions per income unit and per worker, while it also stands out for its robust economic indexes, despite using an employment structure relatively less intensive than Agribusiness. This integrated analysis demonstrates the importance of considering both economic and social results, as well as environmental impacts when assessing the different production models from the forestry sector in comparison to agribusiness.
Forest-Based Agribusiness stands out in an integrated way across three fundamental dimensions—economic, social, and environmental—when compared to Agribusiness in general. It is evident that, although the Forest-Based Agribusiness total earned value (0.42) is very close to Agribusiness (0.45), there are striking differences in specific aggregates. In the “Field” (Aggregate II) group, Forest-Based Agribusiness reaches 0.81 in comparison to 0.61 from Agribusiness. This difference suggests that, during the field production stage, the forest system is capable of generating a significantly higher value per invested unit, possibly due to the use of different inputs, more efficient management practices or the earned value of forestry products.
With an average production of 14,550 US$/year per worker, Forest-Based Agribusiness surpasses Agribusiness, which displays 12,850 US$/year. This advantage is particularly noticeable in Aggregates I (Inputs) and II (Field), where Forest-Based Agribusiness workers generate, respectively, 13,890 and 43,420 US$/year, numbers that showcase an expressive efficiency, particularly in field activities; these data suggest that the production processes implemented in the forestry chain may result in a better use of human resources. Despite the number of jobs per production unit being lower in Forest-Based Agribusiness (28.64 jobs) in comparison to Agribusiness (35.22 jobs), the workers’ average revenue in the forestry complex (6.35 US$/year) is higher than the one registered in the agribusiness sector (5.94 US$/year). Furthermore, in the industrial sector, Forest-Based Agribusiness generates 22.21 jobs per million US$ in production, surpassing the 16.28 of Agribusiness, which indicates greater capacity of job generation in the forest-based agro-industries.
One of the most striking contrasts lies in blue water consumption. Forest-Based Agribusiness uses, in average 5,512.02 m3 of water per US$ 1 million of earned value, while Agribusiness reaches 53,114.45 m3. This difference is even more prominent in the Inputs and Field aggregates, where Agribusiness consumption levels are ten or even a hundred times higher than in Forest-Based Agribusiness. The significant water savings demonstrates a more rational and sustainable management practice, which is essential in a scenario of increasing water scarcity and climate challenges. Taking into consideration emissions per income unit, Forest-Based Agribusiness emits 443.08 tonnes of CO2eq against 2,202.81 tonnes in Agribusiness, nearly a 80% difference in emissions. This trend continues when the parameter is adjusted per worker (6.45 tonnes of CO2eq in Forest-Based Agribusiness 28.30 tonnes in Agribusiness), showcasing an approach that is both less intensive in carbon and more in line with the need to reduce environmental impacts in the production sector.
The study results demonstrate that Forest-Based Agribusiness in 2020 had a relevant economic performance, with income, jobs, and taxes generation, in addition to more favorable environmental indicators in comparison to domestic agribusiness, with lower blue water consumption and lower emissions of Co2eq per income unit. This evidence reinforces the idea that the forestry sector represents a more efficient and sustainable structure, in line with bioeconomy practices.
The analysis directly engages with Luz & Fochezatto (2022), who highlighted the GDP overflowing effect of the Brazilian agribusiness, showcasing how certain sectors have a positive impact in other sectors of the economy. In the case of the forestry base, the results suggest that its energy and environmental efficiency boosts this overflowing in a different way. Moreover, the findings relate to Sesso Filho et al. (2024), who analyzed the agribusiness water footprint in different countries and showcased significant variations according to the industrialization level. The relatively better performance of the Brazilian forestry sector regarding water use reinforces its strategical position in the search for a more sustainable and internationally competitive agribusiness.
Social indicators such as average revenue and work productivity indicate that the forest-based model can offer better working conditions, even with lower job intensity. This balance between economic efficiency and lower environmental impact is essential for sustainable development, because it makes it possible to generate value without compromising natural resources or the communities’ quality of life. Despite agribusiness concentrating more jobs, Forest-Based Agribusiness, with its efficient model, can strengthen a more competitive and resilient economy, in line with current sustainability demands. The combination between economic, social, and environmental aspects points out to the modernization of production models, fostering initiatives that align growth with environmental preservation and social inclusion.
Forest-Based Agribusiness environmental sustainability is based on the fact that rapid-growing forest crops, such as Eucalyptus and Pinus, frequently consume less blue water per production unit due to three interconnected mechanisms: growth dynamic and crown closure, which concentrates higher transpiration in specific phases of the cycle, greater efficiency of water conversion into biomass, and intensive management that optimizes densities and rotations. Studies on water balance and evotranspiration measurements showcase that, although the absolute annual evotranspiration is comparable to the native vegetation in some contexts, when consumption is normalized per tonne of timber produced or income generated, intensive crops tend to present lower use of blue water (Caldato & Schumacher, 2013; García Chevesich et al., 2017). Furthermore, deep soils and management that favors deep rooting enable part of the water consumed to come from reserves not classified as available surface water, reducing immediate impacts on superficial flows in basins with proper recharge (White et al., 2022).
Regarding net emissions of CO2eq in forestry production, the main reason for lower relative emissions is the high carbon sequestration in biomass during the short cycles of growth and storage potential in long-lasting products. Rapid-growing crops accumulate large carbon stocks per hectare in relatively short periods; when timber is intended for long-lasting uses (sawn timber, furniture) or when residues are converted into biochar, carbon remains stocked for decades or centuries, reducing liquid emission associated to the production (Behera et al., 2020). Carbon flow studies and biomass inventories suggest that the final climate balance critically depends on the timber destination and post-cut management: fire without capture or rapid decomposition of waste may annul part of the benefit, while long-term uses and sustainable management practices widen the net sequestration (García Chevesich et al., 2017; Silva et al., 2024).
Low emission of CO2eq per income unit observed in the cellulose sector results from the energy matrix used by industries, strongly based on black liquor and biomass. These byproducts of the industrial process itself substitute fossil sources, ensuring high energy self-sufficiency and significantly reducing carbon intensity. This characteristic grants the sector with a comparative advantage in regards with sustainability, by aligning productive efficiency with lower environmental impact (Brito & Carvalho, 2013; Silva et al., 2018).
Taking into consideration the forestry production characteristics listed so far, the combination of water efficiency per unit produced and carbon sequestration makes forest-based production a less intense alternative in terms of blue water consumption and CO2eq emissions across many production scenarios, but with important local constraints. Factors such as regional climate, soil depth and retention capacity, rainfall regime, population age, crop density, and timber destination determine if the benefits observed in field studies and revisions occur on a basin scale (Caldato & Schumacher, 2013; White et al., 2022).
The analysis of sustainability indicators show that Forest-Based Agribusiness combines value generation and high productivity to efficient use of natural resources and reduction of greenhouse gases emissions. This combination makes the complex a strategic asset for a more sustainable agribusiness, particularly in view of the urgent need for environmental conservation and water management. The results can guide public policies geared towards promoting sustainable practices, technological modernization, qualification, and economic incentives for low-impact initiatives. It is important to consider comparisons with other models and explore how integrated systems, such as farm-livestock-forest, may widen social, economic, and environmental benefits.
5 Conclusions
The results indicated that Forest-Based Agribusiness reached the generation of US$ 67 billion in production, around US$ 28 billion in income (value-added), US$ 701 million in taxes on production and close to 2 million jobs and US$ 12 billion in work revenue in 2020. The amounts accounted for, in the Brazilian agribusiness context, 9.49% of production; 8.74% of income; 11.59% of taxes on production; 7.7% of jobs; and 8.25% of total labor revenue, highlighting the significant share and economic relevance of the forestry sector within agribusiness. The measured environmental impacts of blue water consumption was of 154 million m3, 0.91% of the agribusiness total and emissions around 12.4 gigatonnes (Gt) of CO2eq (1.76%).
The sustainability indicators showed that Forestry Agribusiness consumed 5,512.02 m3 of blue water and emitted 443.08 tonnes of CO2, equivalent to US$ 1 million in income; number lower than the 53,114.45 m3 and 2,202.81 tonnes from agribusiness, respectively. The Forest-Based Agribusiness also displayed advantages in regards to economic and social sustainability. Work productivity was of 14,550 US$/year against 12,850 US$/year of agribusiness, in addition to an average worker’s revenue of 6,350 US$/year, surpassing the 5,940 US$/year from the sector as a whole. From a social perspective, although the number of jobs created per production unit was smaller (28.64 jobs per US$ 1 million of production in comparison to 35.22 in agribusiness), this structure reflects an optimized allocation of human resources and greater generation of earned value per job, combining economic efficiency with a lower environmental impact and better operational conditions.
Taking this study as a starting point, we suggest an agenda of future investigations aimed towards rural economy and sustainability of agroforestry chains with the development of econometric and industrial Organization studies to identify structural factors, such as market concentration, green credit policies, and logistical bottlenecks, which determine the observed sustainability indicators.
-
How to cite:
Sesso Filho, U. A., Lopes, R. L., Gonçalves Junior, C. A., Sesso, P. P., & Esteves, E. G. Z. (2026). Sizing and sustainability of Forest-Based Agribusiness in Brazil in 2020: an analysis by the Input-Output Matrix. Revista de Economia e Sociologia Rural, 64, e304833. https://doi.org/10.1590/1806-9479.2026.304833en
-
Financial support:
Conselho Nacional de Desenvolvimento Científico e Tecnológico (CNPq)
-
Ethics approval:
Not applicable.
-
JEL Classification:
Q01, C67, Q5.
Data availability:
Research data is not available.
References
-
Amarante, R. L., & Sesso Filho, U. A. (2020). Estimativa do produto interno bruto do agronegócio e sua relação com a renda per capita em 190 países. Iniciação Científica Cesumar, 22(1), 79-91. https://doi.org/10.17765/1518-1243.2020v22n1p79-91
» https://doi.org/10.17765/1518-1243.2020v22n1p79-91 -
Behera, L., Ray, L., Nayak, M., Mehta, A. A., & Patel, S. M. (2020). Carbon sequestration potential of Eucalyptus spp.: a review. E-Planet, 18, 79-84. Recuperado em 4 de fevereiro de 2025, de https://www.e-planet.co.in/images/Publication/vol-18-1/carbon.pdf
» https://www.e-planet.co.in/images/Publication/vol-18-1/carbon.pdf -
Bösch, M., Weimar, H., & Dieter, M. (2015). Input–output evaluation of Germany’s national cluster of forest based industries. European Journal of Forest Research, 134(5), 899-910. https://doi.org/10.1007/s10342-015-0898-7
» https://doi.org/10.1007/s10342-015-0898-7 - Brito, J. O., & Carvalho, A. M. M. L. (2013). Uso da biomassa florestal para geração de energia no Brasil: perspectivas e desafios. Revista Árvore, 37(2), 269-280.
-
Brizga, J., & Räty, T. (2024). Production, consumption and trade based forest land and resource footprints in the Nordic and Baltic countries. Forest Policy and Economics, 161, 103166. https://doi.org/10.1016/j.forpol.2024.103166
» https://doi.org/10.1016/j.forpol.2024.103166 -
Caldato, S. L., & Schumacher, M. V. (2013). O uso de água pelas plantações florestais – Uma revisão. Ciência Florestal, 23(3), 507-516. https://doi.org/10.5902/1980509810562
» https://doi.org/10.5902/1980509810562 -
Carvalho, R. M. M. A., Soares, T. S., & Valverde, S. R. (2005). Caracterização do setor florestal: uma abordagem comparativa com outros setores da economia. Ciência Florestal, 15(1), 105-118. https://doi.org/10.5902/198050981828
» https://doi.org/10.5902/198050981828 -
Chen, W., Xu, D., & Liu, J. (2015). The forest resources input–output model: an application in China. Ecological Indicators, 51, 87-97. https://doi.org/10.1016/j.ecolind.2014.09.007
» https://doi.org/10.1016/j.ecolind.2014.09.007 - Davis, J. H., & Goldberg, R. A. (1957).A concept of agribusiness. Boston: Harvard University.
-
Furtuoso, M. C. O., & Guilhoto, J. J. M. (2003). Estimating and measuring the agribusiness GDP an application to the Brazilian economy, 1994 to 2000. Revista de Economia e Sociologia Rural, 41, 803-827. https://doi.org/10.1590/S0103-20032003000400005
» https://doi.org/10.1590/S0103-20032003000400005 -
Furtuoso, M. C. O., de Camargo Barros, G. S. A., & Guilhoto, J. J. M. (1998). O produto interno bruto do complexo agroindustrial brasileiro. Revista de Economia e Sociologia Rural, 36(3), 9-32. Recuperado em 4 de fevereiro de 2025, de https://app.periodikos.com.br/journal/resr/article/5da373be0e88252d5aba68e2
» https://app.periodikos.com.br/journal/resr/article/5da373be0e88252d5aba68e2 -
García-Chevesich, P. A., Neary, D. G., Scott, D. F., & Benyon, T. R. (Eds.). (2017). Forest management and the impact on water resources: a review of 13 countries (IHP - VIII / Technical Document, No. 37). United Nations Educational, Scientific, and Cultural Organization. Recuperado em 24 de janeiro de 2025, de https://research.fs.usda.gov/download/treesearch/54133.pdf
» https://research.fs.usda.gov/download/treesearch/54133.pdf -
Guilhoto, J. J., Silveira, F. G., Ichihara, S. M., & Azzoni, C. R. (2006). A importância do agronegócio familiar no Brasil. Revista de Economia e Sociologia Rural, 44(3), 355-382. https://doi.org/10.1590/S0103-20032006000300002
» https://doi.org/10.1590/S0103-20032006000300002 -
Guilhoto, J., Azzoni, C. R., Silveira, F. G., Ichihara, S. M., Diniz, B. P. C., & Moreira, G. R. C. (2011). PIB da agricultura familiar: Brasil-Estados. SSRN. Recuperado em 5 de abril de 2025, de https://www.gov.br/mda/pt-br/acervo-nucleo-de-estudos-agrarios/nead-estudos-1/17-pib-da-agricultura-familiar-brasil-e-estados.pdf
» https://www.gov.br/mda/pt-br/acervo-nucleo-de-estudos-agrarios/nead-estudos-1/17-pib-da-agricultura-familiar-brasil-e-estados.pdf -
Jia, W., Cao, F., & Jia, X. (2023). Input-output analysis of china’s forest industry chain. Forests, 14(7), 1391. https://doi.org/10.3390/f14071391
» https://doi.org/10.3390/f14071391 -
Kies, U., Klein, D., & Schulte, A. (2010). Germany’s forest cluster: Exploratory spatial data analysis of regional agglomerations and structural change in wood based employment — Primary wood processing. Forstarchiv (Hannover), 81, 236-245. https://doi.org/10.2376/0300-4112-81-236
» https://doi.org/10.2376/0300-4112-81-236 -
Lenzen, M., Geschke, A., Abd Rahman, M. D., Xiao, Y., Fry, J., Reyes, R., Dietzenbacher, E., Inomata, S., Kanemoto, K., Los, B., Moran, D., Schulte in den Bäumen, H., Tukker, A., Walmsley, T., Wiedmann, T., Wood, R., & Yamano, N. (2017). The Global MRIO Lab: charting the world economy. Economic Systems Research, 29(2), 158-186. https://doi.org/10.1080/09535314.2017.1301887
» https://doi.org/10.1080/09535314.2017.1301887 -
Lenzen, M., Geschke, A., West, J., Fry, J., Malik, A., Giljum, S., & Milà i Canals, I. (2022). Implementing the material footprint to measure progress towards Sustainable Development Goals 8 and 12. Nature Sustainability, 5(2), 157-166. https://doi.org/10.1038/s41893-021-00811-6
» https://doi.org/10.1038/s41893-021-00811-6 - Luz, A. D., & Fochezatto, A. (2022). The spillover of the Agribusiness GDP in Brazil: an analysis of the sectoral importance via Input-Output Matrices. Revista de Economia e Sociologia Rural, 61(1), e253226. https://doi.org/10.1590/1806-9479.2021.253226.
-
Martins, G., Corso, N. M., Kureski, R., Hosokawa, R. T., & Rochadelli, R. (2003). Inserção do setor florestal na estrutura econômica do Paraná: análise insumo-produto. Revista Paranaense de Desenvolvimento-RPD, (104), 5-21. Recuperado em 12 de abril de 2025, de https://ipardes.emnuvens.com.br/revistaparanaense/article/view/189/157
» https://ipardes.emnuvens.com.br/revistaparanaense/article/view/189/157 -
Mattila, T., Leskinen, P., Mäenpää, I., & Seppälä, J. (2011). An environmentally extended input output analysis to support sustainable use of forest resources. The Open Forest Science Journal, 4(1), 15-23. https://doi.org/10.2174/1874398601104010015
» https://doi.org/10.2174/1874398601104010015 -
Montoya, M. A., & Guilhoto, J. J. (1999). Dimensão econômica e mudança estrutural no agronegócio brasileiro entre 1959 e 1995.Passo Fundo: UPF. Recuperado em 24 de janeiro de 2025, de https://cdi.mecon.gob.ar/bases/docelec/upf/0399.pdf
» https://cdi.mecon.gob.ar/bases/docelec/upf/0399.pdf -
Montoya, M. A., Pasqual, C. A., Lopes, R. L., & Guilhoto, J. J. M. (2016). Consumo de energia, emissões de CO2 e a geração de renda e emprego no agronegócio brasileiro: uma análise insumo–produto. Economia Aplicada, 20(4), 383-413. https://doi.org/10.11606/1413-8050/ea134600
» https://doi.org/10.11606/1413-8050/ea134600 -
Montoya, M. A., Pasqual, C. A., Lopes, R. L., & Guilhoto, J. J. M. (2017). Dimensão econômica e ambiental do agronegócio brasileiro na década de 2000: uma análise insumo-produto da renda, do consumo de energia e das emissões de CO2 por fonte de energia. Revista Brasileira de Estudos Regionais e Urbanos, 11(4), 557-577. Recuperado em 4 de março de 2025, de https://revistaaber.org.br/rberu/article/view/219
» https://revistaaber.org.br/rberu/article/view/219 -
Moreira, J. M. M. A. P., & Oliveira, E. B. (2017). Importância do setor florestal brasileiro com ênfase nas plantações florestais comerciais. In Y. M. M. Oliveira & E. B. Oliveira (Eds.), Plantações florestais: geração de benefícios com baixo impacto ambiental (pp. 11-20). Embrapa. Recuperado em 4 de março de 2025, de https://www.sidalc.net/search/Record/digalicedoc1076139/Description
» https://www.sidalc.net/search/Record/digalicedoc1076139/Description -
Nunes Vieira, L. A., Soares, T. S., Miranda Armond Carvalho, R. M., & Batista Rezende, J. (2006). Dimensionamento do setor florestal em Minas Gerais. Cerne, 12(4), 389-398. Recuperado em 2 de abril 2025, de https://www.redalyc.org/articulo.oa?id=74412410
» https://www.redalyc.org/articulo.oa?id=74412410 -
Santos, R. B. N. (2006). Análise intersetorial e espacial dos setores extrativo florestal e de madeira e mobiliário na economia paraense (Dissertação de mestrado). Universidade Federal Rural da Amazônia, Belém. Recuperado em 4 de março de 2025, de http://repositorio.ufra.edu.br/jspui/handle/123456789/1760
» http://repositorio.ufra.edu.br/jspui/handle/123456789/1760 -
Sesso, P. P., Mendes, F. H., Sesso Filho, U. A., & Zapparoli, I. D. (2022). Agronegócio de países selecionados: análise de sustentabilidade entre o PIB e emissões de CO2 Revista de Economia e Sociologia Rural, 61(2), e258543. https://doi.org/10.1590/1806-9479.2022.258543
» https://doi.org/10.1590/1806-9479.2022.258543 -
Sesso Filho, U. A., Trindade Borges, L., Pompermayer Sesso, P., Alves Brene, P. R., & Domenes Zapparoli, I. (2019). Geração de emprego, renda e emissões atmosféricas do complexo agroindustrial: um estudo para quarenta países. Revista de Economia e Agronegócio, 17(1), 30-55. https://doi.org/10.25070/rea.v17i1.7902
» https://doi.org/10.25070/rea.v17i1.7902 -
Sesso Filho, U. A., Borges, L. T., Pompermayer Sesso, P., Brene, P. R. A., & Esteves, E. G. Z. (2021). Mensuração do complexo agroindustrial no mundo: comparativo entre países. Revista de Economia e Sociologia Rural, 60(1), e235345. https://doi.org/10.1590/1806-9479.2021.235345
» https://doi.org/10.1590/1806-9479.2021.235345 -
Sesso Filho, U. A., Lopes, R. L., Gonçalves, C. A., Esteves, E. G. Z., & Sesso, P. P. (2024). Produto Interno Bruto e pegada hídrica do agronegócio: comparativo entre países. Revista de Economia e Sociologia Rural, 62(4), e274229. https://doi.org/10.1590/1806-9479.2023.274229en
» https://doi.org/10.1590/1806-9479.2023.274229en - Silva, J. C. G., Vale, A. T., & Gonçalves, F. G. (2018). Potencial energético e emissões de gases de efeito estufa na produção de celulose e papel. Ciência Florestal, 28(1), 345-356.
-
Silva, C. G. D., Passos, R. R., Santos, D. A., Mendonça, E. D. S., & Machado, L. C. (2024). CO2 emission in soil under eucalyptus cultivation with biochar application. Pesquisa Agropecuária Tropical, 54, e80082. https://doi.org/10.1590/1983-40632024v5480082
» https://doi.org/10.1590/1983-40632024v5480082 -
Soares, N. S., Oliveira, R. D., Carvalho, K. D., Silva, M. L., Jacovine, L. A. G., & Valverde, S. R. (2010). A cadeia produtiva da celulose e do papel no Brasil. Floresta, 40(1), 1-22. https://doi.org/10.5380/rf.v40i1.17094
» https://doi.org/10.5380/rf.v40i1.17094 -
Soares, N. S., Silva, M. L., & da, (2014). Produto interno bruto do setor florestal brasileiro, 1994 a 2008. Revista Árvore, 38(4), 725-732. https://doi.org/10.1590/S0100-67622014000400015
» https://doi.org/10.1590/S0100-67622014000400015 -
Sousa, E. P., Soares, N. S., Silva, M. L., & Valverde, S. R. (2010). Desempenho do setor florestal para a economia brasileira: uma abordagem da matriz insumo-produto. Revista Árvore, 34(6), 1129-1138. https://doi.org/10.1590/S0100-67622010000600019
» https://doi.org/10.1590/S0100-67622010000600019 -
Tetere, V., & Peerlings, J. (2024). Measuring the forest based bioeconomy in Estonia, Latvia, Lithuania, and Finland. Scandinavian Journal of Forest Research, 39(5), 226-231. https://doi.org/10.1080/02827581.2024.2362216
» https://doi.org/10.1080/02827581.2024.2362216 -
Universidade de São Paulo – USP. Centro de Estudos Avançados em Economia Aplicada – CEPEA. (2025). Desenvolvimento metodológico e cálculo do PIB das cadeias produtivas. São Paulo: ESALQ/USP. Recuperado em 2 de abril de 2025, de http://www.cepea.esalq.usp.br/br/pib-do-agronegocio-brasileiro.aspx
» http://www.cepea.esalq.usp.br/br/pib-do-agronegocio-brasileiro.aspx -
Valverde, S. R., Oliveira, G. G., Soares, T. S., & Carvalho, R. M. A. M. (2005). Participação do setor florestal nos indicadores socioeconômicos do estado do Espírito Santo. Revista Árvore, 29(1), 105-113. https://doi.org/10.1590/S0100-67622005000100012
» https://doi.org/10.1590/S0100-67622005000100012 -
White, D. A., Ren, S., Mendham, D. S., Balocchi-Contreras, F., Silberstein, R. P., Meason, D., Iroumé, A., & Ramirez de Arellano, P. (2022). Is the reputation of Eucalyptus plantations for using more water than Pinus plantations justified? Hydrology and Earth System Sciences, 26(20), 5357-5371. https://doi.org/10.5194/hess-26-5357-2022
» https://doi.org/10.5194/hess-26-5357-2022
Edited by
-
Section editor:
Silvio Cezar Arend

 Source: authors (2025).
 Source: authors (2025).
 Source: authors (2025).