 Influence of H3PO4 on SAE/AISI 4340 steel quenching
ABSTRACT
Quenching is a process that generates different properties in materials depending on its conditions and mediums. Initially, during the quenching process, electrolyte molecules are adsorpted on the metal surface, resulting in the formation of a vapor layer, in addition to bubbles and microexplosions, which vary according to the size of the electrolyte molecule. This affects the microstructure obtained, as well as the resulting mechanical properties. However, depending on the application of the material, the samples, after being quenched, require corrosion resistance treatments. Among these processes is phosphating, which is frequently applied to metal surfaces, especially for the anchoring of paints, due to the formation of iron phosphate. Therefore, seeking to achieve increased corrosion resistance in quenching processes, the main objective of this study is to verify whether phosphorus can be incorporated into AISI 4340 steel during quenching and whether the resulting layer improves anticorrosive performance. To this end, AISI 4340 samples were annealed and quenched in H2O and 2% H3PO4. The samples were analyzed as to their quenching process (via video analysis), microstructure, microhardness, morphology, EDS (energy-dispersive spectroscopy) and electrochemical measurement of potentiodynamic polarization. The samples tempered in 2% H3PO4 formed scale possibly containing Fe2O3 and FePO4. However, the scale showed slabbing, which compromises the corrosion resistance of these samples compared to the water-quenched samples. Nevertheless, the results showed for the first time that phosphorus can be incorporated into the surface layer of the scale created during the quenching of AISI 4340 in 2% H3PO4.
Keywords:
Phosphating; AISI 4340 steel; Quenching; Corrosion resistance
1. INTRODUCTION
According to the Brazil Steel Institute, in 2022, 23.3 million tons of steel were consumed in Brazil, while 34.6 million tons were produced. With these numbers, Brazil currently occupies the 8th position among the world’s largest steel producers, supplying different types of steel: cold-and hot-rolled steel, stainless steel, galvanized steel, among others [1, 2].
This paper will address the use of AISI 4340 steel, which has high hardenability and good forgeability, but also has a relatively difficult machining process compared to other steels. Depending on the carbon content of the alloy, its hardness when quenched varies from 54 to 59 HRC. Due to its characteristics, it is used in the manufacture of crankshafts for airplanes and tractors, axles with high mechanical stress, and vehicles in general [3, 4].
AISI 4340 is classified as a medium-carbon and multiphase steel. According to the heat treatment to which it is subjected, its microstructure can consist of tempered martensite, untempered martensite, ferrite, pearlite, carbides, bainite and retained austenite [5].
To improve the performance of this material in the metalworking industry, heat treatments are used, which can be summarized as a set of controlled heating and cooling operations, with the aim of obtaining different properties suitable for the demands to which they will be subjected. Depending on the treatment used, the material can acquire certain characteristics, such as: mechanical resistance, toughness and hardness, which are necessary for applications with great mechanical stress. The microstructure that normally leads to the best relationship between these antagonistic properties, such as hardness and toughness, is tempered martensite. This microstructure can be obtained using a heat treatment of quenching followed by quenching [6, 7].
During quenching, microexplosions occur on the metal surface, with adsorption of molecules present in the electrolyte, and the resulting properties of the material vary with the quenching electrolyte (cooling medium) used. Furthermore, it is worth noting that, depending on their intended use, treated samples, even after heat treatment, must be treated to inhibit corrosion [8]. Among the processes used industrially is phosphating, which gives the steel a phosphate layer. This metal pretreatment process is the most widely used for surface treatment and finishing, becoming a popular procedure due to its ability to improve the adhesion of the organic finish and prevent corrosion on the film [9,10,11,12].
However, is it possible for a layer containing phosphate to form during the quenching of AISI 4340. In this sense, the main objective of this paper is to verify whether it is possible to incorporate phosphorus into AISI 4340 steel during quenching in 2% H3PO4 and whether the layer formed improves anticorrosive performance.
2. EXPERIMENTAL PROCEDURES
2.1. Materials
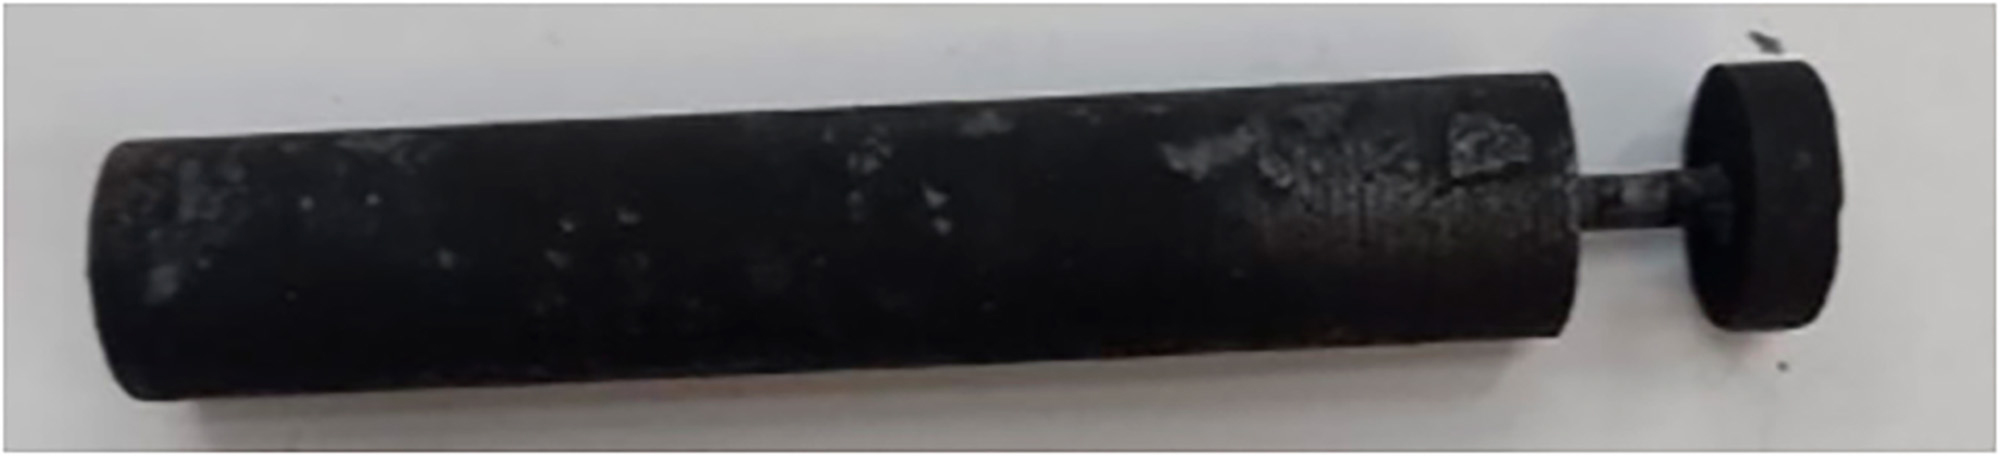
The standardized SAE 4340 steel was received in bars 1 m long and 15.8 mm in diameter. These bars were machined to obtain samples measuring 100 mm, with a diameter of 15.8 mm in length each, as shown in Figure 1.

The cut samples were heat-treated using a Sanchis muffle furnace, with a maximum temperature capacity of 1200°C. The five AISI 4340 samples were austenitized at 860°C for 1 hour. All samples went through the same annealing preparation process, in which they were allowed to cool slowly inside the oven until room temperature was reached. After annealing the five (5) samples, four of them were subjected to the quenching process and cooled in two different media, namely: H2O (distilled water) and 2% volume H3PO4 (phosphoric acid). The cooling process was captured using a video camera to verify the performance of the medium during cooling. Observing the recordings, differences between the media were verified with regard to the three cooling phases in the quenching process: vapor layer formation, bubble nucleation and convective cooling.
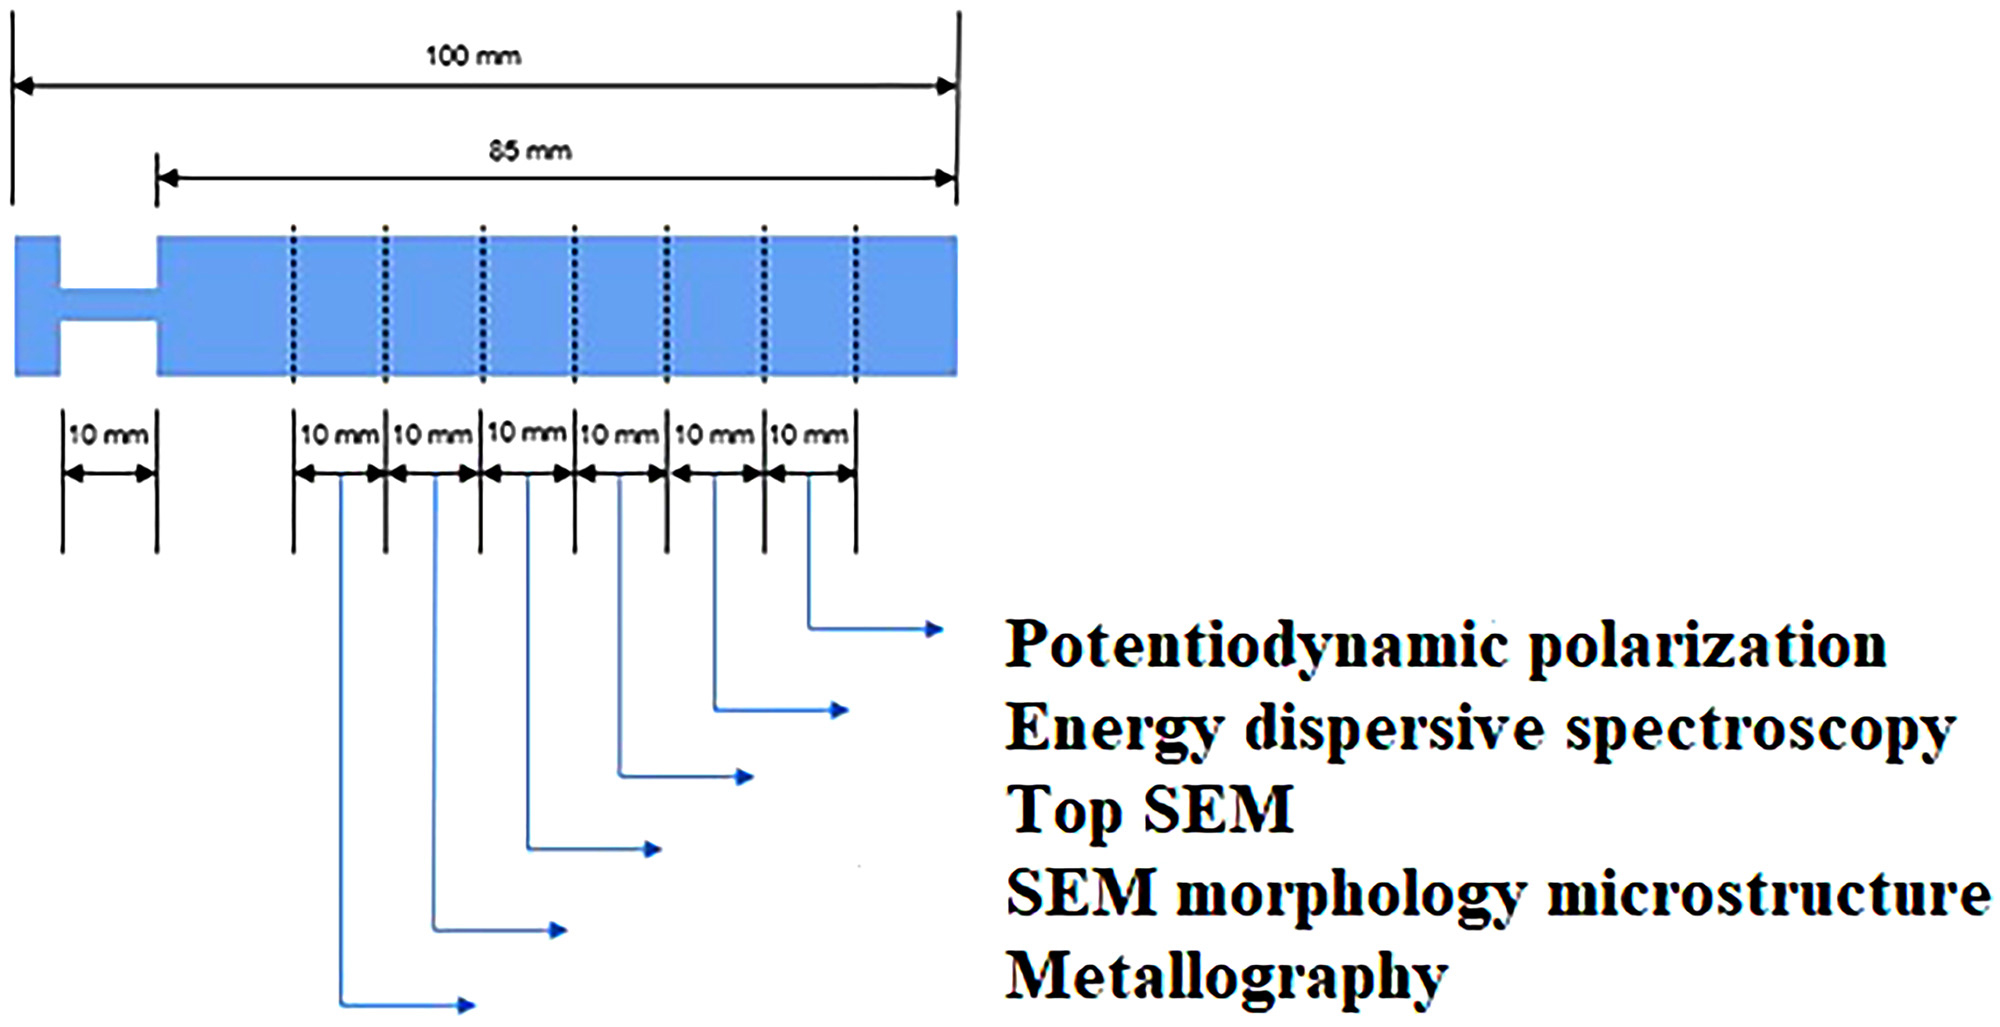
After the quenching processes, the samples were sectioned into 10 mm-long slices. Each section was intended for the analyses planned by this study, as shown in Figure 2.
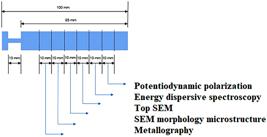
Figure 2 presents the schematic of the dimensions of the tempered sample and the sectioning of the samples used in the planned analyses. To better understand their results, which will be presented later, the characterization of the quenching media will be described below, as well as the tests carried out.
2.2. Characterization of the quenching medium
To characterize the medium, information on the density, viscosity and conductivity of the fluids used in the heat treatment of the samples was collected. The fluids used for the treatment procedures in this study were distilled water and phosphoric acid (2%). The results found can be considered an average, since the samples were checked in triplicate.
The density of the distilled water was measured by weighing a 25 mL pycnometer before filling it with the fluid to be identified, which resulted in the sample mass being 25 mL.
Viscosity was also analyzed using a Brookfield viscometer, model DV2T.
Furthermore, an analysis of the conductivity of the fluid was also carried out with a Digimed DM-32 conductivity meter, which measures the passing current of charge. In general, the purer the water, the lower the conductivity shown.
2.3. Video quenching analysis
To understand the behavior of samples quenched in different media, the treatment processes were filmed with a high-resolution camera positioned in front of the glass tank used to perform the quenching. Filming was carried out until the end of the quenching of both samples, to identify the cooling phases. Both videos were paused and advanced in the same time interval for analysis, until the end of the processes. Pauses between shots were performed every 10 seconds. Furthermore, the reduction scale was 10 times that of the original video.
2.4. Microstructure analysis
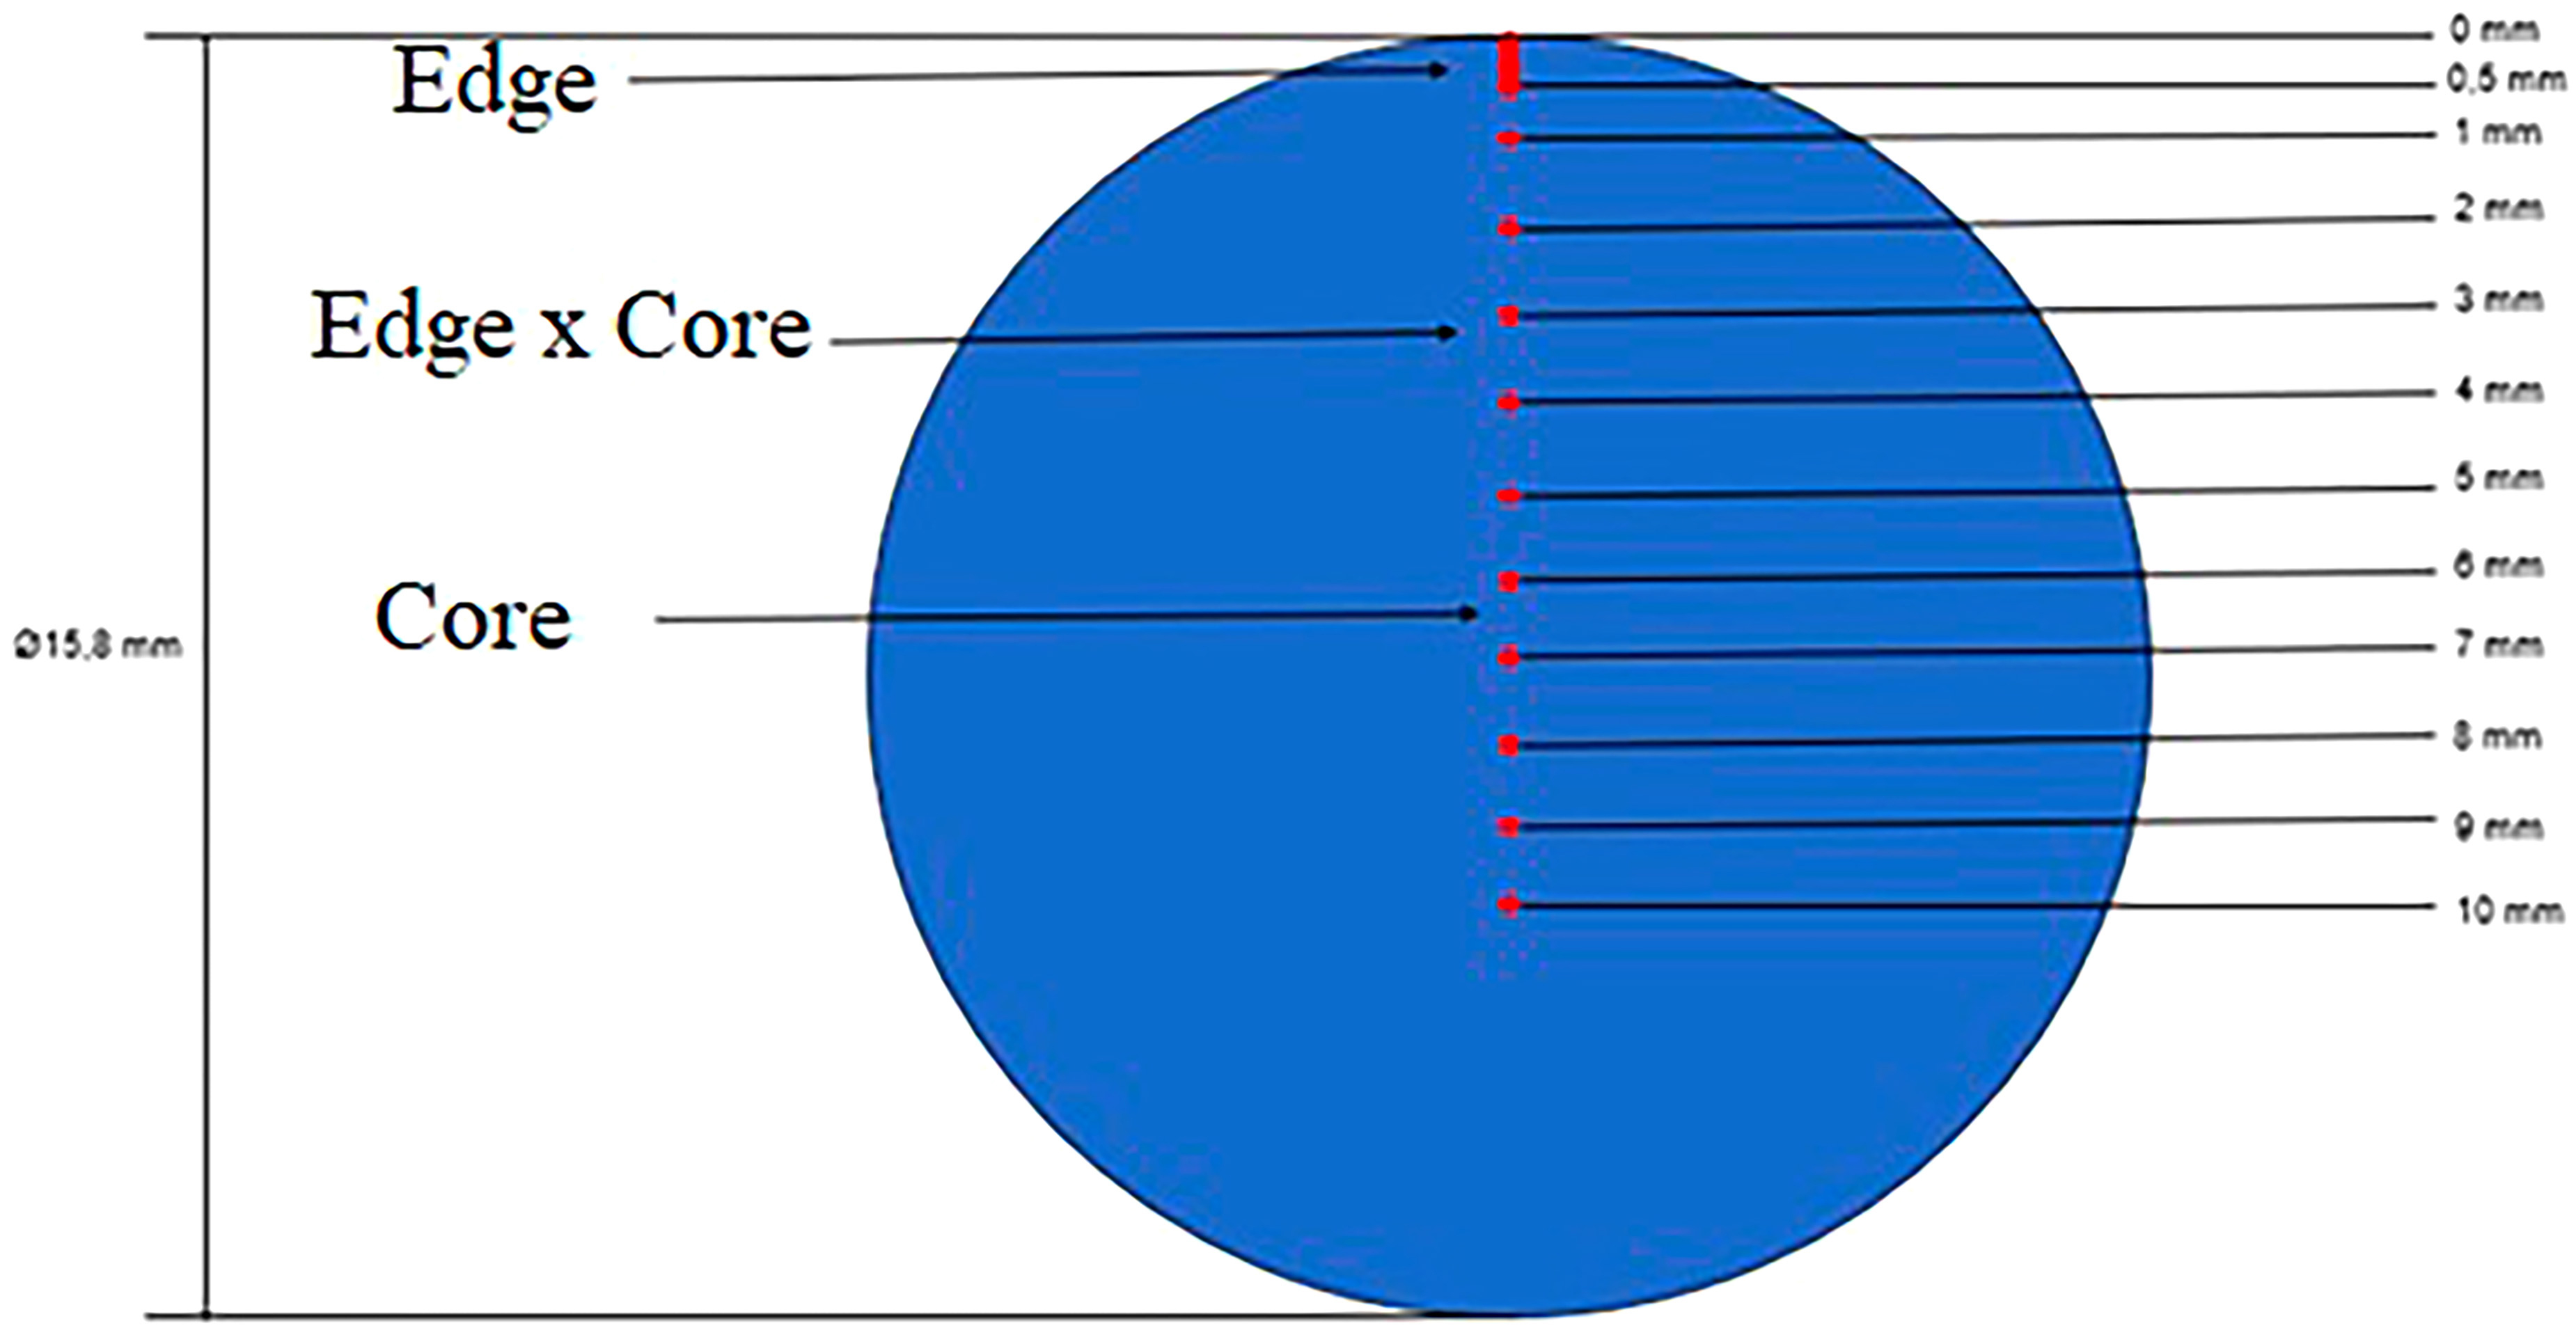
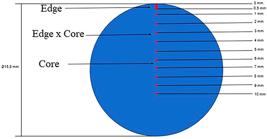
The as-received, annealed and quenched samples were evaluated for microstructure under an optical microscope. To this end, the samples were prepared using metallographic methods, with a Bakelite inlay, and then sanded with SiC sandpaper starting from 360 to 1200. After sanding, the samples were polished with the addition of an alumina abrasive suspension with a particle size of 0.5 μm. Furthermore, the surface of the samples was chemically etched with 3% Nital to reveal their microstructure for 10 seconds. Optical microscopy was performed using an Opton optical microscope with variable magnification. The captured images of all samples were obtained at 200x, 400x and 500x magnitude, with cross-section images being collected at their edge (outermost region), between edge and core (intermediate region), and at their core (central region), as shown in Figure 3.
2.5. Hardness test
Microhardness analyses were carried out using a Future-Tech microhardness tester, model FM-700, first using the Vickers scale and then converting it to Rockwell. Sixteen (16) hardness points were evaluated from the face toward the center of the sample, to verify the depth of the quenched layer. The load used was 1 kgf, without preload. The samples annealed and quenched in both media (H2O and 2% H3PO4) were measured on the Rockwell C and Vickers scales. Figure 3 shows the collection depths.
Figure 3 demonstrates the depth of microhardness collection, taking into account the total diameter of the test piece of 15.8 mm.
2.6. Morphological and EDS (Energy Dispersive Spectroscopy) analysis using a scanning electron microscope (SEM)
For morphological SEM analyses, 1 cm2 specimens were used, which were metallized with a gold target to increase electrical conductivity and the quality of the images obtained. After metallization, the samples were analyzed in cross section and top view. The SEM used is model JSM-6510LV, JEOL brand. Chemical composition analyses were carried out using an EDS probe coupled to the SEM.
2.7. Electrochemical analysis of potentiodynamic polarization
Electrochemical tests were carried out using a PGSTAT 302 potentiostat from AUTOLAB. A platinum wire was used as the counter electrode and saturated calomel was used as the reference electrode (SCE). For the potentiodynamic polarization measurements, steel samples were used as working electrodes. The electrochemical behavior of the samples was evaluated in a 0.01 M NaCl electrolyte, simulating a marine atmosphere. To this end, a potential sweep was carried out from –200 mV to +400 mV in relation to the open circuit potential, with a sweep speed of 10 mV/s.
3. RESULTS AND DISCUSSIONS
3.1. Analyzes of quenching media
The mechanical properties of a steel are directly linked to its microstructure, which influences its hardness, ductility, mechanical strength and toughness. The different possible applications for a steel require different combinations of characteristics, which are achievable through different types of heat treatments that change the properties of the steel, such as quenching. Each application has distinct characteristics that vary according to the rate of heat transfer between the part and the cooling medium used, resulting in different crystalline structures. Martensite, a metastable phase supersaturated with carbon, due to its transformation by shear, modifies the crystalline lattice, generating internal tensions. Therefore, most of the time quenching must be applied after the quenching treatment. The most used cooling media for quenching are water, oil, brine and, recently, polymeric solutions, each with specific characteristics, and their use depends on the desired result for the treated part [13]. However, the objective of this paper is to show that the microstructures and characteristics obtained in samples after quenching using two different cooling media can be influenced, due to the different viscosities, densities and conductivities of the fluids. In the case of this study, cooling in water (H2O) and H3PO4 with a concentration of 2% was used.
The quenching media were evaluated for viscosity, density and conductivity. The measured values are found in Table 1.
According to Table 1, the viscosities and densities of the fluids are quite similar. However, conductivity increases by 4 orders of magnitude with the addition of H3PO4.
The viscosity of a fluid can influence the heat exchange between the treated part and the environment, due to faster or slower heat transfer. In the case of higher viscosities, the cooling stages of the vapor film, vapor layer and bubble convection may have their timing altered, or one of them may not occur, due to the delay in heat exchange. However, as the viscosities were similar, it is possible that viscosity did not influence the quenching behaviors. Like viscosity, fluid density also did not show a significant difference.
On the other hand, conductivity increased with the insertion of H3PO4. Conductivity is related to the migration capacity of electrolyte species. In pure water, migration during quenching to form the vapor layer occurs through oxygen. In H3PO4, on the other hand, it is possible that the migration of PO43– e is faster than that of oxygen, which would result in the deposition of phosphorus on the surface of the steel during quenching.
3.2. Analysis of the quenching process (video)
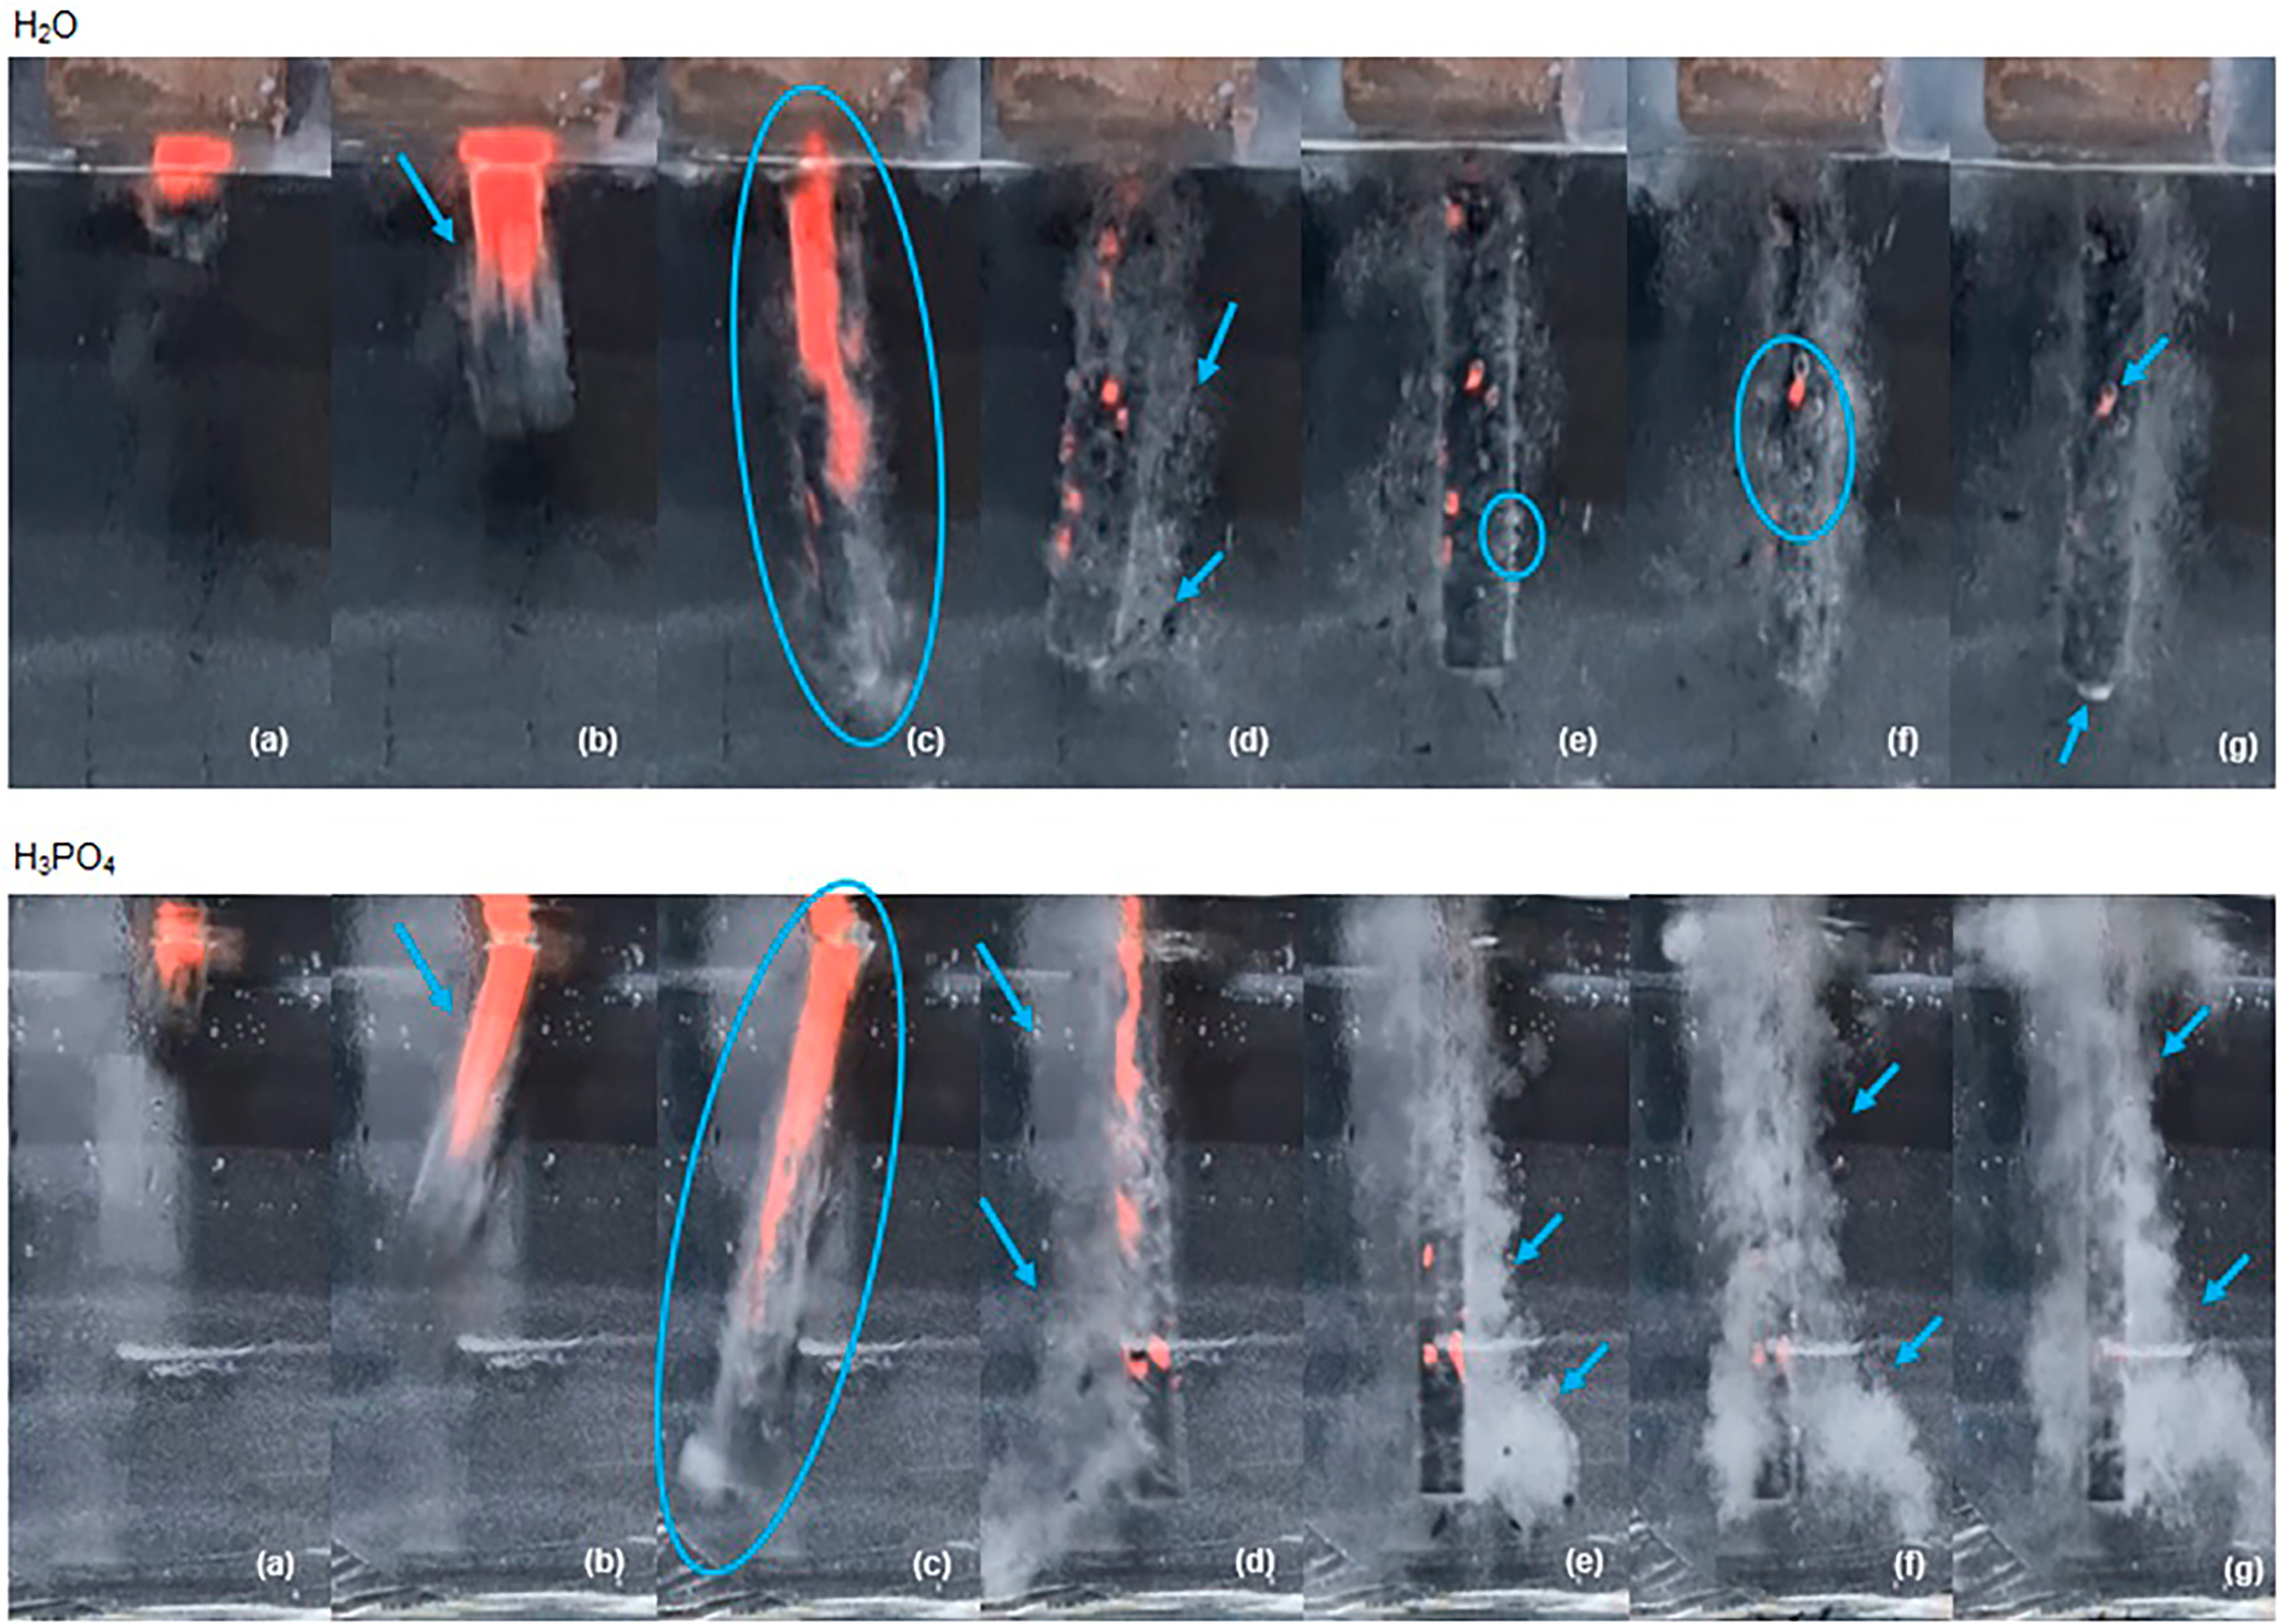
Figure 4 shows the images taken from the video recording of the AISI 4340 steel piece during quenching in water and in H3PO4 without agitation, at the same immersion times.
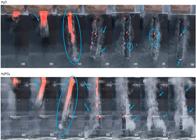
Figure 4 refers to the images recorded in the video, at the same immersion times of the AISI 4340 steel piece, during quenching in water and in H3PO4, without agitation.
In Figure 4 (a), it is possible to see that the samples have a reddish color before being submerged in the quenching baths. According to PINEDO [14], steel heated at a temperature of 800 ºC to 1200 ºC has a red color that corresponds to the austenite phase. Therefore, as the samples were heated in the oven at a temperature of 860°C, the red color throughout the piece indicates the homogeneous formation of austenite.
Figure 4 (a – b) also shows that, as soon as the pieces touch the liquid, the formation of the vapor layer begins in both H2O and H3PO4 (blue arrow). According to ZORDÃO et al. [15], contact between the solution and the hot surface promotes a rapid rate of evaporation due to the high temperature of the metal and, as a result, a condensed cloud of vapor is formed around the surface of the sample.
In the sample quenched in water, it is possible to identify, indicated by the blue arrow in Figure 4 (d), the layer of vapor that breaks and gives rise to the formation of the bubbles identified throughout the remainder of the process.
ZORDÃO et al. [15] quenched SAE 1045 steel in H2O and observed that the first collapse of the vapor layer occurred while the sample was still at a high temperature, characterized by an incandescent color. This occurred at the bottom of the sample, creating a wetting front (similar to a bubble) that moves to the top, while the sample still remains at a high temperature. With the immersion of the entire piece in the quenching bath and the decrease in temperature, the authors observed a collapse of the vapor film in the upper position of the sample. In this case, the bubbles observed in Figure 4 (e – f) would be due to the formation of the bubble nucleation process. As reported by HSU et al. [16], during the transition boiling, a cluster of bubbles is formed and burst out of the surface, indicated by the circles in frames e to f of Figure 4.
In the phosphoric acid-quenched sample, it is possible to identify a rapid creation of the vapor layer that remains throughout the entire quenching process. According to ZORDÃO et al. [15], when quenching SAE 1045 steel in a NaHCO3 solution, the collapse of the vapor layer only occurred when the sample was at a low temperature and was thus unable to promote quenching due to the long duration of the first stage, resulting in slow cooling. During immersion, a fluctuation in temperature occurred and a region in the middle of the sample cooled first, but was unable to break the vapor layer. In the case of the present paper, regarding the AISI 4340 sample immersed in H3PO4 – which justifies the permanence of the vapor layer observed throughout the quenching process –, it may be related to the same phenomenon observed in the experiment by ZORDÃO et al. [15] where NaHCO3 undergoes thermal decomposition, thus releasing water and carbon dioxide in gaseous form, which contributes to the stabilization and maintenance of the vapor film. In the case of this study, the vapor layer may be due to the release of water and hydrogen in the form of gas. The decomposition of phosphoric acid, in turn, can be understood based on the experiment by JIANG and CHENG [17], which reports that phosphate coatings are formed by a chemical reaction after the immersion of the metal sample in a solution containing soluble primary metal phosphates, free phosphoric acid, andvarious accelerators and modifiers. In the zinc phosphating of carbon steel, when the metal surface is subjected to a bath, the iron is dissolved due to the presence of phosphoric acid in the microanodic sites. The evolution of hydrogen occurs in microcathodic sites, increasing the pH at the interface between the metal and the solution, changing the dissociation equilibrium and leading to the formation of PO43–. When the ferrous substrate comes into contact with the phosphate bath, a very thin layer is formed during the first seconds, based on iron oxides and phosphates, the vast majority of which are iron oxide and ferrous phosphate.
In principle, when steel is immersed in a dilute phosphoric acid solution, a layer of ferrous phosphate is immediately formed. However, due to the abundant Fe2+ exposed on the surface during the initial stages of an acidic phosphate chemical conversion (PCC) bath with added accelerators, FePO4 and Fe2O3 are formed rapidly and act as an amorphous base layer on the steel. The dissolved Fe2+ is rapidly oxidized to Fe3+ by accelerators in the PCC bath, resulting in the rapid precipitation of amorphous ferric phosphate and ferric oxide on the steel surface. The formation of a phosphate coating on a steel substrate depends on a set of chemical and electrochemical reactions on the metal surface and can be divided into four steps: electrochemical dissolution of the substrate, deposition of an amorphous phase, crystallization and growth of phosphate, and dynamic balance between dissolution and coating formation.
In the case of the experiment carried out in this paper, the dissolution of iron in microanodes and evolution of hydrogen in microcathodes occur simultaneously through Reaction (1).
The evolution of hydrogen increases the pH at the metal/solution interface, which alters the dissociation equilibrium, leading to the formation of PO43- presented in reactions (2), (3) and (4):
The dissolved Fe2+ is rapidly oxidized to Fe3+. In the case of the experiment by JIANG and CHENG [17], the oxidation of Fe3+ was favored by the use of accelerators. In the case of this dissertation, it is possible that this oxidation was influenced by the high temperature of the specimen in contact with the phosphoric acid. This results in the rapid precipitation of amorphous ferric phosphate and ferric oxide on the steel surface, as described in reactions (5), (6) and (7):
Therefore, the base layer chemically bonds to the substrate and provides high adhesion between the entire coating and the substrate. The process of amorphous precipitation occurs very quickly and is accompanied by the dissolution of the substrate. Therefore, in the case of this dissertation, it is possible that the formation of Fe2O3 and FePO4 oxides occurred.
3.3. Metallographic analysis
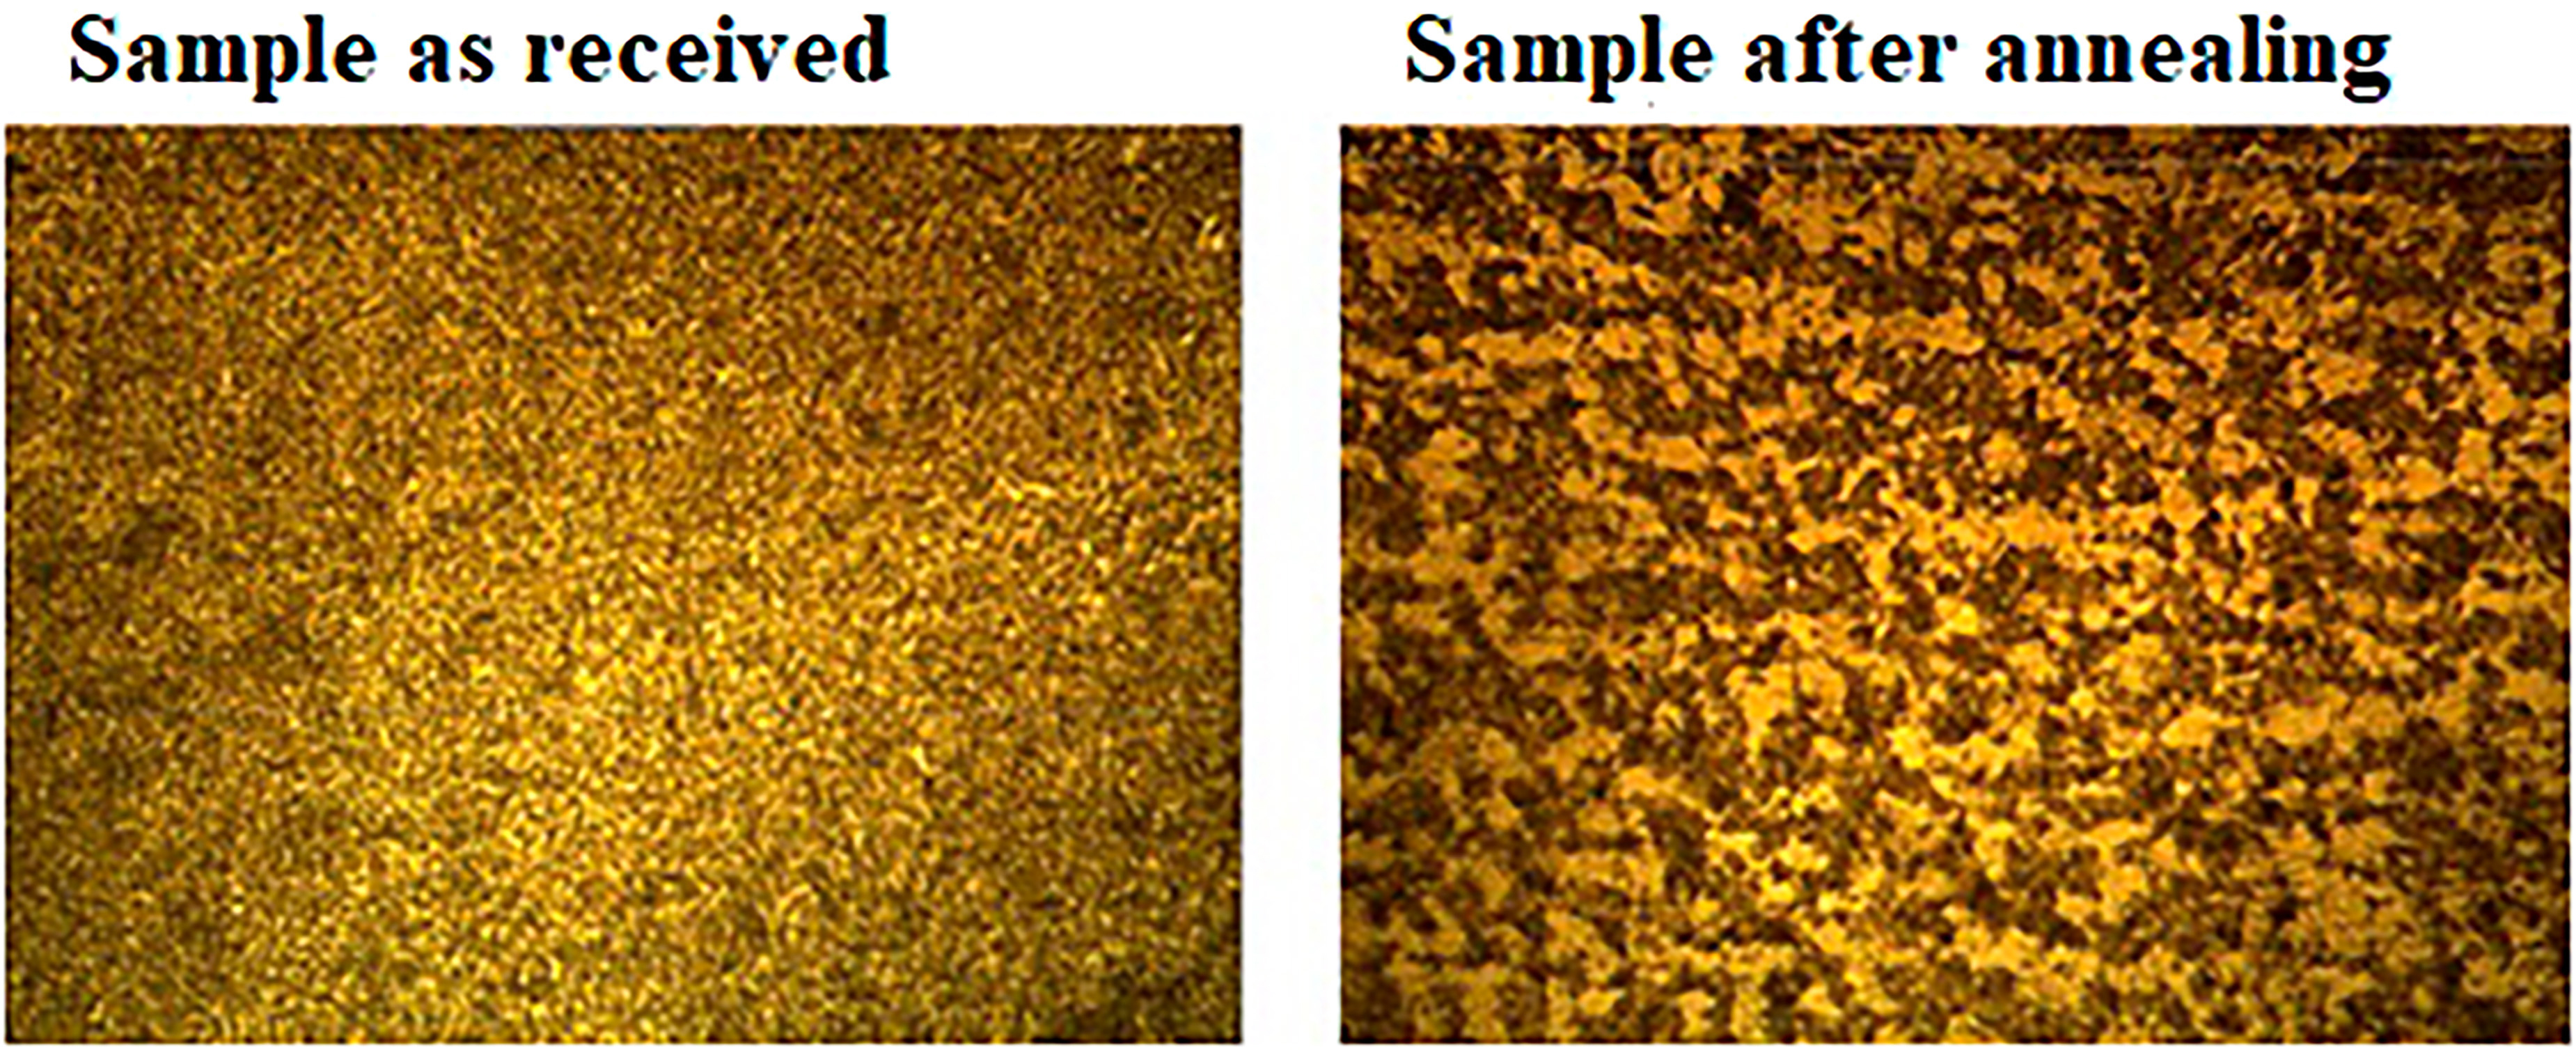
Figure 5 refers to the microstructure of the AISI 4340 steel sample as received and after annealing. Analyses were carried out to identify differences in the microstructure and grain size of the pieces.
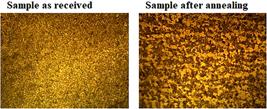
In Figure 5, it is possible to notice differences in the size and organization of the grains of the as-received and annealed materials. This is due to the maximum heating temperature: CHIAVERINI [18] states that the microstructure of a material is dependent on the nature of the process used, in addition to the desired final structures and properties, and the chemical composition of the steel, especially with regard to its carbon content. The higher heating temperature used ensures greater dissolution of the phases in gamma iron, but in compensation increases the grain size of the austenite form. Since the sample was annealed at 860°C for one hour and cooled in the oven, this may explain the increase in grain and the better distribution of microconstituents in relation to the as-received raw material. The predominant microstructures in both samples are basically composed of ferrite and pearlite. Ferrite can be identified in the lighter regions of Figure 5, and pearlite, in its darker regions [13].
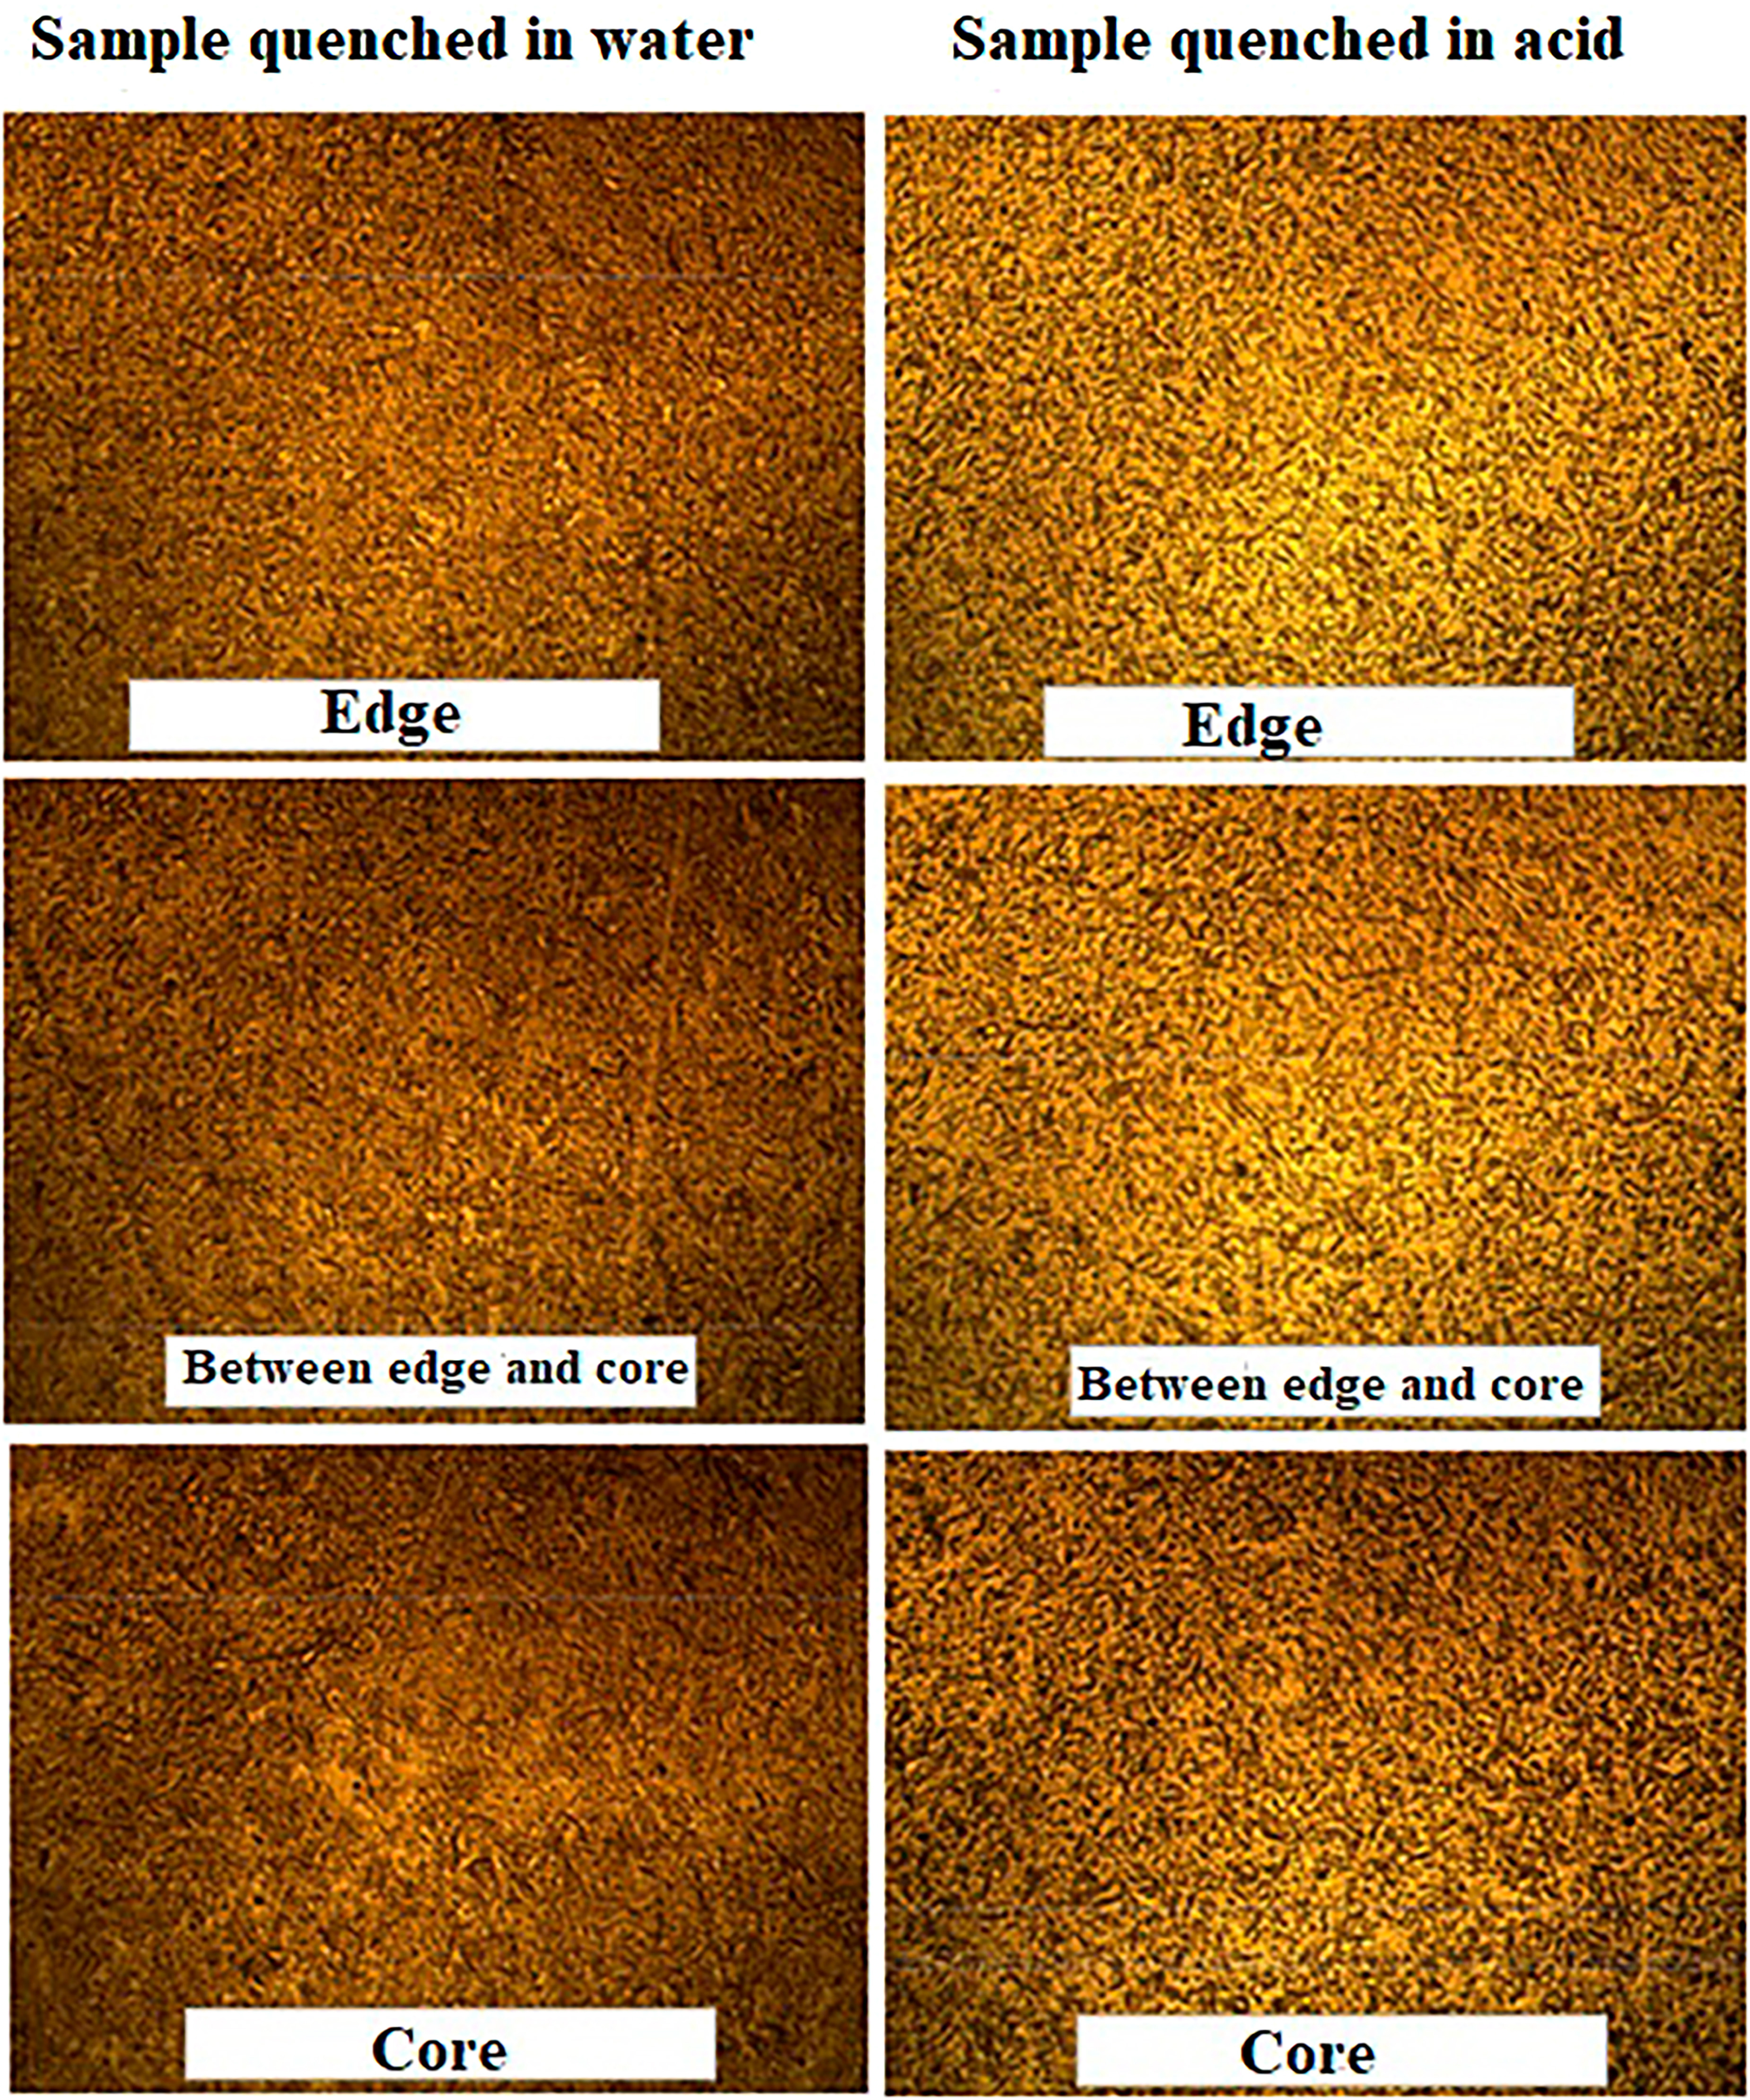
Figure 6 shows the microstructure of the samples quenched in water and phosphoric acid (2% H3PO4).
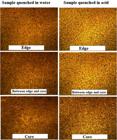
Microstructure of AISI 4340 quenched in H2O and 2% H3PO4. Edge regions, between edge and core and core of the cross-section of the parts. 400x magnification.
In Figure 6, it can be seen that the acid-quenched sample has a less refined microstructure than that of the water-quenched sample. This can be explained by the slower cooling of acid compared to water, which was verified by the formation of bubbles in the sample quenched in water (Figure 4). According to CHIAVERINI [18], the constituents of austenite cooling (ferrite, cementite and pearlite) allow variations in mechanical properties. The formation of pearlite and cementite requires a change in the microstructure of the steel over a certain period. With the increase in cooling speed, it is not possible to reach the time necessary for the formation of the aforementioned structures, and consequently, the structures formed inside the steel change. The increase in cooling speed can be translated as a lowering of the critical austenitization line of the steel, causing a delay in the beginning of its structural changes, that is, an inertia of physical phenomena of microstructural transformations.
In Figure 6, it is also possible to identify a predominantly martensitic structure in slats (needles). Martensite forms as austenite is cooled, passing the Ms line, and these transformations normally occur under conditions in which diffusion does not occur significantly (i.e., lower temperatures), being therefore only associated with changes in clear crystal structures. Martensite forms at extremely fast rates and in elongated shapes, generally described as laths or plates; for alloys containing less than about 0.6% C, martensite grains form as laths. Plate martensite is found in alloys above 1.0% C [13], agreeing with the microstructures in Figure 6. EL RAYES et al. [19] studied the microstructure of three different heat treatments on SAE 4340 (Cr-Ni-Mo steel): in the first heat treatment, austenitization was carried out at 850 ºC for 2 h, followed by cooling in an oven. In the second, austenitization was carried out at 1000 ºC for 3 h, followed by quenching in oil, and in the third, austenitization was carried out at 1000 ºC for 3 h followed by quenching in water. After the heat treatments, the authors observed the formation of martensite in laths. In the oil-quenched sample, the microstructure was composed of long martensite laths coexisting with a substructure of few martensite plates. In the sample quenched in water, the microstructure was composed of 100% martensite with relatively short slats.
When carbon steel is rapidly cooled to temperatures below the knee of the Time-Temperature-Transformation curve and held at that temperature, bainite forms. Bainite is a mixed process that involves diffusion and, by optical microscopy, it is difficult to differentiate the bainitic and martensitic microstructure, as the two structures are, in general, at the limit of the resolution of this technique. In general, martensite appears finer than bainite under the optical microscope [20].
SAEIDI and EKRAN [21] studied 4340 STEEL subjected to austenitization (850°C for 30 minutes), isothermal transformation (700°C for 100 minutes) and austempered (300°C and air-cooled) treatments. The authors found that the steel had a microstructure of ferrite (in the darker regions) and bainite in an acicular shape. In this case, the evident formation of bainite occurred due to the long residence time at a temperature of 300°C. In this study, due to the delay in cooling in the phosphoric acid sample caused by the vapor blanket, it is possible for martensite and bainite to form.
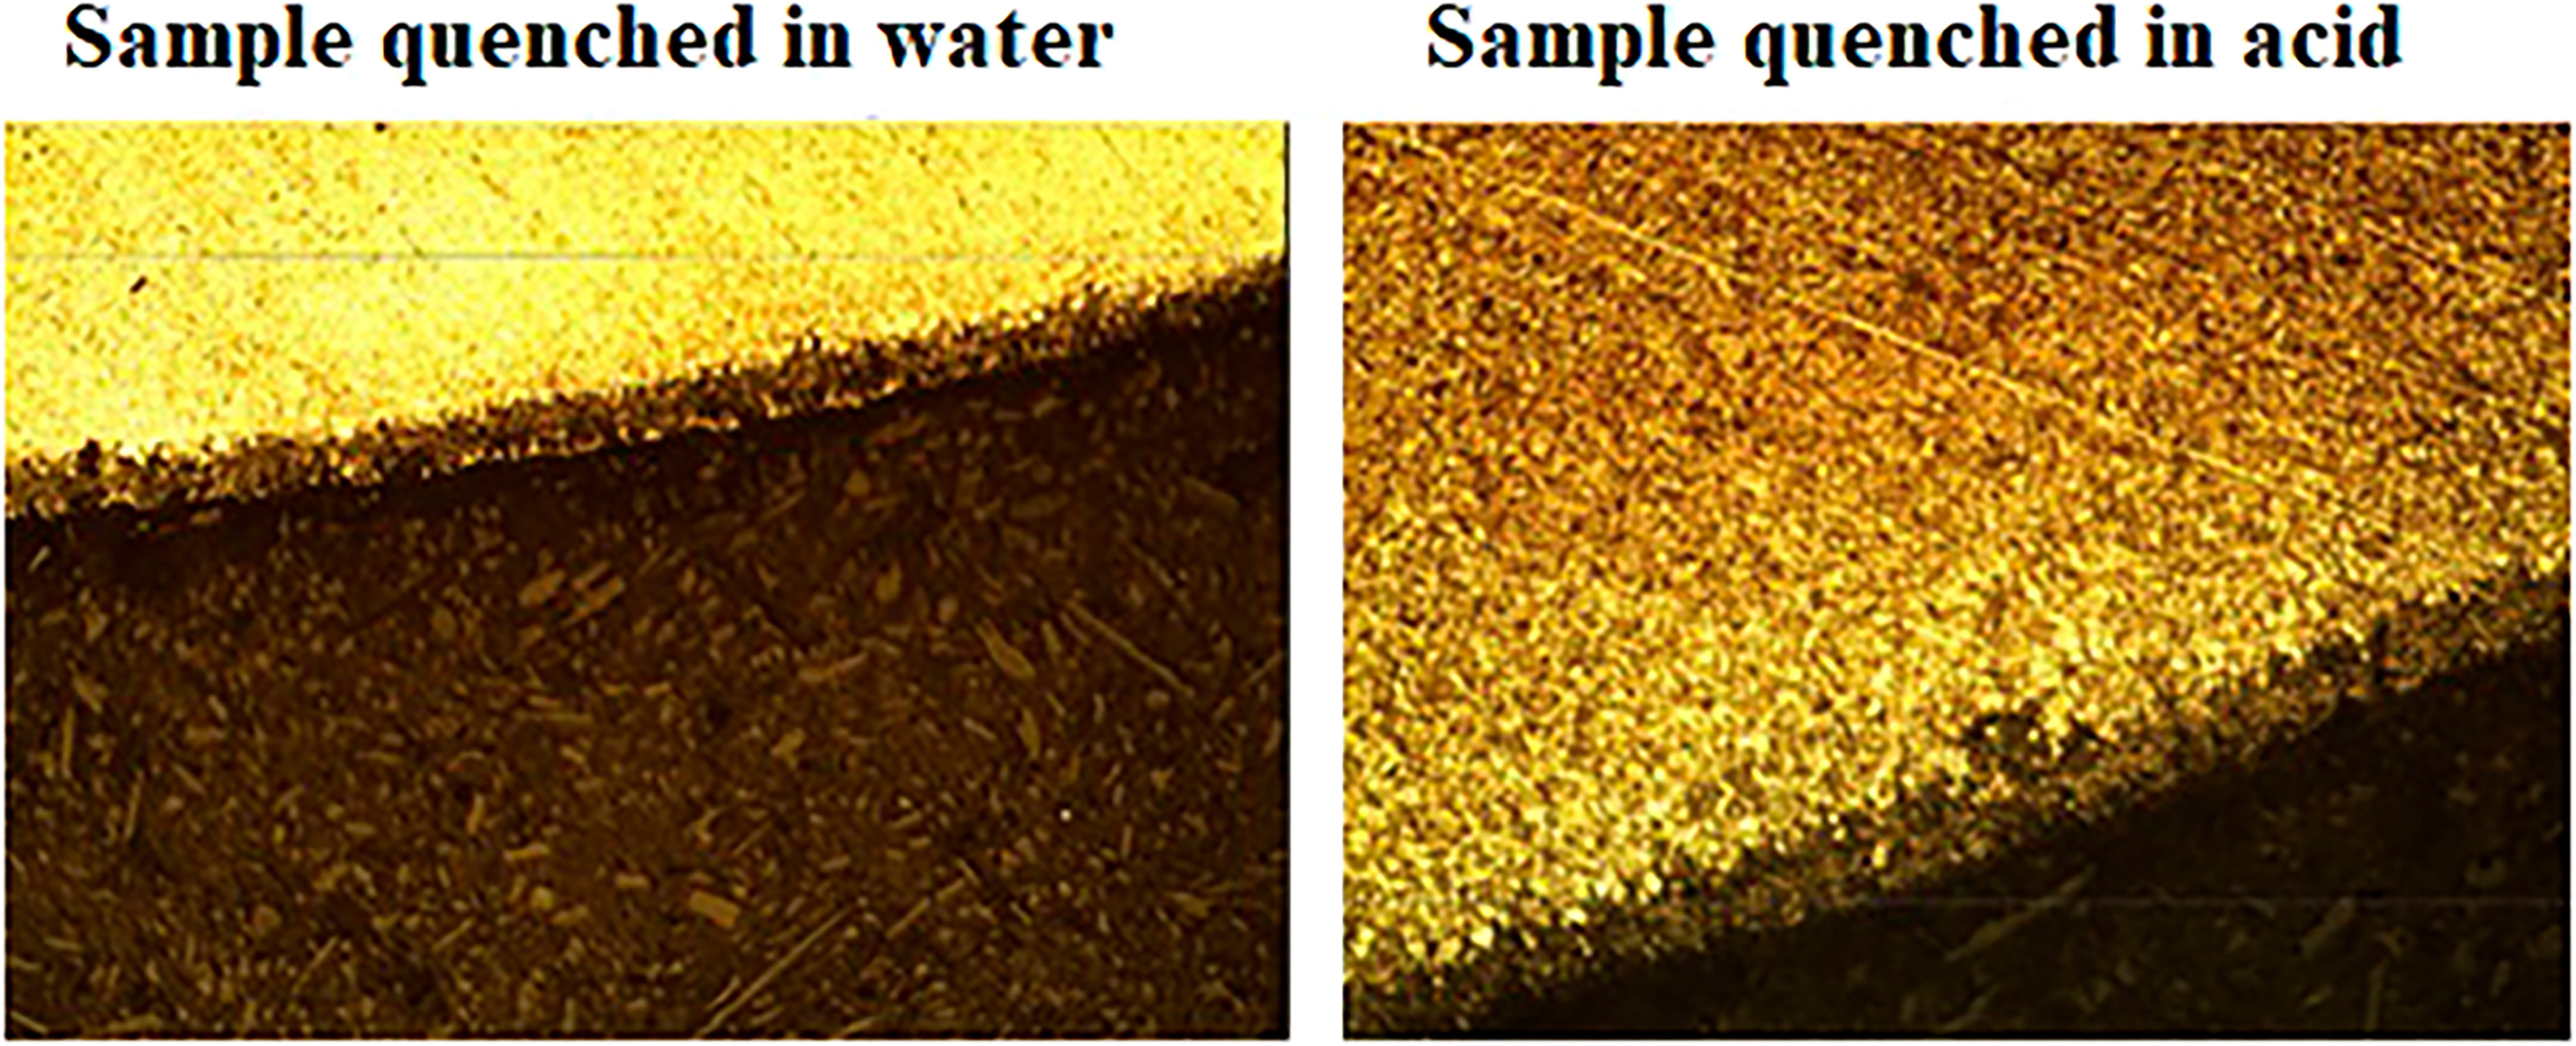
Figure 7 presents the microstructure in cross section for the samples tempered in water and in 2% volume of H3PO4, in which it is possible to identify the differences and similarities between the tempered samples.
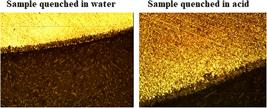
Microstructure, by optical microscopy, of the cross section of samples tempered in H2O and H3PO4 at 200× magnification.
In both quenching procedures, a dark layer is observed on the outside of the sample, which can be identified as a corrosion product. When quenching in H2O, Fe3O4 is formed and, according to GENTIL [22], the action of water on iron alloys that basically contain iron and carbon in their composition is due to the oxygen present in the water. This creates hydrated iron oxide (Fe2O3 + H2O), which makes up the layer that opposes diffusion close to the surface of the iron through which O2 must diffuse. The formation of different corrosion products explains the different colors observed: iron oxides such as Fe3O4 have a dark color, as was obtained in the water-quenched sample. Conversely, when quenching in H3PO4, as reported by JIANG and CHENG [17], during the first seconds of contact between the ferrous substrate and the phosphate bath, a very thin layer is formed based on iron oxides and phosphates, which are largely iron oxides of iron and ferrous phosphate. In principle, when steel is immersed in a dilute phosphoric acid solution, a layer of ferrous phosphate is immediately formed. However, due to the abundant Fe2+ exposed on the surface during the initial stages in an acidic PCC bath, FePO4 and Fe2O3 are formed quickly and act as an amorphous base layer on the steel. Therefore, it is possible that the dark layer formed in the acid-quenched sample is composed of FePO4 and Fe2O3. The thickness measurements of the layers formed during quenching will be shown by subsequent cross-section analyses using the SEM.
3.4. Microhardness analysis
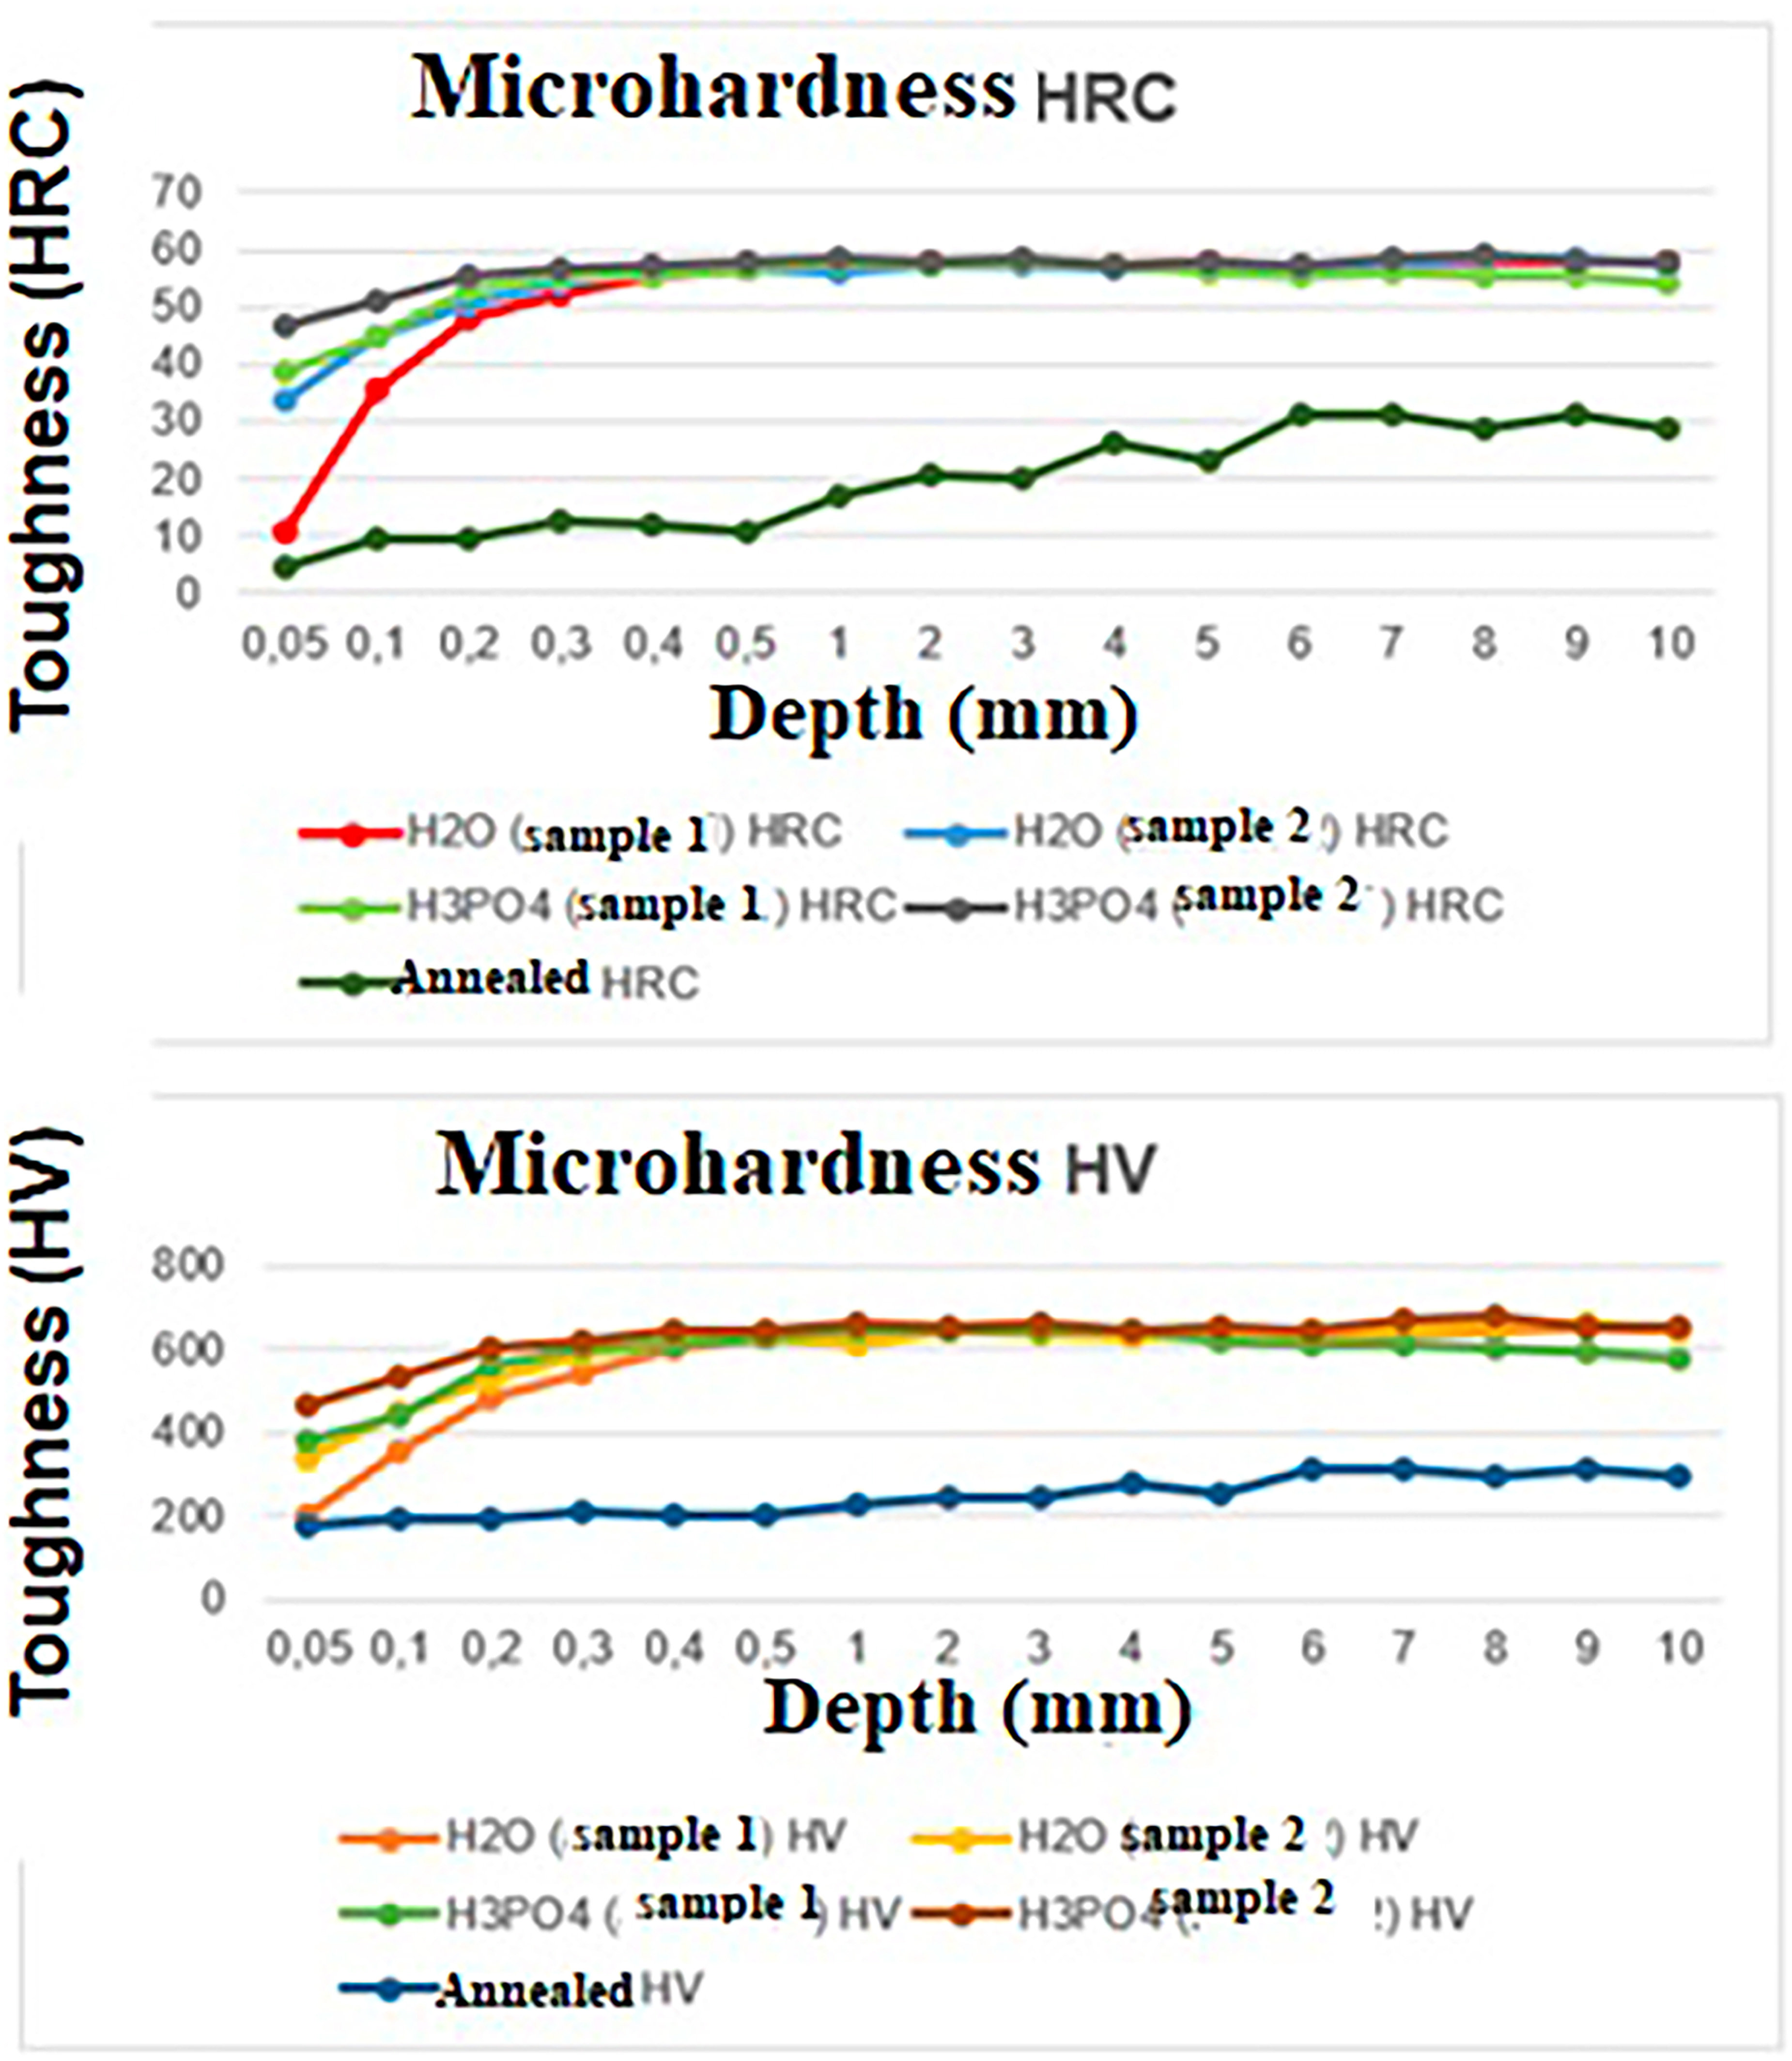
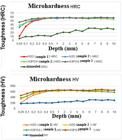
Microhardness tests were carried out in order to identify differences in hardness in the annealed samples, quenched in water and phosphoric acid (2% volume of H3PO4). In addition to the comparison on different hardness scales (HV and HRC), the samples were evaluated at different depths from the surface, to identify whether the material had in fact been tempered and to verify variations along the transverse section, which could result in unwanted layers. The microhardness results are presented in Table 2.
According to Figure 8, the annealed sample has an average hardness of 240 HV and a standard deviation of 46.20 HV. The variation in hardness across depths may be related to the microconstituents of the region of the sample where the measurement was taken. However, the results found agree with the study by EL RAYES et al. [19], which measured a hardness of 200 HV in annealed AISI 4340.
Microstructure, by optical microscopy, of the cross section of samples tempered in H2O and H3PO4 at 200× magnification.
As can be seen, both water- and acid-quenched samples showed hardness variations from 54 to 59 HRC, agreeing with the hardness values of quenched AISI 4340 steel, depending on the quenching conditions [5]. The water-quenched samples had an average hardness of 56.95 HRC, with a standard deviation of 11.95 HRC in sample 1 and 56.9 HRC and a standard deviation of 6.29 HRC in sample 2. As for the acid-quenched samples, sample 1 had an average hardness of 55.6 HRC and a standard deviation of 5.02 HRC, and sample 2 had an average hardness of 57.65 HRC with a standard deviation of 3.16 HRC, indicating that the steel was quenched in both quenching media. Furthermore, greater variation was also identified in the outermost part of the samples, which may be associated with the way the test was carried out, as it may have been performed in a more external region and could have measured only the corrosion product of the material. However, at a depth of 0.05 mm, samples quenched in phosphoric acid showed higher hardness than those treated in water.
This may be related to the results found in the analysis of the quenching process video. During the cooling of the samples quenched in phosphoric acid, a vapor layer was formed and remained throughout the quenching process, making it impossible to visually identify the formation of bubbles and the exchange by convection. According to ZORDÃO et al. [15], the formation of the vapor layer causes an unstable atmosphere and heat exchange becomes slower, causing the execution of the process to be unrepeatable. In the case of samples tempered in phosphoric acid, greater reproducibility in hardness values was observed in the outer part of the sample compared to those quenched in water, which does not agree with the study by ZORDÃO et al. [15]. The water-quenched samples had all cooling stages, i.e. the formation of the vapor layer, bubbles and convective cooling. These samples showed a greater variation in hardness at a depth of 0.05 mm compared to those tempered in phosphoric acid. As reported by JIANG and CHENG [17], when the ferrous substrate enters the phosphate bath, during the first seconds of contact a very thin layer is formed based on iron oxides and phosphates, which are largely iron oxide and ferrous phosphate. In principle, when steel is immersed in a dilute phosphoric acid solution, a layer of ferrous phosphate is immediately formed. In the case of the present paper, it is possible that the ferrous phosphate layer gave greater stability to the corrosion product formed, which could explain the smaller variation in hardness at the 0.05 mm depth.
3.5. Morphological and EDS (Energy Dispersive Spectroscopy) analysis using a scanning electron microscope (SEM)
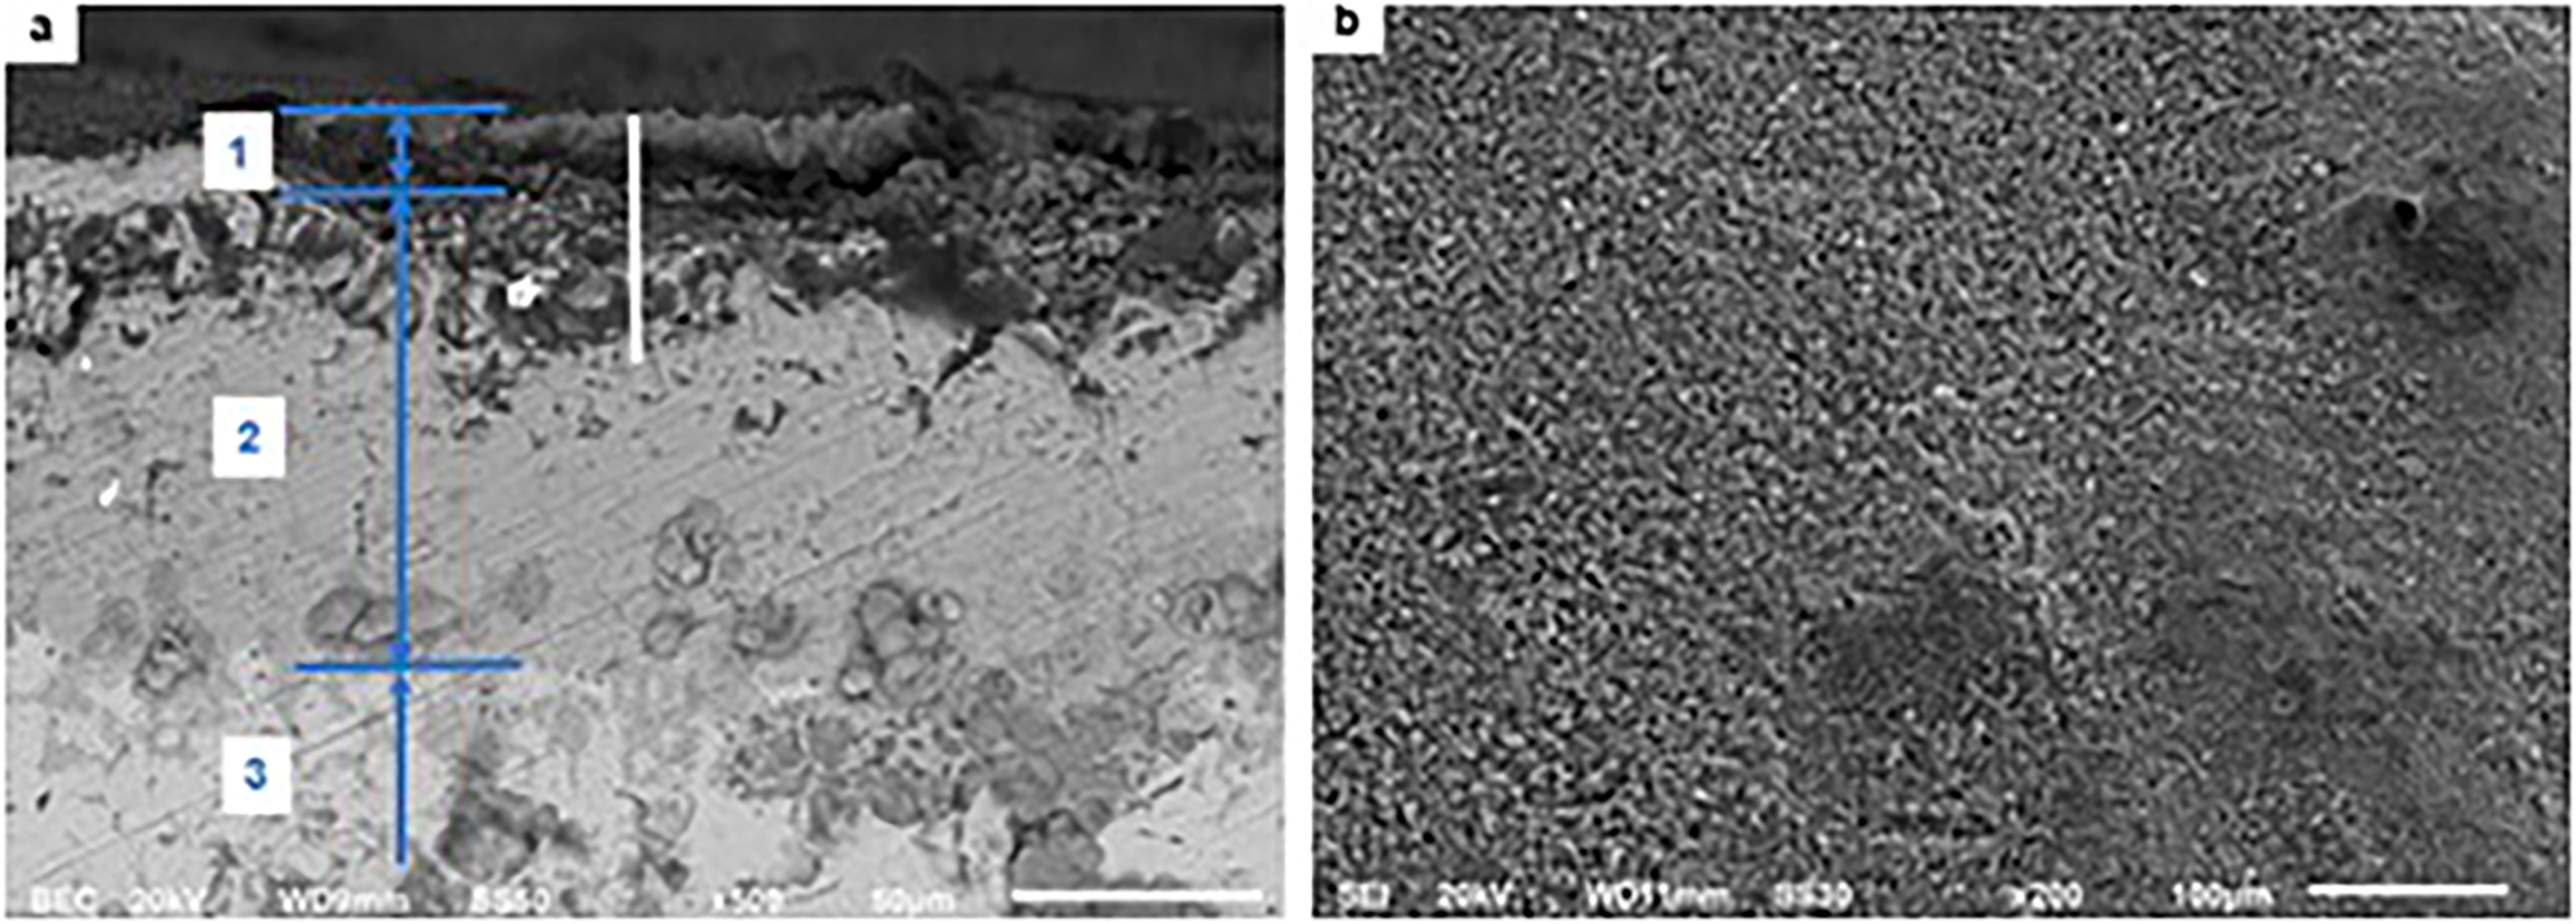
Figure 9 presents the SEM micrographs of the cross section (a) and top section (b) of the annealed sample.
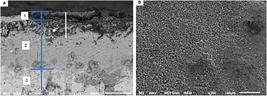
Figure 9 shows the SEM micrographs of the cross section (a) and top section (b).
In sections (a) of Figure 9a, the layer formed by the annealing process was measured. It is possible to identify the formation of 3 distinct regions.
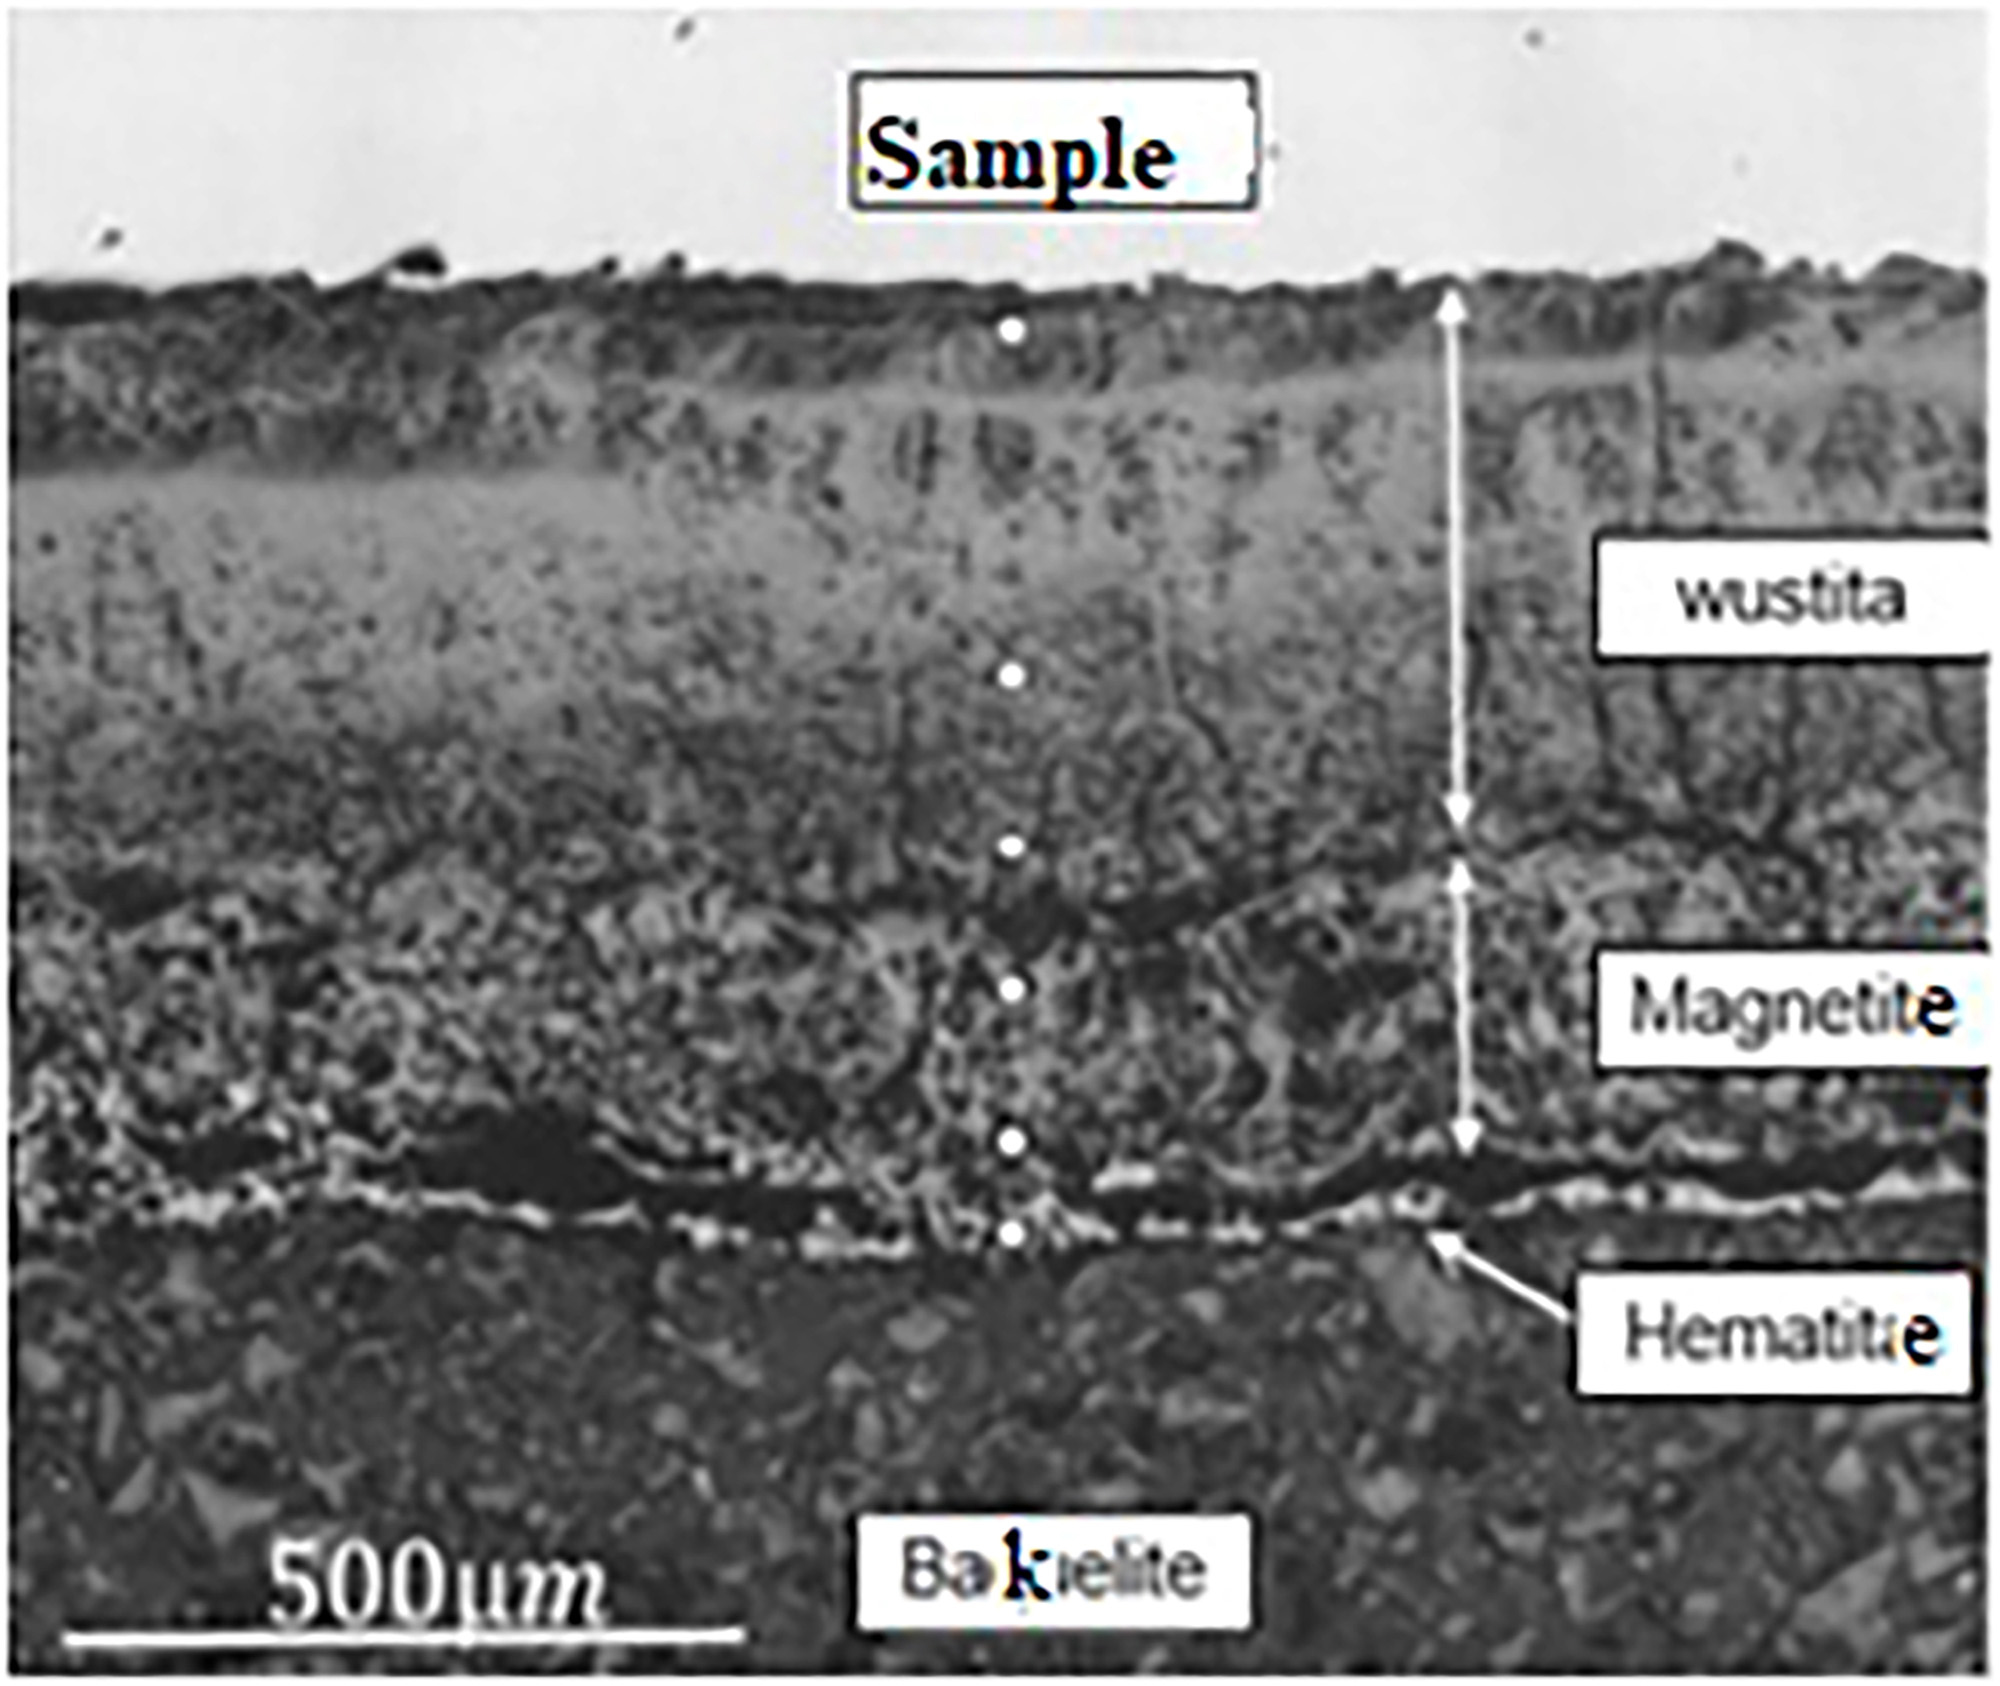
In the oxidation reaction, the oxide layer formed on the surface of the material, when subjected to a thermal gradient, corrosive environment or the simple action of time, is called scale, which originates from the diffusion of oxygen in the iron [23]. Therefore, regions 1 and 2 of Figure 9 (a) are due to the formation of scale and region 3 is the base metal. HAZAN et al. [24], heat-treated AISI 4340 at a temperature of 840°C for 16 hours in a furnace without atmosphere control and verified the formation of Wustite (FeO), magnetite (Fe3O4) and hematite (Fe2O3), which is the outer layer, maintaining a thickness ratio of approximately FeO:Fe3O4: Fe2O3 = 100:4:1, whose layers are shown in Figure 10.
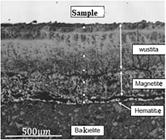
Optical microscopy image of oxidation layers in AISI 4340 steel at a temperature of 840°C for 16 hours (Adapted from HAZAN et al. [24]).
According to the authors, the formation of the three distinct oxide layers occurs above approximately 570°C, under conditions of atmospheric corrosion. In general, the wüstite phase is found in higher concentrations than the others, being the predominant phase in the scale, amounting to approximately 75% of its composition. Furthermore, wüstite is the phase with the highest Fe/O ratio, but this oxide is not very thermodynamically stable at temperatures below 570°C.
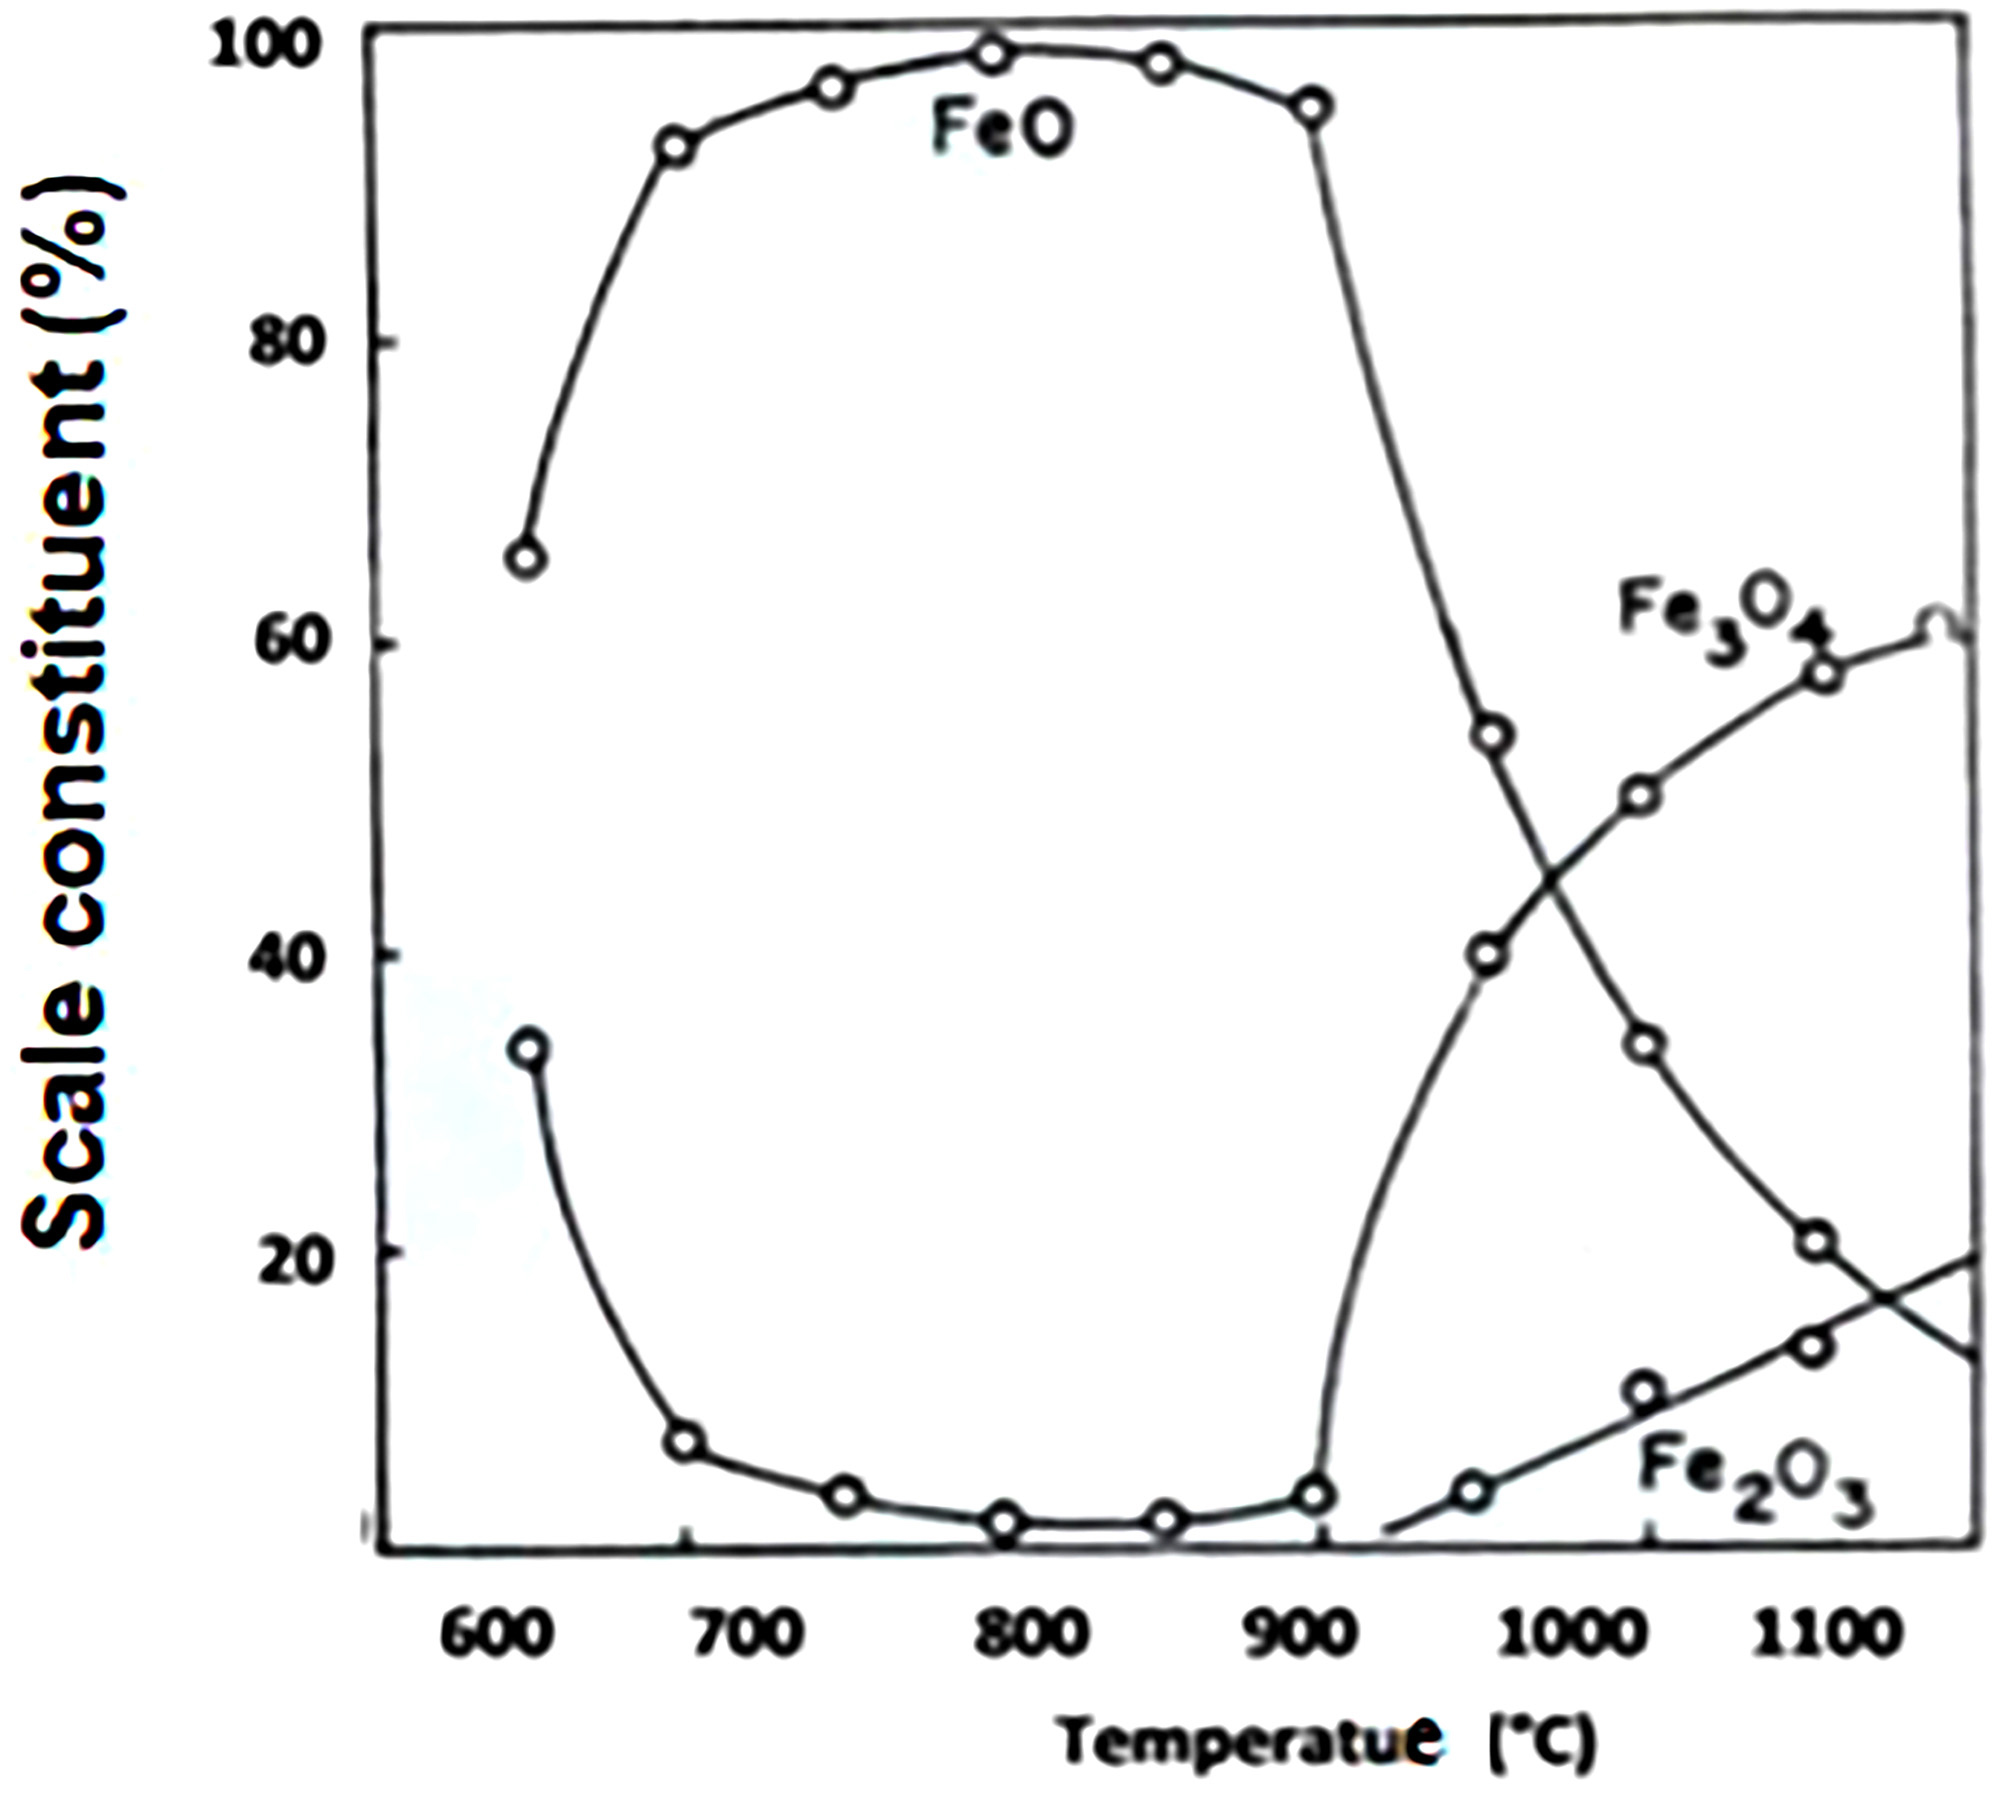
According to CUNHA [23], the proportion of formation of each of these oxides depends on the temperature and cooling rate, as FeO is not stable during cooling and can transform into Fe3O4. Figure 11 shows the temperature ranges versus the proportion (%) of scale constituents.
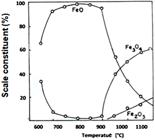
HAZAN et al. [24] showed in their research that the thicker the wüstite layer, the less adherent the scale is to the steel. According to CUNHA [23], this is explained by the increase in internal tensions during the growth of scale while the material is heated at high temperatures to carry out surface treatments. These stresses generate cracks that are more easily removed in the mechanical pickling process, or in another heat treatment process. Also according to CUNHA [23], magnetite (Fe3O4) is an oxide that is very adherent to steel and difficult to remove. Furthermore, at temperatures below approximately 570°C, the wüstite oxide layer is not thermodynamically stable and the oxide layer adjacent to the unoxidized sample must be the magnetite layer [25].
At temperatures below 620°C, the proportion of Fe3O4 in relation to FeO increases in the shell. Fe2O3, on the other hand, remains in minimal and practically constant quantities at any temperature range. FeO is not stable during cooling, and can transform into Fe3O4, depending on the temperature reduction rate applied [26]. Temperature is an extremely important factor in the growth rate and constitution of scale oxides. Therefore, in Figure 9 (a), it is believed that region 1 can be identified as hematite (more superficial). In region 2, it is possible that a mixed region of magnetite and wüstite was formed. This result was attributed to the thermodynamic instability of the wüstite layer at room temperature and the slow cooling of the oxygen-poor wüstite after heat treatment [25]. Figure 9 (b) shows the top micrograph of the annealed sample, containing roughness inherent to the scale formed. In atmospheric corrosion, the time-dependent reaction rate is parabolic above 200° C and logarithmic below this temperature. The parabolic law refers to diffusion in the solid state. Taking particle size into consideration, the oxide layer of the sample is composed of hematite, appearing very uniform.
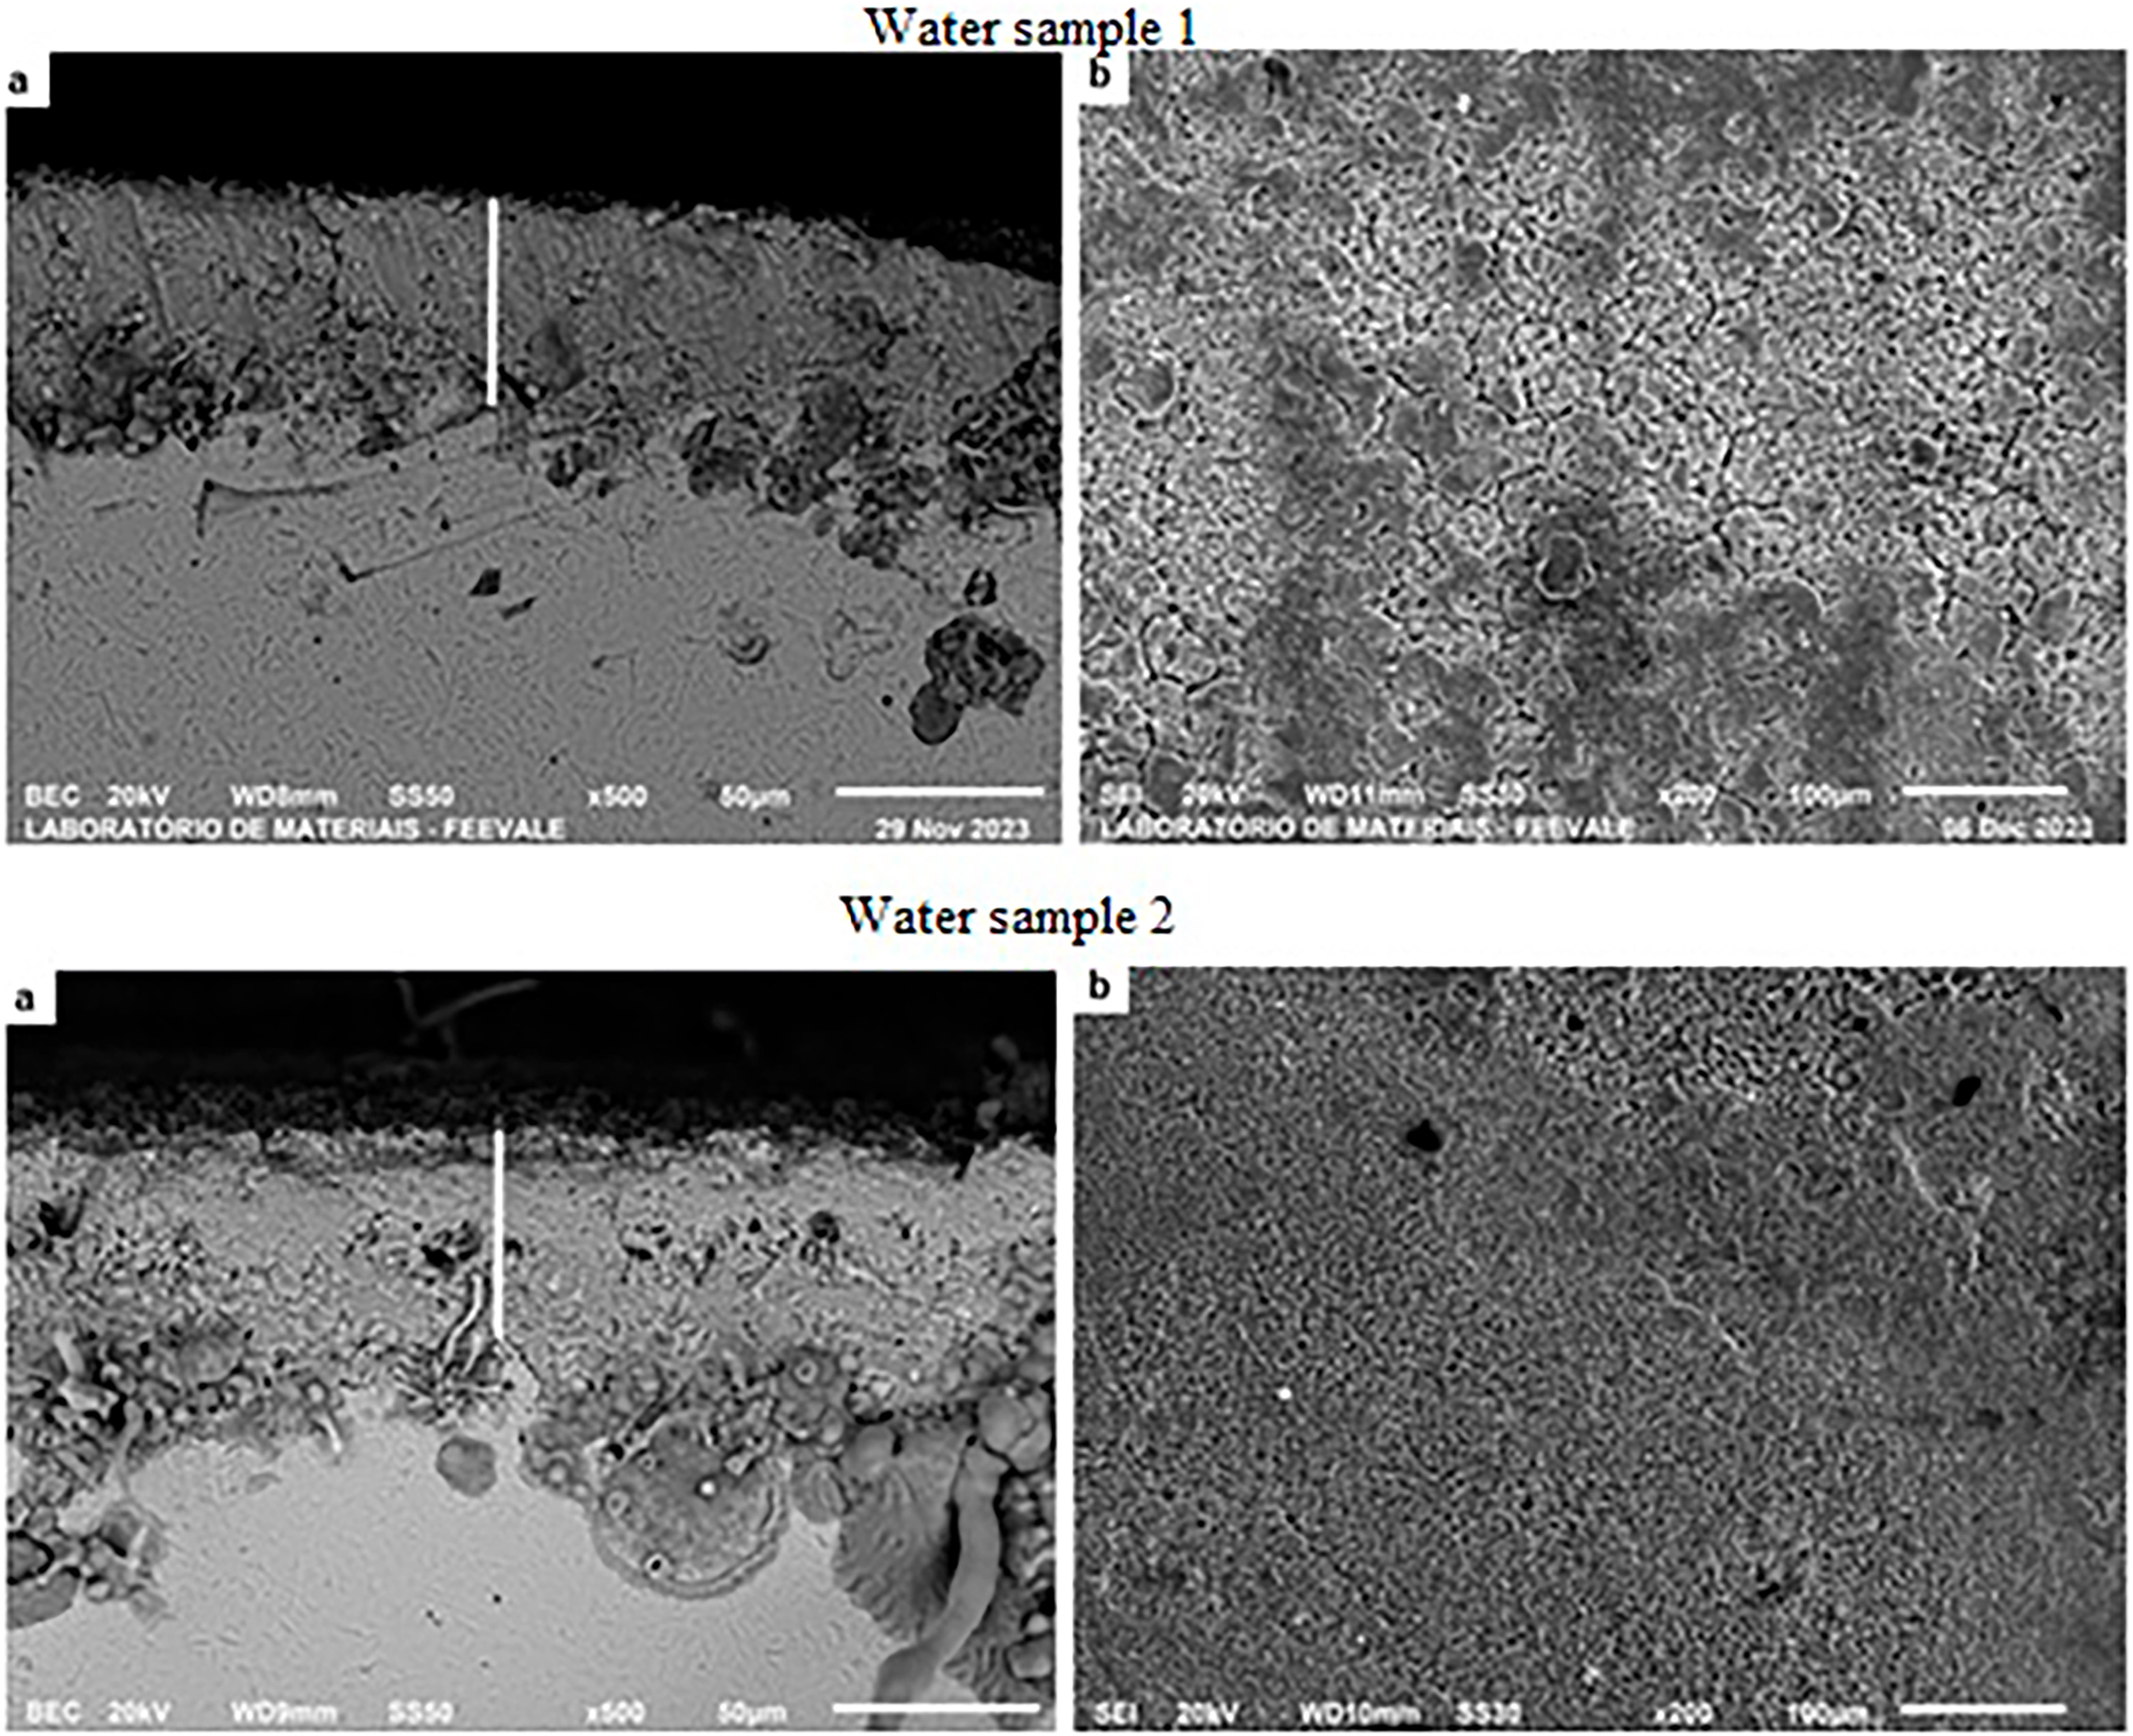
Figure 12 shows the cross and top sections of samples 1 and 2 quenched in distilled water (H20).
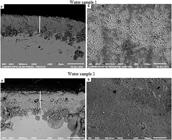
SEM micrographs of cross section (a) and top section (b) of AISI 4340 steel tempered in H2O. Samples 1 and 2.
In sections (a) of Figure 12, measurements of the layer on water-quenched steel were carried out. It is observed that the two samples tempered in water presented a layer greater than 50 µm. It is also possible to identify differences between the cross-sectional layers of the two samples, which can be possibly explained by the preparation of the samples, due to some contamination arising from the sanding and polishing processes or even due to inclusions present in the material itself and formation of the scale layer. Furthermore, it was not possible to identify the outermost layer of oxide, seen in Figure 9, called Hematite. This occurs due to the low adhesion of this layer, when compared to the others. Also, as mentioned previously, there is an increase in internal stresses during the growth of scale while the material is heated to high temperatures to carry out surface treatments. These stresses generate cracks that are more easily removed in the mechanical pickling process, or in another heat treatment process, such as in quenching [23]. Another observation made in Figure 12 is that samples 1 and 2 showed different behaviors in top view. Apparently the surface cracks are more evident in sample 1 (Figure 12 - 1 (b)) than in sample 2 (Figure 12 - 2 (b)). However, it cannot be ruled out that there are no cracks in sample 2 (b).
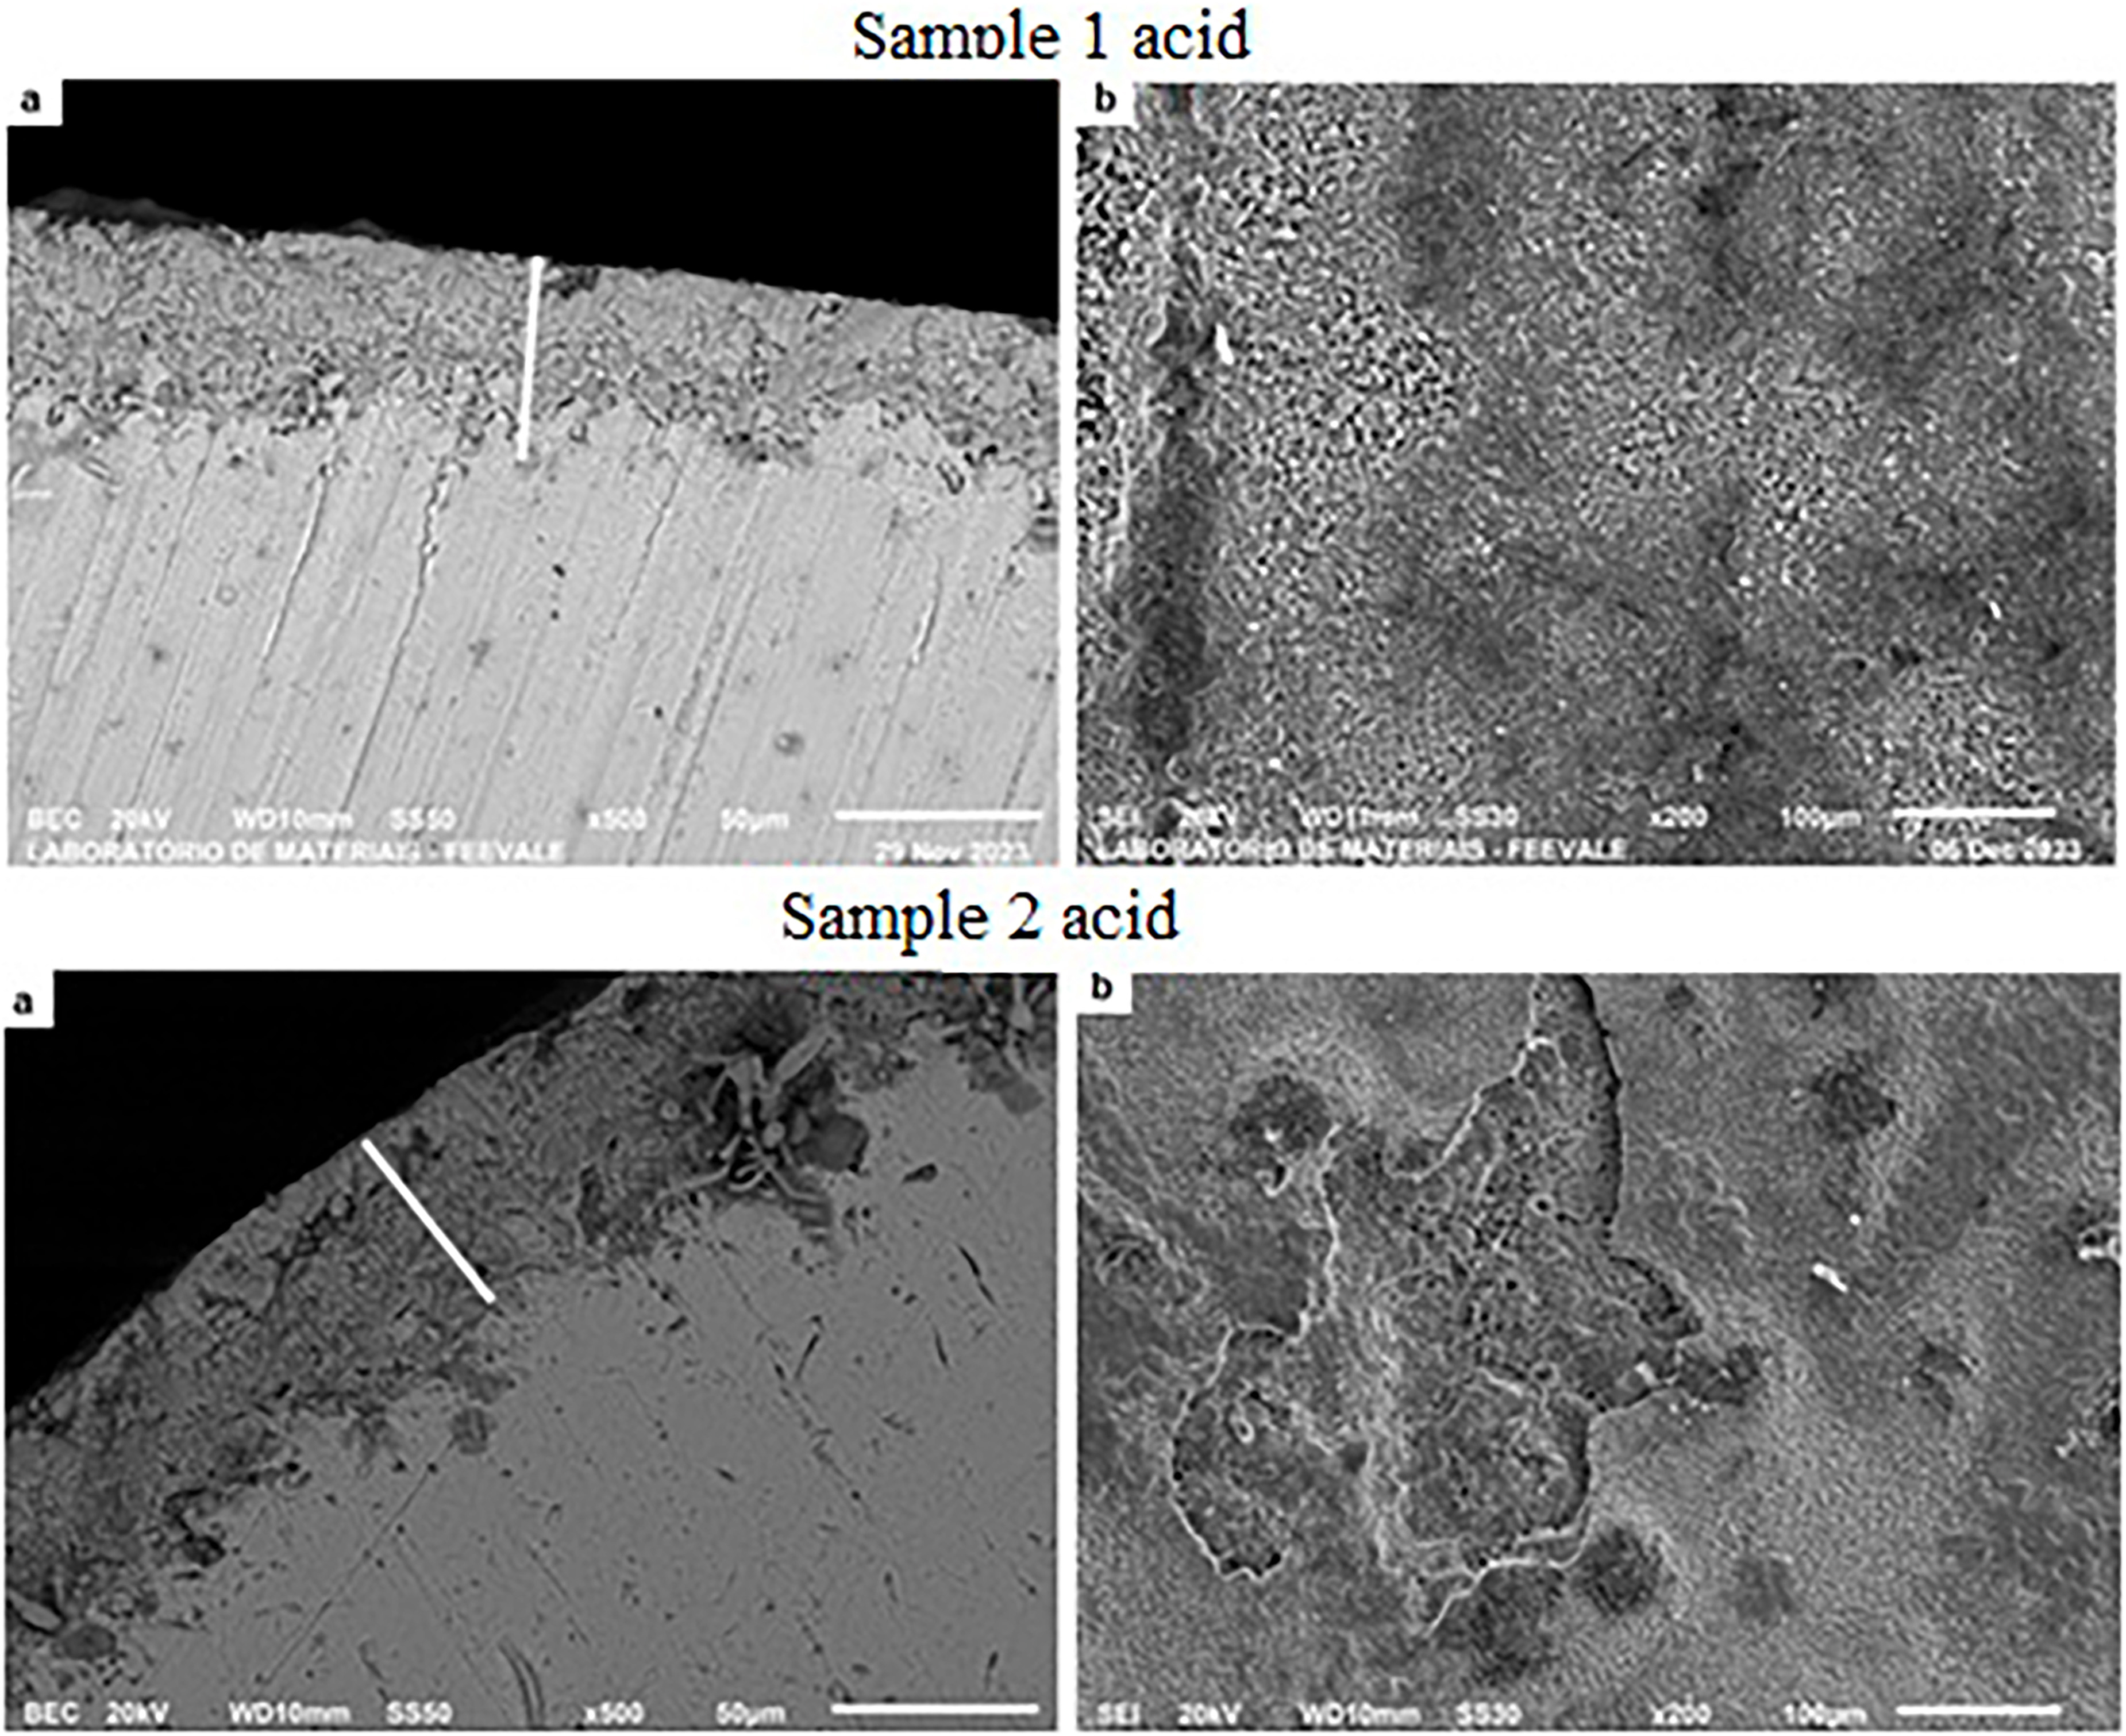
In Figure 13, micrographs are presented in top and cross-section views of samples 1 and 2 heat-treated in 2% H3PO4. In samples treated in acid (2% H3PO4), it is possible to identify differences between the layers. In sample 1, Figure 13 (a) it is possible to verify that the layer thickness is less than 50 µm, while in sample 2 the thickness approaches 50 µm. This behavior is different from samples tempered in water, which in several regions were thicker than 50 µm. This smaller layer, formed in acid, can be explained by the formation and maintenance of the vapor blanket throughout the H3PO4 quenching process (Figure 4 c – g), as there was a more intense diffusion of oxygen in the quenching medium, which is one of those directly responsible for the formation of scale. Unlike samples tempered in water, the layer of samples tempered in acid appears to be less compacted and more porous, “brittle”. This may be a possible explanation for the peeling of the layer identified in sample 2, in section (b) of Figure 13.
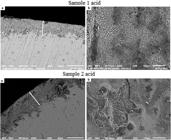
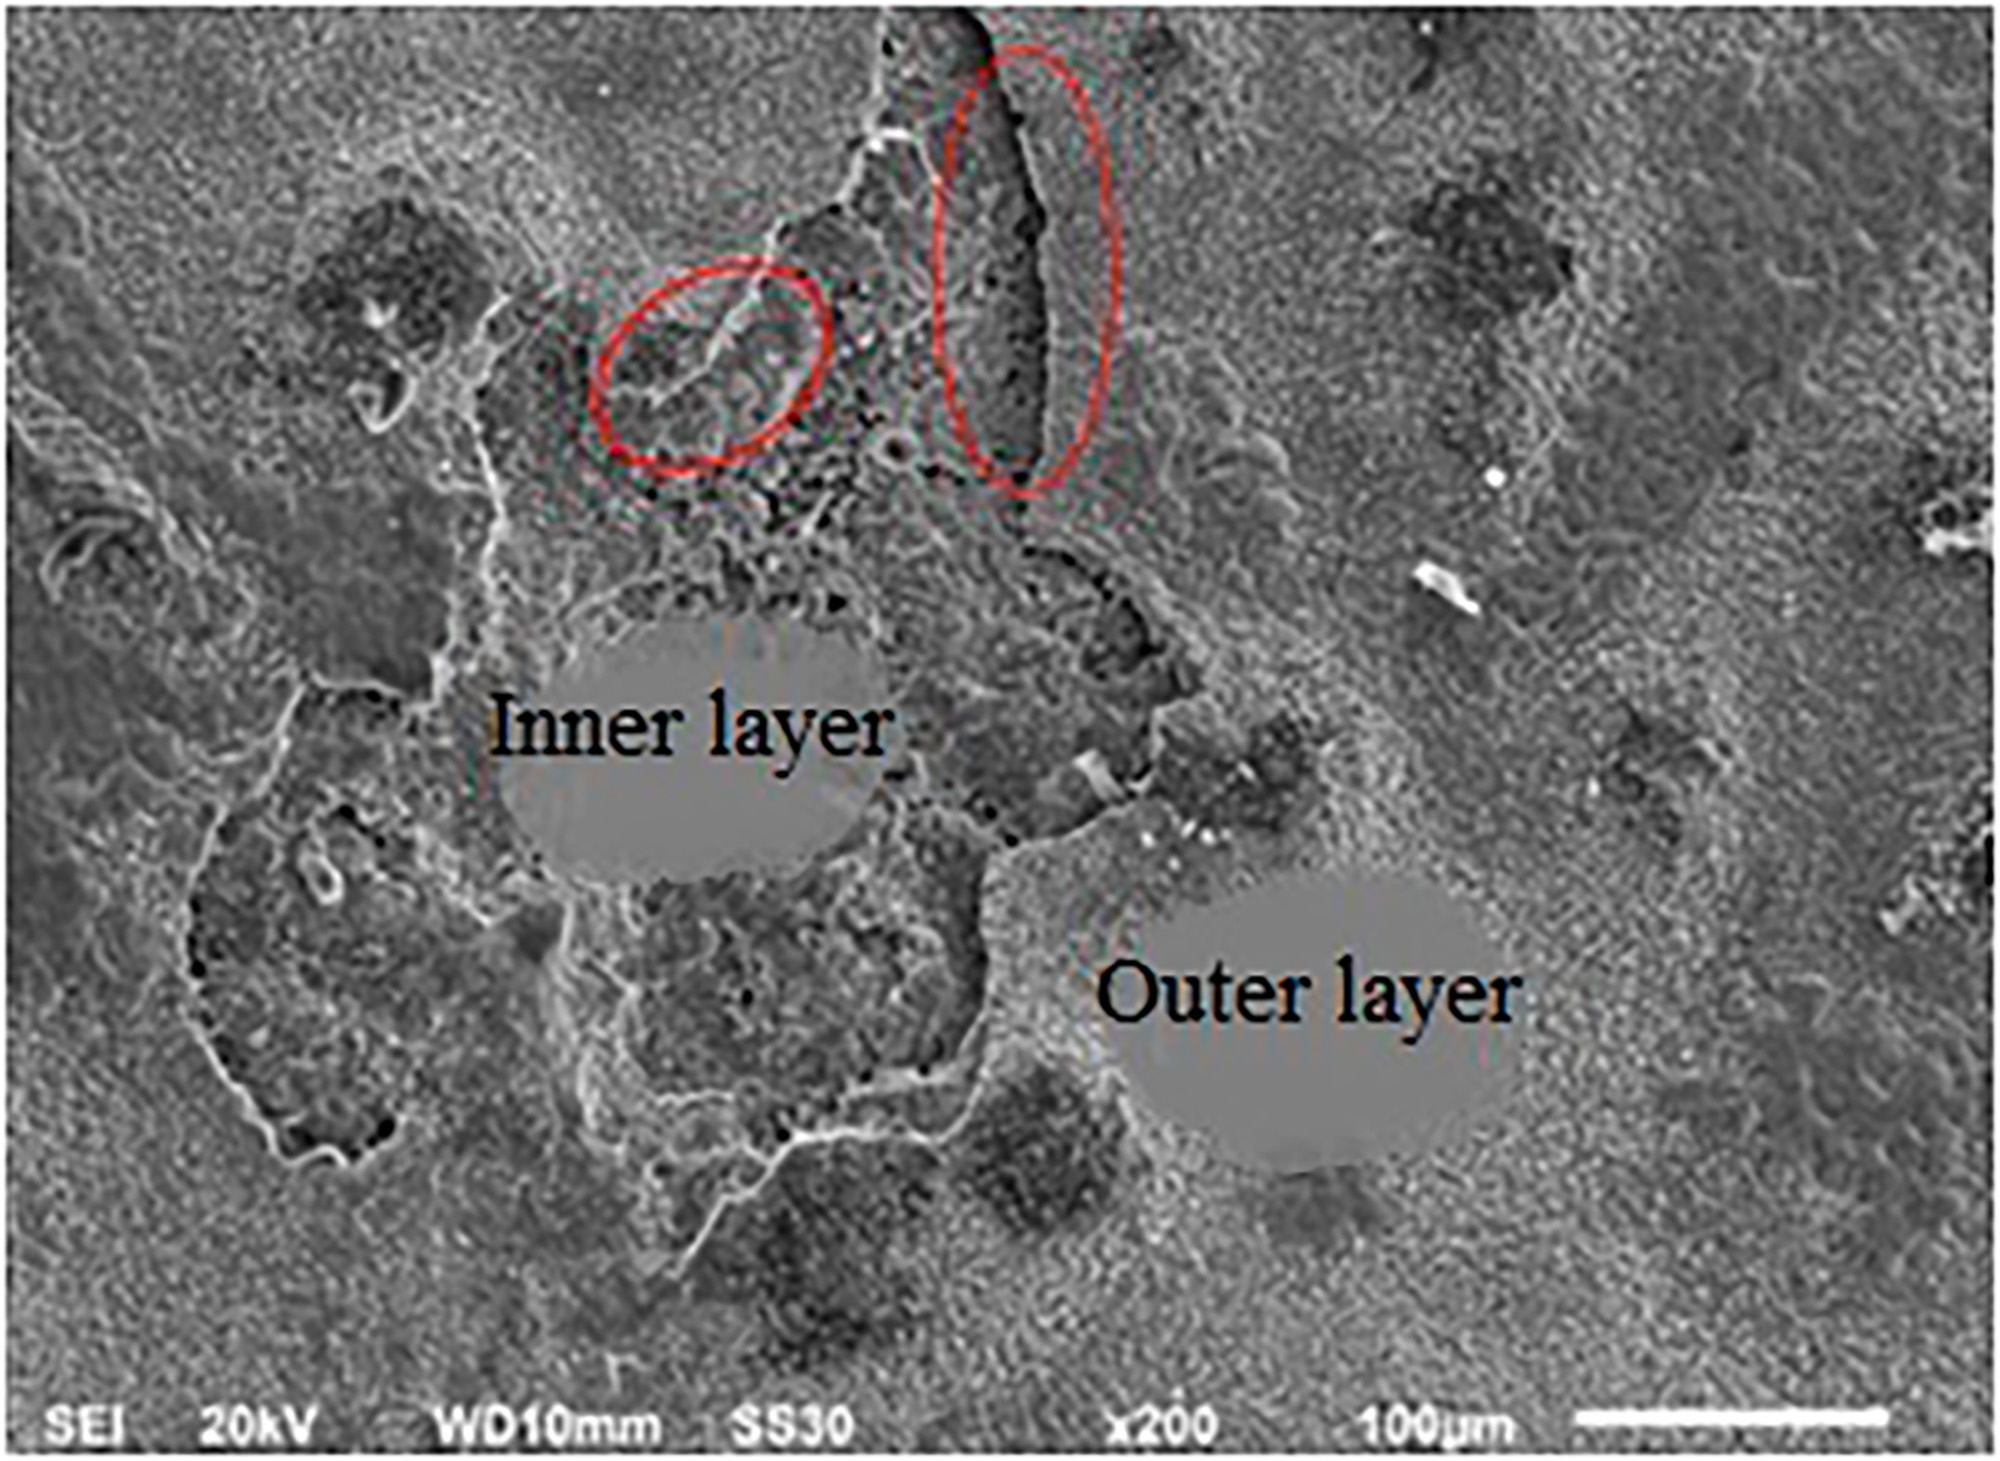
In samples tempered in 2% H3PO4 it is possible to identify lighter shades of gray (section b) that may be associated with phosphorus deposition in the surface layer of the samples. In Figure 13 (as well as in Figure 12) the surface layer of oxide (hematite) was also not identified. In sample 1, it is possible to identify that there are no cracks in the cross-section layer (a), just as it is possible to identify that the top layer (b) appears uniform. Sample 2 presents visible peeling in the top view, Figure 13 (b), which can be associated with the double oxide layer, whose peeling details are presented in Figure 14.
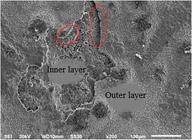
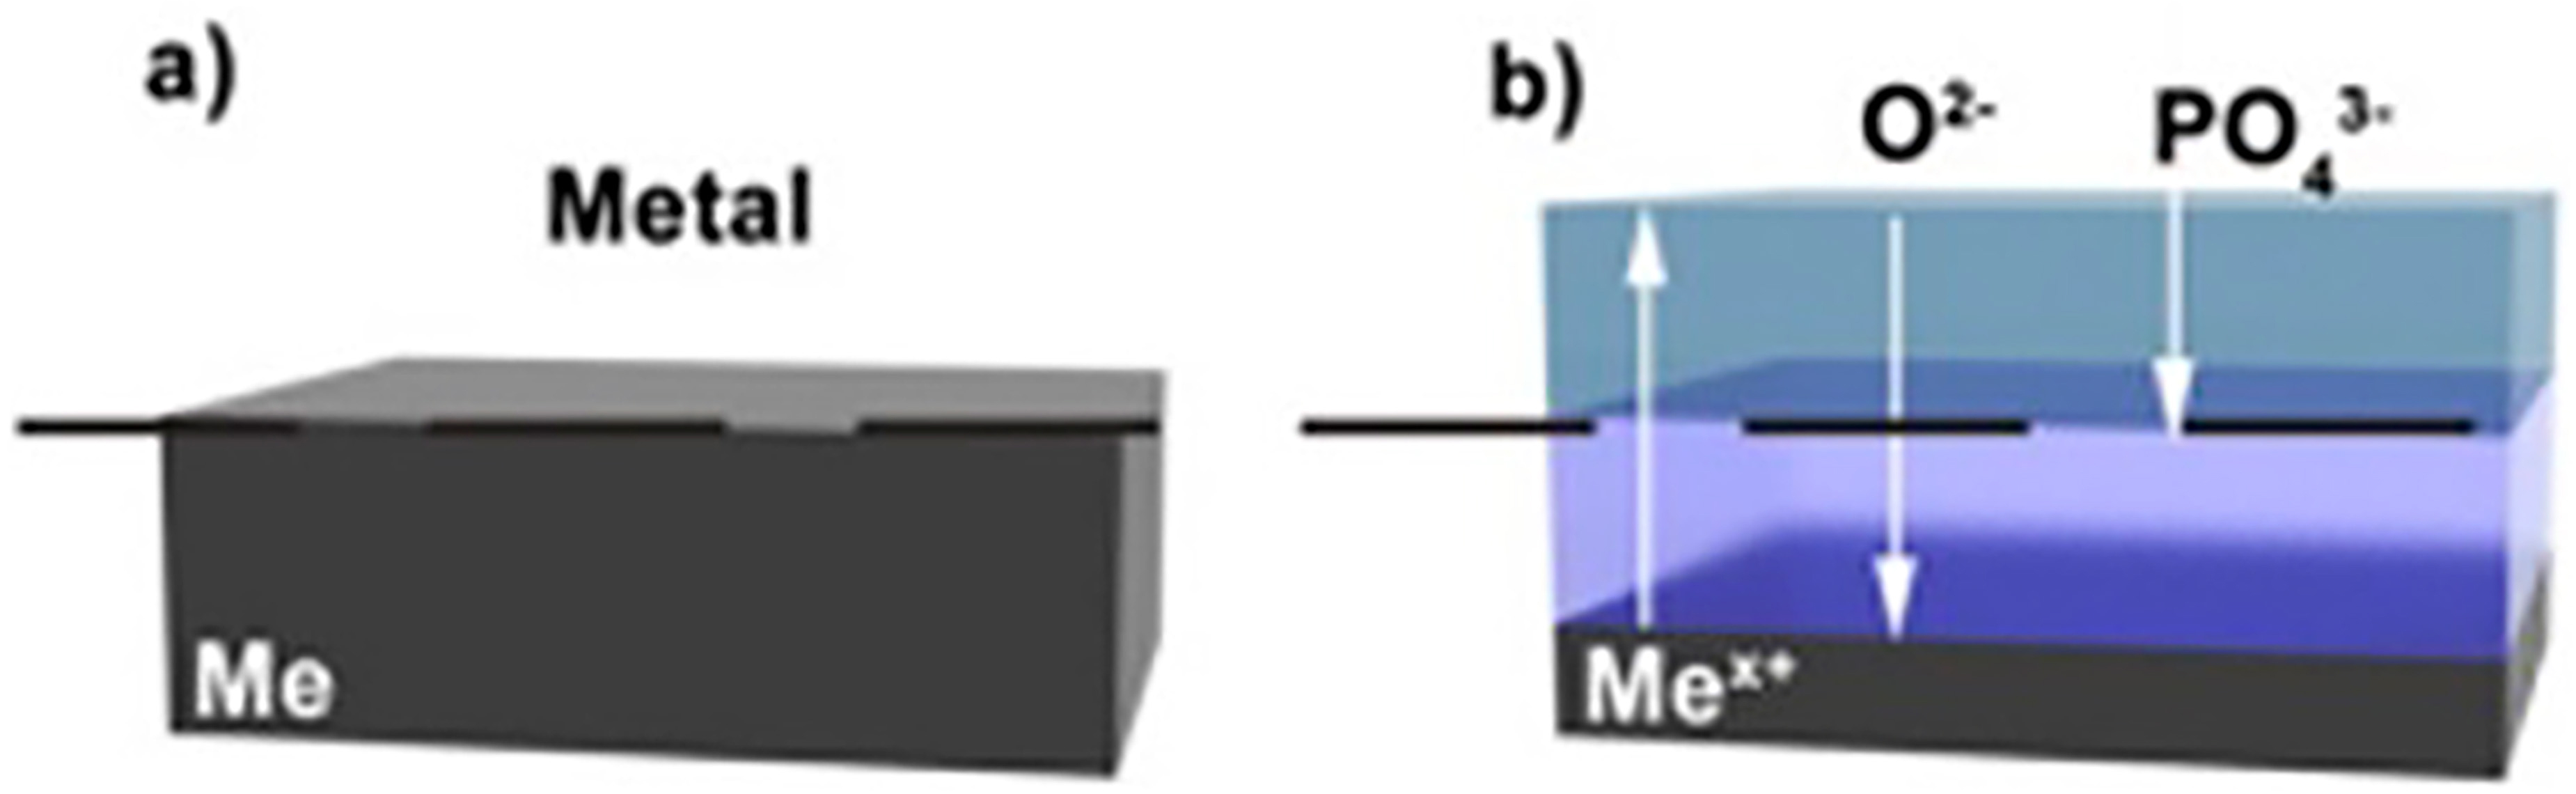
Figure 14 shows the peeling of sample 2 tempered in phosphoric acid (2%), in which it is possible to identify an internal and external layer of the sample. This peeling off of the external layer can be explained by the low adhesion of wustite [25], associated with the incorporation of phosphorus on the sample surface. Studies have shown that the incorporation of phosphorus occurs during the formation of oxides through the application of an electric field. In this case, the mechanism of migration of oxygen and phosphorus to form the oxide occurs in two ways. The first is due to the applied voltage, which causes oxygen ions to migrate into the oxide. These oxides can be accompanied by the incorporation of small anionic species that are present in the electrolyte. The other form of origin is external, in which metal ions migrate and react at the external interface, forming the oxide and adsorbing ionic species from the electrolyte. For example, phosphorus species derived from the phosphoric acid electrolyte can be predominantly distributed through the outer layer film that is formed by the outward migration of metal ions, Figure 15 (b). If this process occurs, migration with oxygen also occurs, and the maximum depth of incorporated anion species is determined inside by the migration rate in relation to oxygen.
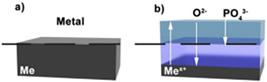
Structure of the barrier-type oxide layer formed in aqueous electrolytes (Adapted from KOWALS et al. [26]).
In many cases, the inward migration of ions is much slower (they are immobile or migrate outward) than that of oxygen ions, and therefore they can only be distributed through a portion of the total oxide thickness, as shown in Figure 15 (a – b) [23]. This behavior was verified in niobium anodization: the authors anodized niobium in 1 M H3PO4, in potentiostatic mode with the application of 150 V for 5 minutes, and verified that the oxide contained two layers of the same thickness. They observed that the outer oxide layer contained phosphorus while the inner layer did not. Because of this, it is believed that the outer layer, where peeling occurred, may contain phosphorus, which may have been incorporated during acid quenching.
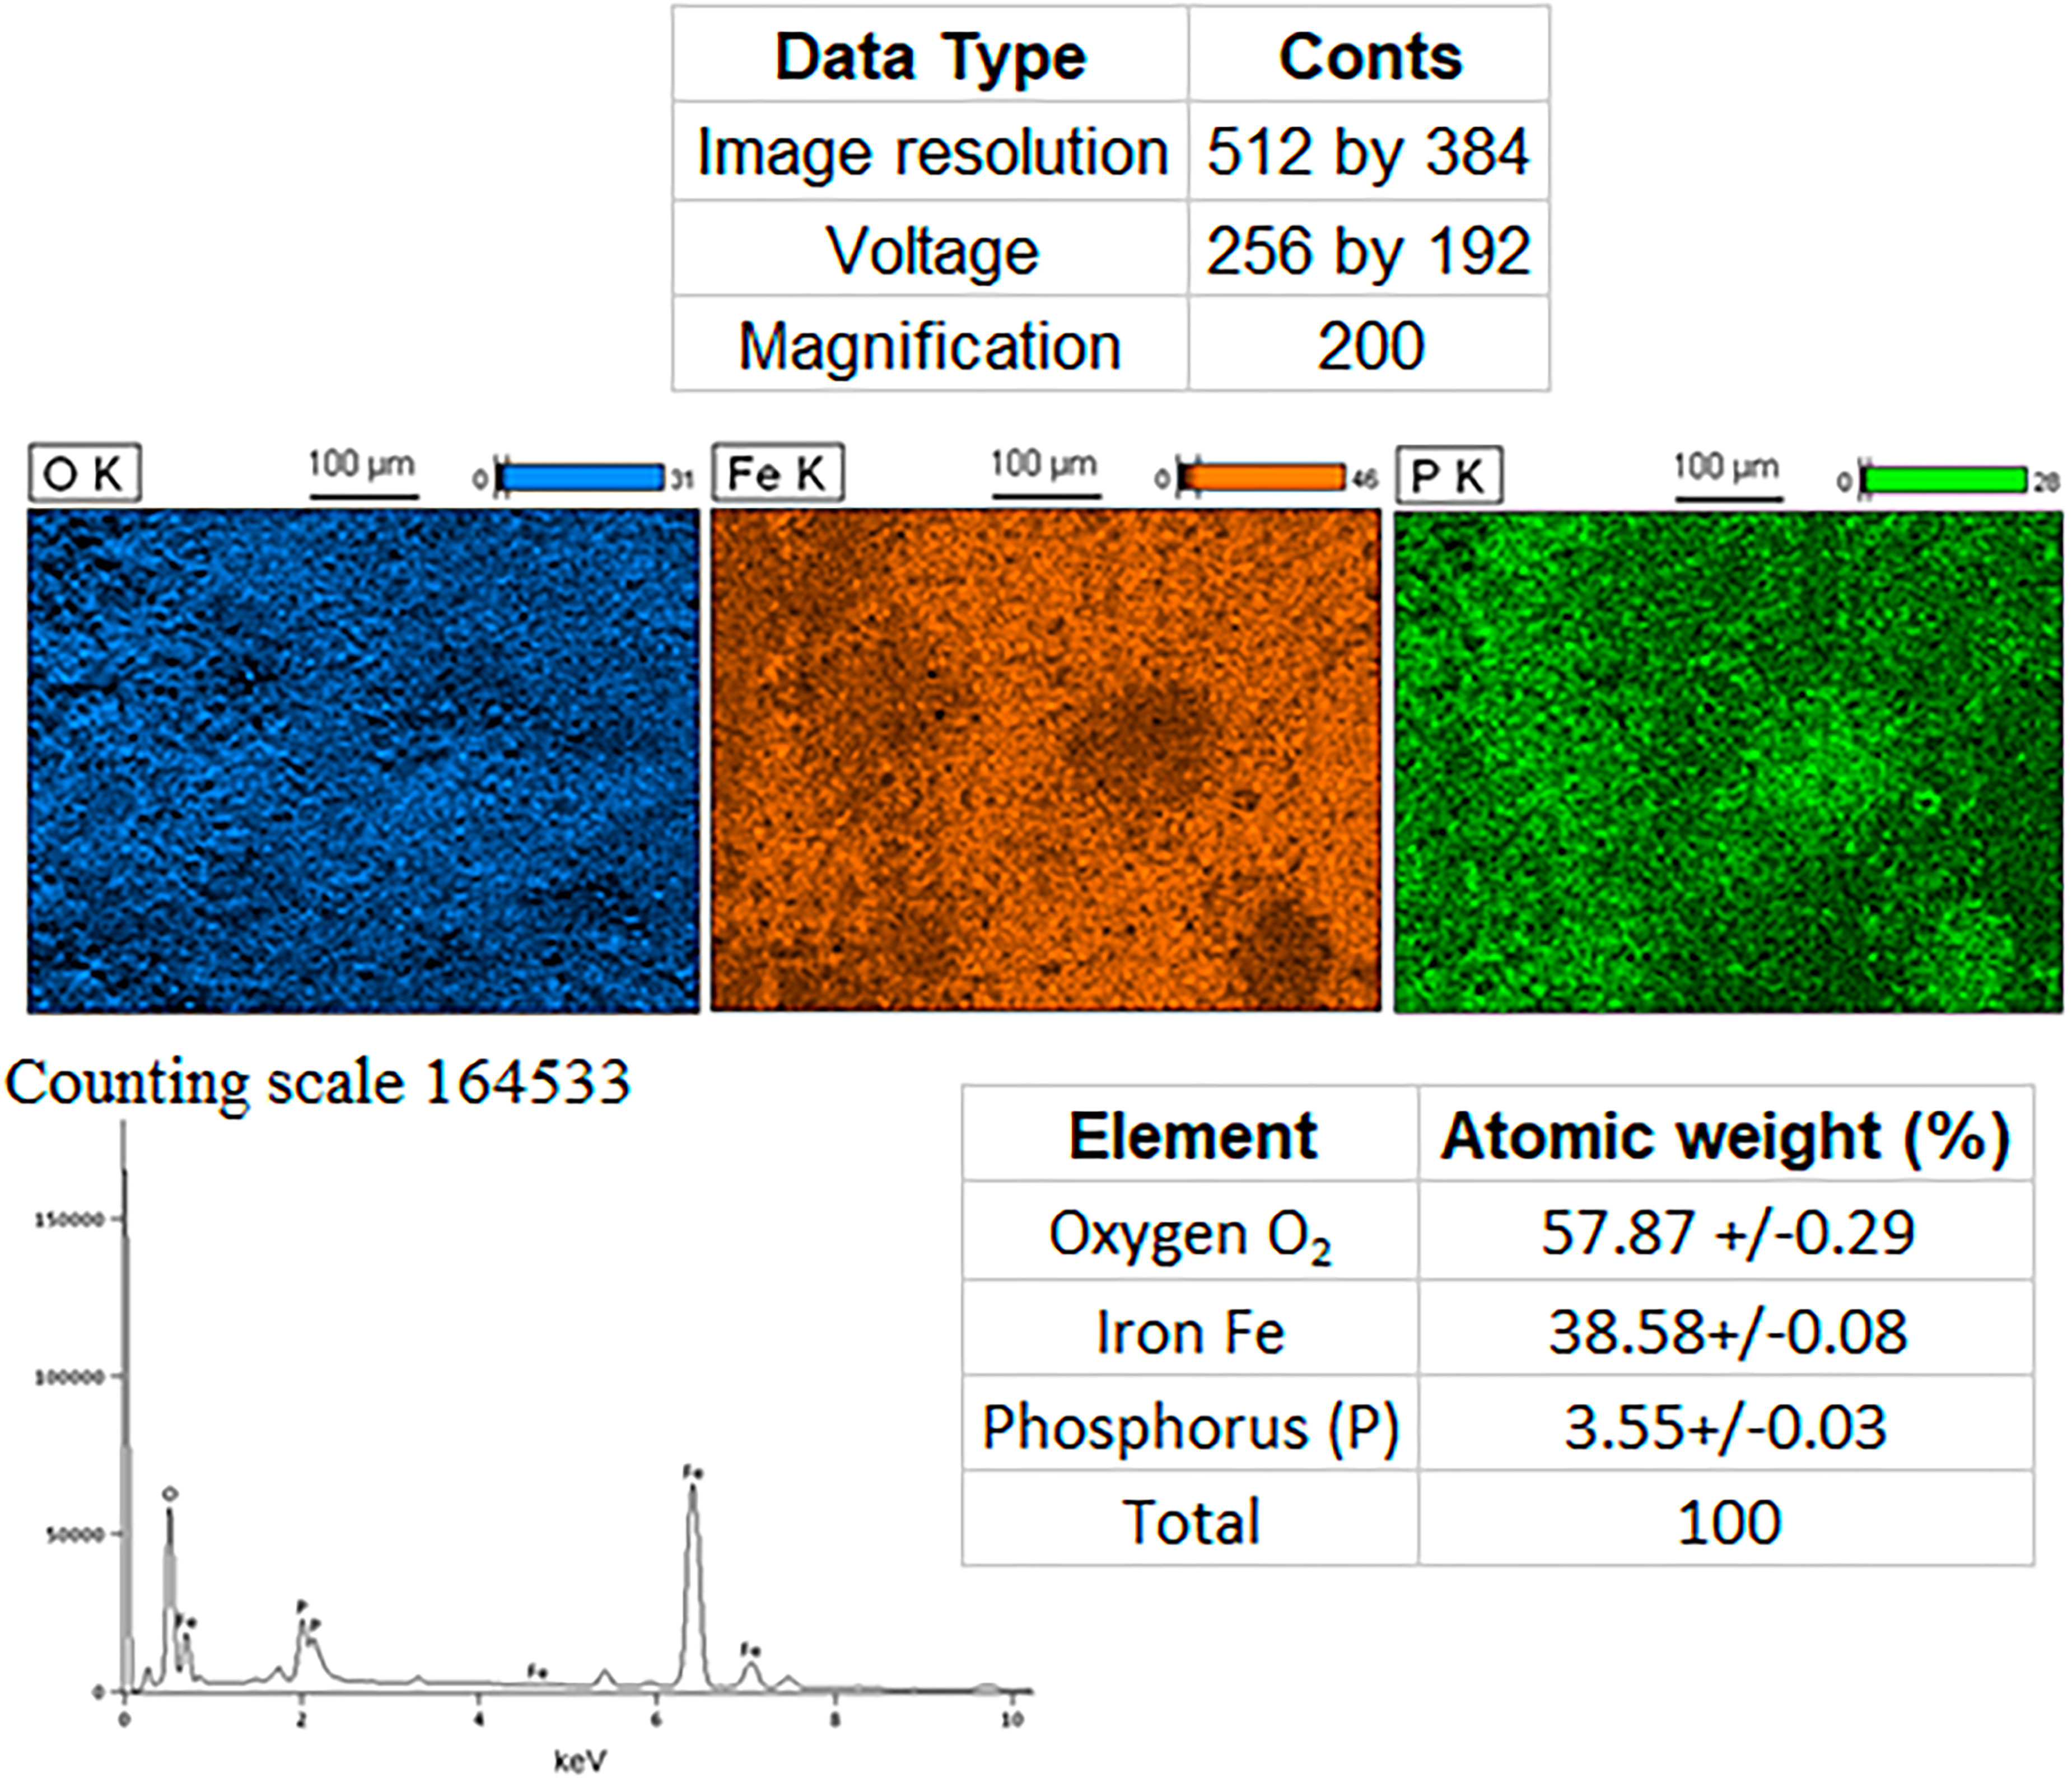
To prove the incorporation of phosphorus, an EDS analysis was performed on acid-quenched sample 1, as shown in Figure 16.
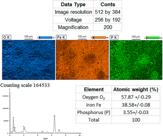
Figure 16 presents the analysis of the chemical elements in the chemical composition of the surface layer of acid-quenched sample 1. The EDS of sample 2 was not shown, as it did not contain phosphorus as sample 1 did, which is described in Figure 12. The measured value was 3.55%, percentage by atomic weight. However, due to the EDS technique being semi-quantitative, it cannot be stated that 3.55% of P was incorporated, but it can be inferred that phosphorus was incorporated. Nonetheless, despite the incorporation of phosphorus on the external surface, the layer formed showed displacement and was not uniform, which can also be explained by the instability of the vapor layer caused during quenching.
3.6. Electrochemical potentiodynamic polarization test
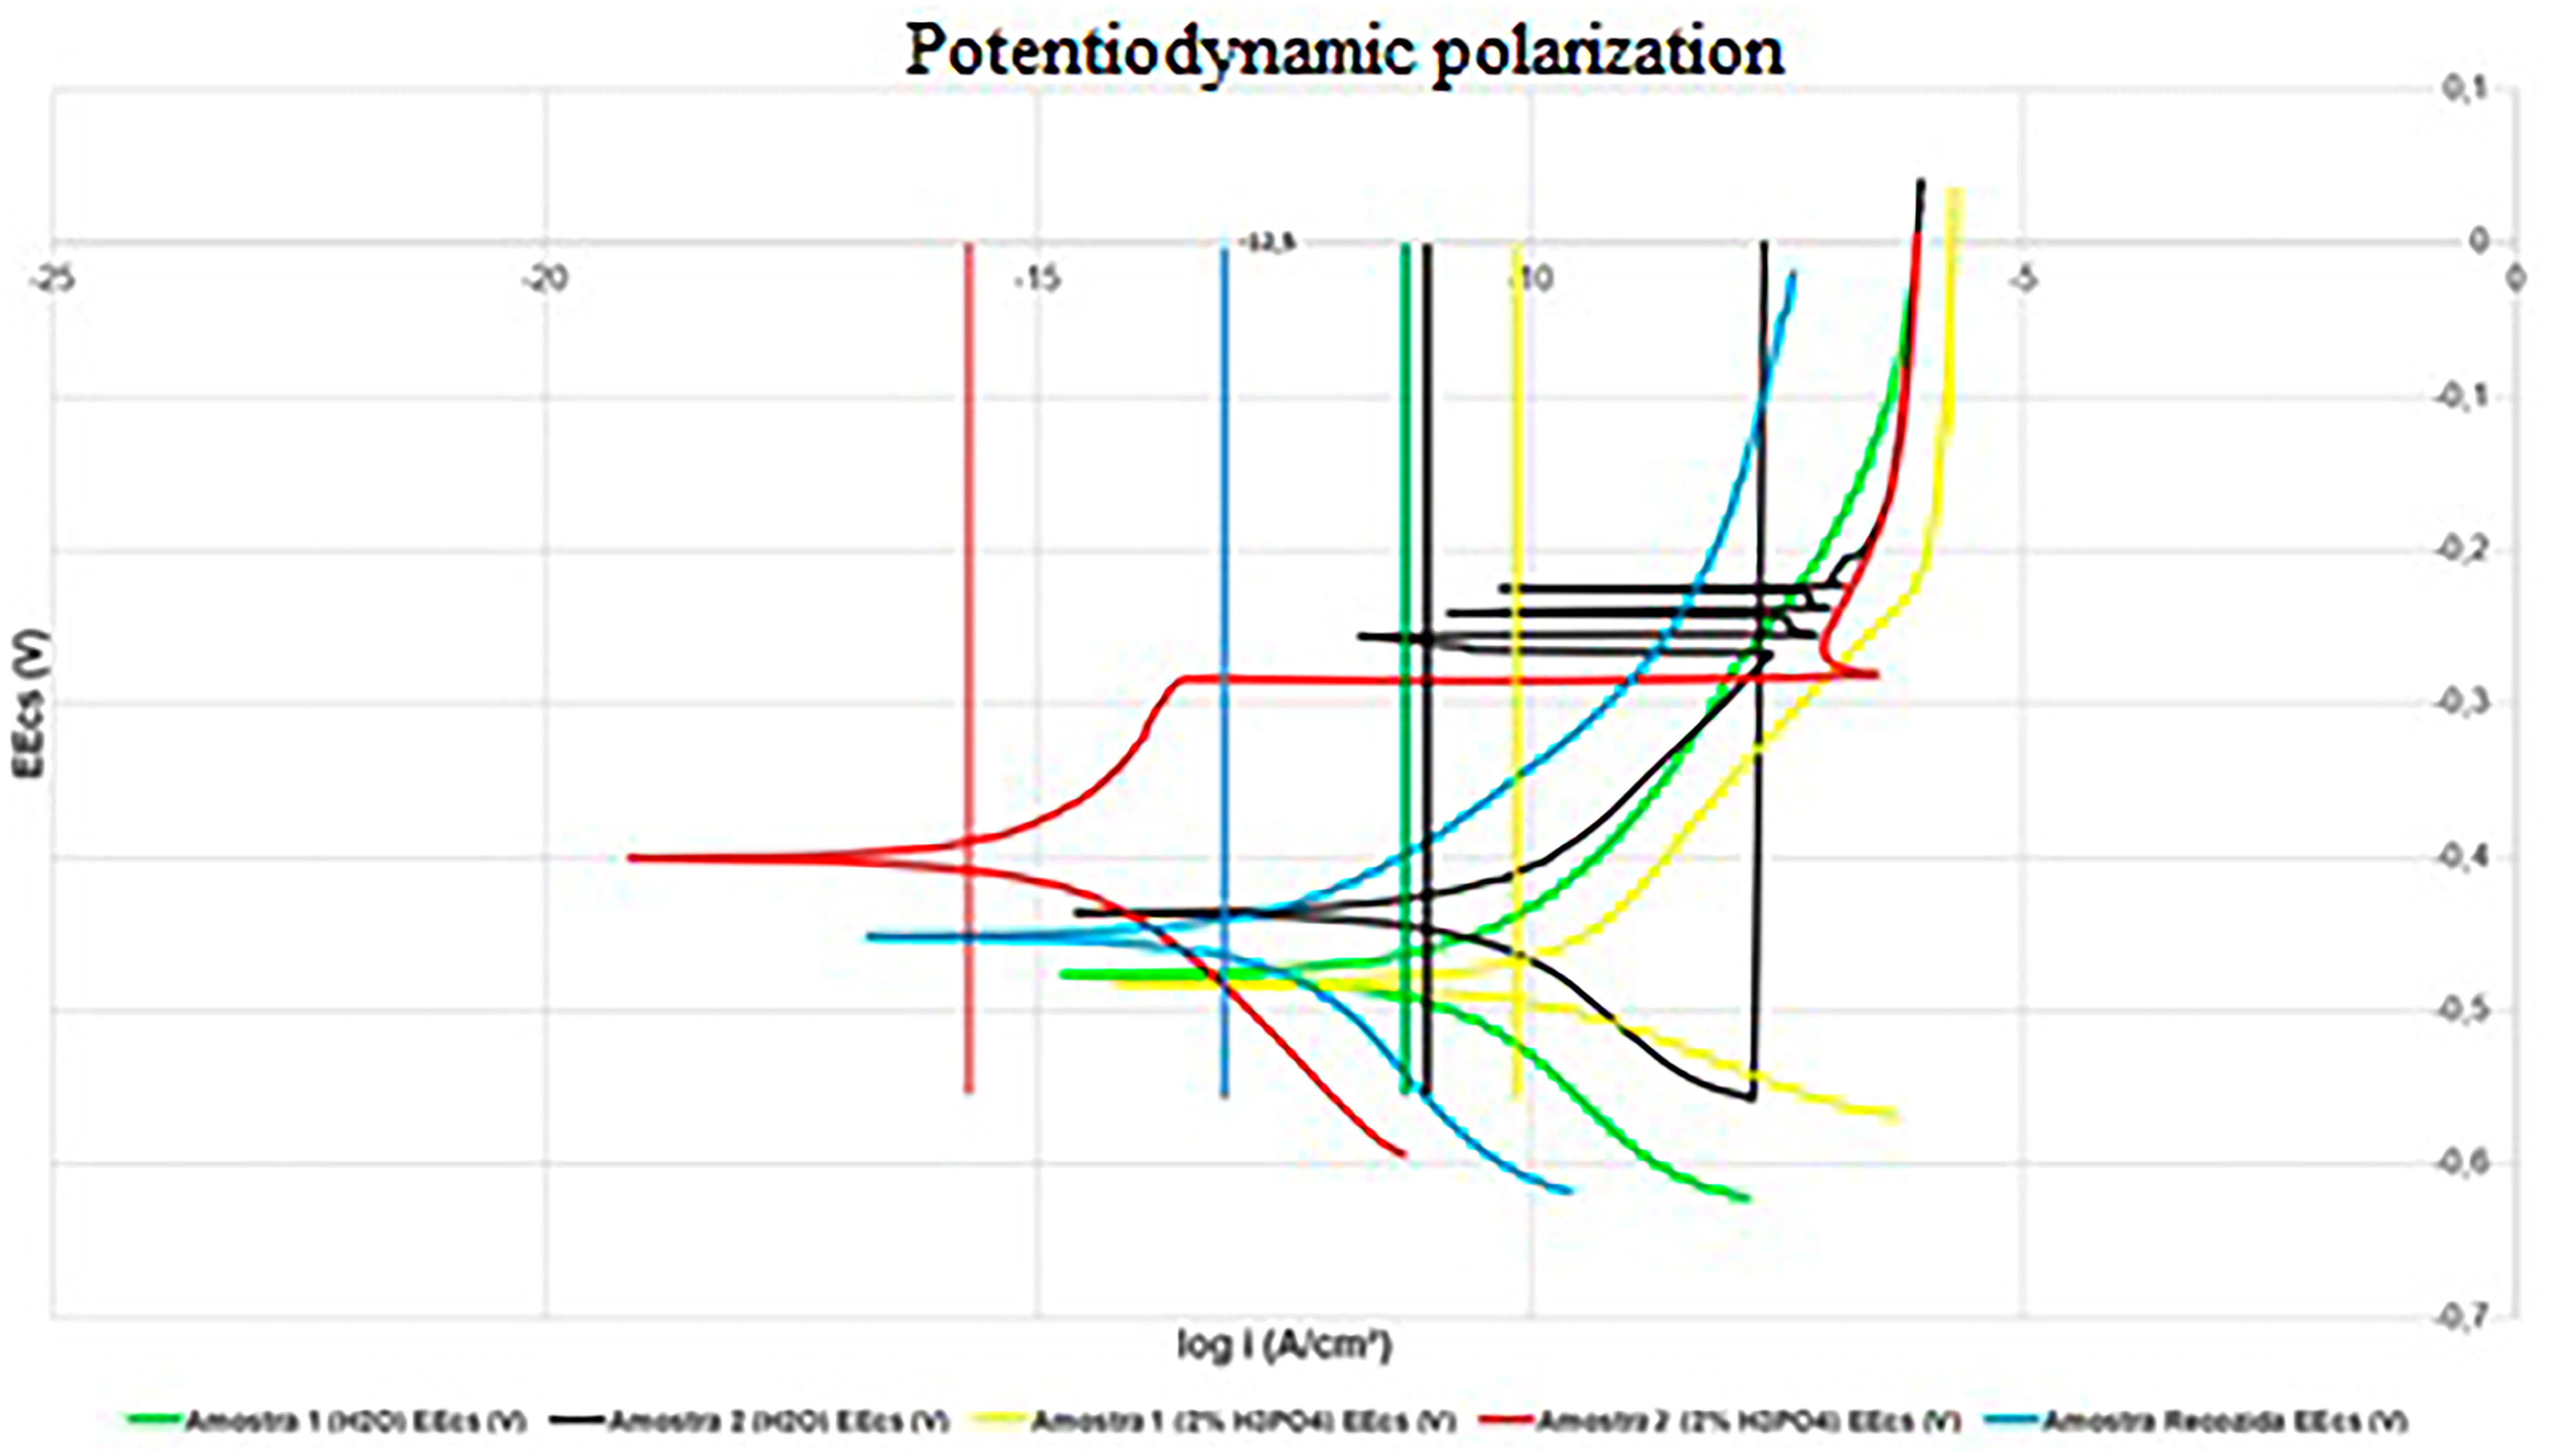
Figure 17 shows the potentiodynamic polarization curves of the samples treated in water (1 and 2) and in 2% phosphoric acid (1 and 2) and of the annealed sample.
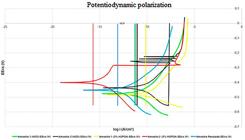
Potentiodynamic polarization curves of samples treated in water (1 and 2) and in 2% phosphoric acid (1 and 2) and annealed sample.
In Figure 17, a difference in corrosion potential of less than 100 mV can be observed among all tested samples. This may be due to all samples having Fe as the majority element in their chemical composition, which results in oxidation potentials close to that of Fe [19].
In Figure 17, it is observed that sample 2, red H3PO4, had the lowest corrosion current density, while sample 1, yellow H3PO4, had the highest corrosion current density. The two heat-treated samples showed the highest and lowest corrosion current densities, which may be associated with the peeling of the heat-treated layer, Figure 14. This agrees with the fact that acid quenching does not have all the cooling steps, as cited by Zordão et al., 2019 [15]. In this case, the treated layer may show variations in scale formation due to the very slow cooling caused by the vapor cloud that lasted until the end of the quenching of the samples treated in phosphoric acid, Figure 4. This may explain why there are differences in the layer along the sample sections, as seen in Figure 13, where the treated layer of the acid-quenched samples had a smaller thickness value than that of the water-quenched samples.
The water-quenched samples showed very similar corrosion current densities, which can be explained by the formation of a more homogeneous heat-treated layer than that of the acid-quenched samples. Furthermore, it must be considered that the thickness of the layer formed in water is greater than that of the layer formed in acid. As seen in Figure 12, the formation of steam and bubbles in water-quenched parts occurred in the way that Zordão et al., 2019 [15], highlight in their research, with the formation of a vapor layer that breaks through bubble nucleation and, after that, the occurrence of convective cooling. As these steps were observed during the water quenching process, it is possible to state that the cooling happened more regularly, and therefore the quenched layer became more homogeneous, which justifies the similar behavior between the samples. It is also possible to notice this small difference when comparing the SEM analyses, as the heat treatment layers were very similar between the two samples. Sample 2, water – black, shows pitting behavior at practically the same potential as sample 2, H3PO4 – red, which may be due to the irregularity on the surface of the heat-treated layer in H3PO4, with the rupture of the phosphorus-rich layer, revealing the inner layer, similar to scale formed in water.
4. CONCLUSIONS
The objective of this paper was to verify the influence of the H3PO4 quenching process on the anticorrosive performance of AISI 4340 steel. Therefore, its conclusions are shown below. Water quenching of AISI 4340 begins with the formation of a condensed cloud of vapor around the surface of the sample, which breaks to form bubbles. When quenching AISI 4340 in phosphoric acid, there is a rapid formation of a vapor layer that remains throughout the entire quenching process, due to the release of water and hydrogen in the form of gas. This increases the pH at the metal/solution interface, favoring the formation of PO43– and resulting in the formation of Fe2O3 and FePO4. In both quenching media, observing the images taken by optical microscope, there was the formation of martensite and a continuous corrosion product throughout the entire thickness of each sample, despite the vapor layer having remained during the cooling process in H3PO4. Regarding hardness measurements, greater variation was identified in the outermost part of the samples, which may be associated with the way the test was carried out, as there is the possibility that it was performed in a more external region, only measuring the corrosion product of the material. However, at a depth of 0.05 mm, the samples treated in phosphoric acid (2% concentration) showed higher hardness than those treated in water, which may be related to the layer of ferrous phosphate that would give greater stability to the product in relation to the corrosion formed. In the SEM analyses, it is possible to identify in the annealed samples the formation of scale containing hematite in their most superficial region, with a uniform appearance, followed by the formation of a mixed region of magnetite and wüstite. The annealed sample showed roughness inherent to the scale formed. Samples quenched in water had a layer greater than 50 µm, while those quenched in acid had lower thickness. This smaller layer, formed in acid, can be explained by the formation and maintenance of the vapor layer throughout the quenching process, as there is a more intense diffusion of oxygen in the medium, which is directly responsible for the formation of scale. In the water-quenched samples, cracks were formed, while in those quenched in acid there was peeling, which was associated with the layer being more porous and “brittle” than the one formed in water. This agrees with the fact that the acid quenching process does not have all the cooling steps. EDS analyses showed that phosphorus is incorporated into the outermost layer of scale during the quenching process in phosphoric acid and can be explained by the mechanism of migration of oxygen and phosphorus to form the oxide. In the potentiodynamic polarization analyses, a difference in corrosion potential of less than 100 mV was identified among all samples tested, which was attributed to the presence of Fe as the majority element present in all samples. The acid-quenched samples showed the lowest and highest corrosion current density, which was associated with layer peeling. Those treated in water showed very similar corrosion current densities, which can be explained by the formation of a more homogeneous heat-treated layer than in acid. With that said, it is possible to state that the samples quenched in H3PO4 were successfully treated, and achieved satisfactory results. During the process, phosphorus was deposited on the samples, which is the corrosion inhibitor element used in the phosphating process. However, polarization analysis practically did not demonstrate a significant improvement in corrosion resistance. For future studies, it was found that some improvements could be included, such as annealing being carried out in a controlled atmosphere, to avoid the formation of scale during the first stage. Researchers should increase the number of samples treated and add electrochemical tests, such as mass loss and EIS (electrochemical impedance spectroscopy), to obtain more information about quenching in H3PO4 in relation to corrosion protection.
5. ACKNOWLEDGMENTS
This work was carried out with the support of CNPq, a Brazilian government entity focused on training human resources. The authors also thank the financial support of Brazilian agencies: CAPES, FAPERGS and FINEP.
6. BIBLIOGRAPHY
- [1] INSTITUTO AÇO BRASIL, Mercado brasileiro do aço: Análise Setorial e Regional 2023, Rio de Janeiro, Instituto Aço Brasil, 2023.
-
[2] PANDA, A., DAS, S.R., DHUPAL, D., “Experimental investigation, modelling and optimization in hard turning of high strength low alloy steel (AISI 4340)”, Matériaux Tech, v. 106, n. 4, pp. 404, 2018. doi: http://doi.org/10.1051/mattech/2018054.
» https://doi.org/10.1051/mattech/2018054 -
[3] SANRUTSADAKORN, A., UTHAISANGSUK, V., SURANUNTCHAI, S., et al, “Investigation of hot deformation characteristics of AISI 4340 steel using processing map”, Advanced Materials Research, v. 683, pp. 301–306, 2013. doi: http://doi.org/10.4028/www.scientific.net/AMR.683.301.
» https://doi.org/10.4028/www.scientific.net/AMR.683.301 -
[4] KIM, K., JUNG, M., LEE, S.J., “Hot deformation behavior of AISI 4340 using constitutive model and processing map”, J Korean Soc Heat Treatment, v. 30, n. 5, pp. 187–196, 2017. doi: http://doi.org/10.4028/www.scientific.net/AMR.683.301.
» https://doi.org/10.4028/www.scientific.net/AMR.683.301 - [5] ABDALLA, A.J., ANAZAWA, R.M., HASHIMOTO, T.M., et al, “Caracterização microestrutural dos aços multifásicos por microscopia óptica com a utilização de diferentes ataques químicos”, In: 18° CBECiMat – Congresso Brasileiro de Engenharia e Ciência dos Materiais, Porto de Galinhas, PE, 2008.
-
[6] ŁUKASZEK-SOŁEK, A., KRAWCZYK, J., ŚLEBODA, T., et al, “Optimization of the hot forging parameters for 4340 steel by processing maps”, Journal of Materials Research and Technology, v. 8, n. 3, pp. 3281–3290, 2019. doi: http://doi.org/10.1016/j.jmrt.2019.05.018.
» https://doi.org/10.1016/j.jmrt.2019.05.018 -
[7] PARK, J., KIM, Y., SHIN, S., et al, “Characterization of hot workability in AISI 4340 based on a 3D processing map”, Metals, v. 12, n. 11, pp. 1946, 2022. doi: http://doi.org/10.3390/met12111946.
» https://doi.org/10.3390/met12111946 -
[8] GANDRA, J., PEREIRA, D., PAMIES-TEIXEIRA, J., et al, “Wear behaviour of steel coatings produced by friction surfacing”, Journal of Materials Processing Technology, v. 214, n. 12, pp. 2858–2868, 2014. doi: http://doi.org/10.1016/j.jmatprotec.2014.06.003.
» https://doi.org/10.1016/j.jmatprotec.2014.06.003 -
[9] KIM, J.H., KIM, S., SEO, Y.H., et al, “Acoustic emission analysis for monitoring tribological behaviors of steel coated with zinc phosphate/stearate for cold forging”, Tribology International, v. 196, pp. 109641, 2024. doi: http://doi.org/10.1016/j.triboint.2024.109641.
» https://doi.org/10.1016/j.triboint.2024.109641 -
[10] TOMAZ, Í.D.V., MARTINS, M.C., COSTA, H.R.M., et al, “Influence of residual stress on the sliding wear of AISI 4340 steel”, Matéria (Rio de Janeiro), v. 25, n. 2, pp. e12618, 2020. doi: http://doi.org/10.1590/s1517-707620200002.1018.
» https://doi.org/10.1590/s1517-707620200002.1018 -
[11] OLIVEIRA, R.C.L.M.D., BIEHL, L.V., MEDEIROS, J.L.B., et al, “Análise comparativa entre a têmpera e partição versus a têmpera e revenimento para o aço SAE 4340”, Matéria (Rio de Janeiro), v. 24, n. 3, pp. e12472, 2019. doi: http://doi.org/10.1590/s1517-707620190003.0788.
» https://doi.org/10.1590/s1517-707620190003.0788 -
[12] RAMOS, R.M., KUNST, S.R., SOARES, L.G., et al, “A comparison between the titanium-based and the zinc phosphate dispersion conditionings of zinc phosphate baths”, Matéria (Rio de Janeiro), v. 29, n. 2, pp. e20240070, 2024. doi: http://doi.org/10.1590/1517-7076-rmat-2024-0070.
» https://doi.org/10.1590/1517-7076-rmat-2024-0070 - [13] COLPAERT, H., Metalografia dos produtos siderúrgicos comuns, 4. ed., São Paulo, Editora Edgard Bluvher, 2008.
-
[14] PINEDO, C.E., Tratamentos térmicos e superficiais dos aços, 5. ed., São Paulo, Blucher, 2021. doi: http://doi.org/10.5151/9786555062243.
» https://doi.org/10.5151/9786555062243 -
[15] ZORDÃO, L.H.P., OLIVEIRA, V.A., TOTTEN, G., et al, “Quenching power of aqueous salt solution”, International Journal of Heat and Mass Transfer, v. 253, pp. 807–8018, 2019. doi: http://doi.org/10.1016/j.ijheatmasstransfer.2019.06.036.
» https://doi.org/10.1016/j.ijheatmasstransfer.2019.06.036 -
[16] HSU, S.H., HO, Y.H., HO, M.X., et al, “On the formation of vapor film during quenching in de-ionized water and elimination of film boiling during quenching in natural sea water”, International Journal of Heat and Mass Transfer, v. 86, pp. 65–71, 2015. doi: http://doi.org/10.1016/j.ijheatmasstransfer.2015.02.049.
» https://doi.org/10.1016/j.ijheatmasstransfer.2015.02.049 -
[17] JIANG, C., CHENG, X., “Anti-corrosion zinc phosphate coating on building steel via a facile one-step brushing method”, Electrochemistry Communications, v. 109, pp. 106596, 2019. doi: http://doi.org/10.1016/j.elecom.2019.106596.
» https://doi.org/10.1016/j.elecom.2019.106596 - [18] CHIAVERINI, V., Aços e ferros fundidos, 7. ed. São Paulo, ABM, 2015.
-
[19] EL RAYES, M.M., EL-DANAF, E.A., ALMAJID, A.A., “Characterization and correlation of mechanical, microstructural and ultrasonic properties of power plant steel”, Materials Characterization, v. 100, pp. 120–134, 2015. doi: http://doi.org/10.1016/j.matchar.2014.11.034.
» https://doi.org/10.1016/j.matchar.2014.11.034 - [20] COSTA, A.L.V., MEI, P.R., Aços e Ligas especiais, 4. ed., São Paulo, Blucher, 2021.
-
[21] SAEIDI, N., EKRAMI, A., “Comparison of mechanical properties of martensite/ferrite and bainite/ferrite dual phase 4340 steels”, Materials Science and Engineering A, v. 523, n. 1, pp. 125–129, 2009. doi: http://doi.org/10.1016/j.msea.2009.06.057.
» https://doi.org/10.1016/j.msea.2009.06.057 - [22] GENTIL, V., Corrosão, 6. ed. Rio de Janeiro, LTC, 2011.
-
[23] CUNHA, D.S., “Desenvolvimento de fio máquina para a fabricação de arames para soldagem MIG com características adequadas ao processo de descarepação mecânica”, M.Sc. Thesis, Universidade Federal de Minas Gerais, Belo Hortizonte, 2007. https://repositorio.ufmg.br/bitstream/1843/BUOS-8DRJQ8/1/1022m.pdf, accessed in January, 2024.
» https://repositorio.ufmg.br/bitstream/1843/BUOS-8DRJQ8/1/1022m.pdf -
[24] HAZAN, E., SADIA, Y., GELBSTEIN, Y., “Characterization of AISI 4340 corrosion products using Raman spectroscopy”, Corrosion Science, v. 74, n. 1, pp. 414–418, 2013. doi: http://doi.org/10.1016/j.corsci.2013.05.002.
» https://doi.org/10.1016/j.corsci.2013.05.002 -
[25] BIROSCA, S., DINGLEY, D., HIGGINSON, R.L., “Microstructural and microtextural characterization of oxide scale on steel using electron backscatter diffraction”, Journal of Microscopy, v. 213, n. 3, pp. 235–240, 2004. doi: http://doi.org/10.1111/j.0022-2720.2004.01320.x. PubMed PMID: 15009690.
» https://doi.org/10.1111/j.0022-2720.2004.01320.x -
[26] KOWALSKI, D., KIMB, D., SCHMUKI, P., “TiO2 nanotubes, nanochannels and mesosponge: self-organized formation and applications”, Nano Today, v. 8, n. 1, pp. 235–264, 2013. doi: http://doi.org/10.1016/j.nantod.2013.04.010.
» https://doi.org/10.1016/j.nantod.2013.04.010