 Simulating beef herd dynamics across production intensities: a stochastic model for the Brazilian Cerrado
ABSTRACT:
Beef production benefits significantly from research aimed at enhancing profitability and productivity, with simulation providing a means to achieve faster results and reduced costs. This paper outlines the development and validation of simulation models for full-cycle production, specifically designed to assess production systems within the Cerrado biome of Brazil. Using published data, models were created for six production systems: one modal system (MS), characterized by less intensive practices – such as first calving at four years and slaughter at 48 months, accompanied by higher mortality – and five improved breeding systems (IBSs) that implement progressively intensive practices. Enhancements included various feed strategies, culminating in a system that enables slaughter at 19 months of age. The models were constructed utilizing the R software scripts that incorporated a Leslie matrix to represent an age-structured model with probabilities of producing female calves and survival rates, facilitating stochastic simulation predictions. The results were evaluated through correlation and regression analyses. Key simulated variables in these models included counting variables, such as the total number of herd animals, harvest steers, and cull cows, as well as weight variables for harvest heifers, harvest steers, and mature cows. The analysis revealed a robust and positive correlation (ranging from 0.93 to 0.99) (p < 0.01), providing evidence that our results accurately replicate all evaluated systems. We employed regression analyses to compare the observed data with the simulations. The significant linear regression for all the evaluated variables (p < 0.01) and the high determination coefficients suggest that the variables can indeed be predicted through simulation. This study illustrates that simulation models may serve to forecast cattle production across diverse systems, holding promise for application in the Brazilian Cerrado and beyond.
Keywords:
evolution herd; modeling; stochastic; validation
Introduction
Evaluations of beef cattle production systems in Brazil seek to enhance productivity, optimize resource utilization, and safeguard the environment (Pang et al., 1999; Cardoso et al., 2020; Stabile et al., 2020). Improving production in developing countries is crucial, especially considering the forecasted 17 % increase in beef demand globally by 2027 (OECD, 2018). In the Cerrado biome in Brazil, most beef cattle are raised and managed within extensive systems (Corrêa et al., 2006). To increase production levels, it is crucial to comprehensively address aspects of health, nutrition, management, and genetics (Mwangi et al., 2019; Souza et al., 2022; Yokoo et al., 2019). Mathematical models serve as practical tools for analyzing production systems, providing cost savings compared to traditional biological systems (Tedeschi and Menendez, 2020).
Creating a model that accurately represents complex production systems, encompassing both extensive and intensive systems with minimal inputs or modifications, poses significant challenges. A beef production model aimed at stimulating growth and reproduction traits, as well as cow retention and culling, must consider factors such as genetics, environment, and feed resources (Denham and Spreen, 2019). Consequently, it has been proposed that incorporating more effects into a model will bring it closer to the real system (Pang et al., 1999). However, while it is often assumed that the most comprehensive representation of the system yields the highest accuracy (MacNeil and Harris, 1988), this assumption is not universally accepted (Forrester, 1961).
The mathematical models utilized to simulate livestock-related data can be classified as deterministic or stochastic, and they address both continuous and discrete phenomena. By employing fixed or random variables, it is possible to evaluate the extent of missing data and compare the development of deterministic and stochastic models (Pouillot et al., 2004). The stochastic model provides a more detailed representation of the studied process by incorporating elements of randomness (Leslie, 1945; Leslie, 1948).
The objective of this study was to simulate beef production systems using a dynamic and stochastic approach to better understand their performance under various management scenarios. We compared the simulation results with observations from actual beef cattle farms (Corrêa et al., 2006) to assess the model's accuracy. Subsequently, we analyzed management systems at varying intensity levels for beef production in the Cerrado biome of Mato Grosso do Sul, Brazil.
Material and methods
Study site
The study focused on the beef cattle production systems of Mato Grosso do Sul State (20°45’00" S, 54°30’00" W, altitude 349 m), located in the Midwest region of Brazil, which covers an area of 358,147,995 km2. The majority of the state is classified as having a tropical climate, featuring a wet and warm season from October to March, followed by a dry and cooler season from April to September. The predominant biome is the Cerrado, characterized by an average annual rainfall of 1250-1500 mm, alongside a spring rainy season, a dry winter, and an average annual temperature of 22 °C.
Reference data (base populations and assumptions)
The input parameters of this study were derived from typical beef cattle production conditions in Mato Grosso do Sul, as outlined by Corrêa et al. (2006). The systems and parameters utilized in this simulation are detailed in Tables 1 and 2. This study modeled six distinct scenarios, based on the work of Corrêa et al. (2006), which encompassed both extensive and intensive systems over a complete production cycle. This process confirmed that the model generated results consistent with the underlying data.
The first system designed was a modal system (MS), which wasthe most extensive. In this system, cows began calving at four years of age, with a yearling mortality rate of 6 %, a mortality rate of 2 % in other categories, and slaughter at 48 months of age. The second system introduced was the first improved breeding system (IBS1), characterized by a reduced first-calving age of three years, a yearling mortality rate of 3 %, a mortality rate of 1 % in other categories, and an age at slaughter of 39 months, in contrast to MS. The third system (IBS2) was similar to IBS1 but featured an even lower age at slaughter of 35 months, as these animals benefited from pasture alongside feed supplementation during the third dry season. The fourth system (IBS3) showed similarities with IBS1 and IBS2; however, the animals in IBS3 were slaughtered at 31 months because they received protein supplementation during the first and second dry seasons, in addition to feed supplementation throughout the rainy season. The fifth system (IBS4) also shared characteristics with IBS1, IBS2, and IBS3, yet allowed for slaughter at just 23 months of age by providing feed supplementation during the first dry season and utilizing a feedlot in the second dry season. Finally, the sixth system (IBS5) represented the most intensive approach, with animals being slaughtered at 19 months of age. This was made possible through a specialized nutrition plan that included creep-feeding prior to weaning and continued feedlotting during both dry and rainy seasons until termination. The rates of natality (80 %), mortality at yearling (3 %), and mortality in other categories (1 %), as well as the age at first calving (3 years), were consistent across IBS1, IBS2, IBS3, and IBS4, demonstrating improvement compared to the MS system, as summarized in Table 1.
Simulation
In this simulation study, a mathematical model was developed to simulate a range of beef cattle production scenarios through dynamic and stochastic simulation, implemented in the R software environment version 4.1.2. For this purpose, a script was created to gather and organize comprehensive information regarding the composition of a cattle herd. This tool allows users to update input values as new data emerges, enabling the generation of updated scenarios in real time.
The first parameter considered when developing the script is the relative carrying capacity of the cattle herd. This parameter is crucial because it determines the sustainable size of the herd relative to the available resources. The relative carrying capacity was estimated using Eq. (1) as proposed by Anderson et al. (1983):
where TDN is the total digestible nutrients, CW is the cow weight, and MP is the milk production.
The subsequent step entailed integrating the nutritional information for each system. The feed-related parameters were estimated based on natural pastures of Mato Grosso do Sul across all six systems. Additionally, the integrated beef systems (IBSs) received feed and protein supplementation to meet the animals' nutritional requirements (Table 2).
Leslie matrix models were employed to project a population and provide a more realistic representation of the herd, incorporating survival rates for different age classes, population growth predictions, and parameter estimates across various scenarios. The matrix elements included age-specific survival rates on the diagonal and age-specific probabilities of producing female calves in the top row. We utilized a 14 × 14 Leslie matrix to simulate data for MS and 10 × 10 Leslie matrixes for the IBSs.
A total of 500 reproductive cycles was conducted as a burn-in period, using values representative of beef cattle herds. The cycles were executed to achieve equilibrium in the herd's age distribution, which provided data on the numbers of cows, cull-for-age cows, and calves stratified by the age of their dams, as well as replacement heifers. The calculations for harvest cull cows, heifers, and steers were performed using Choleski decomposition, which factorizes a real symmetric positive-definite square matrix, along with a fundamental control flow construct to manage iteration conditions.
The total number of calves produced by each dam's age was calculated by multiplying the calf survival rate by the total reproduction rate. The number of harvest heifers was determined by the difference between the total heifers produced in their final year within the system and the replacement heifers. The figures for yearling steers and steers of other ages were obtained by applying the survival from calf to yearling rate to half of the calves produced. The count of replacement heifers was based on the reproduction rate corresponding to the animal's age at the time of production. Additionally, the number of harvest heifers was derived from the discrepancy between steers and replacement heifers.
The mature weight was estimated using the Brody model (Brody, 1945), which is designed to assess growth curves for cows over annual periods. In this model, the asymptotic (mature) value is determined by age and a growth curve parameter, calculated using Eq. (2):
where Wt is the animal weight at a given age (t), A is the asymptotic weight, b is a time scale parameter, e is the natural base logarithm, and k is the maturity index.
The weights of heifers and steers were estimated from weaning to slaughter. A standard multiplicative adjustment of 0.97 for heifers and 1.04 for steers was used to model their growth (Table 2).
Goodness of fit of the simulated model
The assessment of the goodness of fit of the simulated model was based on the degree of correlation between the simulation results and the observed data from Corrêa et al. (2006), which included growth rates and weight measurements. A Pearson's correlation test was employed to quantify the strength of relationships among variables, including total herd animals, harvest steers, cull cows, harvest heifer weights, harvest steer weights, and mature cow weights. Pearson's correlation coefficients (r) were calculated using the cor.test function within the R software environment, version 4.1.2. Graphical representations of the correlations were created using the ggplot function from the ggplot2 package in the same R software version. In all analyses, significance was determined at p ≤ 0.05.
A linear regression analysis was conducted to determine the slope for the observed versus simulated data, assessing the impact of variations in the independent variable (observed data) on the dependent variable (simulation data). The R software environment, version 4.1.2, was utilized to employ the lm and plot functions for identifying the linear regression models and generating graphs. Significance levels were set at p ≤ 0.05 for all analyses. The linear regression analysis was based on the following linear model, as presented in Eq. (3):
where y is the dependent variable, x is the independent variable, β0 is the intercept, β1 is the regression coefficient, and e is the random error component.
Results
Simulation
The model can be found on GitHub at the following link: https://github.com/Renatafh/herd-simulator.git.
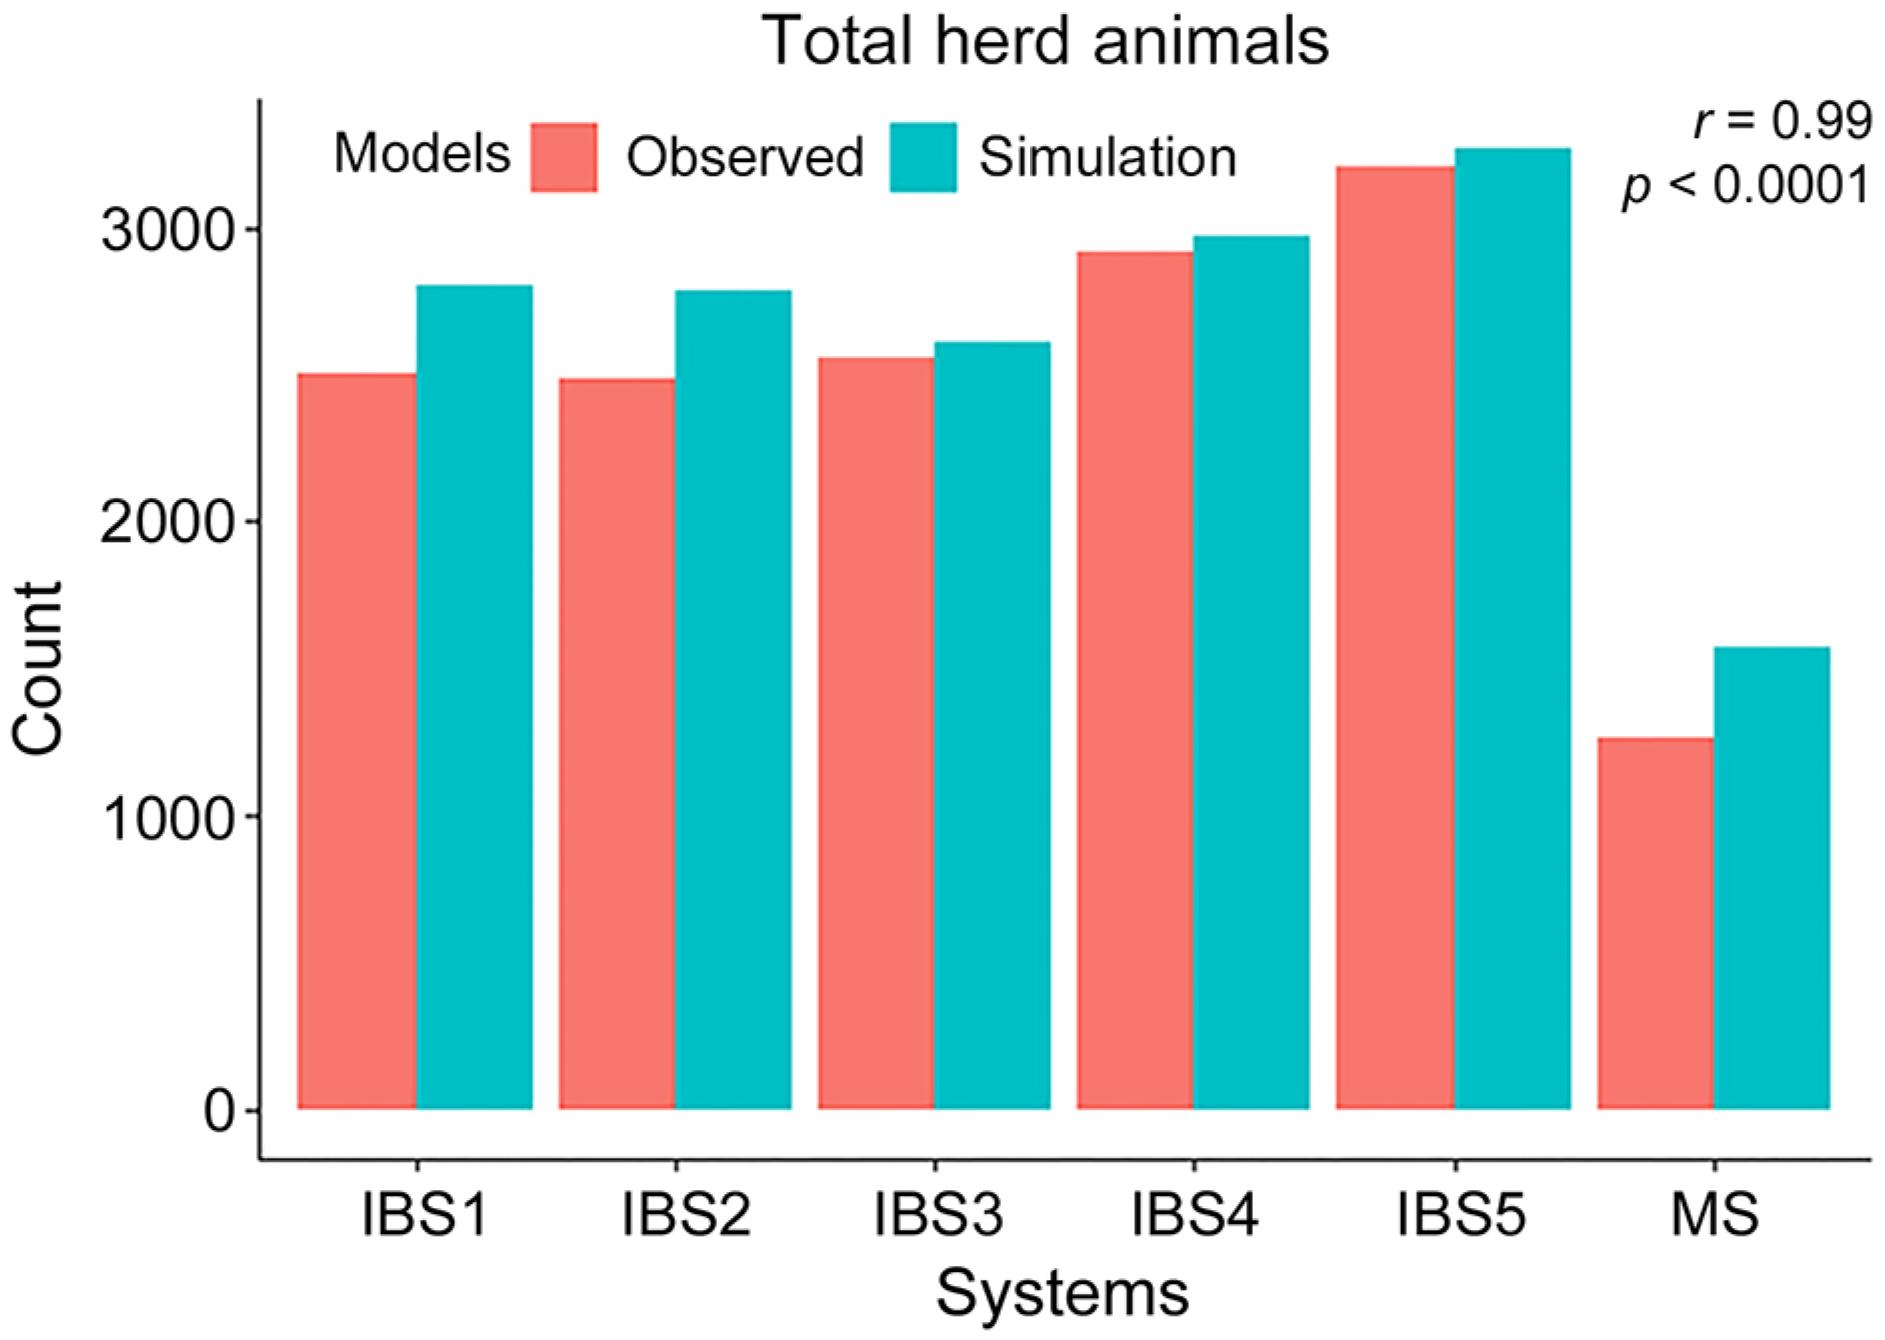
The Leslie matrix was constructed using age-specific survival rates placed on the diagonal and age-specific probabilities of producing female calves in the top row. The survival rates were derived from calf survival data, with the first rate adjusted according to the initial number of cows in the production system. The probability of producing female calves was determined based on fertility rates and the likelihood of producing heifers, calculated as 50 % of the total offspring, representing the female calves born to the cows. This Leslie matrix resulted in a stable population structure, with the reproductive values of each age class of females predicted from the cumulative effects of stochastic fluctuations over 500 breeding years in each simulation system. The number of animals generated within each category and by age is detailed in Table 3. The study revealed that the more intensive the production systems, the greater the number of animals per hectare. Specifically, IBS5 had the largest herd with 3,270 animals, while the modal system (MS) had 54 % fewer animals on the same land resource of 1,200 ha (Table 3). The populations observed in IBS1, IBS2, IB3, and IBS4 were 2,804, 2,784, 2,610, and 2,973 animals, respectively (Table 3).
Results of animal numbers for all six simulated herds based on data from Corrêa et al. (2006).
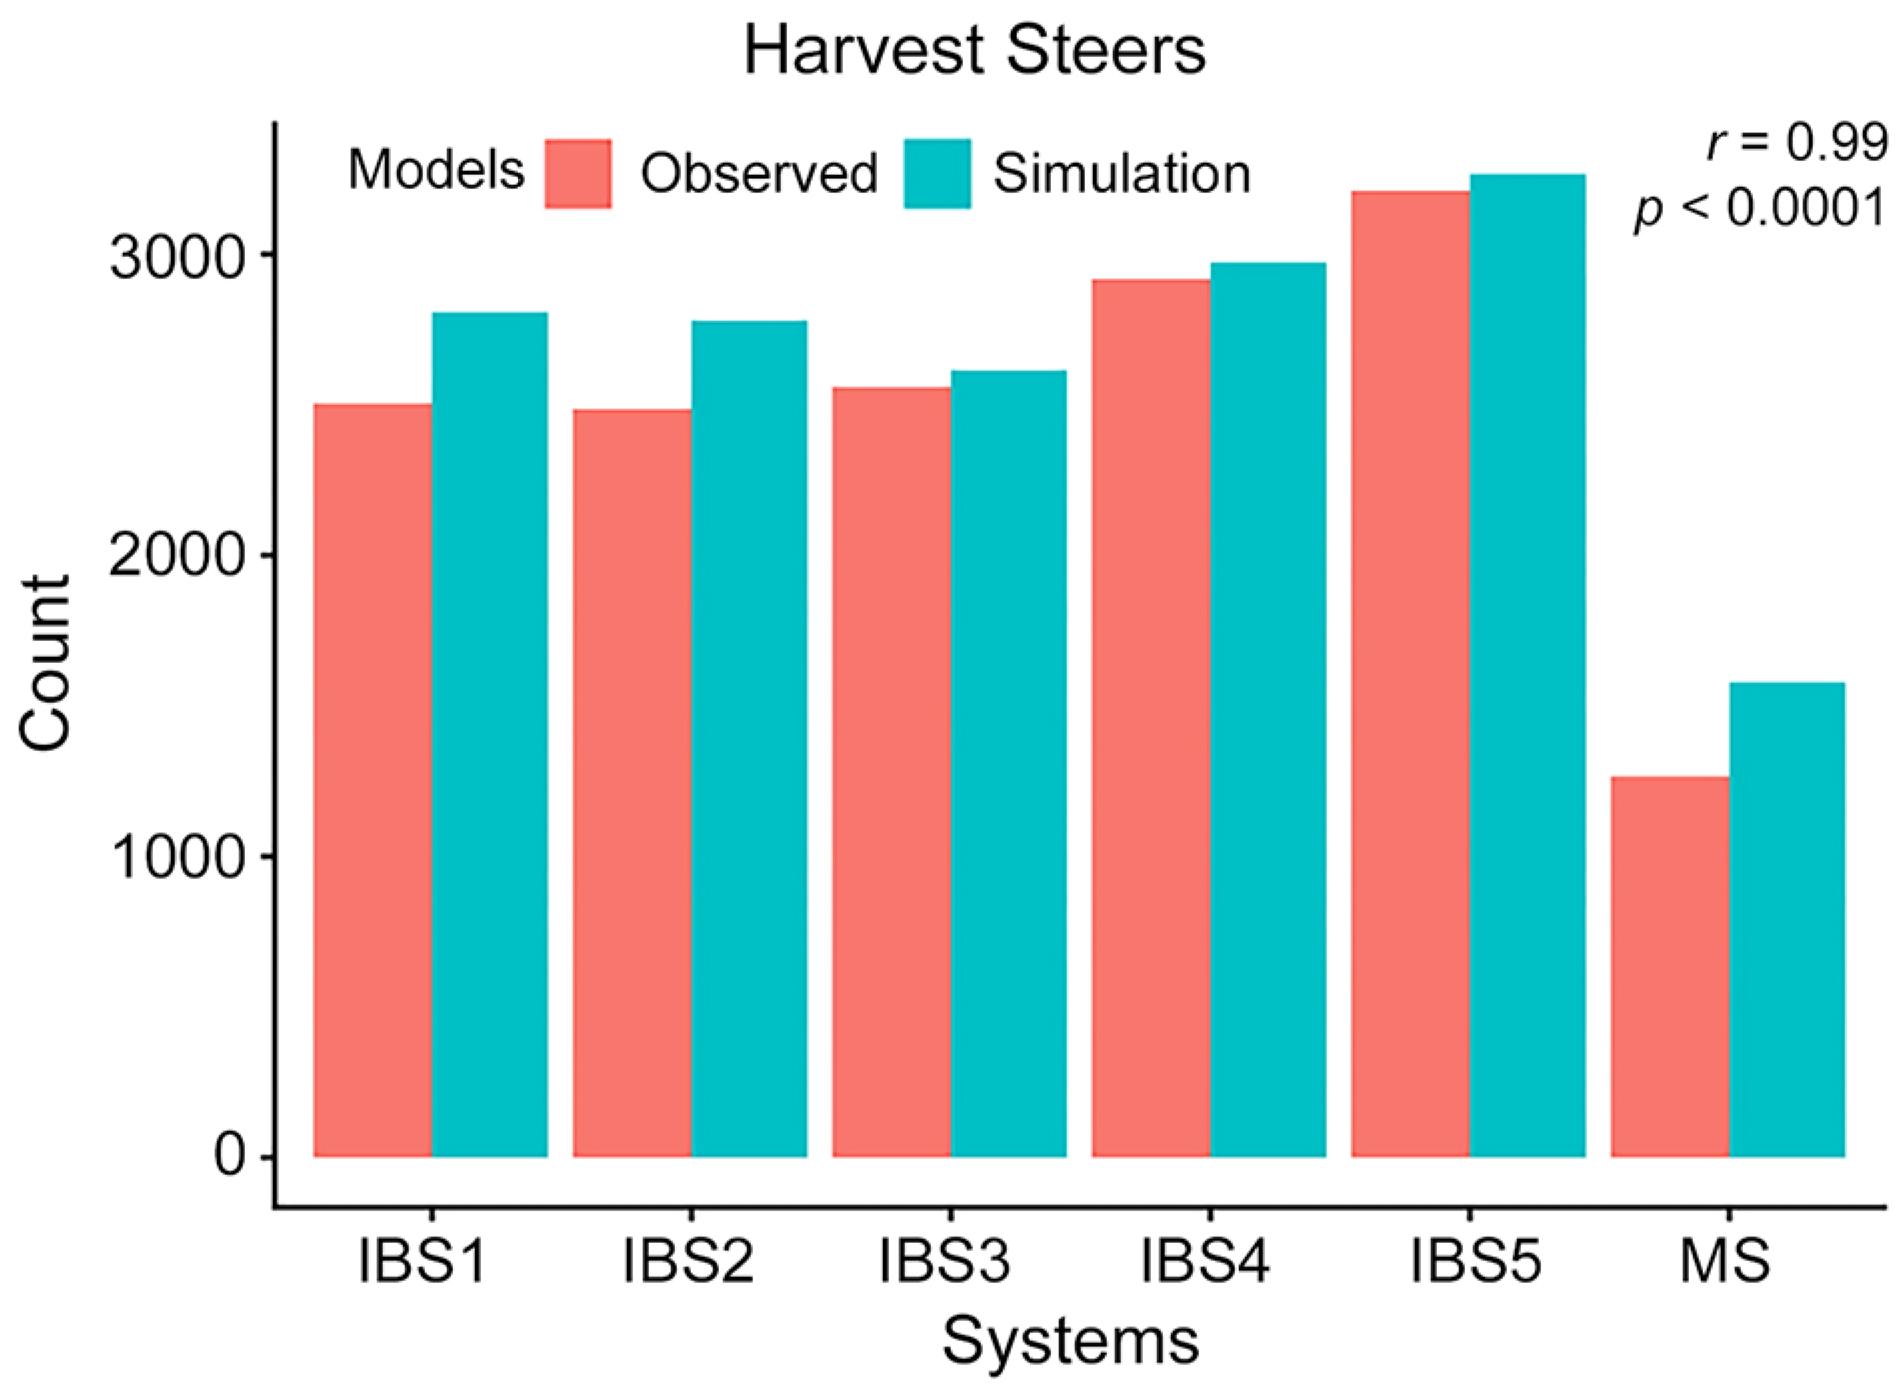
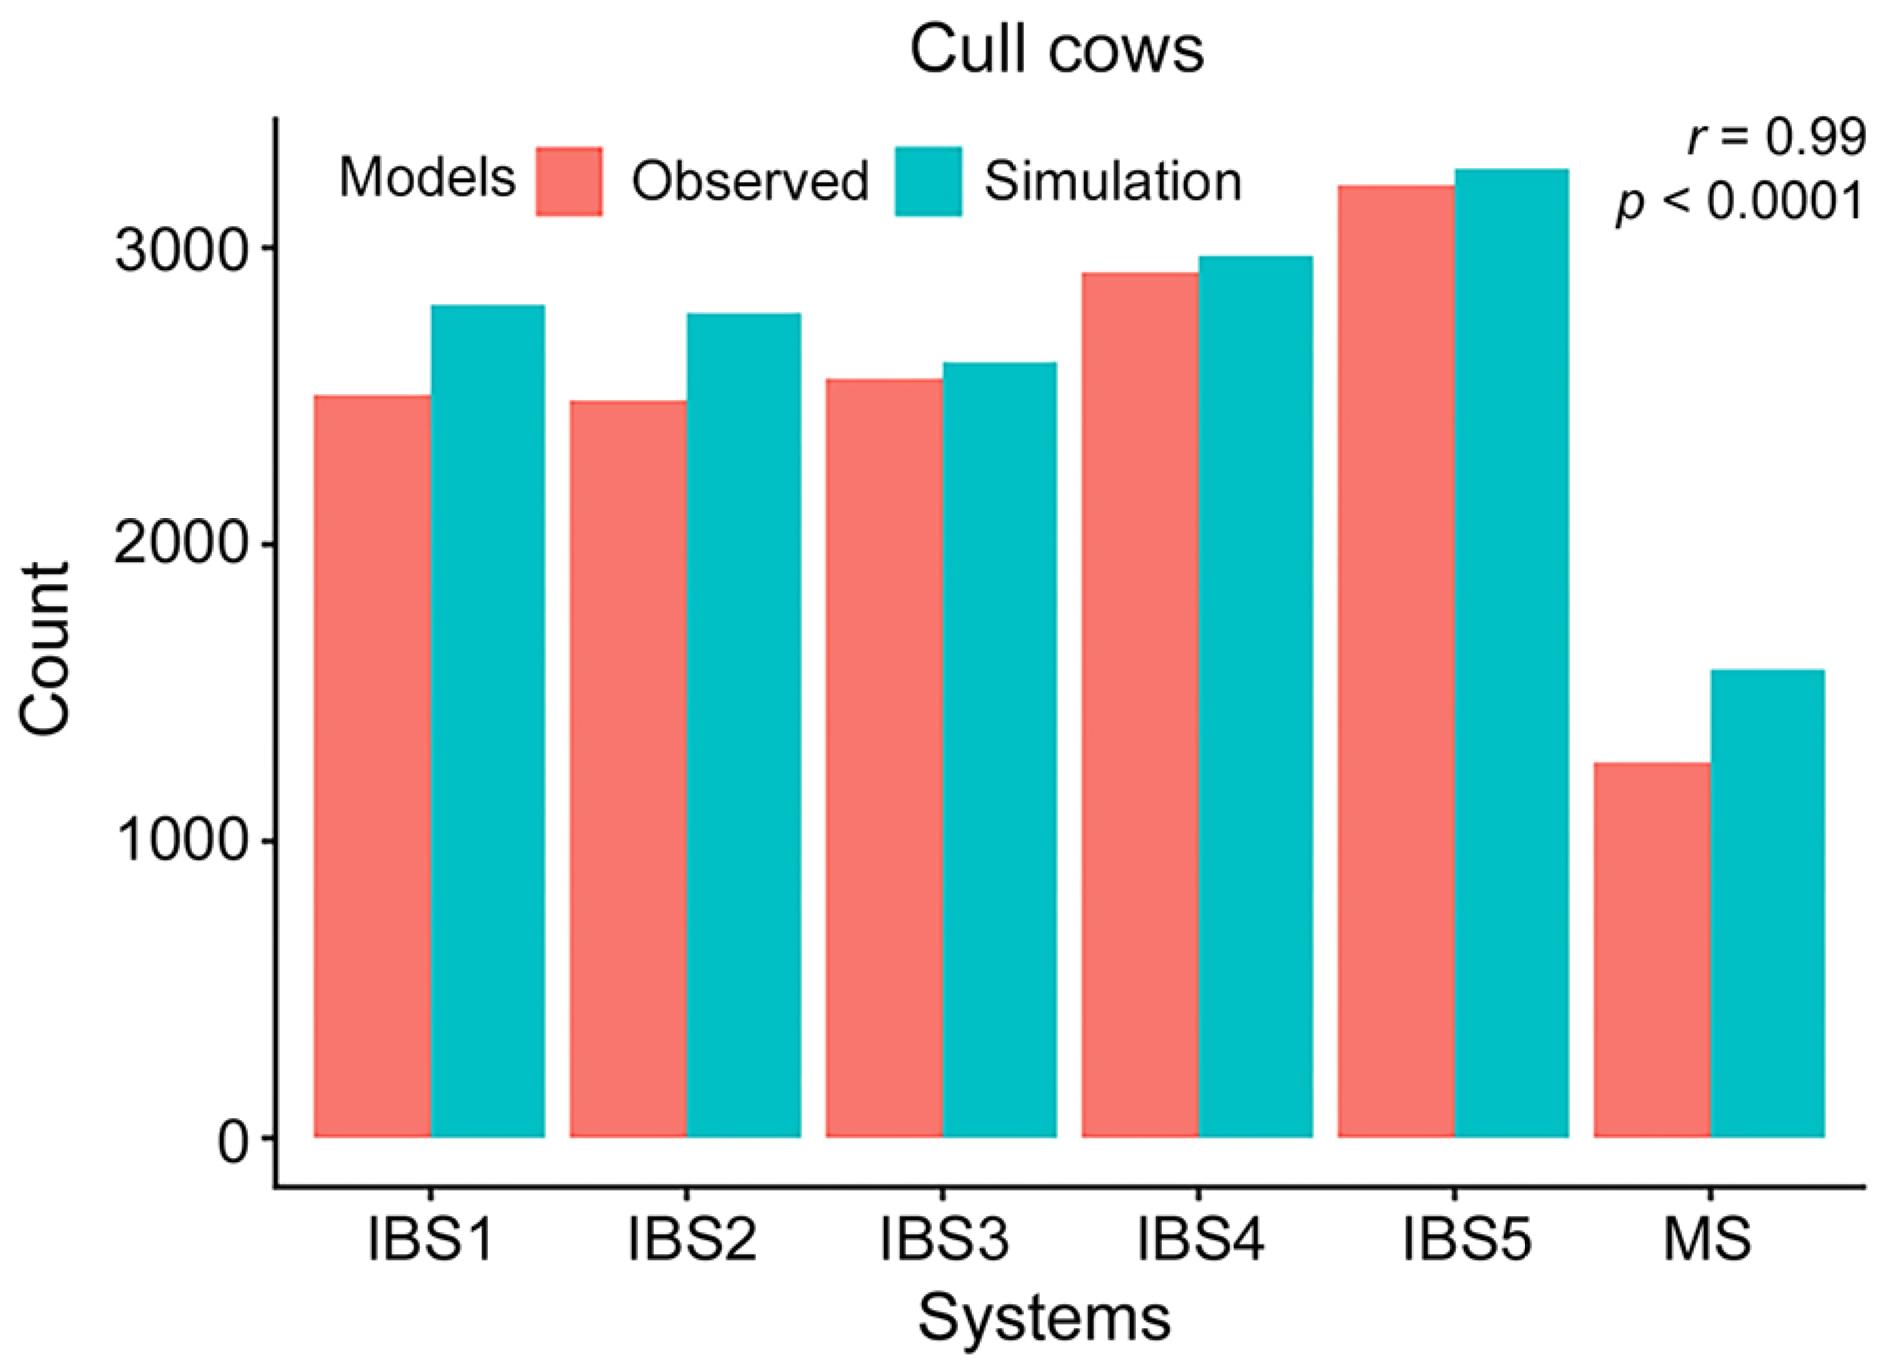
Data on the number of cows and traded animals were used as inputs, reflecting the values reported by Corrêa et al. (2006). The lowest count of surplus heifers was noted in MS (44 heifers), followed by IBS2 (155), IBS1 (162), IBS3 (182), IBS4 (209), and IBS5 (233) (Table 3). Similarly, the fewest harvest steers were observed in MS (114), followed by IBS2 (260), IBS1 (261), IBS3 (301), IBS4 (343), and IBS5 (377) (Table 3). In terms of replacement heifers, MS again exhibited the least number (68), followed by IBS1 (94), IBS2 (98), IBS3 (112), IBS4 (127), and IBS5 (135) (Table 3). For the cull cows category, MS also had the lowest number of animals (53), followed by IBS1 (97), IBS2 (99), IBS3 (114), IBS4 (129), and IBS5 (142) (Table 3).
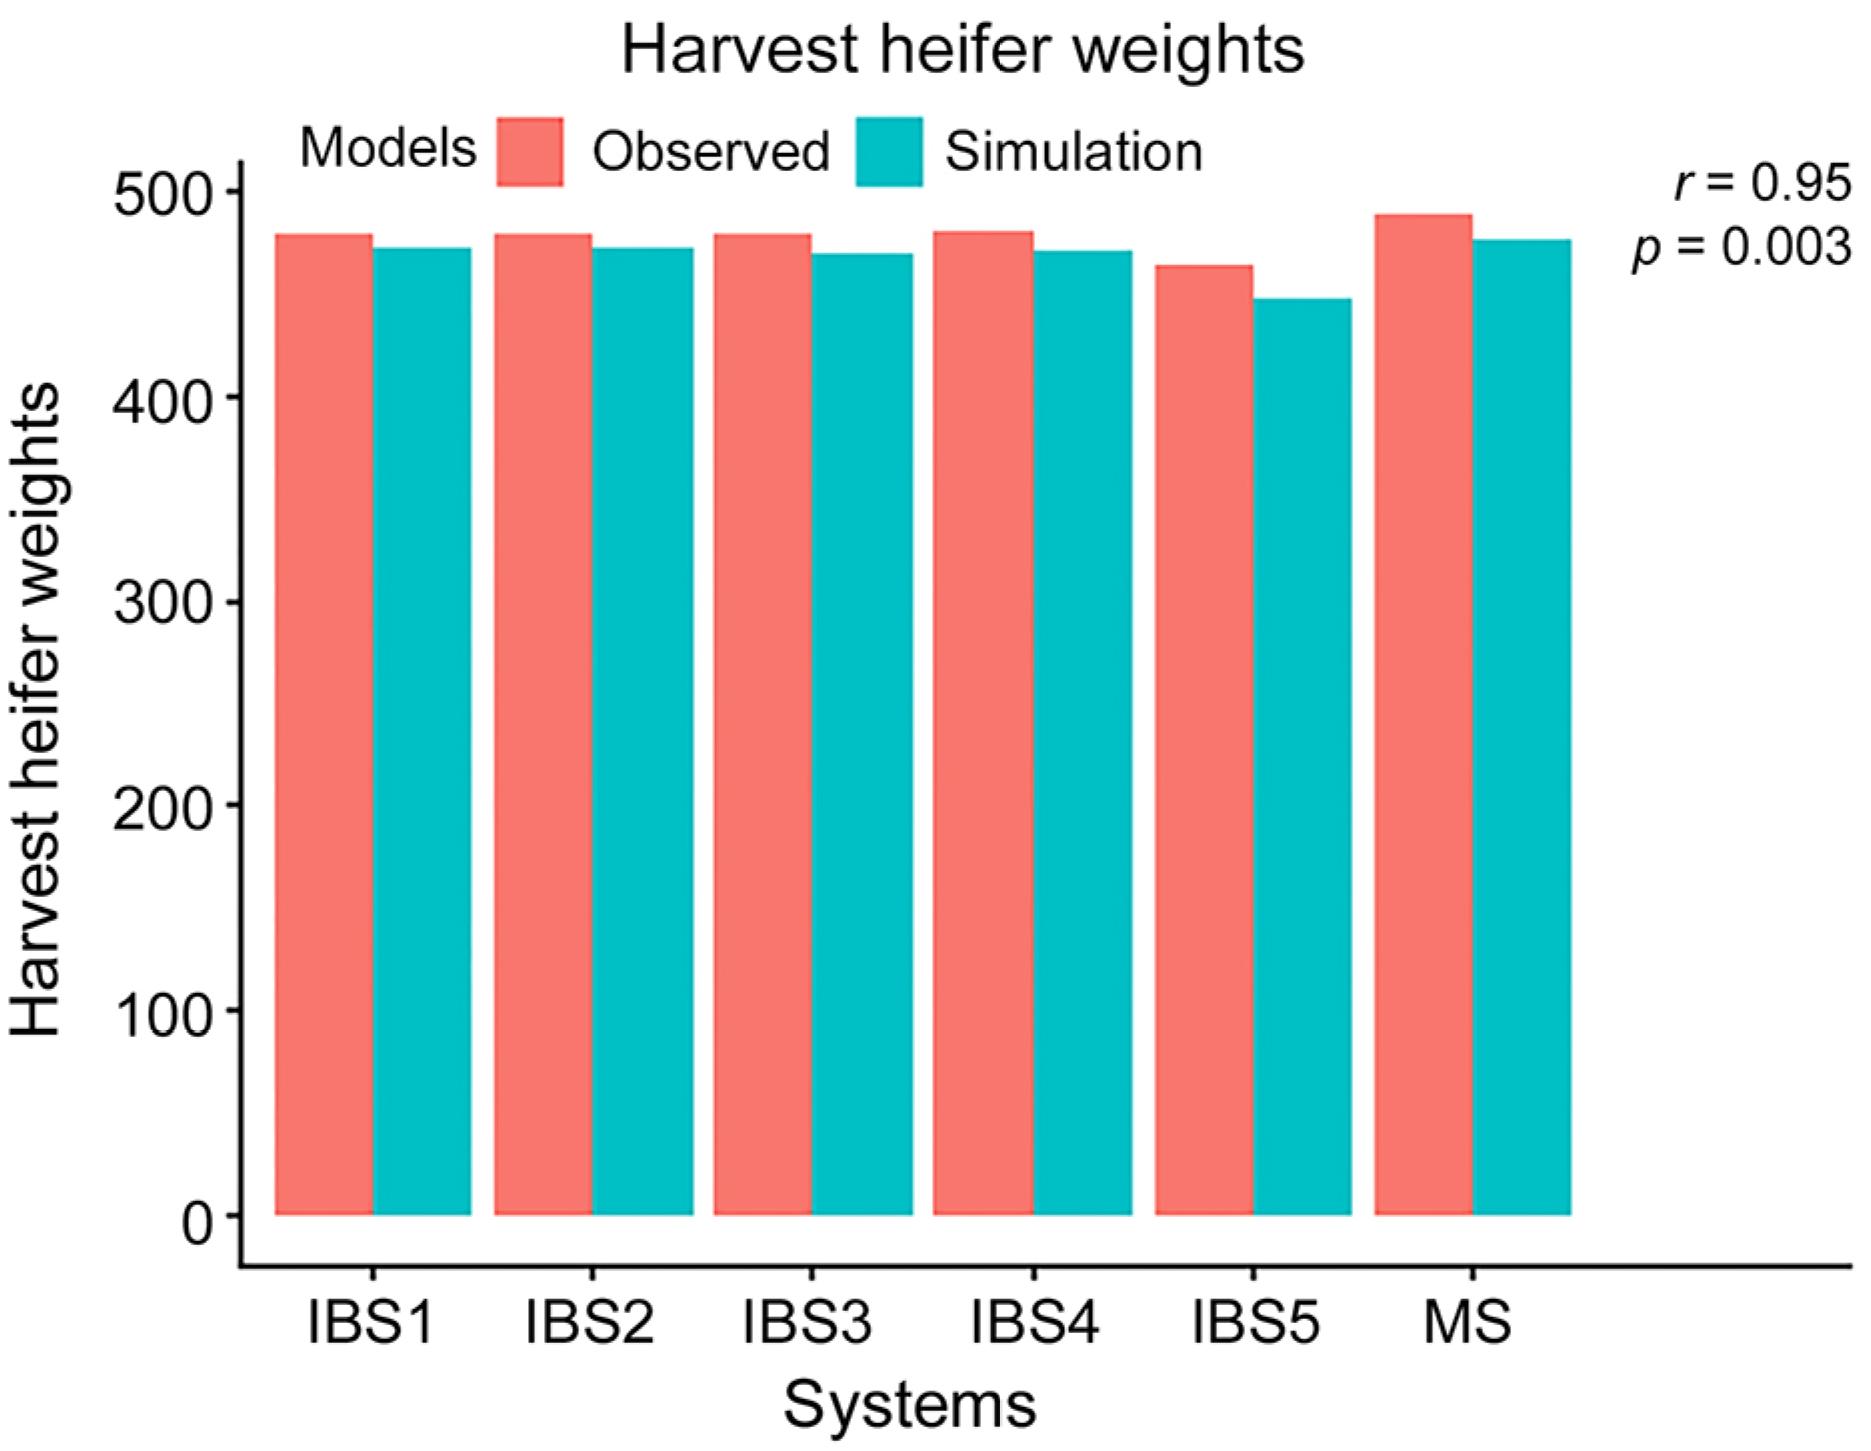
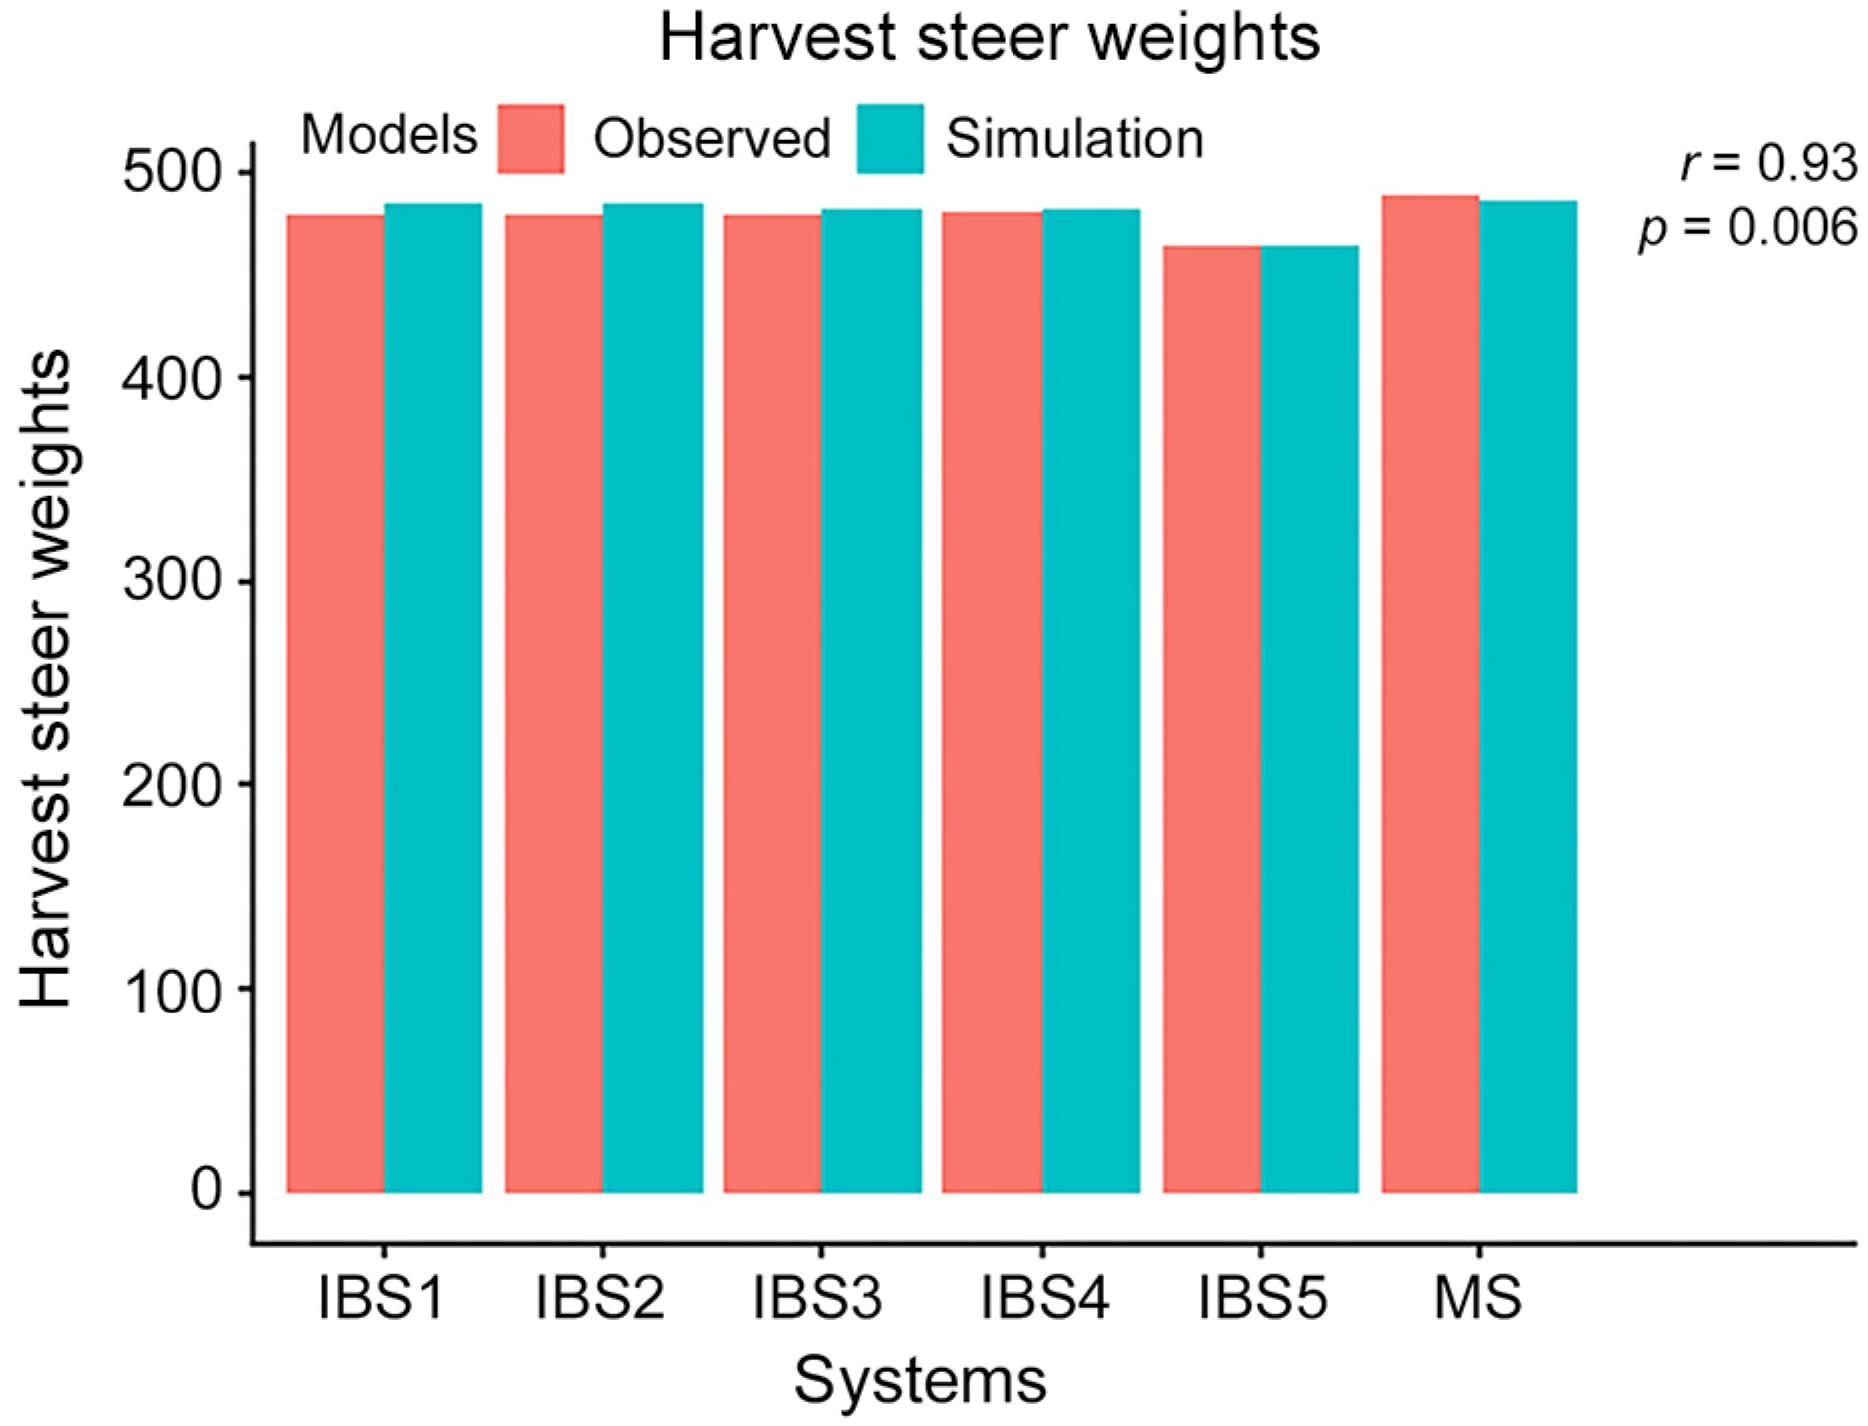
The simulated weights across different stages of beef cattle production development are detailed in Table 4. The slaughter and steers at weaning weights served as inputs for the simulated models, as reported by Corrêa et al. (2006). Among the simulated mature weights, IBS5 exhibited the lowest growth, reaching 445 kg, while IBS1, IBS2, IBS3, and IBS4 all recorded 460 kg. MS had the highest mature weight at 469 kg (Table 4). For the surplus heifer category, the simulated weights were 448 kg for IBS5, followed by 470 kg for IBS3, 471 kg for IBS4, and 473 kg for both IBS1 and IBS2, culminating in a maximum of 477 kg for MS (Table 4). Similarly, for harvest steers, IBS5 also recorded the lowest weight at 464 kg, whileIBS3, IBS4, IBS1, IBS2, and MS recorded weights of 482 kg, 483 kg, 485 kg, 485 kg, and 487 kg, respectively (Table 4).
Weight of animals per category (in kilogram), for all six simulated herds using data from Corrêa et al. (2006).
Goodness of fit of the simulated model
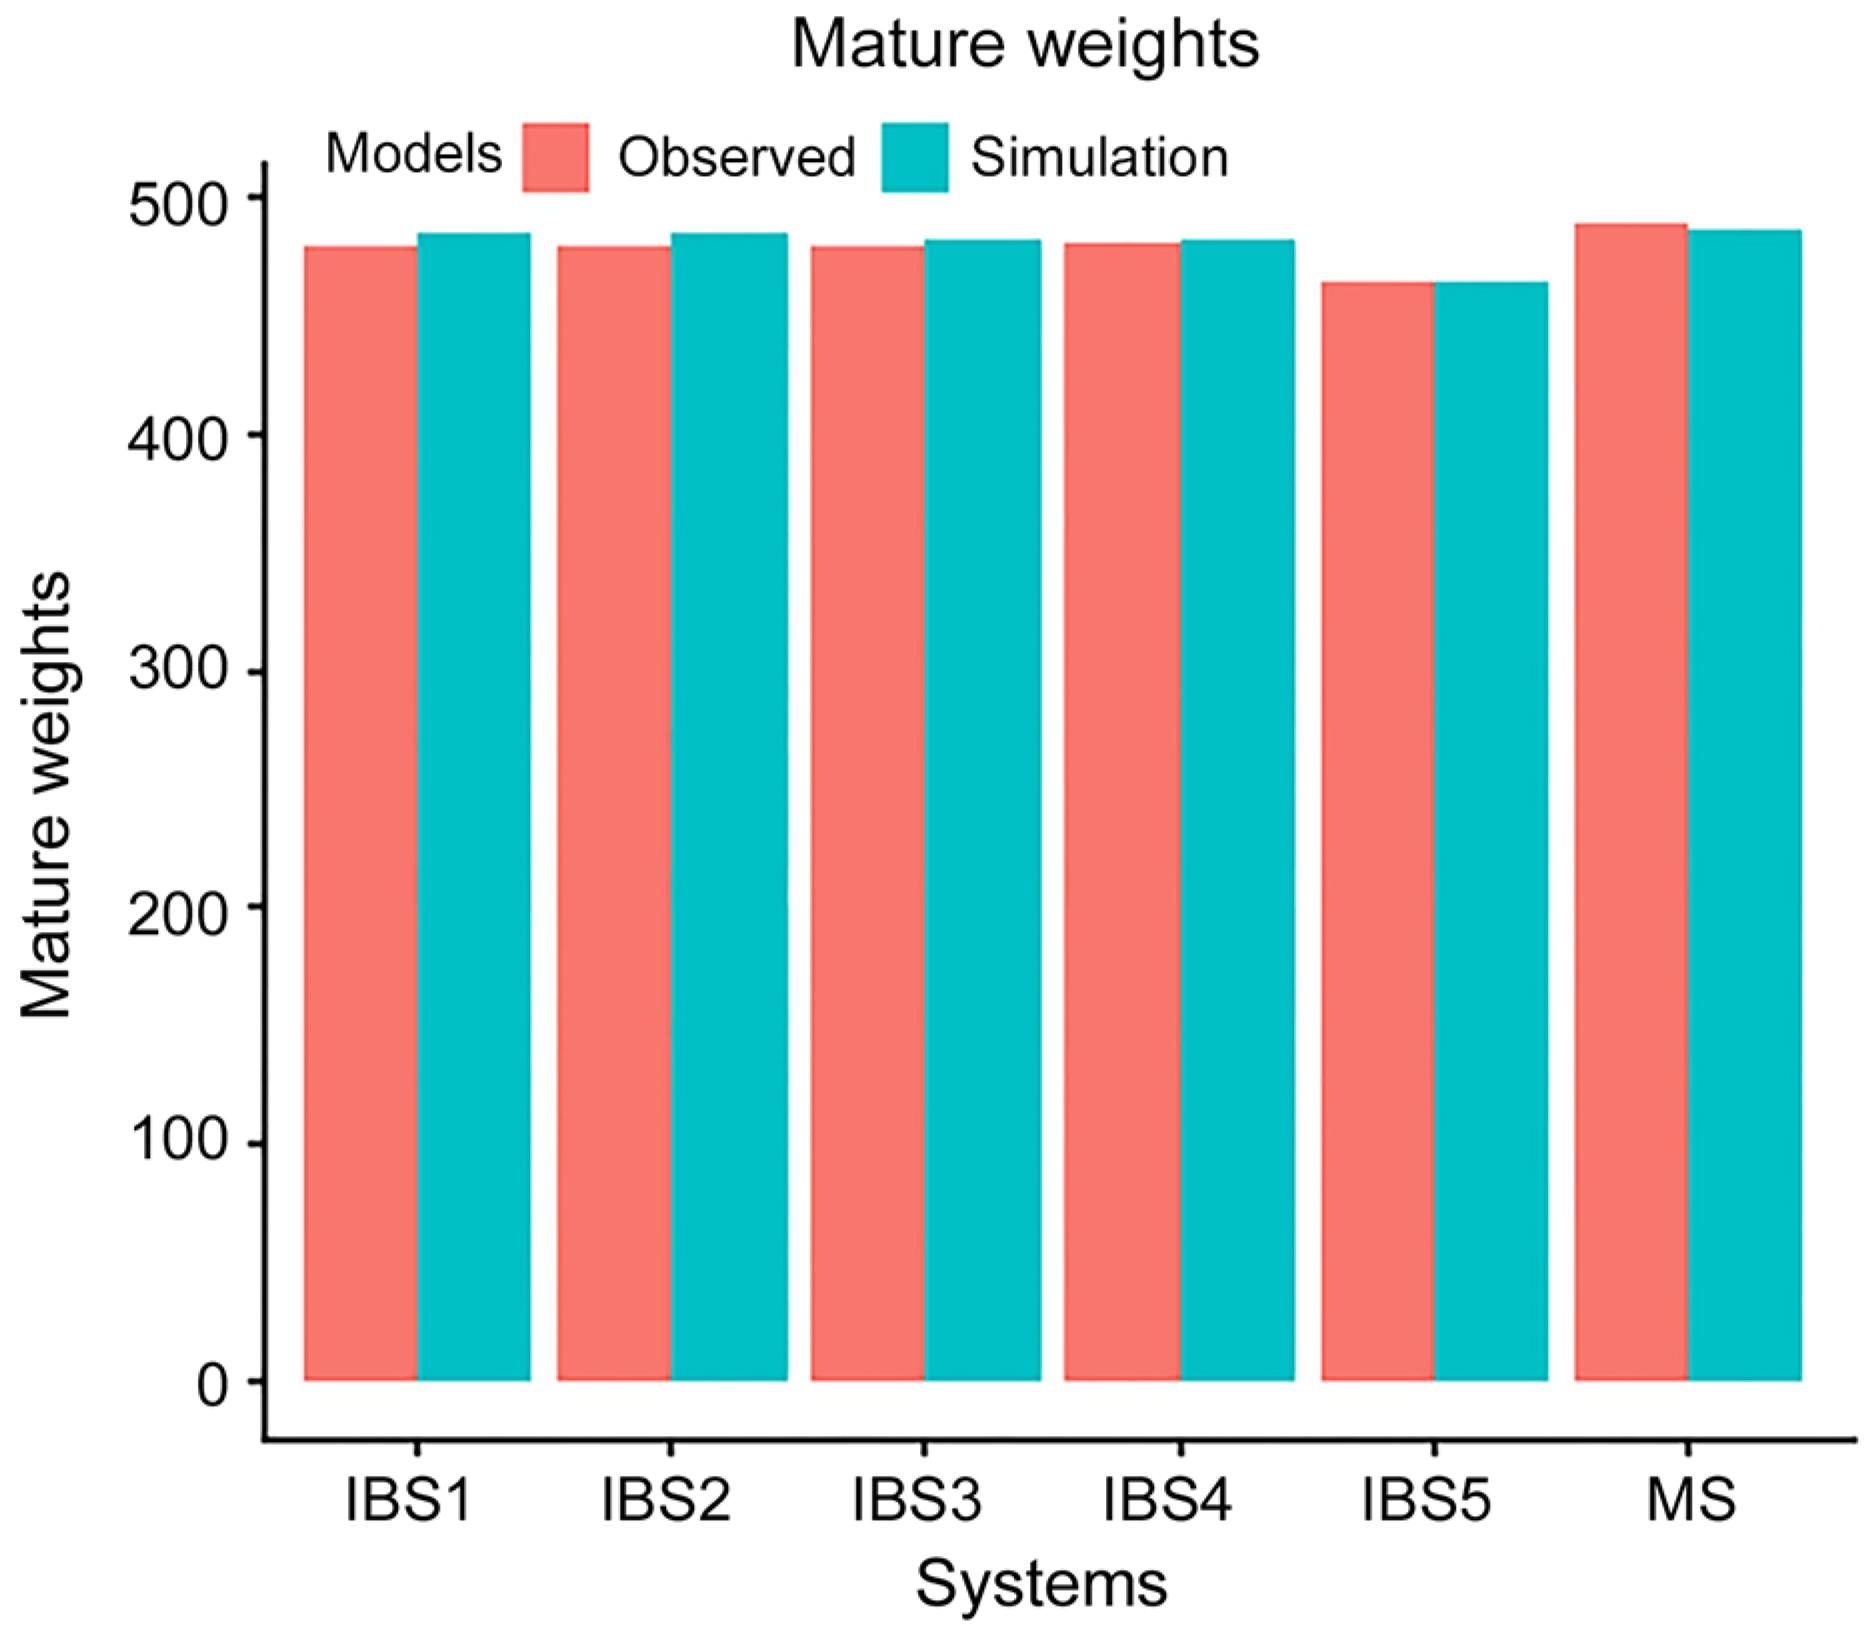
The correlation (r) between the predicted and observed values was consistently high and positive across all variables examined in this study. For the total number of animals in herd, the r-value was 0.98 (p < 0.01, Figure 1). Similarly, the r-value for the number of steers and cull cows reached 0.99 (p < 0.01, Figures 2 and 3). The r-values for heifer and steer weights were 0.95 (p < 0.01, Figure 4) and 0.93 (p < 0.01, Figure 5), respectively. Since the weights of mature cows remained identical across all six simulated systems (Figure 6), the standard deviation was zero, preventing the calculation of r.
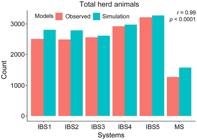
Number of total herd animals per system, considering the observed data from Corrêa et al. (2006) and the simulation data, for all six systems. IBS = improved breeding system; MS = modal system.
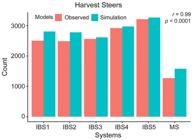
Number of harvest steers per system, considering the observed data from Corrêa et al. (2006) and the simulation data, for all six systems. IBS = improved breeding system; MS = modal system.
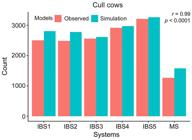
Number of cull cows per system, considering the observed data from Corrêa et al. (2006) and the simulation data, for all six systems. IBS = improved breeding system; MS = modal system.
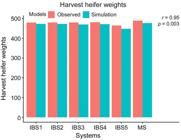
The harvest heifer weights per system, considering the observed data from Corrêa et al. (2006) and the simulation data, for all six systems. IBS = improved breeding system; MS = modal system.
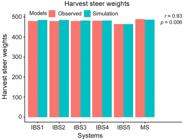
The harvest steer weights per system, considering the observed data from Corrêa et al. (2006) and the simulation data, for all six systems. IBS = improved breeding system; MS = modal system.
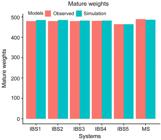
The mature weights per system, considering the observed data from Corrêa et al. (2006) and the simulation data, for all six systems. IBS = improved breeding system; MS = modal system.
A significant linear relationship between observed and simulation data was identified for all variables, except for mature cow weights (Table 5). The linear regression model for the total number of herd animals demonstrated a significant relationship between the observed and simulation data (p < 0.01) and exhibited a high determination coefficient (R2) of 0.96. Additionally, the results for the number of harvest steers and cull cows showed an even higher R2 of 0.99, along with a significant relationship between the observed and simulated data (p < 0.01). The weights for harvest heifer and harvest steer reported R2 values of 0.88 and 0.84, respectively, both indicating relevant relationships (p < 0.01 for each). The regression analyses produced slopes close to 1 for all variables (Table 5). Specifically, the total number of animals, the number of harvest steers, the number of cull cows, harvest heifer weights, and harvest steer weights had slope coefficients of 0.8, 0.9, 0.65, 1.2, and 0.9, respectively.
Discussion
Numerous processes in beef cattle production can be simulated, and these models can provide valuable support across various areas of livestock management, including nutrition, breeding, reproduction, and health (Vale et al., 2019; Molossi et al., 2020; Wetlesen et al., 2020). During the simulation, specific input values were utilized to feed the herd simulator, which then aimed to replicate the remaining data as closely as possible to what is observed in real-world systems. In this context, the number of cows and traded animals, as derived from the actual representations provided by Corrêa et al. (2006), allows the system to be initially populated and to reproduce functional livestock systems at a reduced cost for future studies. Leveraging these inputs and aided by the Leslie matrix, it became possible to generate various other animal categories.
The Leslie matrix effectively accounts for the randomness associated with population growth events by integrating stochasticity into biological models (Leslie, 1945; Leslie, 1948). This feature is particularly crucial for events involving the expression of reproductive traits. Consequently, this matrix enabled us to illustrate the growth of beef cattle populations within the Brazilian Cerrado biome. The Leslie matrix had previously been employed in studies aimed at understanding population dynamics and assessing potential population growth (Bradshaw et al., 2007; Mollet and Cailliet, 2002; Slade and Levenson, 1982). In their research on population size, Bradshaw et al. (2007) identified the cumulative effects of stochastic fluctuations over 22 generations (roughly seven years per generation), by simulating the non-native banteng species in northern Australia. Furthermore, exponential growth models utilizing Leslie matrices can be instrumental in predicting and managing the risk of extinction in populations (Slade and Levenson, 1982). In a comparative analysis of models for four elasmobranch species, Mollet and Cailliet (2002) observed similarities between stage-based models and Leslie's matrix models in assessing potential population growth and reproductive output.
In the present study, the simulated improved systems yielded a higher number of animals in herds that utilized more intensive production systems. Notably, the IBS5 system accounted for the largest herd in the same area (1200 ha). Animals raised in feedlots or receiving supplemental feed in addition to forage have the potential to achieve desired production rates more quickly than those that relying solely on forage, thereby allowing for greater allocation of animals per area (Molossi et al., 2020). Typically, systems with higher nutritional inputs support the highest density of animals per hectare (Vale et al., 2019; Molossi et al., 2020; Wetlesen et al., 2020; Greenwood, 2021). It should be noted that adopting feedlot systems, can increase production levels without necessitating expansion of pastureland (Vale et al., 2019). Additionally, it appears that an extensive cattle-rearing system could result in lower feed costs than intensive systems (Molossi et al., 2020; Wetlesen et al., 2020), even though retained earnings tend to be highest in the more intensive systems (Greenwood, 2021).
The extensive cattle system is most prevalent in beef cattle production within the Brazilian Cerrado biome. However, the MS system produces the fewest animals across all categories included in the simulation, whereas improved systems show higher animal counts. While the extensive system results in lower productivity than other systems, it can still be profitable due to the number of animals slaughtered and the available pasture areas in Mato Grosso do Sul (Portes et al., 2020). Furthermore, the MS has the longest breeding period, which also contributes to income in this livestock business, despite the fact that an extended calving season may reduce production efficiency (Boyer et al., 2020).
Regarding the number of animals in each category, improved systems consistently outperformed the most extensive system. More intensive rearing systems, such as feedlots, can increase productivity, reduce deforestation and carbon emissions, and enhance meat quality (Vale et al., 2019). Increased grain and protein intake can elevate cattle stocking rates, resulting in higher annual production and economic returns (Molossi et al., 2020). However, it is important to acknowledge the potential drawbacks associated with intensive production. These include heightened water and air pollution, soil contamination, diminished animal welfare, the selection of more virulent parasites and pathogens, and the spread of zoonotic diseases (Vale et al., 2019). Conversely, semi-intensive systems may mitigate some of these drawbacks. While they may not achieve the same productivity, they can still enhance production metrics compared to extensive production systems (Costantini et al., 2021). Nevertheless, a significant challenge across all production systems, whether intensive or extensive, is the suboptimal utilization and improper implementation of available technical information (Turner et al., 2023).
Body weight serves as a key indicator of growth performance in cattle. To support this, age-specific weights were simulated for all beef cattle scenarios in this study. Notably, the mature weights of cows at five years of age were 445 kg and 469 kg in the IBS5 and MS groups, respectively. These figures are comparable to those reported in other studies involving mature Nellore cows (Boligon et al., 2008; Koetz Junior et al., 2019).
In the MS system, the animals weighed showed an average of 477 kg for heifers and 487 kg for steers. Notably, these animals did not receive feed supplementation, mainly because their slaughter was delayed by 52 months. Among the improved systems, the IBS5 had the lightest slaughter weight (448 kg for heifers and 464 kg for steers), and the earliest production (19 months). No significant difference has been reported in slaughter weights for Nellore heifers finished in a feedlot (366 kg) compared to those on pasture (365 kg) during the dry period, despite varying growth durations of 86-102 days for feedlot cattle versus 225-271 days for those on pastures (Casagrande et al., 2013). In feedlot conditions, Nellore cattle reached an average weight of 449.5 kg at 25 months by the end of the feedlot period (Cominotte et al., 2020). Additionally, in central performance tests on pasture, the weights of Nellore bulls at 550 days ranged between 269 and 450 kg when analyzed by cluster groups (Lima et al., 2013). Therefore, the differences in slaughter weight identified in our simulation study can be attributed to the finishing phase occurring during the rainy season, characterized by a prolonged stay of the animals until slaughter, particularly for those finished on pasture or receiving high-quality supplementation in improved systems. However, it is crucial to note that, from a profitability standpoint, extended stays are often economically impractical.
A well-constructed simulation model is achieved when there is alignment between the prediction model and the behaviors of the real system (Sørensen, 1990). Thus, a verification process is essential, which can be performed using correlation and regression analyses. Notably, the simulation employed in this study forecasts average performance outcomes, which are compared with the average performance levels reported by Corrêa et al. (2006).
A strong positive relationship was observed between the observed and simulated variables, as evidenced by the correlation between simulated weights and the number of animals, in accordance with the reports by Corrêa et al. (2006) (Figures 1-6). The correlations between the simulated outcomes, except for mature weight, and those reported by Corrêa et al. (2006) ranged from 0.92 to 0.99. These high correlations indicate that the responses generated by the simulation models accurately reflect those of real systems (Kleijnen, 1995; Plaizier et al., 1997; Vetter and Schober, 2018). The correlation for mature weight was notably lower due to the limited variation among the production systems (Figure 6). Therefore, the algorithms used to simulate herds successfully generated diverse beef cattle production scenarios that align with livestock systems in the Brazilian Cerrado biome. Simulation is frequently utilized as a preliminary or comparative tool in pharmaceutical evaluations to understand the biological function of the drugs under assessment. This approach helps mitigate high costs and simplify the complexities of molecular behavior (Wang et al., 2015).
Regression analysis was used to compare observed and simulated data, with an independent variable used to predict a dependent variable (Vetter and Schober, 2018). A slope close to 1 indicates a proportional relationship between the variables, suggesting that a unit change in the independent variable results in an approximately equal unit change in the dependent variable. These findings imply that, despite variations in individual parameter values, the simulation model consistently maintains proportionality with the observed data across different livestock categories. Notably, the high R2 value highlights the model's effectiveness in capturing the overall dynamics of the herd.
Ultimately, the choice of production system will hinge on various factors that can be assessed inexpensively, rapidly, and reliably through simulation models. Key considerations include animal density per unit area, production probability, and distinctions between traditional and improved systems, which were effectively simulated in the present study. Furthermore, these simulated systems can be utilized in further analyses to evaluate the economic costs and profitability of beef cattle production (Calvano et al., 2021; Lopes et al., 2018; Wetlesen et al., 2020). They can also aid in generating economic values (Souza et al., 2022) and selection indices (Portes et al., 2020).
The model introduced in this study has been specifically developed and parameterized for the Cerrado region; however, its foundational structure is adaptable for application in other regions. The model's core framework, which simulates herd dynamics and beef cattle production, is not inherently tied to the unique conditions of the Cerrado. Instead, it relies on key variables such as climate, nutritional plans, cattle breed, and management practices. Consequently, producers and researchers can utilize this simulator across various scenarios, customizing it to suit their specific needs and objectives. This versatility makes it an invaluable tool for decision-making in beef cattle production systems.
The simulation model developed in this study has significant practical applications that are both economically and environmentally relevant. By replicating herd dynamics using real data from beef cattle systems in the Brazilian Cerrado, the model serves as a valuable decision-support tool for producers, technical advisors, and researchers alike. It allows users to assess the impacts of various management strategies on herd productivity, such as changes in feeding regimes, reproductive parameters, and slaughter age, without the financial costs or logistical challenges associated with live experimentation. Furthermore, the model can be modified to estimate animal output per hectare and to simulate the environmental consequences of transitioning from extensive to semi-intensive or intensive systems. This predictive capability is instrumental in promoting more sustainable land use, enhancing resource efficiency, and informing public policies aimed at boosting beef cattle productivity while minimizing environmental impacts. To facilitate simulator's application in other evaluations, minor structural adjustments may be needed to ensure the model accurately reflects the specific characteristics, management practices, and environmental conditions of the target production systems.
In conclusion, the simulated systems developed in our study serve as a valuable resource for assessing beef cattle production within the Brazilian Cerrado biome. Our findings indicate that these simulation models can effectively predict herd performance and facilitate the transition from extensive to more intensive beef cattle production in full-cycle systems. This tool not only enhances predictions of animal performance but also supports the production of Nellore cattle in the Cerrado biome, as well as other biomes and breeds. Additionally, it enables producers to tailor their production strategies according to their specific needs and economic resources.
Data Availability Statement
The authors declare that all data supporting the findings of this study are included in the article.
Acknowledgments
This study received financial support in part from the Coordenação de Aperfeiçoamento de Pessoal de Nível Superior -Brasil (CAPES) -FinanceCode 001 and was financed in part by the Universidade Federal de Mato Grosso do Sul-Brasil (UFMS) -Finance Code 001.
References
-
Anderson VL, Jost L, Dinkel CA, Brown MA. 1983. Prediction of daily total digestible nutrient requirement of beef cows in northern climates. Journal of Animal Science 56: 271-279. https://doi.org/10.2527/jas1983.562271x
» https://doi.org/10.2527/jas1983.562271x -
Boligon AA, Albuquerque LG, Mercadante MEZ, Lôbo RB. 2008. Models for genetic evaluation of Nelore cattle mature body weight. Journal of Animal Science 86: 2840-2844. https://doi.org/10.2527/jas.2007-0823
» https://doi.org/10.2527/jas.2007-0823 -
Boyer CN, Griffith AP, Pohler kg. 2020. Improving beef cattle profitability by changing calving season length. Journal of Applied Farm Economics 3: 2. https://doi.org/10.7771/2331-9151.1035
» https://doi.org/10.7771/2331-9151.1035 -
Bradshaw CJA, Isagi Y, Kaneko S, Brook BW, Bowman DMJS, Frankham R. 2007. Low genetic diversity in the bottlenecked population of endangered non-native banteng in northern Australia. Molecular Ecology 16: 2998-3008. https://doi.org/10.1111/j.1365-294X.2007.03365.x
» https://doi.org/10.1111/j.1365-294X.2007.03365.x - Brody S. 1945. Bioenergetics and Growth, with Special Reference to the Efficiency Complex in Domestic Animals. Reinhold, New York, NY, USA.
-
Calvano MPCA, Brumatti RC, Barros JC, Garcia MV, Martins KR, Andreotti R. 2021. Bioeconomic simulation of Rhipicephalus microplus infestation in different beef cattle production systems in the Brazilian Cerrado. Agricultural Systems 194: 103247. https://doi.org/10.1016/j.agsy.2021.103247
» https://doi.org/10.1016/j.agsy.2021.103247 -
Cardoso AS, Barbero RP, Romanzini EP, Teobaldo RW, Ongaratto F, Fernandes MHMR, et al. 2020. Intensification: A key strategy to achieve great animal and environmental beef cattle production sustainability in Brachiaria grasslands. Sustainability 12: 6656. https://doi.org/10.3390/su12166656
» https://doi.org/10.3390/su12166656 -
Casagrande DR, Azenha MV, Vieira BR, Resende FD, Faria MH, Berchielli TT, et al. 2013. Performance and carcass quality of feedlot-or pasture-finished Nellore heifers according to feeding managements in the postweaning phase. Revista Brasileira de Zootecnia 42: 899-908. https://doi.org/10.1590/S1516-35982013001200010
» https://doi.org/10.1590/S1516-35982013001200010 -
Cominotte A, Fernandes AFA, Dorea JRR, Rosa GJM, Ladeira MM, van Cleef EHCB, et al. 2020. Automated computer vision system to predict body weight and average daily gain in beef cattle during growing and finishing phases. Livestock Science 232: 103904. https://doi.org/10.1016/j.livsci.2019.103904
» https://doi.org/10.1016/j.livsci.2019.103904 -
Corrêa ES, Costa FP, Melo Filho GA, Pereira MA. 2006. Sistemas de produção melhorados para gado de corte em Mato Grosso do Sul. Embrapa, Campo Grande, MS, Brazil (in Portuguese). Available at: https://ainfo.cnptia.embrapa.br/digital/bitstream/CNPGC-2009-09/12487/1/COT102.pdf [Accessed Mar 10, 2021]
» https://ainfo.cnptia.embrapa.br/digital/bitstream/CNPGC-2009-09/12487/1/COT102.pdf -
Costantini M, Vázquez-Rowe I, Manzardo A, Bacenetti J. 2021. Environmental impact assessment of beef cattle production in semi-intensive systems in Paraguay. Sustainable Production and Consumption 27: 269-281. https://doi.org/10.1016/j.spc.2020.11.003
» https://doi.org/10.1016/j.spc.2020.11.003 - Denham SC, Spreen TH. 2019. Introduction to simulation of beef cattle production. p. 39-62. In: Spreen TH, Laughlin DH. eds. Simulation of Beef Cattle Production Systems and Its Use in Economic Analysis. Routledge, New York, NY, USA.
-
Organisation for Economic Co-operation and Development [OECD]. 2018. OECD-FAO Agricultural Outlook 2018-2027. OECD, Paris, France. https://doi.org/10.1787/agr_outlook-2018-en
» https://doi.org/10.1787/agr_outlook-2018-en - Forrester JW. 1961. Industrial Dynamics. MIT Press, Cambridge, MA, USA.
-
Greenwood PL. 2021. Review: An overview of beef production from pasture and feedlot globally, as demand for beef and the need for sustainable practices increase. Animal 15: 100295. https://doi.org/10.1016/j.animal.2021.100295
» https://doi.org/10.1016/j.animal.2021.100295 -
Kleijnen JPC. 1995. Verification and validation of simulation models. European Journal of Operational Research 82: 145-162. https://doi.org/10.1016/0377-2217(94)00016-6
» https://doi.org/10.1016/0377-2217(94)00016-6 -
Koetz Junior C, Roso VM, Fávaro PC, Pereira GR, Borges MHF, Barca Junior FA, et al. 2019. Heritability estimation and genetic correlations for mature weight, visual scores, and growth traits in Nellore cattle. Revista Brasileira de Zootecnia 48: e20170246. https://doi.org/10.1590/RBZ4820170246
» https://doi.org/10.1590/RBZ4820170246 -
Leslie PH. 1945. On the use of matrices in certain population mathematics. Biometrika 33: 183-212. https://doi.org/10.2307/2332297
» https://doi.org/10.2307/2332297 -
Leslie PH. 1948. Some further notes on the use of matrices in population mathematics. Biometrika 35: 213-245. https://doi.org/10.1093/biomet/35.3-4.213
» https://doi.org/10.1093/biomet/35.3-4.213 -
Lima PRM, Paiva SR, Cobuci JA, Braccini Neto J, Machado CHC, McManus C. 2013. Genetic parameters for type classification of Nelore cattle on central performance tests at pasture in Brazil. Tropical Animal Health and Production 45: 1627-1634. https://doi.org/10.1007/s11250-013-0408-1
» https://doi.org/10.1007/s11250-013-0408-1 -
Lopes RB, Canozzi MEA, Canellas LC, Gonzalez FAL, Corrêa RF, Pereira PRRX, et al. 2018. Bioeconomic simulation of compensatory growth in beef cattle production systems. Livestock Science 216: 165-173. https://doi.org/10.1016/j.livsci.2018.08.011
» https://doi.org/10.1016/j.livsci.2018.08.011 -
MacNeil MD, Harris DL. 1988. Highly Aggregated Simulation Models. Journal of Animal Science 66: 2517-2523. https://doi.org/10.2527/jas1988.66102517x
» https://doi.org/10.2527/jas1988.66102517x -
Mollet HF, Cailliet GM. 2002. Comparative population demography of elasmobranchs using life history tables, Leslie matrices and stage-based matrix models. Marine and Freshwater Research 53: 503-515. https://doi.org/10.1071/MF01083
» https://doi.org/10.1071/MF01083 -
Molossi L, Hoshide AK, Pedrosa LM, Oliveira AS, Abreu DC. 2020. Improve pasture or feed grain? Greenhouse gas emissions, profitability, and resource use for nelore beef cattle in Brazil's cerrado and Amazon biomes. Animals 10: 1386. https://doi.org/10.3390/ani10081386
» https://doi.org/10.3390/ani10081386 -
Mwangi FW, Charmley E, Gardiner CP, Malau-Aduli BS, Kinobe RT, Malau-Aduli AEO. 2019. Diet and genetics influence beef cattle performance and meat quality characteristics. Foods 8: 648. https://doi.org/10.3390/foods8120648
» https://doi.org/10.3390/foods8120648 -
Pang H, Makarechian M, Basarab JA, Berg RT, Berg JA. 1999. Structure of a dynamic simulation model for beef cattle production systems. Canadian Journal of Animal Science 79: 409-417. https://doi.org/10.4141/A99-020
» https://doi.org/10.4141/A99-020 -
Plaizier JCB, King GJ, Dekkers JCM, Lissemore K. 1997. Estimation of economic values of indices for reproductive performance in dairy herds using computer simulation. Journal of Dairy Science 80: 2775-2783. https://doi.org/10.3168/jds.S0022-0302(97)76240-4
» https://doi.org/10.3168/jds.S0022-0302(97)76240-4 -
Portes JV, Menezes GRO, MacNeil MD, Silva LOC, Gondo A, Braccini Neto J. 2020. Selection indices for Nellore production systems in the Brazilian Cerrado. Livestock Science 242: 104309. https://doi.org/10.1016/j.livsci.2020.104309
» https://doi.org/10.1016/j.livsci.2020.104309 -
Pouillot R, Dufour B, Durand B. 2004. A deterministic and stochastic simulation model for intra-herd paratuberculosis transmission. Veterinary Research 35: 53-68. https://doi.org/10.1051/vetres:2003046
» https://doi.org/10.1051/vetres:2003046 -
Slade NA, Levenson H. 1982. Estimating population growth rates from stochastic Leslie matrices. Theoretical Population Biology 22: 299-308. https://doi.org/10.1016/0040-5809(82)90047-8
» https://doi.org/10.1016/0040-5809(82)90047-8 -
Sørensen JT. 1990. Validation of livestock herd simulation models: a review. Livestock Production Science 26: 79-90. https://doi.org/10.1016/0301-6226(90)90058-E
» https://doi.org/10.1016/0301-6226(90)90058-E -
Souza FM, Lopes FB, Rosa GJM, Magnabosco CU. 2022. Economic values of reproductive, growth, feed efficiency and carcass traits in Nellore cattle. Journal of Animal Breeding and Genetics 139: 170-180. https://doi.org/10.1111/jbg.12652
» https://doi.org/10.1111/jbg.12652 -
Stabile MCC, Guimarães AL, Silva DS, Ribeiro V, Macedo MN, Coe MT, et al. 2020. Solving Brazil's land use puzzle: Increasing production and slowing Amazon deforestation. Land Use Policy 91: 104362. https://doi.org/10.1016/j.landusepol.2019.104362
» https://doi.org/10.1016/j.landusepol.2019.104362 -
Tedeschi LO, Menendez HM III. 2020. Chapter 25 - Mathematical modeling in animal production. p. 431-453. In: Bazer FW, Lamb GC, Wu G. eds. Animal agriculture: Sustainability, Challenges and Innovations. Academic Press, Kidlington, Oxford, UK. https://doi.org/10.1016/B978-0-12-817052-6.00025-2
» https://doi.org/10.1016/B978-0-12-817052-6.00025-2 -
Turner SP, Canozzi MEA, Ferguson D. 2023. Welfare of beef cattle in extensive systems. p. 125-163. In: Haskell M. ed. Cattle Welfare in Dairy and Beef Systems. Springer, Cham, Germany. https://doi.org/10.1007/978-3-031-21020-4_6
» https://doi.org/10.1007/978-3-031-21020-4_6 -
Vale P, Gibbs H, Vale R, Christie M, Florence E, Munger J, et al. 2019. The expansion of intensive beef farming to the Brazilian Amazon. Global Environmental Change 57: 101922. https://doi.org/10.1016/j.gloenvcha.2019.05.006
» https://doi.org/10.1016/j.gloenvcha.2019.05.006 -
Vetter TR, Schober P. 2018. Regression: The Apple Does Not Fall Far From the Tree. Anesthesia & Analgesia 127: 277-283. https://doi.org/10.1213/ANE.0000000000003424
» https://doi.org/10.1213/ANE.0000000000003424 -
Wang L, Wu Y, Deng Y, Kim B, Pierce L, Krilov G, et al. 2015. Accurate and reliable prediction of relative ligand binding potency in prospective drug discovery by way of a modern free-energy calculation protocol and force field. Journal of the American Chemical Society 137: 2695-2703. https://doi.org/10.1021/ja512751q
» https://doi.org/10.1021/ja512751q -
Wetlesen MS, Åby BA, Vangen O, Aass L. 2020. Simulations of feed intake, production output, and economic result within extensive and intensive suckler cow beef production systems. Livestock Science 241: 104229. https://doi.org/10.1016/j.livsci.2020.104229
» https://doi.org/10.1016/j.livsci.2020.104229 -
Yokoo MJ-I, Seno LO, Oliveira LC, Costa PUN, Silva GM, Suñé RW, et al. 2019. Economic selection index in small rural dairy farms. Journal of Dairy Research 86: 25-33. https://doi.org/10.1017/S0022029918000894
» https://doi.org/10.1017/S0022029918000894
Edited by
-
Edited by:
Luiz Alexandre Peternelli https://orcid.org/0000-0002-7683-0583