 Temperature anomalies as predictors of peach flowering in southern Brazil
ABSTRACT:
Atmospheric conditions, particularly air temperature, are elements crucial to the adaptation of temperate climate fruit species. Climatic variability in the Prunus-producing region of Brazil is a predominant factor in causing production alterations. One of the challenges in determining climatic effects is the availability of long-term phenological data. Thus, the aim of this study was to correlate temperature variations from Jan to Mar with peach flowering dates, applying neural networks as a modeling tool to improve phenological predictions. Research on flowering and budding of the ‘Chimarrita’ cultivar was based on plants from an active germplasm bank during the period of 1986 to 2021. The average start date of flowering for this period was calculated, as well as the deviations for each year, by subtracting the observed date from the average date. Variables’ climatic data were created and converted into anomalies. The annual flowering anomaly characterizes the number of days of advancement or delay, while the monthly anomalies of minimum and maximum temperatures characterize thermal variations in the environment. The results showed that coefficient of correlation, considering anomalies of minimum and maximum temperatures in the first quarter, serves as a predictive indicator of flowering on the ‘Chimarrita’ peach tree in southern Brazil. The neural regression model had significant influence on the total variation in flowering anomaly, suggesting a very promising application in regression models with a long series of phenological-climatic data.
Keywords:
climate variability; data series; meteorology; neural networks; phenology
Introduction
Climatic stability is crucial to the adaptation of temperate fruit species, to ensure yield and production regularity. Their potential depends directly on climatic elements such as air temperature, rainfall, and solar radiation (Rattigan and Hill, 1986). In southern Brazil, one of the main challenges to peach [Prunus persica (L.) Batsch] production is the temporal variability of winter chilling, which affects bud dormancy and flowering (Alvares et al., 2013; Wrege et al., 2017). Long-term analyses indicate a regional warming trend of about 1-2 °C, which directly impacts chilling accumulation (Luedeling, 2012).
Dormancy, which includes paradormancy, endodormancy, and ecodormancy, is critical to the phenological phases of temperate fruit trees such as peach (Lang, 1996). Paradormancy occurs when growth is inhibited by signals from other plant organs, such as apical dominance (Lang et al., 1987). Endodormancy refers to the stage when buds are physiologically incapable of resuming growth even under favorable conditions, being mainly regulated by internal factors and low temperatures (Lang, 1996). Ecodormancy takes place when buds are competent to grow but remain quiescent due to unfavorable external conditions, especially temperature (Sabir et al., 2025). The transition through these phases determines bud break and flowering, directly influencing adaptation and productivity (Michailidis et al., 2018).
In peach trees, floral differentiation begins in mid-summer and continues through autumn (Reinoso et al., 2002). Adequate chilling during winter ensures vegetative growth and floral development, while temperature anomalies, often associated with El Niño and La Niña events, can disrupt these processes, causing metabolic imbalances (Angelocci and Sentelhas, 2010).
Phenological models traditionally use linear regressions to correlate climate data with plant responses (Liu et al., 2024). Land surface models often rely on accumulated degree days to represent development and chilling accumulation for breaking dormancy (Lawrence et al., 2019; Zhang et al., 2022). However, linear models (LMs) are limited in capturing complex interactions between climatic variables (Goodfellow et al., 2016). Adjusted LMs can improve the estimation of phenological stages (Anzanello and Christo, 2019), but artificial neural networks present superior performance due to their capacity to model complex relationships, tolerance to noise, and ability to integrate qualitative and quantitative variables (Binoti et al., 2013).
Given these aspects, this study aimed to correlate temperature variations from Jan to Mar with peach flowering dates, applying neural networks to improve phenological predictions.
Materials and Methods
Plant material
To conduct the research, peach trees of ‘Chimarrita’ cultivar grafted onto ‘Capdeboscq’ seedlings were used, which are part of the Active Germplasm Bank and plants’ collection of the Peach Trees Genetic Improvement Program of Embrapa Clima Temperado, located in Pelotas, in the state of Rio Grande do Sul, Brazil (31°41’ S, 52°26’ W, altitude 60 m). The soil of the area is classified as a Typic Hapludult (Ultisol) and the orchard was managed with a spacing of 5 m between rows and 2 m within them. Topdressing fertilizations were carried out at the beginning of bud break and after harvest, and fertilization, based on foliar analysis, was performed periodically.
The temporal distribution of plants was divided into four periods: the first one began in 1986, with 3-year-old plants, and extended until 1997; the second one in 1998, with 6-year-old plants until 2007, and the third one in 2008, with 3-year-old plants until 2015 and finally the fourth period in an orchard planted in 2013 until 2021.
Phenological data
The start date of peach trees took into consideration the annual series of flowering. This data set was obtained from records provided by Embrapa Clima Temperado, during the period from 1986 to 2021. The beginning of flowering, defined as 5 % of them opened, was the phenological parameter used until 1997. After this period, the value of 10 % was adopted to suppress the initial irregularity of flowering. This fitting in the methodology adapted the evaluations to BBCH scale, stage 6 - flowering (Meier et al., 1994) and stage F.
The average number of plants used to collect this data over a period of 36 years was three to five plants per year.
Calculation of start flowering average date
To determine the average date of flowering a cultivar, recorded dates were first converted from the Gregorian to the Julian calendar. Using an arithmetic average, the flowering date was then calculated based on these transformed values.
Flowering deviations
Annual deviations were determined for each year by subtracting the observed annual flowering date from the calculated mean of the total period evaluated. The annual flowering anomaly was defined as the number of days by which observed flowering deviated (earlier or later) from the climatological mean. Climatological data were processed and monthly temperature anomalies were calculated, following the same criteria as the flowering anomaly.
Climatological data and anomalies
Average monthly series of minimum and maximum temperatures from the automatic meteorological station installed at the headquarters of Embrapa Clima Temperado, located in Pelotas, in the state of Rio Grande do Sul, Brazil (31°42’ S, 52°24’ W, altitude 57 m) for the period from 1986 through 2021 were used. The data were accessed via a bulletin by this link: https://agromet.cpact.embrapa.br/.
Monthly minimum and maximum temperature anomalies were used to evaluate variations in thermal conditions. The climatological flowering mean date for the series was determined as day 212 (1st July).
Statistical modeling
To evaluate predictive capacity, a multiple regression model was applied, with flowering date anomalies as response variable (Y) and monthly minimum and maximum temperature anomalies as predictor variables (X). These six variables were transformed into standardized anomalies to remove scale differences between temperatures and dates.
The series was divided into two periods: an adjusted one, from 1986 to 2015 (30 years); and a tested one, from 2016 to 2021 (six years). The 30-year data series, conventionally used in the adjusted period, smooths out the effects of natural climate variability (WMO, 1966; Wilks, 2006).
The multiple regression model was structured as follows:
where Y is the peach flowering anomaly, expressed in days; X1, X2 and X3 the minimum air temperature anomalies for Jan, Feb and Mar, in degrees Celsius (°C); and X4, X5 and X6 the maximum air temperature anomalies for Jan, Feb and Mar, in °C.
Linear Regression Model and Neural Network Regression
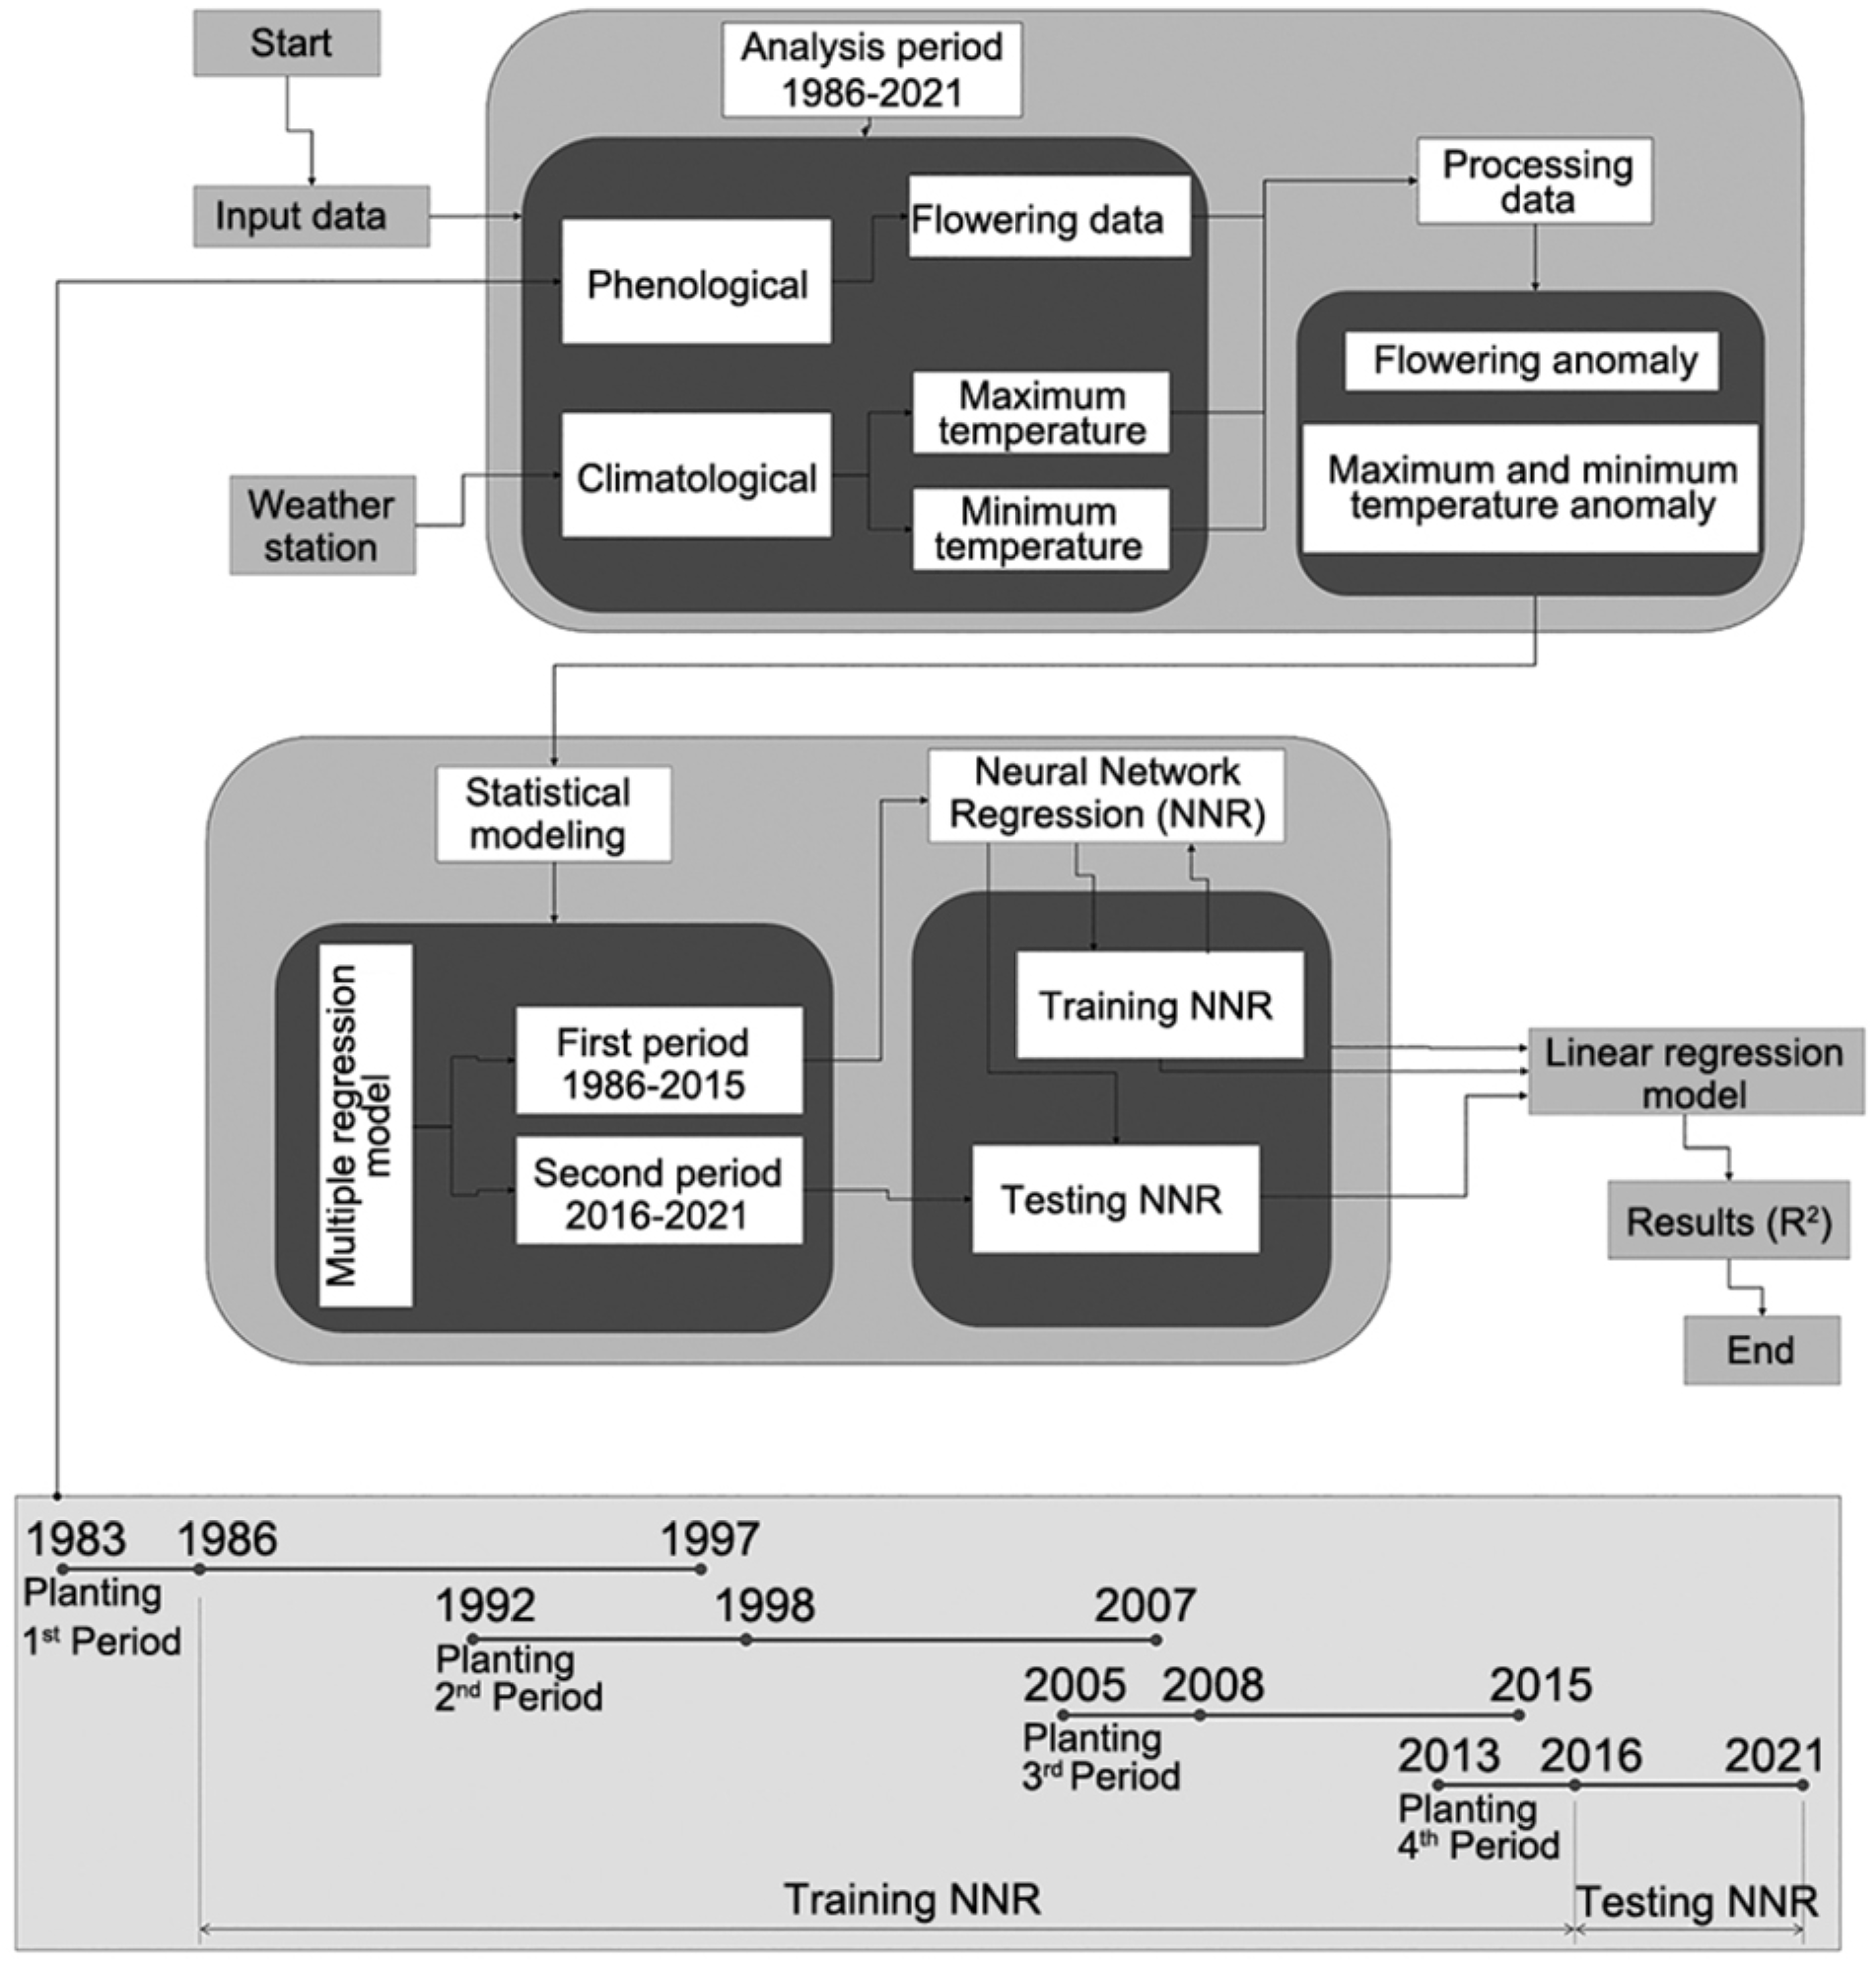
For comparison purposes, a linear model was also applied using the LM function of the R software (version 4.3.1). A methodology summary for data entry, processing and analysis in order to obtain results is presented in Figure 1. To further refine predictions, a neural network regression model was applied using the nnet package in R. This model used the same six predictor variables as the multiple regression model, with a hidden layer of six neurons.
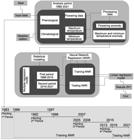
Flowchart of data processing in an artificial neural network for predicting flowering date anomalies of peach trees, cultivar ‘Chimarrita’, in Pelotas, in the state of Rio Grande do Sul, Brazil. Inputs include mean temperatures and flowering dates, converted into anomalies based on the historical average. The neural network, implemented with the R package net, learns nonlinear patterns between climatic variables and phenological responses. The flowchart presents the main steps: data preprocessing, anomaly calculation, network training, and prediction generation under variable climatic conditions. R2 = coefficient of determination.
Results
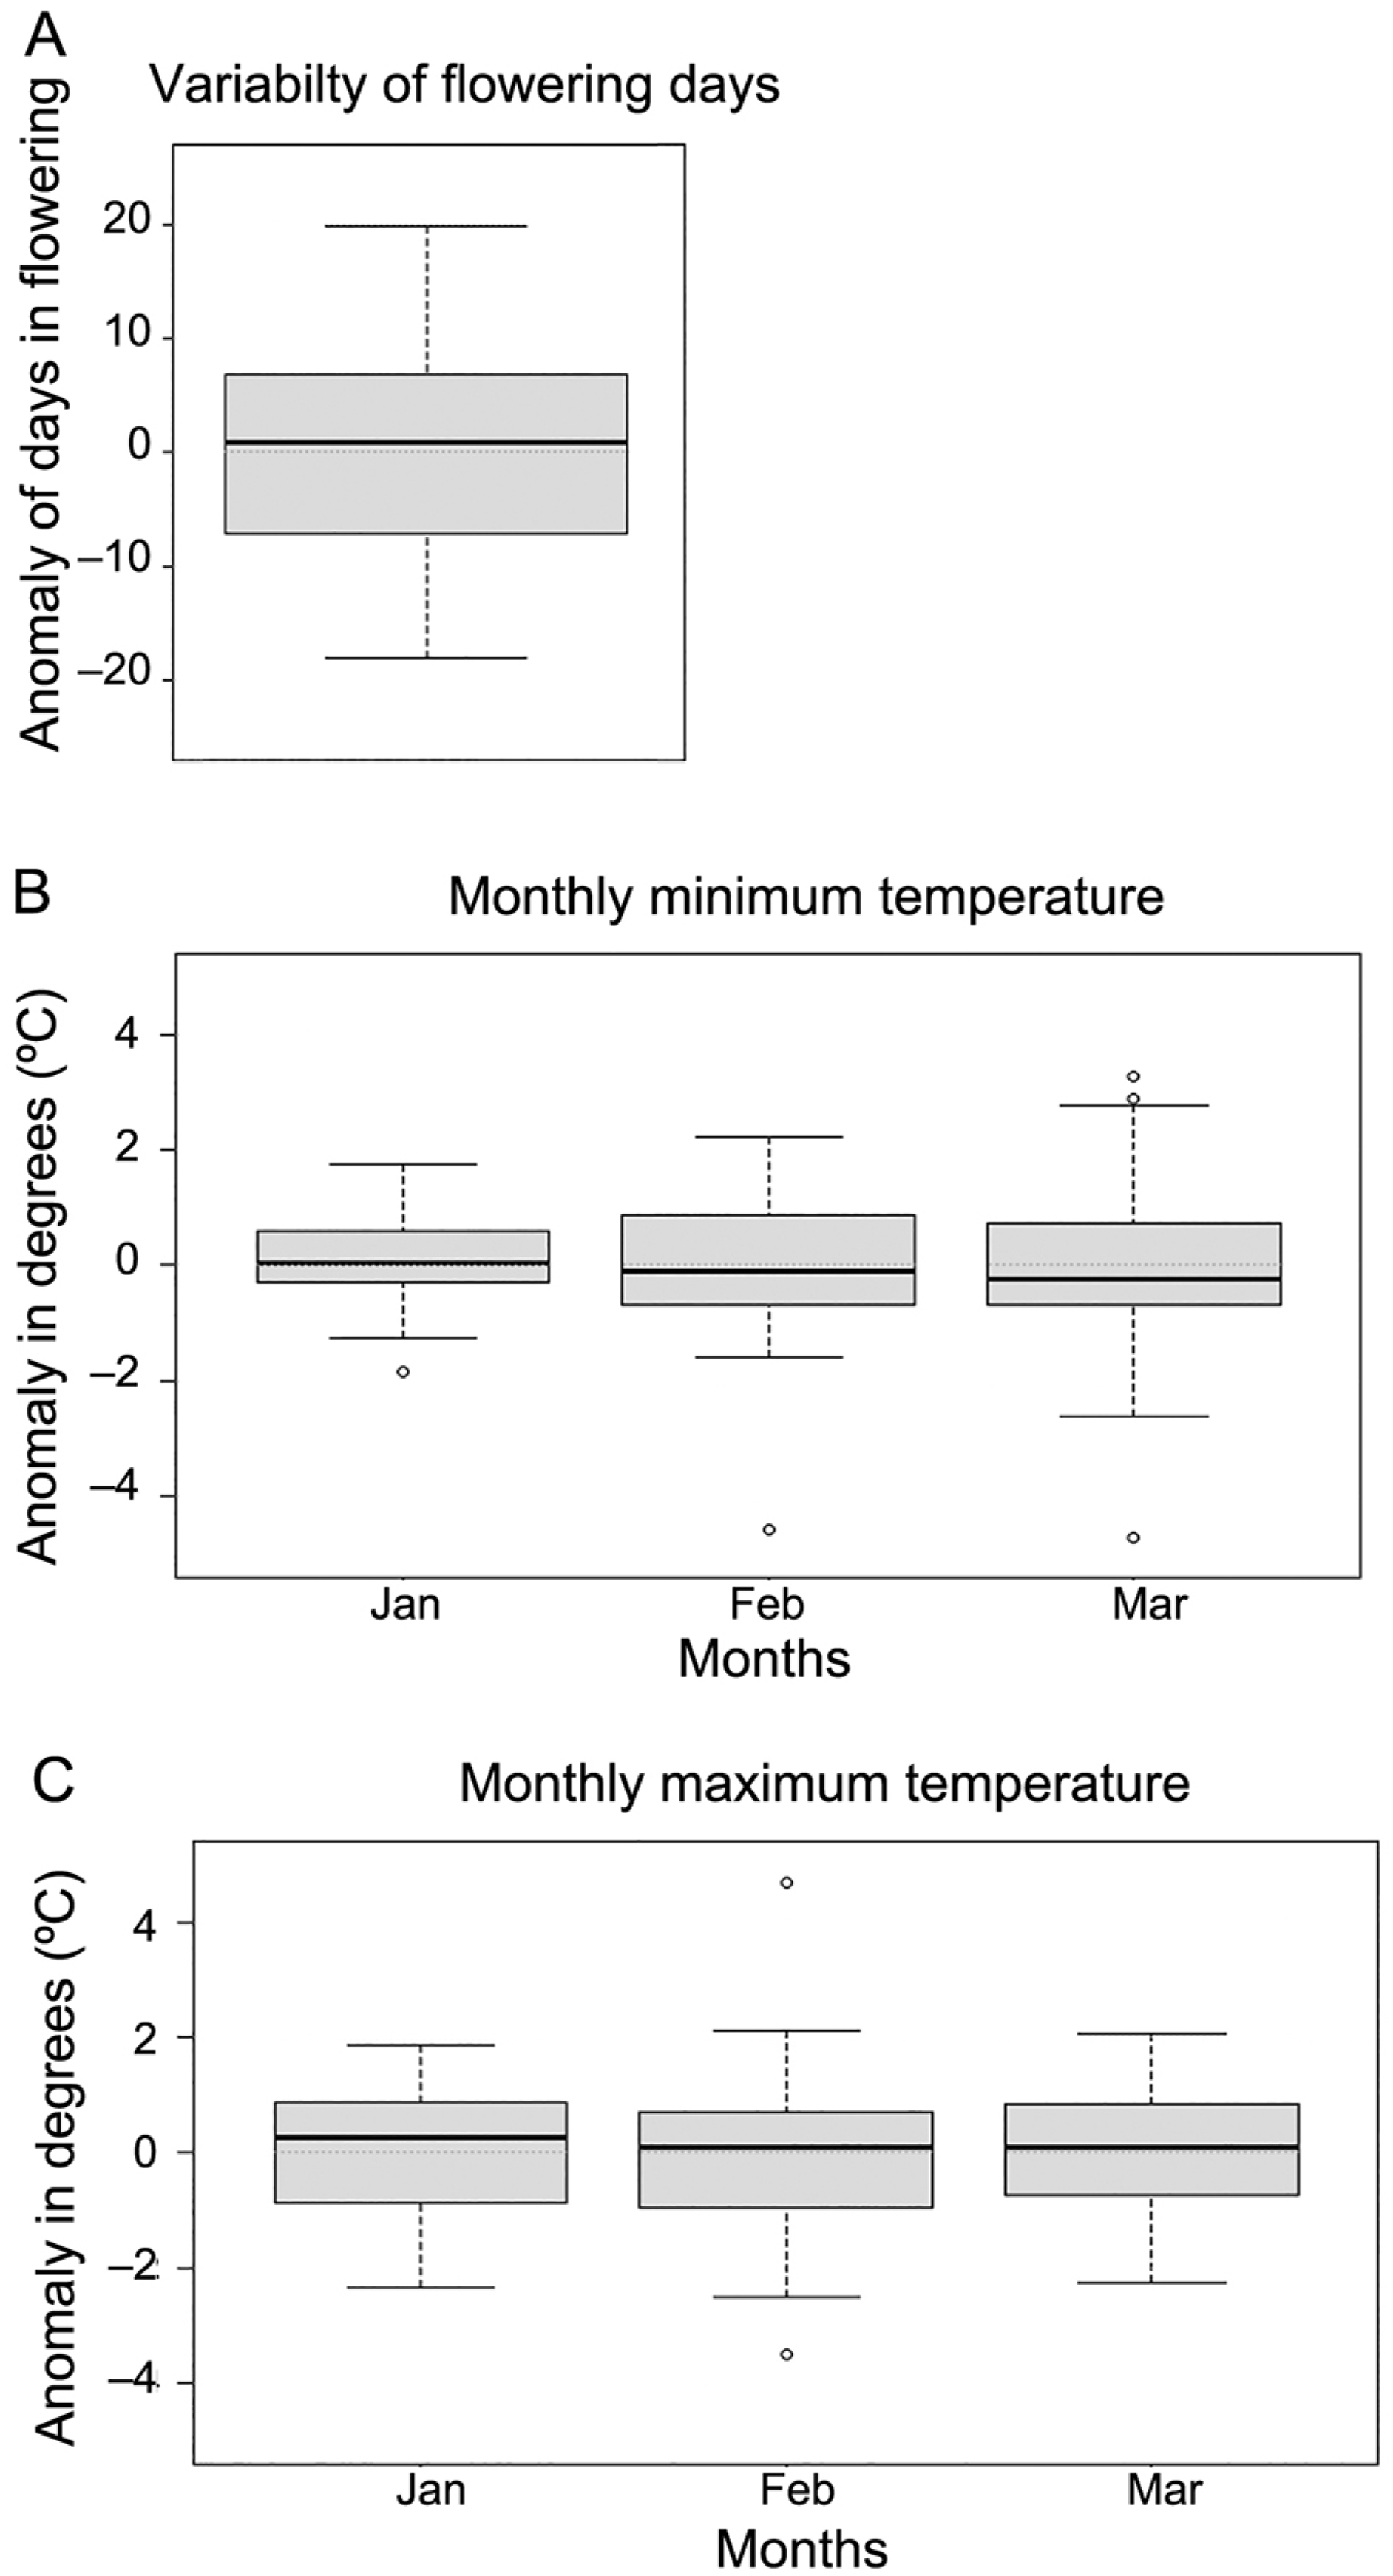
Extreme deviations from the climatological average flowering date (day 212, 1st July) reached approximately ± 20 days (Figure 2). These anomalies were associated with first-quarter temperature deviations of about ± 3 °C. Minimum temperature anomalies increased progressively throughout the quarter, whereas maximum temperature anomalies remained nearly constant.
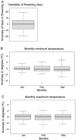
Variability of anomalies in flowering dates of peach trees, cultivar ‘Chimarrita’, and temperature anomalies in Pelotas, in the state of Rio Grande do Sul, Brazil. A) Interannual variability of flowering dates, expressed as anomalies (days) relative to the climatological mean (1986–2021); positive values indicate delayed flowering, while negative values indicate earlier flowering. B) Monthly minimum temperature anomalies for January, February, and March. C) Monthly maximum temperature anomalies for January, February, and March. Temperature anomalies are expressed in °C relative to the reference period 1986-2015.
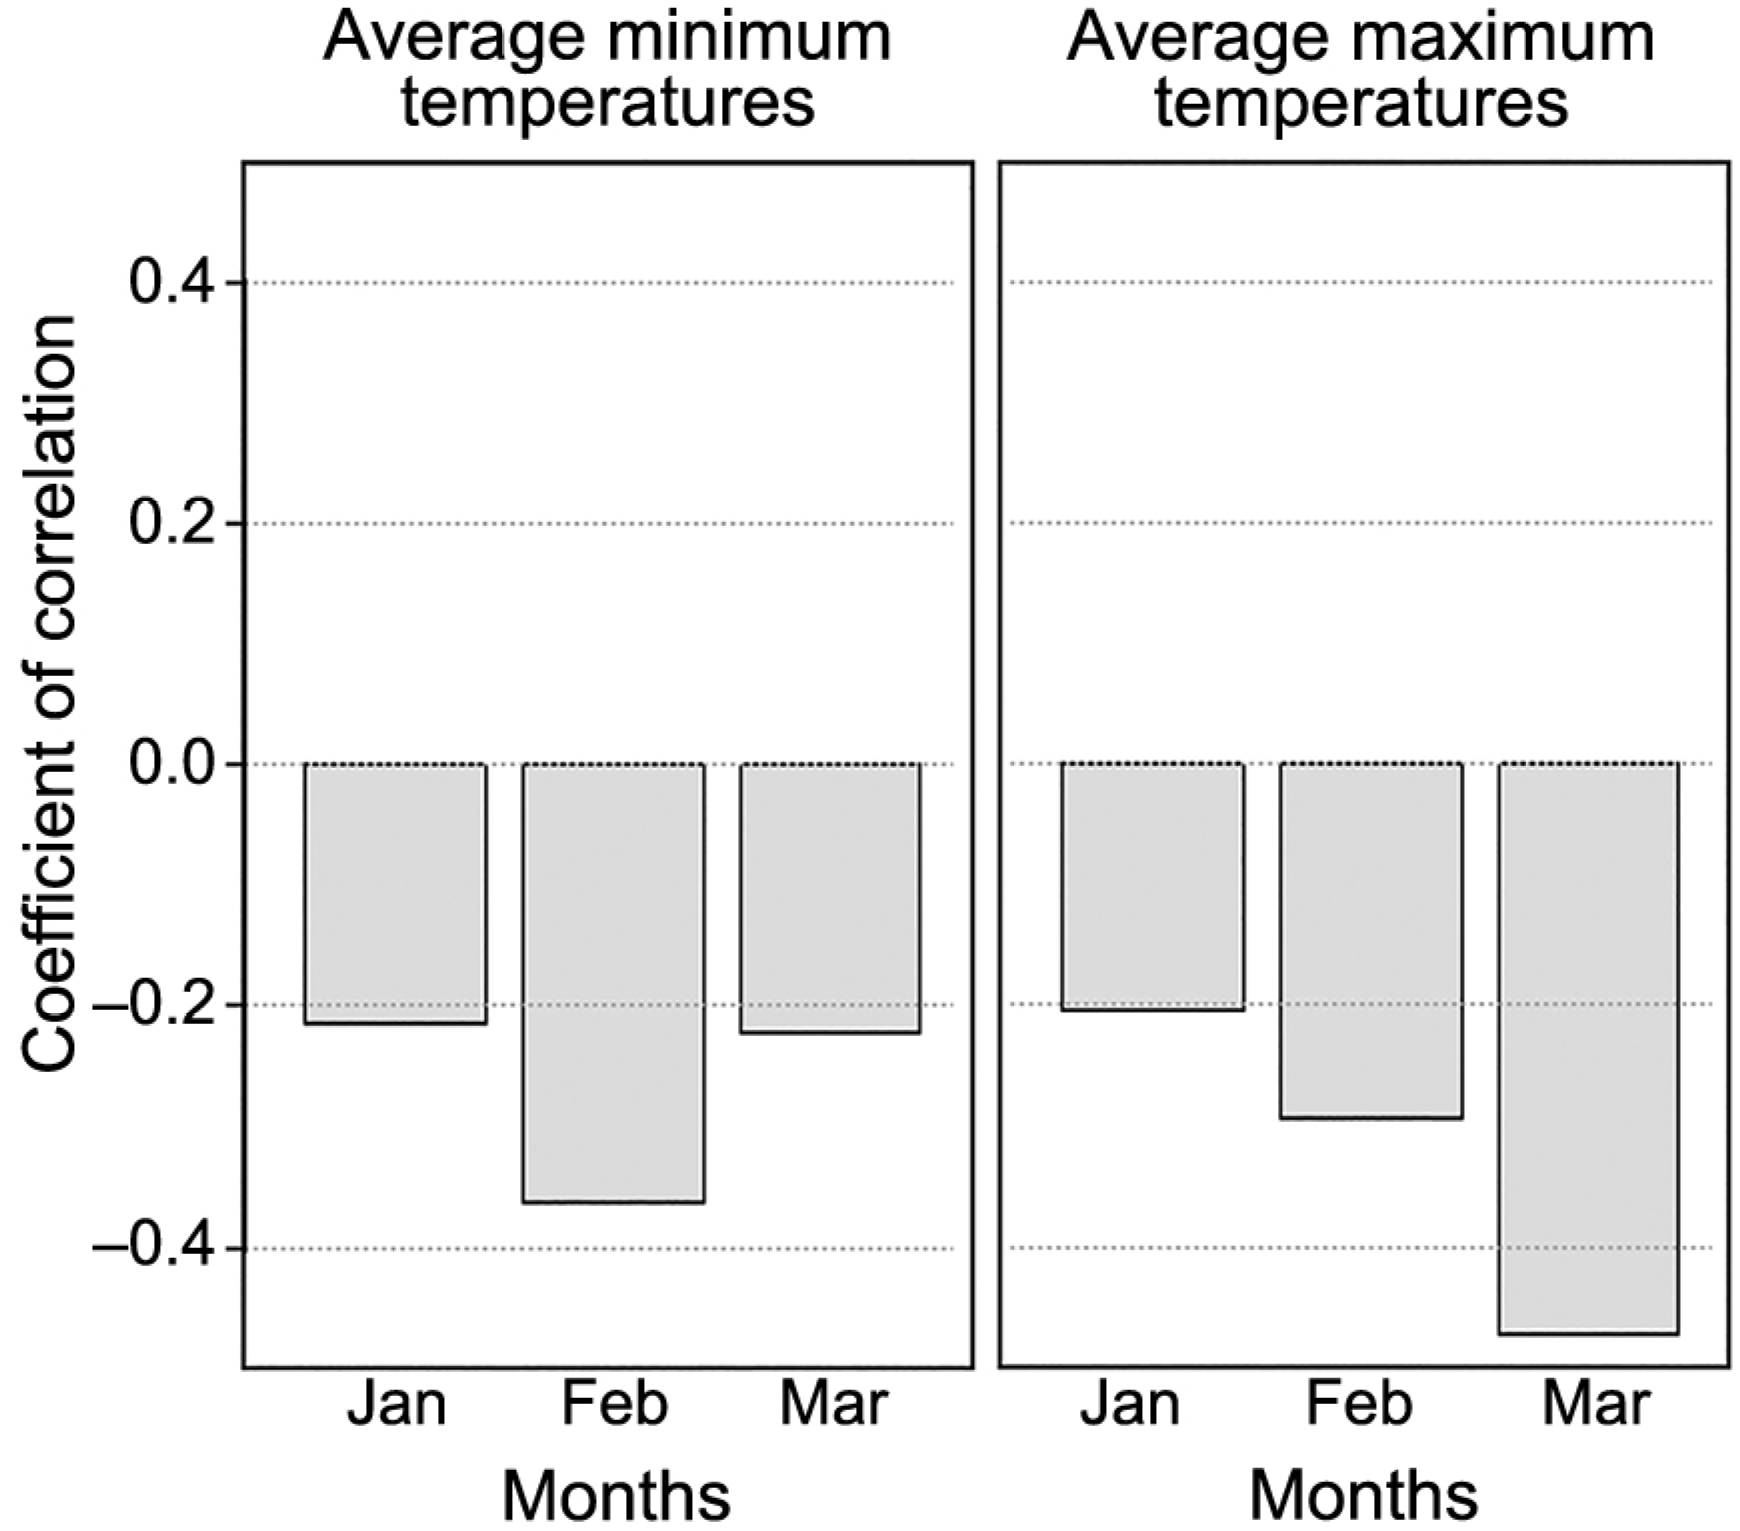
Correlation analyses confirmed the importance of first-quarter thermal variations as predictors of flowering anomalies. Minimum temperatures showed an inverse relationship with flowering dates: negative anomalies advanced flowering, while positive anomalies delayed it. Maximum temperature anomalies, particularly in Mar, exhibited similar associations (Figure 3).
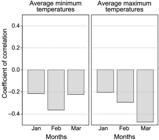
Coefficient of correlation between flowering date anomalies of peach trees and mean minimum and maximum temperatures during Jan, Feb, and Mar in Pelotas, in the state of Rio Grande do Sul, Brazil, for the period 1986-2021.
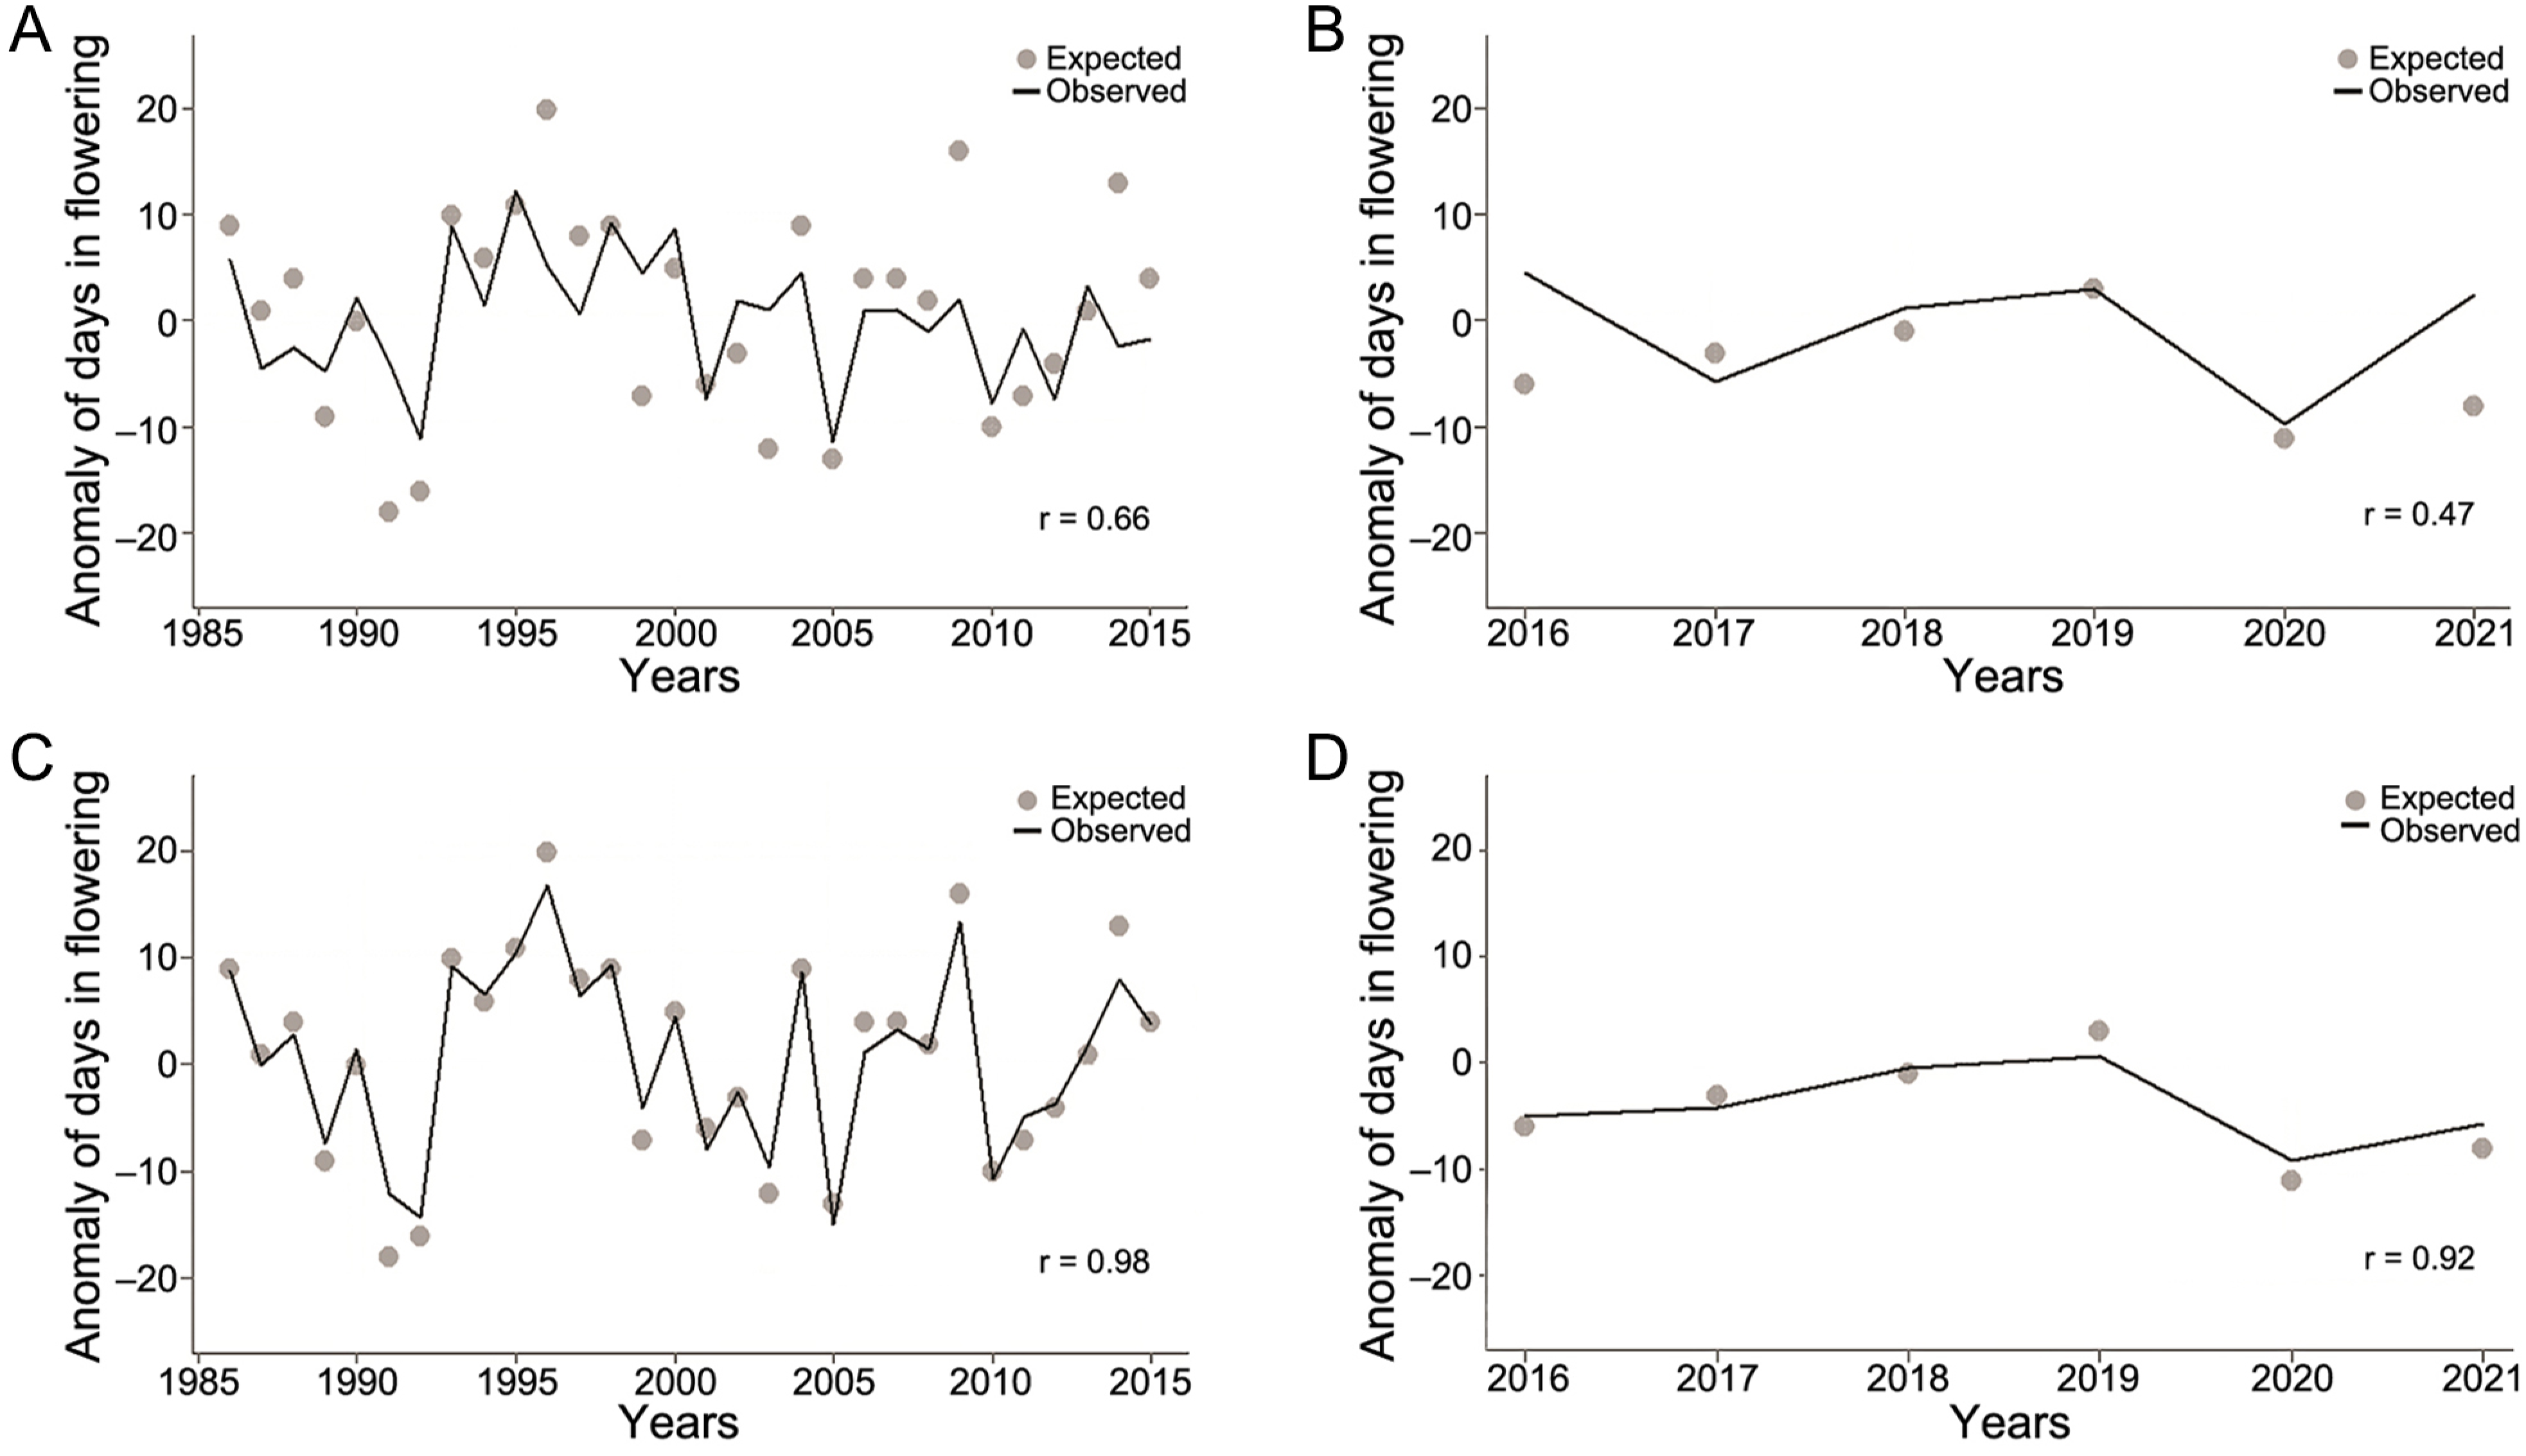
In the multiple regression model, performance during training was moderate (r = 0.66; R2 = 0.44; p < 0.01), explaining less than half of the variation in flowering anomalies. Predictive capacity decreased during testing (r = 0.47; R2 = 0.22; p < 0.01), although results remained coherent with observed phenological patterns (Figure 4A-B).
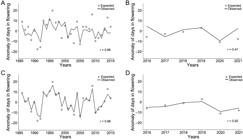
A and B) Comparison between linear regression models, and C and D) artificial neural networks in predicting flowering date anomalies of peach trees, cultivar ‘Chimarrita’, in Pelotas, in the state of Rio Grande do Sul, Brazil. A and C) The training dataset was for the period 1985-2015, B and D) while the testing dataset ran from 2016 to 2021. Estimated flowering date anomalies are represented by solid lines, and observed values by dots. Coefficient of correlation (r) indicate the predictive accuracy of each model.
Conversely, the neural regression model achieved very high accuracy. During training, it explained nearly all of the observed variability (r = 0.98; R2 = 0.96; p < 0.01), and during testing it maintained similarly high performance (r = 0.92; R2 = 0.85; p < 0.01; Figure 4C-D). These results demonstrate that while traditional regression captures only part of the climatic signal, neural networks almost fully explain flowering anomalies.
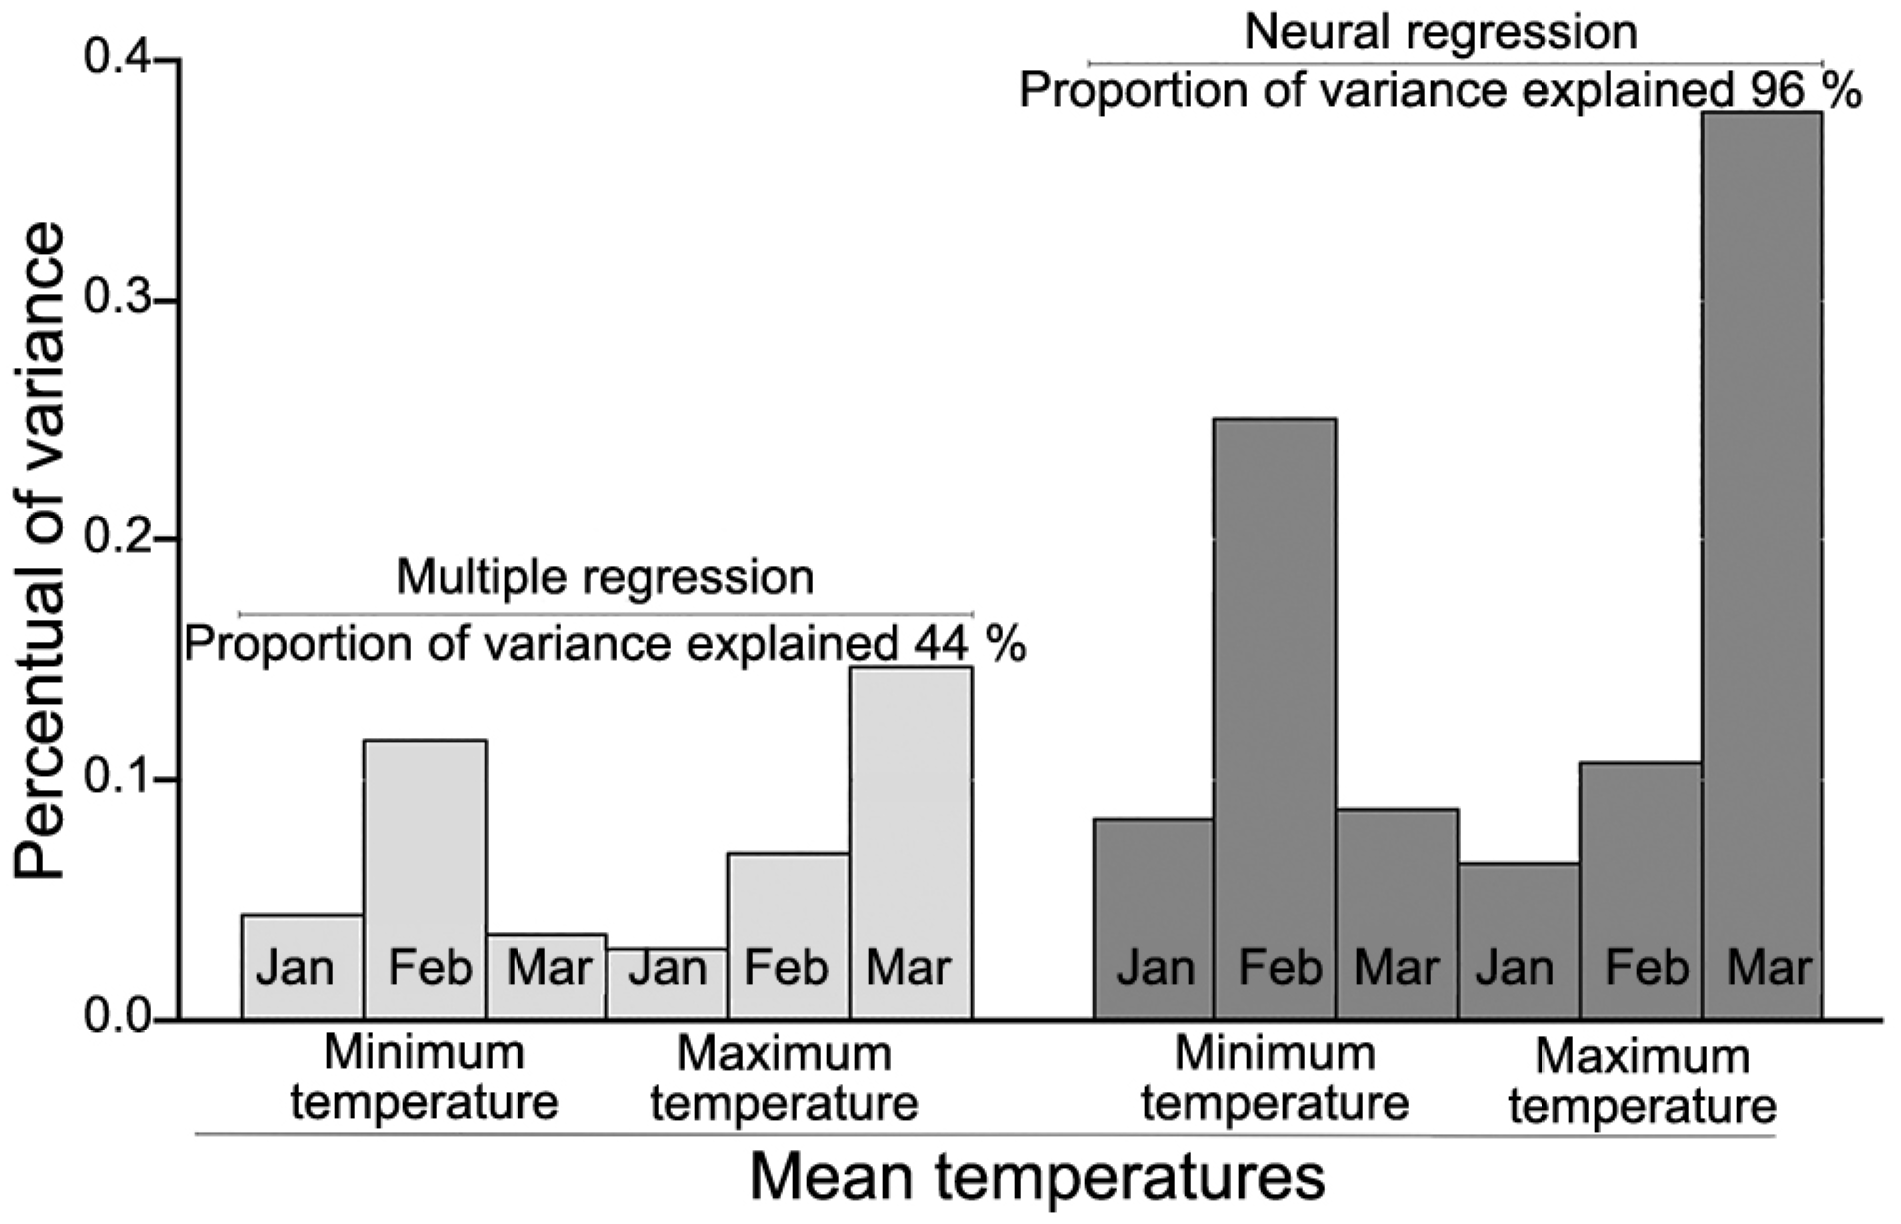
Analysis of variable relevance highlighted Feb minimum and Mar maximum temperature anomalies as the dominant predictors of flowering anomalies. While multiple regression emphasized mainly these two factors, the neural network model captured their effects along with additional climatic interactions, providing a more comprehensive representation of phenological variability (Figure 5).
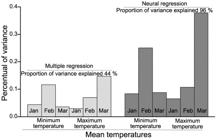
Percentage of variance explained by mean minimum and maximum temperatures of Jan, Feb, and Mar on peach flowering anomalies in Pelotas, in the state of Rio Grande do Sul, Brazil, using multiple regression and neural regression for the period 1986-2015.
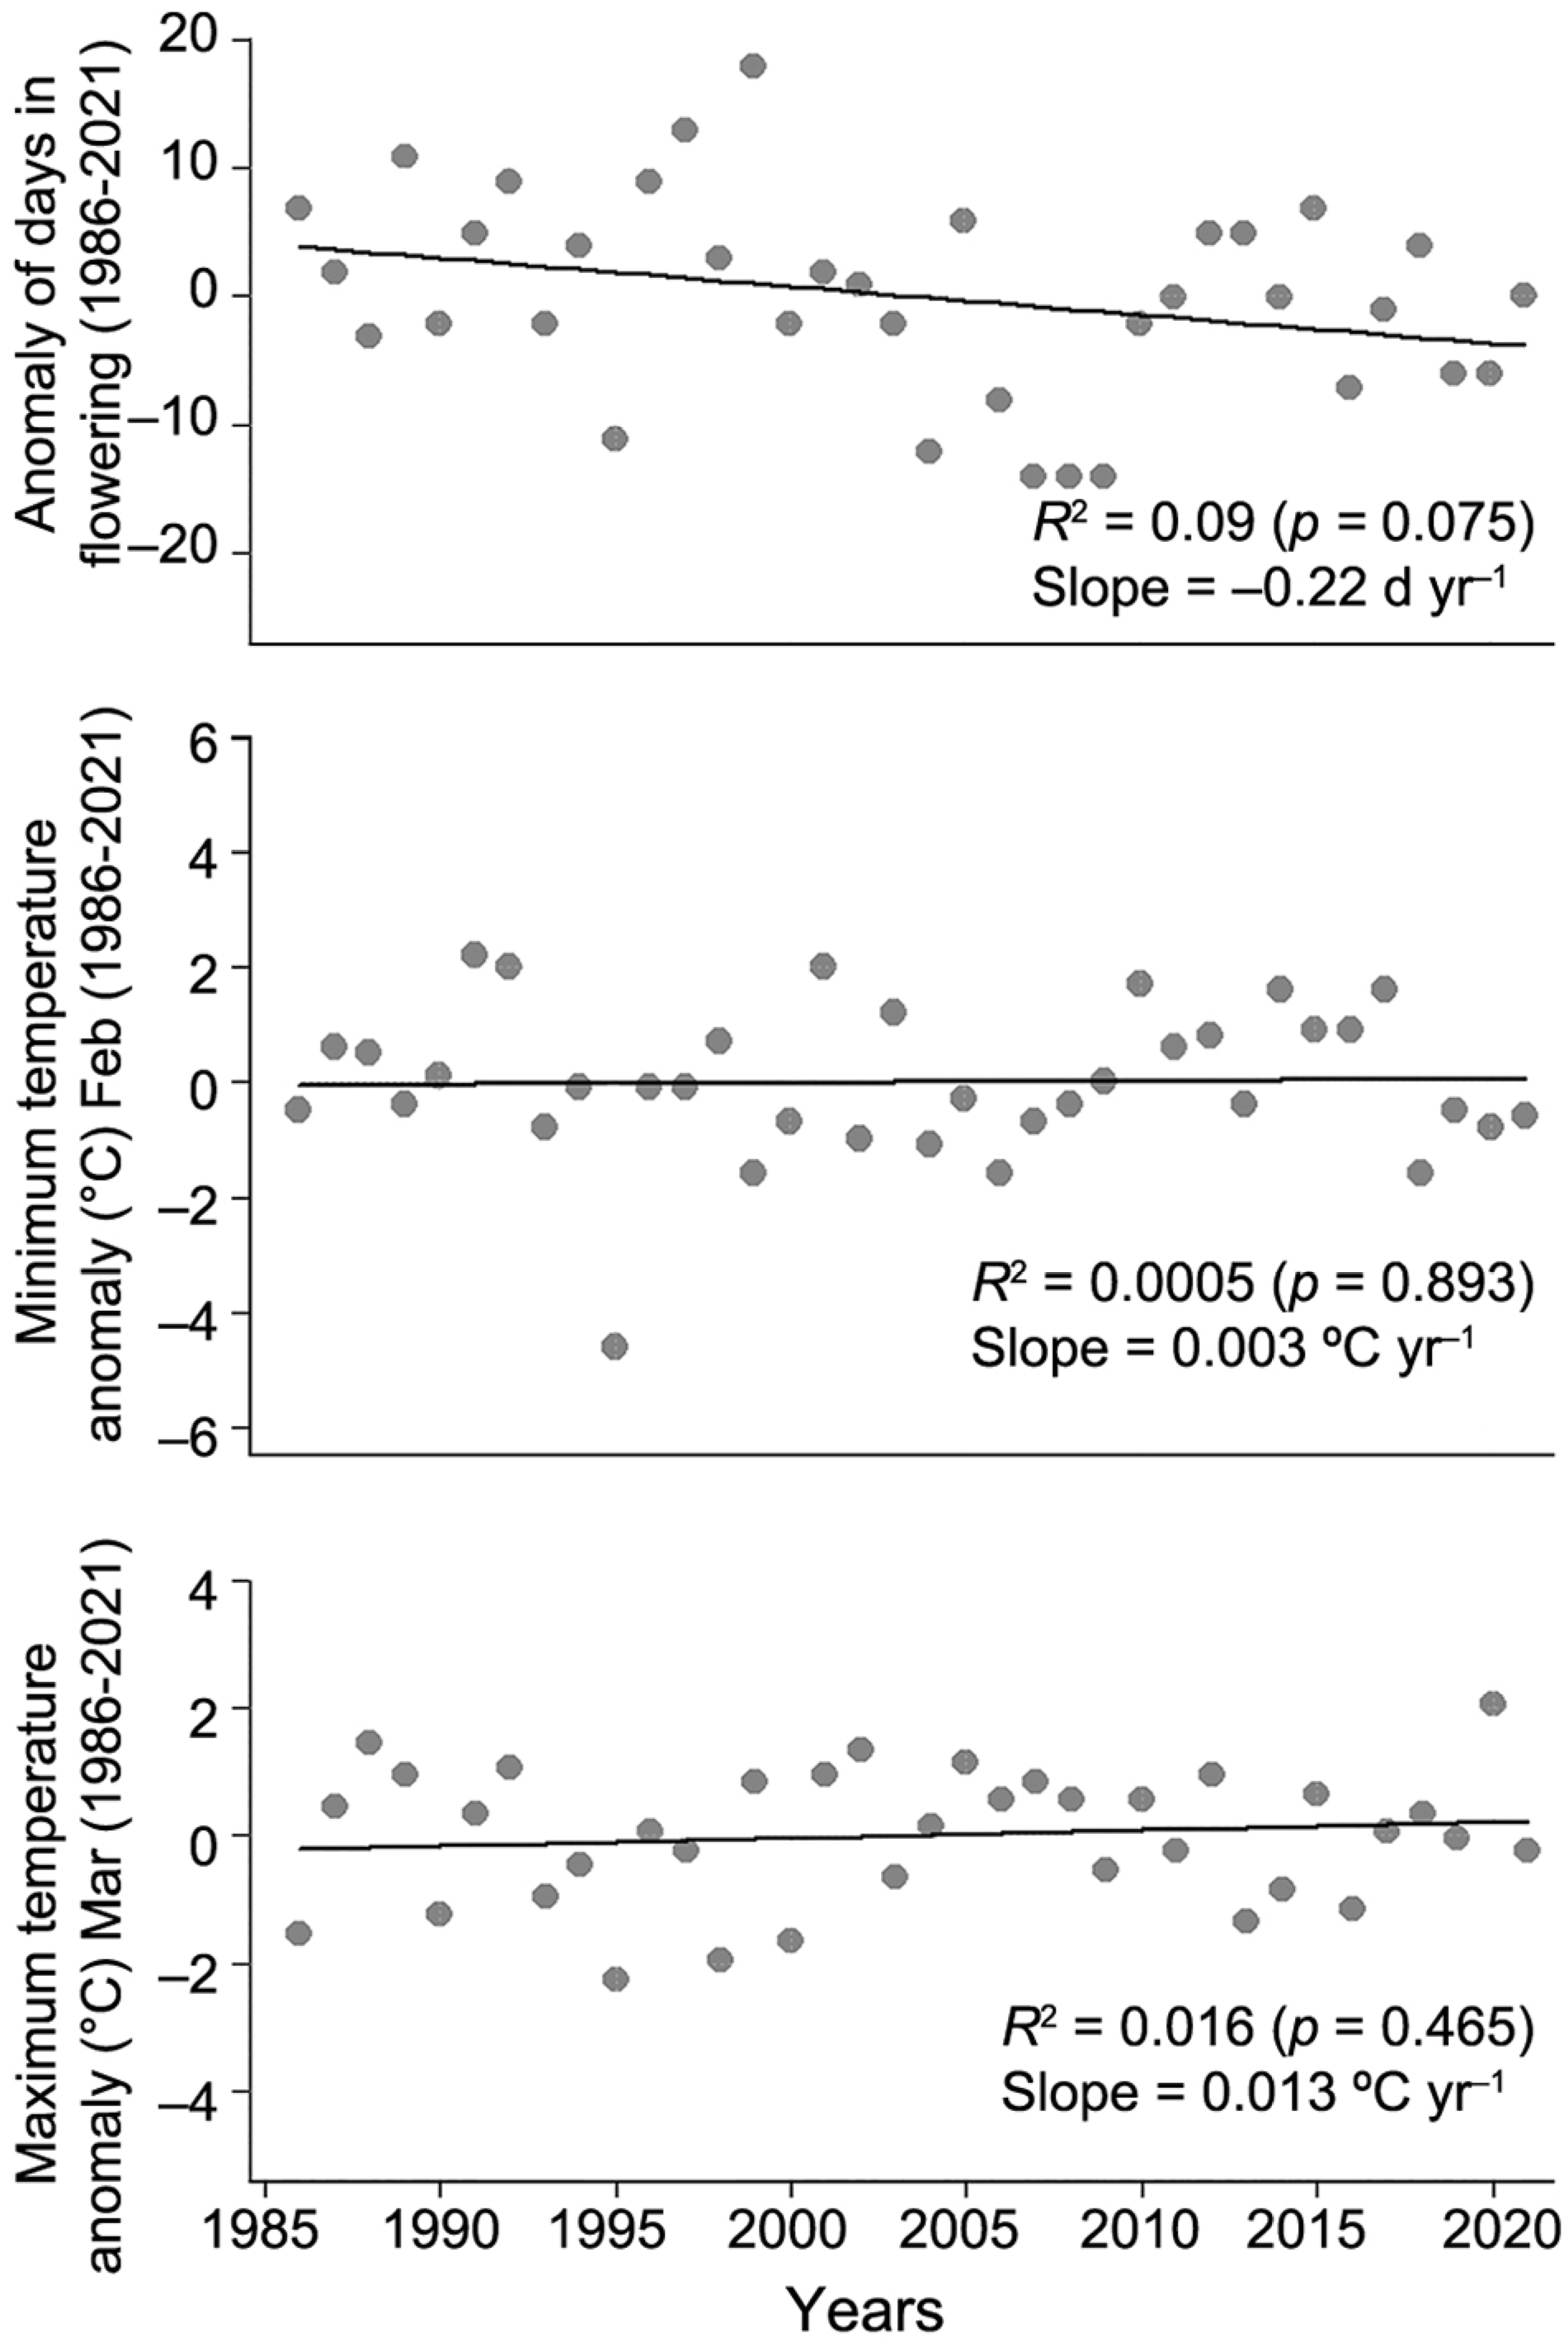
Regression analyses indicated that ‘Chimarrita’ flowering advanced at a rate of 0.22 d yr−1 throughout the historical series, while maximum temperatures increased gradually by 0.013 °C yr−1. Minimum temperatures in Feb showed no significant trend. Temporal analysis confirmed a significant anticipation of flowering dates (p < 0.01), consistent with the warming trend of maximum Mar temperatures. The negative correlation between flowering and Mar maximum temperatures suggests that continued warming during this period may further advance flowering stages (Figure 6).
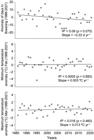
Correlations between peach flowering dates, cultivar ‘Chimarrita’, and minimum and maximum temperature anomalies during the period 1986-2021 in Pelotas, in the state of Rio Grande do Sul, Brazil. A) Flowering date anomalies relative to the mean. B) February minimum temperature anomalies. C) March maximum temperature anomalies. R2 = coefficient of determination.
Overall, these results confirm the critical role of first-quarter thermal variations in determining peach flowering behavior. Neural regression provided superior predictive power compared to multiple regression, thereby underscoring the potential of machine learning tools for phenological forecasting under increasing climate variability.
Discussion
Temperate fruit trees, which are deciduous, have developed the dormancy mechanism as protection against the adverse environmental conditions they face during winter at low temperatures (Nilsson, 2022; Fadón et al., 2020a). However, variations in the amount and thermal quality of temperature adjust the period required to meet the chilling needs of each species, either advancing or delaying phenological stages.
Changes in temperature during the floral organogenesis period, mostly the phases preceding floral differentiation, are critical to production development, particularly in the summer prior to the productive cycle (Penso et al., 2020). This was also observed in the present study, where anomalies in Feb and Mar played a decisive role. Small oscillations in environmental conditions interfere with plant metabolism, showing how delays or accelerations of metabolic processes can be stimulated by temperature.
Traditionally, budburst has been assessed by quantifying chill accumulation to evaluate dormancy release or to verify if the chilling requirement of a given cultivar has been met (Fadón et al., 2020a). On the other hand, temperature alone also contributes to extending the flowering period (Li et al., 2016). Recent studies have sought to quantify chilling during its most severe phase, from the onset to the end of winter, in order to evaluate cultivars under adverse conditions or adapt them to new environments (Cifuentes-Carvajal et al., 2024). In this study, however, the strongest effects were observed under less usual conditions, namely, during bud differentiation for the next cycle (summer-autumn).
In a case study of anomalous and early flowering affecting 20 % of a peach collection in the state of Santa Catarina, Brazil, temperature fluctuations below 13 °C were identified (Pola et al., 2019). When analyzing high temperatures between 16 and 19 °C (r = −0.92), they found that Mar values were above the historical average, which corroborates the maximum temperature anomalies found in our study for advancing budburst and, consequently, flowering. Similarly, our results confirmed that maximum temperature anomalies in Mar and minimum temperature anomalies in Feb were the dominant predictors of flowering anomalies in ‘Chimarrita’ peach trees.
In the context of dormancy physiology, these results can be interpreted through the trophic theory of dormancy and the transitions between para-, endo-, and ecodormancy phases (Lang et al., 1987; Lang, 1996). The temperature anomalies observed in Feb and Mar, corresponding to the late summer and early autumn periods, likely influenced the transition from paradormancy to endodormancy in ‘Chimarrita’ peach trees. In regions with mild winters and low chilling accumulation, such as Pelotas, in the state of Rio Grande do Sul, endodormancy tends to be shallow or even absent in a number of cultivars (Campoy et al., 2011; Pola et al., 2019). Under such conditions, the occurrence of higher-than-average temperatures during the pre-dormancy period may accelerate leaf senescence and carbohydrate translocation to buds, modifying the hormonal balance, particularly by reducing abscisic acid accumulation and enhancing gibberellin activity (Faust et al., 1997; Fadón et al., 2020b). These physiological adjustments can promote early floral induction and differentiation, leading to budburst and flowering in advance of the usual phenological schedule, reinforcing that even subtle thermal fluctuations during late summer and early autumn play a critical role in defining the timing of dormancy transitions and subsequent phenological stages in peach trees cultivated in subtropical environments.
These findings are also consistent with recent studies highlighting the influence of thermal variations on fruit tree phenology. For instance, high variability in apple (Malus domestica Borkh.) flowering has been reported when analyzing long-term series, and recurrent neural networks have shown high accuracy in predicting apple harvest dates (Marques et al., 2022; Boechel et al., 2022). In line with these studies, the neural regression model applied here exhibited superior predictive performance compared to multiple regression, effectively capturing flowering anomalies and reinforcing the potential of machine learning techniques for phenological modeling.
Furthermore, our analyses identified a non-significant temporal trend, with flowering advancing at a rate of 0.22 days per year. This shift aligns with the gradual increase in maximum temperatures, highlighting the association between flowering behavior and diurnal thermal variations. The negative correlation between flowering and Mar maximum temperatures suggests that continued warming during this period may further anticipate phenological stages.
In light of the climatic fluctuations experienced in Brazil and globally in the years preceding 2025, temperature monitoring becomes increasingly important for forecasting flowering (Tominaga et al., 2022). Despite global concerns about the reduction in chilling periods (Benmoussa et al., 2020), low-chill cultivars, such as ‘Chimarrita’, may present adaptive advantages under warming conditions.
Models analyzing climatic parameters, particularly temperature, using machine learning to predict flowering or harvest dates (Giménez-Gallego et al., 2024) provide valuable tools for refining information not easily captured by conventional statistics (Behera et al., 2021). Forecasting models of phenological stages in temperate fruit trees may also support better planning of orchard management throughout the production cycle (Day et al., 2008).
Overall, this study represents an important step towards understanding how key aspects of phenology are influenced by fluctuations in mean temperatures during the period preceding dormancy. The results not only provide valuable contributions to methodological improvement but also highlight the potential of predictive models as supporting tools for adaptation strategies and cultivar selection under increasing temperature variability.
Data availability statement
The data that support the findings of this study are available on request from the corresponding author.
Acknowledgments
We would like to thank Embrapa Clima Temperado for providing phenological data from peach trees used to carry out this study.
References
-
Alvares CA, Stape JL, Sentelhas PC, Gonçalves JLM, Sparovek G. 2013. Köppen's climate classification map for Brazil. Meteorologische Zeitschrift 22: 711-728. https://doi.org/10.1127/0941-2948/2013/0507
» https://doi.org/10.1127/0941-2948/2013/0507 - Angelocci LR, Sentelhas PC. 2010. Variabilidade, Tendência, Anomalia e Mudança Climática. ESALQ, Piracicaba, SP, Brazil (in Portuguese).
-
Anzanello R, Christo MC. 2019. Lower base temperature, thermal time and grapevine phenology and kiwi cultivars. Revista de Ciências Agroveterinárias 18: 313-322 (in Portuguese, with abstract in English). https://doi.org/10.5965/223811711832019313
» https://doi.org/10.5965/223811711832019313 -
Behera SK, Sethy PK, Sahoo SK, Panigrahi S, Rajpoot SC. 2021. On-tree fruit monitoring system using IoT and image analysis. Concurrent Engineering 29: 6-15. https://doi.org/10.1177/1063293X20988395
» https://doi.org/10.1177/1063293X20988395 -
Benmoussa H, Luedeling E, Ghrab M, Ben Mimoun M. 2020. Severe winter chill decline impacts Tunisian fruit and nut orchards. Climatic Change 162: 1249-1267. https://doi.org/10.1007/s10584-020-02774-7
» https://doi.org/10.1007/s10584-020-02774-7 -
Binoti DHB, Binoti MLMS, Leite HG, Silva A. 2013. Reduction in inventory costs in even-aged stand. Revista Brasileira de Ciências Agrárias 8: 125-129 (in Portuguese, with abstract in English). https://doi.org/10.5039/agraria.v8i1a2209
» https://doi.org/10.5039/agraria.v8i1a2209 -
Boechel T, Policarpo LM, Ramos GO, Rosa Righi R, Singh D. 2022. Prediction of harvest time of apple trees: an RNN-based approach. Algorithms 15: 95. https://doi.org/10.3390/a15030095
» https://doi.org/10.3390/a15030095 -
Campoy JA, Ruiz D, Egea J. 2011. Dormancy in temperate fruit trees in a global warming context: a review. Scientia Horticulturae 130: 357-372. https://doi.org/10.1016/j.scienta.2011.07.011
» https://doi.org/10.1016/j.scienta.2011.07.011 -
Cifuentes-Carvajal A, Chaves-Córdoba B, Vinson EL, Coneva ED, Chavez DJ, Salazar-Gutiérrez MR. 2024. Predicting floral bud progression for three peach cultivars. Agronomy 14: 240. https://doi.org/10.3390/agronomy14020240
» https://doi.org/10.3390/agronomy14020240 -
Day K, Lopez G, DeJong T. 2008. Using growing degree hours accumulated thirty days after bloom to predict peach and nectarine harvest date. Acta Horticulturae 803: 163-167. https://doi.org/10.17660/ActaHortic.2008.803.20
» https://doi.org/10.17660/ActaHortic.2008.803.20 -
Fadón E, Fernández E, Behn H, Luedeling E. 2020a. A conceptual framework for winter dormancy in deciduous trees. Agronomy 10: 241. https://doi.org/10.3390/agronomy10020241
» https://doi.org/10.3390/agronomy10020241 -
Fadón E, Herrera S, Guerrero BI, Guerra ME, Rodrigo J. 2020b. Chilling and heat requirements of temperate stone fruit trees (Prunus sp.). Agronomy 10: 409. https://doi.org/10.3390/agronomy10030409
» https://doi.org/10.3390/agronomy10030409 -
Faust M, Erez A, Rowland LJ, Wang SY, Norman HA. 1997. Bud dormancy in perennial fruit trees: physiological basis for dormancy induction, maintenance, and release. HortiScience 32: 623-629. https://doi.org/10.21273/HORTSCI.32.4.623
» https://doi.org/10.21273/HORTSCI.32.4.623 -
Giménez-Gallego J, Martínez-del-Rincon J, Blaya-Ros PJ, Navarro-Hellín H, Navarro PJ, Torres-Sánchez R. 2024. Fruit Monitoring and Harvest Date Prediction Using On-Tree Automatic Image Tracking. IEEE Transactions on AgriFood Electronics 3: 56-68. https://doi.org/10.1109/tafe.2024.3408912
» https://doi.org/10.1109/tafe.2024.3408912 - Goodfellow I, Bengio Y, Courville A. 2016. Deep Learning. MIT Press, Cambridge, MA, USA.
-
Lang GA, Early JD, Martin GC, Darnell RL. 1987. Endo-, para-, and ecodormancy: physiological terminology and classification for dormancy research. HortScience 22: 701. http://doi.org/10.21273/HORTSCI.22.5.701b
» http://doi.org/10.21273/HORTSCI.22.5.701b - Lang GA. 1996. Plant Dormancy: Physiology, Biochemistry and Molecular Biology. CABI, Wallingford, UK.
-
Lawrence DM, Fisher RA, Koven CD, Oleson KW, Swenson SC, Bonan G, et al. 2019. The community land model version 5: description of new features, benchmarking, and impact of forcing uncertainty. Journal of Advances in Modeling Earth Systems 11: 4245-4287. https://doi.org/10.1029/2018MS001583
» https://doi.org/10.1029/2018MS001583 -
Li Y, Zhang D, Xing L, Zhang S, Zhao C, Han M. 2016. Effect of exogenous 6-benzylaminopurine (6-BA) in branch type, floral induction and initiation, and related gene expression in ‘Fuji’ apple (Malus domestica Borkh). Plant Growth Regulation 79: 65-70. http://doi.org/10.1007/s10725-015-0111-5
» http://doi.org/10.1007/s10725-015-0111-5 -
Liu G, Migliavacca M, Reimers C, Kraft B, Reichstein M, Richardson AD, et al. 2024. DeepPhenoMem V1.0: deep learning modelling of canopy greenness dynamics accounting for multivariate meteorological memory effects on vegetation phenology. Geoscientific Model Development 17: 6683-6701. https://doi.org/10.5194/gmd-17-6683-2024
» https://doi.org/10.5194/gmd-17-6683-2024 -
Luedeling E. 2012. Climate change impacts on winter chill for temperate fruit and nut production: A review. Scientia Horticulturae 144: 218-229. https://doi.org/10.1016/j.scienta.2012.07.011
» https://doi.org/10.1016/j.scienta.2012.07.011 -
Marques LOD, Pasa MS, Mello-Farias P, Herter FG. 2022. Influence of budburst inducers replacing hydrogen cyanamide on phenological parameters of 'Castel Gala' apple trees. Scientia Horticulturae 295: 110867. https://doi.org/10.1016/j.scienta.2021.110867
» https://doi.org/10.1016/j.scienta.2021.110867 - Meier U, Garf H, Hack H, Hess M, Kennel W, Klose R, et al. 1994. Phenological growth stages of pome fruit (Malus domestica Borkh. and Pyrus communis L.), stone fruit (Prunus species), currants (Ribes species) and strawberry (Fragaria × ananassa Duch.). Nachrichtenblatt des Deutschen Pflanzenschutzdienstes 46: 141-153 (in German, with abstract in English).
-
Michailidis M, Karagiannis E, Tanou G, Sarrou E, Adamakis ID, Karamanoli K, et al. 2018. Metabolic mechanisms underpinning vegetative bud dormancy release and shoot development in sweet cherry. Environmental and Experimental Botany 155: 1-11. https://doi.org/10.1016/j.envexpbot.2018.06.024
» https://doi.org/10.1016/j.envexpbot.2018.06.024 -
Nilsson O. 2022. Winter dormancy in trees. Current Biology 32: 630-634. https://doi.org/10.1016/j.cub.2022.04.011
» https://doi.org/10.1016/j.cub.2022.04.011 -
Penso GA, Citadin I, Scariotto S, Santos CEM, Junior AW, Bruckner CH, et al. 2020. Development of peach flower buds under low winter chilling conditions. Agronomy 10: 428. https://doi.org/10.3390/agronomy10030428
» https://doi.org/10.3390/agronomy10030428 -
Pola AC, Della Bruna E, Petry HB, Moreto AL. 2019. Premature flowering in peach trees and its relation with temperature: A case study. Agropecuária Catarinense 32: 70-74 (in Portuguese, with abstract in English). https://doi.org/10.22491/RAC.2019.v32n1.9
» https://doi.org/10.22491/RAC.2019.v32n1.9 - Rattigan K, Hill SJ. 1986. Relationship between temperature and flowering in almond. Australian Journal of Experimental Agriculture 26: 399-404.
-
Reinoso H, Luna V, Pharis RP, Bottini R. 2022. Dormancy in peach (Prunus persica) flower buds. V. Anatomy of bud development in relation to phenological stage. Canadian Journal of Botany 80: 656-663. https://doi.org/10.1139/b02-052
» https://doi.org/10.1139/b02-052 -
Sabir IA, Hu X, Khan I, Qin Y. 2025. Regulatory mechanisms of bud dormancy: environmental, hormonal, and genetic perspectives. International Journal of Molecular Sciences 26: 2517. https://doi.org/10.3390/ijms26062517
» https://doi.org/10.3390/ijms26062517 -
Tominaga A, Ito A, Sugiura T, Yamane H. 2022. How is global warming affecting fruit tree blooming? "Flowering (dormancy) disorder" in Japanese pear (Pyrus pyrifolia) as a case study. Frontiers in Plant Science 12: 787638. https://doi.org/10.3389/fpls.2021.787638
» https://doi.org/10.3389/fpls.2021.787638 - Wilks DS. 2006. Statistical Methods in the Atmospheric Sciences. 2ed. Academic Press, San Diego, CA, USA.
- World Meteorological Organization [WMO]. 1966. Climatic Change: Report of a Working Group of the Commission for Climatology. WMO, Geneva, Switzerland.
-
Wrege MS, Faoro ID, Herter FG, Pandolfo C, Almeida IR, Alba JMF, et al. 2017. Agroclimatic zoning of European and Asian pear cultivars with potential for commercial planting in southern Brazil. Revista Brasileira de Fruticultura 39: e312. https://doi.org/10.1590/0100-29452017312
» https://doi.org/10.1590/0100-29452017312 -
Zhang H, Chuine I, Regnier P, Ciais P, Yuan W. 2022. Deciphering the multiple effects of climate warming on the temporal shift of leaf unfolding. Nature Climate Change 12: 193-199. https://doi.org/10.1038/s41558-021-01261-w
» https://doi.org/10.1038/s41558-021-01261-w
Edited by
-
Edited by:
Quirijn de Jong van Lier https://orcid.org/0000-0002-7131-552