 Invisible voids: the zero consumption real estate vacancy identification method
Abstract
As urbanisation in Brazil has escalated, so has the issue of real estate vacancy, with the number of empty houses now surpassing the housing deficit. Despite widespread criticism of this situation, information about these vacant properties remains unknown, mainly due to a scarcity of data. This study presents the Zero Consumption Real Estate Vacancy Identification Method (ZCREVIM), which utilises georeferenced electricity usage data from Belo Horizonte, Brazil. The method identifies potentially vacant properties using two spatial analysis models that process data through both absolute and relative numbers. I tested the method on a municipal scale in Belo Horizonte and on a local scale in the Centre neighbourhood. I discuss a limitation observed from the municipal scale results: it cannot be applied in areas with a significant number of illegal connections to the electricity network. From the Centre results, I thoroughly investigated 67 areas of interest to verify real estate vacancy through Google Street View, uncovering 16 demonstrably vacant buildings and 23 with solid evidence of unoccupancy. ZCREVIM provides public authorities with a tool to monitor real estate vacancy, aiding in the spatiotemporal identification of this phenomenon at the most granular urban scale: the property.
Keywords:
Real estate vacancy; Method; Identification; Electricity consumption data; Spatial analysis
Resumo
À medida que a urbanização no Brasil se intensificou, o problema da vacância imobiliária aumentou. O número de domicílios vazios é maior do que o déficit habitacional. A contraditória coexistência de um estoque construído vago e de famílias sem moradia já foi problematizada. Contudo, pouco se sabe sobre esses imóveis vazios, principalmente devido à escassez de dados. Este estudo apresenta o Método de Identificação de Vacância Imobiliária de Consumo Zero (MIVICZ), utilizando dados georreferenciados do consumo de energia elétrica em Belo Horizonte, Brasil. O método identifica propriedades possivelmente vagas usando dois modelos de análise espacial que processam dados em números absolutos e relativos. O método foi testado em escala municipal, em Belo Horizonte, bem como em escala local no bairro Centro. Discutimos uma limitação observada a partir dos resultados em escala municipal: o método não pode ser aplicado em áreas com um número significativo de conexões ilegais à rede elétrica. A partir dos resultados do Centro, 67 áreas de interesse foram investigadas para verificar a vacância imobiliária por meio do Google Street View, descobrindo 16 edifícios comprovadamente vagos e 23 com fortes evidências de desocupação. O MIVICZ fornece às autoridades públicas uma ferramenta para monitorar a vacância imobiliária, auxiliando na identificação espaço-temporal deste fenômeno na escala urbana mais fina: a propriedade.
Palavras-chave:
Vacância imobiliária; Método; Identificação; Dados do consumo de energia elétrica; Análise espacial
Introduction
Urban voids are spaces, whether plots of land or buildings, characterised by the absence of social content (Beltrame, 2013, p. 115). However, a distinction between them is perceived: land voids are gaps in the landscape, while built voids are invisible, being empty spaces hidden behind building facades. Official data reveals Brazil’s housing shortage stands at 6.355 million homes despite having 6.893 million vacant properties ready for occupancy and another 1.012 million being built or renovated (Fundação João Pinheiro (FJP), Diretoria de Estatística e Informações (DIREI), 2018, pp. 38, 48). Paradoxically, if all families in need were to move into available homes, a surplus of 583,000 properties would remain empty.
Undoubtedly, today’s society is a product of our capitalist socio-economic background. According to Marx (1990), this system operates through crises. Given the excessively unequal distribution of labour profit, it maintains its productive forces in contradictory relations. Marx believed this would eventually collapse the system. However, capitalist production relations persisted throughout the 20th century. Intrigued by this scenario, Henri Lefebvre (1990) sought to understand how they perpetuated themselves. The philosopher argued that the system survives by organising elements of social practice in space, thereby spatialising new social relations. Thus, space reproduces the contradictions inherent in capitalist production.
Housing production, as part of the general production of space, follows the logic of capital (Kapp et al., 2005, p. 37). This means that the simultaneous existence of a housing deficit and a stock of vacant homes is not a coincidence but evidence of the disproportionate distribution of wealth. In Brazil, there is no strict lack of housing. We have a socio-economic mismatch between vacant built assets and families needing housing. The real estate market’s pursuit of capital accumulation creates a surplus of properties aimed at the upper and middle classes—those who constitute a solvent demand (Santiago, 2015, p. 92). Since the construction industry produces durable goods, the housing market operates through the artifice of innovation, encouraging constant consumer dissatisfaction and motivating the purchase of a new—and more attractive—home. Vacant homes remain inaccessible to lower-income families due to high prices and their status as financial assets for former residents (Peixoto, 2011, pp. 106–108). Thus, capitalist housing production generates vacant built stock.
Another duality where vacancy plays a central role is the paradoxical relationship between voids in central areas and urban perimeter expansion (Monte-Mór, 2007, 2014). During the Fordist-Keynesian period, cities became associated with vices, diseases, pollution, and social segregation. Lefebvre (2003) argued that industrial logic in urban centres drove their “explosion”. Those who could choose their residence left central areas for new ways of living. The “New Urbanism” emerges, aligning with the marketing strategies of the new developments, particularly prevalent in the gated community market (Soja, 2000, p. 250).
In Belo Horizonte, this “explosion” began in the 1970s and gained momentum in the 1980s and 1990s (Lemos, 1994). During this period, the upper class migrated from central areas to new real estate frontiers, leading to economic dispersion and a decline in the region’s significance. This cyclical population and economic emptying process contributes to the area’s degradation. Thus, the physical deterioration of the built environment and the prevalence of vacant properties in central areas are a consequence of emerging new centralities and the abandonment of the Centre (Pontes, 2006, pp. 58–59).
Despite horizontal city growth and inadequate housing, vacant and underoccupied buildings suitable for habitation exist throughout Belo Horizonte and its Metropolitan Region (RMBH). Statistics show that the housing deficit could be solved in this region, with a surplus of 35,113 vacant homes (FJP, 2018, pp. 38, 48).
This conflicting scenario cannot be reduced to a simplistic correlation between indexes. Indeed, they shed light on the simultaneity between abundance and poverty, highlighting the problem of real estate vacancy. Despite its significance in contemporary urban space construction, government and national research institutions neglect it. Currently, the only national data on residential vacancy comes from the decennial census by the Brazilian Institute of Geography and Statistics (Instituto Brasileiro de Geografia e Estatística - IBGE), with no figures on non-residential vacancy. This data gap hinders the development of comprehensive housing policies.
To address the scarcity of data, researchers worldwide have turned to unconventional data sources for insights into urban issues. Longley et al. (2018, p. 9) noted that we cannot always rely on field surveys for continuous data, as fiscal constraints in many countries jeopardise them, which depend on significant capital, time, and labour investment. Moreover, Kumagai et al. (2016, p. 709) highlighted the limitations of field surveys in accurately estimating real estate vacancy, noting that owners often do not report properties intended for future use as vacant. This shift towards unconventional data has led to the discovery of more dynamic, economical, and detailed ways to identify and study real estate vacancy.
The rise of big data, particularly consumer data from everyday transactions, is proving highly effective in analysing societal behaviour patterns (Longley et al., 2018, p. 8). Among these, municipal service and infrastructure data, also known as utility data, provides insights into the consumption of resources like electricity, water, telephone lines, and broadband services by linking each address to utility lines. This connection allows for precise urban analysis by associating consumption with specific properties. Moreover, utility data is often recorded over extended periods, boasts excellent spatiotemporal resolution, and encompasses many human activities (Pan et al., 2020, p. 2). However, its limitations can vary based on the goals of the investigation and the nature of the database used. Therefore, researchers must fully understand the data, process it effectively, and accurately present its limitations.
I reviewed four studies that used utility data to study real estate vacancy. Kumagai et al. (2016) assessed hydrant data’s effectiveness in Neyagawa, Japan, comparing it to traditional field data. Haramati and Hananel (2016) used water consumption data to explore the impact of “ghost apartments” on urban diversity in Tel-Aviv and Jerusalem. Li et al. (2019) estimated rural vacancy in China using annual electricity consumption data, while Pan et al. (2020) analysed residential vacancy in Changshu, China, through municipal water consumption data. These studies conducted analyses at municipal and regional scales. All achieved satisfactory results, validating the presented methods through comparison with official data or in loco observations. To my knowledge, no such studies have been conducted in Brazil up to this point.
I sought data from utility providers in Belo Horizonte: Companhia Energética de Minas Gerais (CEMIG) and Companhia de Saneamento de Minas Gerais (COPASA). Water is typically metered at a single point for an entire building, while electricity is metered individually per unit. Therefore, COPASA’s data can categorise buildings as “water-consuming” or “non-water-consuming”, while CEMIG’s data can identify the proportion of units not consuming electricity. COPASA’s data might not effectively identify underutilised buildings as they would still be categorised as “water-consuming”, but it helps identify completely vacant buildings.
Correspondence with both companies began in September 2018 to determine the suitability and availability of their data for the research, as they do not maintain an open database. On November 13 2018, a COPASA representative informed me they do not have a georeferenced database. However, such data could pinpoint addresses where properties are vacant. On August 21 2019, CEMIG provided anonymised data identifying the billing status of energy meters in Belo Horizonte as of June 2019. Access to more detailed data from CEMIG could enhance the study, especially regarding the duration of vacancy status. This could differentiate properties vacant for unusually long periods from those newly on the real estate market.
To illuminate invisible voids, I introduce the Zero Consumption Real Estate Vacancy Identification Method (ZCREVIM). This method identifies vacant properties by processing municipal service and infrastructure data to map the non-consumption of utility services. This study will apply ZCREVIM using electricity data from CEMIG for Belo Horizonte.
Study area and data
Study area
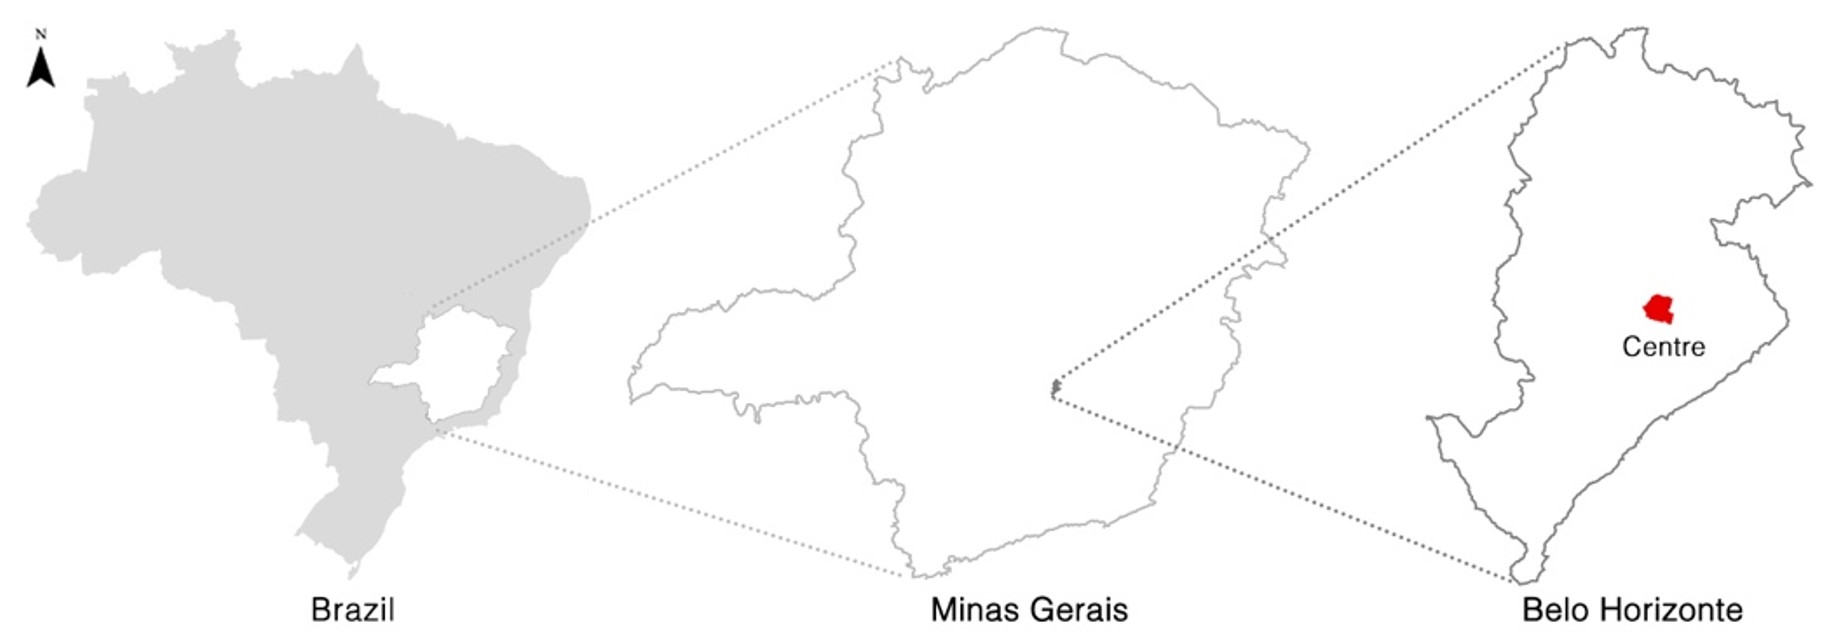
Belo Horizonte, the capital of Minas Gerais in Brazil’s Southeast (Figure 1), was inaugurated on December 12, 1897. Brazil’s first planned city was conceived to embody the new republican virtues of rationality and progress. The city was initially structured into three concentric zones (Figure 2), with a circular avenue, the Do Contorno Avenue, enclosing the Urban Zone (yellow area) where the Centre neighbourhood lies (red limit). Surrounding this were the Suburban and Rural Zones, forming a green belt (Vilela, 2006, p. 37).


- Original plan of Belo Horizonte. Source: Planta Geral Da Cidade de Minas Organisada Sobre a Planta Geodesica, Topographica e Cadastral Do Bello Horisonte Pela Comissão Construtora Da Nova Capital Sob a Direção Do Engenheiro Civil Aarão Reis e Approvada Pelo Decreto No 80 de 15 de Abril de 1985 [sic], (Belo Horizonte, 1985). Modified by the author.
By the 1930s, Belo Horizonte began expanding rapidly, with high-rise buildings cropping up in the Centre (Vilela, 2006, pp. 47–49). Over time, the city extended beyond its original boundaries, leading to the rise of new economic hubs that drew residents away from the Centre, resulting in a 44.16% population decline there from 1980 to 2000 (Pontes, 2006, pp. 58–59).
Despite its planned beginnings, Belo Horizonte’s growth has been haphazard since the 1930s. It is now Brazil’s sixth most populous capital, covering an area of 331.40 km2 with an estimated population of 2,521,564 (IBGE, 2010c, 2020). The larger region, including the RMBH and its Metropolitan Outskirt, consists of 50 municipalities, spans 14,979.10 km2, and houses approximately 6,006,091 people (IBGE, 2010c, 2020).
Data
CEMIG
CEMIG supplied a CSV file with anonymised data on the billing status of electricity meters in Belo Horizonte for June 20191.
Electricity from power lines passes through a meter installed by CEMIG, which computes electricity consumption. CEMIG employees monitor meters and register consumption, so the company issues the monthly electricity bill to the consumer unit. This means that one meter corresponds to one consumer unit.
Meters are classified as active if connected to the power lines and bills were issued by CEMIG or inactive if they are disconnected without issued bills. Active meters are further divided based on electricity consumption: those with consumption greater than zero (consume zero = no) and those with consumption equal to zero (consume zero = yes). Therefore, as summarised in Table 1, there are three types of consumer units:
Type 1 units consumed electricity. Type 2 units, once they did not consume electricity, received an electricity bill in the “minimum payment” category. This means the unit’s general electricity switch was off, though the consumer did not request that CEMIG disconnect the meter from the power lines. Finally, Type 3 units, the ones with disconnected meters, can be related to two situations:
S1 = The consumer requested the disconnection of the meter.
S2 = The consumer has been in default for over 90 consecutive days, and the CEMIG disconnected the unit’s meter.
The location of these units is not recorded by their actual addresses but by the nearest utility pole’s coordinates, typically 10 meters away2. Thus, precisely matching consumer units to specific properties will not be possible, especially in dense areas like the city centre, where multiple units may share a pole. However, this 10-meter standard allows for accurate local analysis.
The dataset contains 1,142,309 entries, each representing a meter’s billing status, consumption, and the location of its utility pole. Let us associate the billing status of a consumer unit with its occupation status (Table 2):
Considerations on electricity distribution in Belo Horizonte
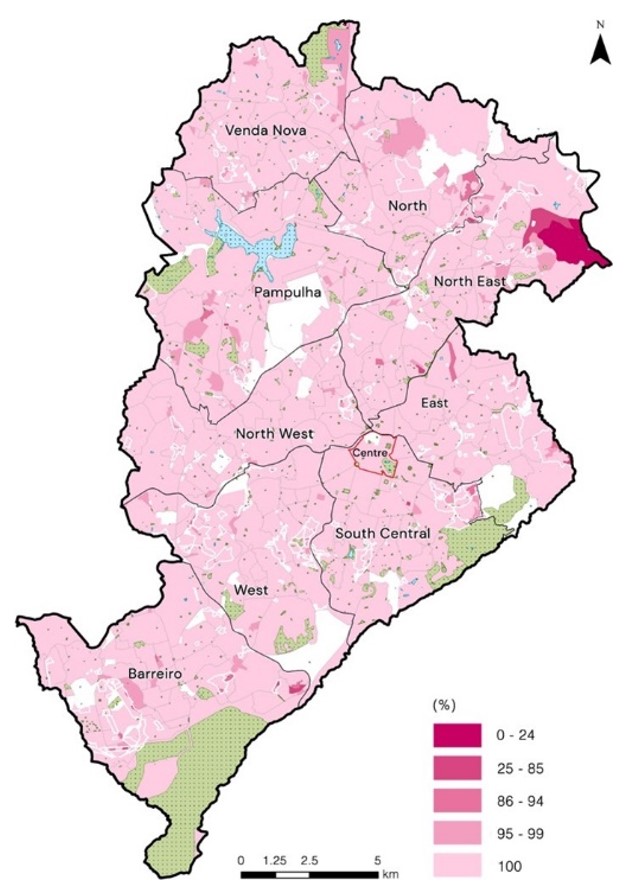
The CEMIG supplies electricity to 96% of Minas Gerais state (CEMIG, 2021). This service reaches practically all anthropised areas in Belo Horizonte, as depicted in Map 1. Most census tracts have 100% of their domiciles supplied with electricity, mainly from the CEMIG. In fact, few of them have less than 85% of houses supplied by the company, including the census tracts in villages and favelas3, highlighted by the white limit in both Map 1 and Map 2.

Map 1 - Percentage of private permanent domiciles supplied with electricity from the distribution company in Belo Horizonte. Source: Elaborated by the author with data from the 2010 Demographic Census (IBGE, 2010c) and BHGeo (PRODABEL, 2020).

Map 2 - Percentage of private permanent domiciles with electricity from the distribution company and with an individualised meter in Belo Horizonte. Source: Elaborated by the author with data from the 2010 Demographic Census (IBGE, 2010c) and BHGeo (PRODABEL, 2020).
Electricity reaches homes through CEMIG’s meter, each representing a consumer unit, typically a single property. This setup ensures that each property’s electricity use is measured separately. Sometimes, though, one consumer unit might cover multiple properties, indicating “adjacent properties” (Brasil, 2014). Map 2 reveals that individually metered properties are more common in regulated urban areas, particularly in the South-Central region, but less so in villages and favelas (white limit).
In essence, Map 1 illustrates that Belo Horizonte has broad and consistent electricity distribution, supporting the use of electricity consumption data for studying real estate vacancy. Map 2 indicates that many properties have their own meters, lending good accuracy to this study. Still, accuracy improves in areas with more individually metered properties. This is because CEMIG’s information refers to consumer units (or meters), and real estate vacancy should be ideally identified by properties. Hence, in this study, individual and adjacent properties will have the same weight since both correspond to a single meter.
BHGeo
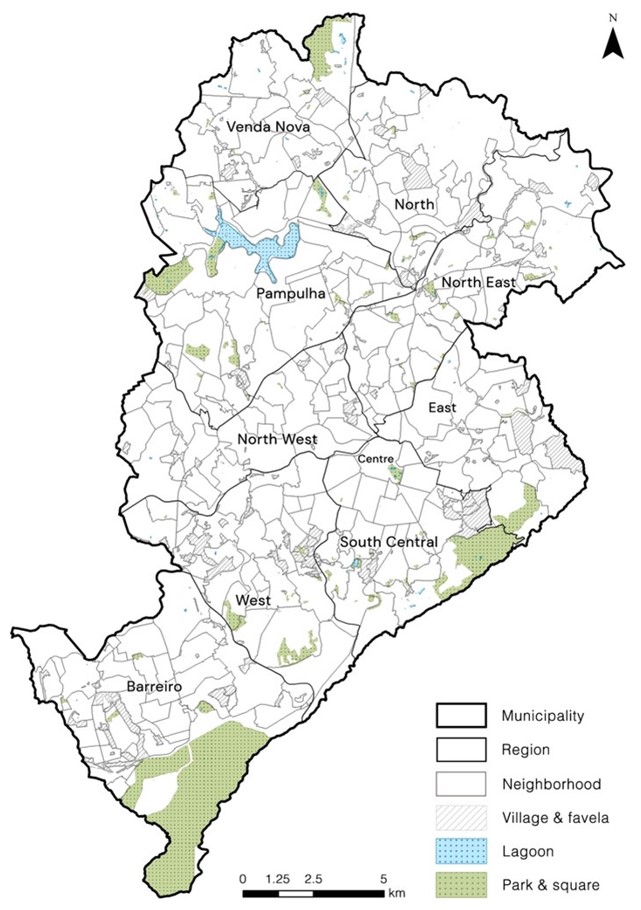
On May 12, 2020, I collected geographic data on the open-access portal BHGeo to construct Belo Horizonte’s base map. I used the following shapefiles: municipal, regional, and neighbourhood limits; lagoon; park; square; village; and favela4. This base map—including its colour and hatch code—will be the same for the following.

Map 3 - Base map. Source: Elaborated by the author using data from the BHGeo portal (PRODABEL, 2020).
Method
Overview
This study defines real estate vacancy as the proportion of properties in an area not used for residential or commercial purposes. The analysis is based on properties that showed no electricity consumption in June 2019, specifically Type 2 and Type 3 units.
Real estate vacancy will be quantitatively analysed using absolute and relative numbers. To illustrate this, consider two city areas with the same proportion of vacant properties, calculated as the number of vacant units (Type 2 and Type 3) divided by the total number of properties. One area contains multi-family high-rise buildings, while the other holds single-family homes. Although these areas have identical relative vacancy rates, the absolute number of vacant units is higher in the area with high-rise buildings due to the greater number of units per building.
This distinction is crucial when examining vacancy at a local scale. For example, if one utility pole serves 400 units, with 200 vacant, and another serves only 4 units, with 2 vacant, they would appear equivalent in relative terms (both having a 50% vacancy rate). However, in absolute terms, the utility pole serving high-rise buildings has 198 more vacant units than the one serving single-family homes. While relative vacancy rates provide a percentage-based comparison, absolute numbers highlight the scale and impact of vacancy. Incorporating both perspectives offers a more nuanced and accurate assessment of the phenomenon.
Data processing
Let me delimitate the frameworks for the proposed application of ZCREVIM5: its timeframe is June 2019, and its location is Belo Horizonte. The goal is twofold: to spatially analyse real estate vacancy using quantitative measures of both absolute and relative densities. I created two models: M1 evaluates absolute densities, and M2 focuses on relative densities. The last framework, the methodological one, establishes reproducible and defensible criteria for data processing, as depicted in Figure 3.

Data collection and objective setting mark the completion of phase T1. Subsequently, using ArcGIS, I processed the raw data, linking it to Belo Horizonte’s territory as point features. Each point represents consumer units at the location of their respective utility poles. Overlapping points denote units sharing a pole.
In phase T3, after normalising the data, I first separated consumer units by type using the Select by Attributes tool, each type forming a distinct layer. Then, I applied the two geoprocessing models:
In M1, I used the Point Density tool to determine appropriate radii for analysing different scales. Through this process, I established that a 600-meter radius is suitable for municipal-level analysis, and a 30-meter radius is ideal for local-level analysis. This approach enabled me to identify absolute density intervals of consumer units in Belo Horizonte and in the Centre. I selected the natural breaks visualisation method to highlight class distinctions.
For M2, first, I determined the percentage of consumer unit types per pole using the R software, disaggregating and subsequently aggregating the data by location, as shown in Table 3. In other words, this process quantified the relative number of each unit type at each pole, with ArcGIS used to map these as point features. Next, I employed the Hot Spot tool to identify clusters with high or low relative densities. I adjusted the data to correspond with the geographic boundaries of the analysed areas, specifically Belo Horizonte and its Centre. I used distances of 600 metres and 30 metres, respectively, to define neighbourhoods. I then prepared and exported the maps.
Results
After applying territorial analysis models M1 and M2, I created maps to show the absolute densities and clusters of consumer units’ relative values in Belo Horizonte and its Centre neighbourhood for June 2019. In addition to a brief description of these maps, I will point out features essential for evaluating this application of ZCREVIM. While this study mainly addresses real estate vacancy concerning Type 2 and Type 3 units, the analysis of Type 1 units also offers crucial insights into the findings.
Municipal scale
M1
Map 4 and Map 5 reveal a clear link between areas with the highest density of consumer units and those with the highest density of occupied consumer units (Type 1), notably in central areas. This suggests that regions with many consumer units, such as the Centre, also have many occupied ones. However, villages and favelas, despite having a high density of consumer units, do not follow this trend in terms of occupancy.

- Area 11. A possibly vacant building for commercial and/or services use. All its windows and doors are closed, and the façade has a “unit for rent” sign. Source: Google Street View (Google Maps, 2024) [reference date: April 2019].

- Area 24. The Guaicurus Street House, on the right, is a listed vacant single-family house. It is currently waiting for refurbishment funding to become a museum (Marques, 2019). On its left, there is a possibly vacant building for commercial and/or services use. All its gates are closed. Source: Google Street View (Google Maps, 2024) [reference date: August 2019].

Map 4 - Absolute density of consumer units in Belo Horizonte. Source: Elaborated by the author with data from CEMIG (CEMIG, 2019) and BHGeo (PRODABEL, 2020).

Map 5 - Absolute density of Type 1 consumer units in Belo Horizonte. Source: Elaborated by the author with data from CEMIG (CEMIG, 2019) and BHGeo (PRODABEL, 2020).
Map 6 and Map 7 highlight zones significant for assessing real estate vacancy, with a notable overlap in locations with high vacancy rates. Map 7 intensifies the findings of Map 6, indicating a common trend. The Centre is a primary area of interest in both maps, but villages and favelas are also noted for their high-density classifications. In Map 7, the Centre and a section of Aglomerado da Serra favela in the South-Central region are specifically identified as having the highest densities.

- Area 5. Bahia Shopping (secondary entry) is a vacant building for commercial and/or services use. Only 500m2 of its 10,000m2 are being used for parking (Rennó, 2019). Source: Google Street View (Google Maps, 2024) [reference date: May 2019].

- Area 19. From the left to the right. First, Sol Belo Horizonte Hotel is a vacant building for commercial and/or services use. The hotel tower is vacant, and only the parking lot area is currently in use (Rennó, 2019). Second, Bahia Shopping (main entry) is a vacant building for commercial and/or services use. Only 500m2 of its 10,000m2 are being used for parking (Rennó, 2019). Third, there is a possibly underoccupied building for mixed-use. There are sale and rent signs on its facade. Source: Google Street View (Google Maps, 2024) [reference date: May 2019].

Map 6 - Absolute density of Type 2 consumer units in Belo Horizonte. Source: Elaborated by the author with data from CEMIG (CEMIG, 2019) and BHGeo.

Map 7 - Absolute density of Type 3 consumer units in Belo Horizonte. Source: Elaborated by the author with data from CEMIG (CEMIG, 2019) and BHGeo (PRODABEL, 2020).
The strong link between the villages and favelas and the highlighted areas in Map 6 and Map 7 prompts an important question: Do these regions have many empty properties? Examining Map 8 and Map 9 helps address this concern, revealing that villages and favelas (highlighted by the white limit) do not exhibit a significant number of unoccupied homes, nor are they underpopulated. These areas are densely populated.
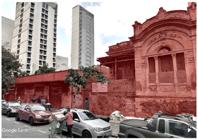
- Area 24. The former Imperial Palace Hotel is a listed vacant building for commercial and/or services use. The building is vacant, and only the parking lot area is currently in use (Marques, 2019). Source: Google Street View (Google Maps, 2024) [reference date: August 2019].

- Area 57. The former Copiadora Brasileira is a listed vacant building for commercial and/or services use. Since the company’s bankruptcy, the building remains vacant (Oliveira, 2018). Source: Google Street View (Google Maps, 2024) [reference date: August 2019].

Map 8 - Vacant domiciles in Belo Horizonte. Source: Elaborated by the author with data from the Demographic Census (IBGE, 2010a) and BHGeo (PRODABEL, 2020).

Map 9 - Demographic density in Belo Horizonte. Source: Elaborated by the author with data from the Demographic Census (IBGE, 2010b) and BHGeo (PRODABEL, 2020).
Thus, the analysis of CEMIG’s data does not indicate a vacancy issue in villages and favelas. Indeed, the relevant number of electricity meters illegally connected to the utility line in these areas indicates a limitation to the method6. This issue arises because when a bill remains unpaid for more than 90 days, CEMIG disconnects the service. However, residents often illegally reconnect themselves, or CEMIG staff cannot disconnect the utility line due to being barred from entering these areas7. Therefore, ZCREVIM cannot be applied in areas that have a high concentration of consumer units illegally connected to the power lines, such as most Brazilian favelas.
M2
Map 10, Map 11, and Map 12 display the distribution of high and low relative values for consumer unit types in Belo Horizonte during June 2019. Map 10 shows that high-value clusters, or hot spots, are primarily located around villages and favelas, a pattern that continues in Map 11 and Map 12. This pattern reflects the limitation of the method previously discussed.

- Area 54. The former Engineering School of the Minas Gerais Federal University (UFMG) is a listed vacant building for commercial and/or services use. Nearby this building, there are three other vacant buildings for commercial and/or services use. After six years of abandonment, in 2017, refurbishment started so they could host public administrative activities (Nascimento, 2017; Pinheiro, 2013). Source: Google Street View (Google Maps, 2024) [reference date: April 2019].

- Area 54. Former restaurant of the Engineering School of the Minas Gerais Federal University (UFMG). The Tina Martins squatter movement occupied the building; however, since their departure, the building has remained vacant (Suarez, 2016). Source: Google Street View (Google Maps, 2024) [reference date: April 2019].

- Area 43. The former Vicentão squatter settlement is a vacant building for commercial and/or services use. The building has been vacant since the settlement was forced out (Barreto, 2019). Source: Google Street View (Google Maps, 2024) [reference date: May 2019].
Notably, the Centre is an exception; it does not show high concentrations of occupied consumer units, appearing as a cold spot in Map 10 but as a hot spot in Map 12. This indicates that the Centre has both a high absolute density of possibly vacant units (as shown in Map 7) and a high relative density (shown in Map 12), supporting the choice of this area for detailed local analysis.

Map 10 - Hot spots of Type 1 consumer units in Belo Horizonte. Source: Elaborated by the author with data from CEMIG (CEMIG, 2019) and BHGeo (PRODABEL, 2020).

Map 11 - Hot spots of Type 2 consumer units in Belo Horizonte. Source: Elaborated by the author with data from CEMIG (CEMIG, 2019) and BHGeo (PRODABEL, 2020).

Map 12 - Hot spots of Type 3 consumer units in Belo Horizonte. Source: Elaborated by the author with data from CEMIG (CEMIG, 2019) & BHGeo (PRODABEL, 2020).
In essence, the method’s limitations significantly affected the M2 results at the municipal level. This stems from how the Hot Spot tool operates. It analyses the spatial distribution of point features’ relative values within the dataset. Given this, areas like villages and favelas, which display lower concentrations of Type 1 units, are marked as cold spots on Map 10. Conversely, because they show higher concentrations of Type 3 units, they are highlighted as hot spots on Map 12. Therefore, these findings become a benchmark for categorising all other data points.
Local scale
Three reasons justify choosing the Centre for a local scale analysis:
-
As highlighted in Map 2, the Centre is a region where each consumer unit is highly likely to correspond to an individual property. This ensures greater accuracy in the results.
-
Map 6, Map 7 and Map 12 pinpoint the neighbourhood as the area of highest interest for an in-depth investigation into real estate vacancy.
-
ZCREVIM is more effective in areas with few illegal connections to electric utility lines, a scenario more common in regularised urban areas like the Centre. It is reasonable to assume that consumer units with no electricity consumption in this region are indeed vacant. Even though illegal connections may exist, their impact on the results is expected to be minimal.
M1
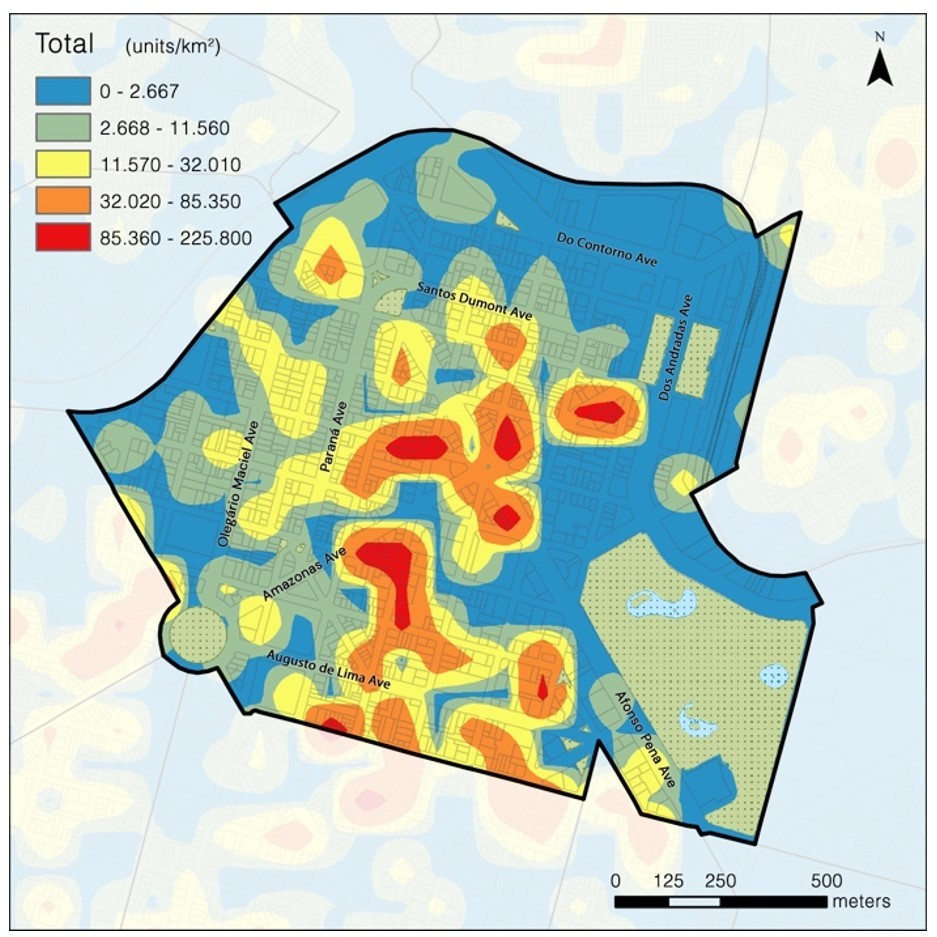
Map 13 and Map 14 respectively show the absolute densities of all registered consumer units and those likely occupied in the Centre as of June 2019. They mirror municipal-scale findings by showing a strong correlation between the spots observed on these maps, indicating nearly complete overlap.

Map 13 - Absolute density of consumer units in the Centre. Source: Elaborated by the author with data from CEMIG (CEMIG, 2019) and BHGeo (PRODABEL, 2020).
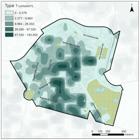
Map 14 - Absolute density of Type 1 consumer units in the Centre. Source: Elaborated by the author with data from CEMIG (CEMIG, 2019) and BHGeo (PRODABEL, 2020).
Similarly, Map 15 and Map 16 detail the densities of potentially vacant consumer units in the Centre during the same period, revealing a partial overlap with the highest densities shown on Map 13. This suggests that areas with a greater number of consumer units tend also to have higher numbers of potentially vacant ones. Nevertheless, Map 15 and Map 16 also feature high-density areas not reflected in Map 13. This analysis is summarised in Map 17.

- A demolished building whose site became a parking lot and a commercial building converted into a parking lot. Source: Google Street View (Google Maps, 2024) [reference date: July 2009 and April 2019].

- Unbuild sites destined only for parking use in Areas 28 and 42, respectively. Source: Google Street View (Google Maps, 2024) [reference date: March 2020 and August 2019].

- Commercial building converted into a parking lot in Area 29. Source: Google Street View (Google Maps, 2024) [reference dates: July 2011 and August 2019].
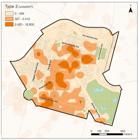
Map 15 - Absolute density of Type 2 consumer units in the Centre. Source: Elaborated by the author with data from CEMIG (CEMIG, 2019) and BHGeo (PRODABEL, 2020).

Map 16 - Absolute density of Type 3 consumer units in the Centre. Source: Elaborated by the author with data from CEMIG (CEMIG, 2019) and BHGeo (PRODABEL, 2020).

Map 17 - Areas of interest identified by M1 in the Centre. Source: Elaborated by the author with data from CEMIG (CEMIG, 2019) and BHGeo (PRODABEL, 2020).
I defined areas of interest by focusing on the two largest density ranges for Type 3 units and the largest for Type 2 units, as shown in Map 17’s legend. Where densities overlapped, I consolidated them into a single area of interest.
The primary area of interest emanates from Sete Square, the Centre’s urban heart, with Type 2 and Type 3 unit concentrations extending north and west, as depicted on Map 17. The densest part of Area 1 encompasses two commercial towers and is shown in darker red. Area 2 covers a high-rise with mixed uses.
I identified 22 areas of interest, ranging from combined Type 2 and Type 3 unit spots, as seen in Area 1, to isolated instances of each type, like Area 2. Some areas, such as Area 12, cover a small territory, suggesting a clustering of Type 2 or Type 3 units around specific utility poles. This clustering could help identify nearby properties that may be underoccupied or vacant.
M2
Map 18 illustrates clusters of high and low relative values of possibly occupied consumer units in the Centre in June 2019, pinpointing hot spots near Sete Square, Augusto de Lima Avenue, and Amazonas Avenue, despite a predominant presence of cold spots in the same region. Conversely, areas designated as cold spots in Map 18 are represented as hot spots in Map 19 or Map 20, which focus on the distribution of potentially vacant consumer units, reflecting their inverse relationship.

Map 18 - Hot spots of Type 1 units in the Centre. Source: Elaborated by the author with data from CEMIG (CEMIG, 2019) and BHGeo (PRODABEL, 2020).

Map 19 - Hot spots of Type 2 units in the Centre. Source: Elaborated by the author with data from CEMIG (CEMIG, 2019) and BHGeo (PRODABEL, 2020).

Map 20 - Hot spots of Type 3 units in the Centre. Source: Elaborated by the author with data from CEMIG (CEMIG, 2019) and BHGeo (PRODABEL, 2020).
To summarise the results, I assigned numbers to hot spots with a confidence level of 99% and 95% of possibly vacant consumer units (Tenny & Abdelgawad, 2019). Numbers follow the relevance order shown in the legend of Map 21, and overlapping points form a single area of interest. Combining these with the findings from Map 17, I obtained a sample of 67 distinct regions for an in-depth evaluation to test the effectiveness of ZCREVIM.

Map 21 - Areas of interest identified by M2 in the Centre. Source: Elaborated by the author with data from CEMIG (CEMIG, 2019) and BHGeo (PRODABEL, 2020).
Validation
The aim is to identify potential real estate vacancy using Google Street View. This approach is efficient and cost-effective and enables the investigation of many areas of interest. I favoured investigating 67 of them rather than reducing the sample because only then could I verify if there was any pattern in the results. Also, I conducted this stage of the research between September 2020 and March 2021, a period different from the reference date of CEMIG’s data, June 2019. Google Street View enabled a trip to the past: most images were captured between April and August 2019. Finally, the COVID-19 pandemic prevented on-field surveys.

Map 22 - Areas of interest in the Centre. Source: Elaborated by the author with data from CEMIG (CEMIG, 2019) and BHGeo (PRODABEL, 2020).
To start, I explored the areas in Google Street View. For Areas 1 to 22, I investigated the interior and immediate surroundings of the spots, and for Areas 23 to 67, I investigated the immediate surroundings of the points. The search focused on vacancy indicators, such as a high number of closed gates and windows, signs indicating the property was for sale or rent, and whether a property was under construction. Based on these observations, I categorised properties according to the confidence level in the findings (Table 4). They are:
Map 23 and Map 24 overlay areas of interest onto data indicating land use and the typologies of buildings in the Centre. This helped further characterise these areas and properties where I discovered vacancy signs. Additionally, I verified whether the identified buildings were listed (Belo Horizonte, 2019b).

Map 23 - Land use and area of interest in the Centre. Source: Elaborated by the author with data from CEMIG (CEMIG, 2019) and BHGeo (PRODABEL, 2020).
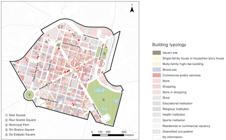
Map 24 - Typology of buildings and areas of interest in the Centre. Source: Elaborated by the author with data from CEMIG (CEMIG, 2019) and BHGeo (PRODABEL, 2020).
Discussion
I concluded that 35 of the 67 areas of interest showed signs of real estate vacancy. As discussed, an on-field survey is necessary to confirm occupancy rates in the remaining 32 areas. In these 35 areas, as summarised in Table 5, I noted evidence of real estate vacancy in 63 buildings, with some examples depicted in the following Figures. Of these, 16 buildings are confirmed vacant, and 23 are likely vacant. For the 23 buildings thought to be vacant, despite lacking on-field verification, there is compelling evidence suggesting they are unoccupied. This includes buildings above operating shops (like the one shown in Figure 4) and those entirely shut or advertised as available for rent (for instance, Figure 5). Map 23 and Map 24 indicate that the Centre primarily consists of non-residential buildings, which aligns with these findings. Moreover, among the 39 (16+23) buildings identified as vacant or likely vacant, 13 are officially listed properties.
As discussed, areas of interest resulting from M1—1 to 22—illustrate the highest absolute densities of possibly vacant consumer units. Directed sampling revealed that these areas often contain high-rise buildings and relevant commercial centres, such as Bahia Shopping (Figure 6 and Figure 7). Those two frequently identified typologies confirm that utility poles that supply many units, usually those in areas containing big buildings, are more likely to identify possibly vacant units. As suspected, the analysis of absolute densities neglects utility poles that supply few units but contain a high relative density of possibly vacant units. That is, areas that contain small buildings.
Areas resulting from M2, 23 to 67, identify high relative densities of possibly vacant units. Therefore, in these areas, I have identified small buildings, such as the former Imperial Palace Hotel (Figure 8), the Guaicurus Street House (Figure 5) and the former Copiadora Brasileira (Figure 9), among others. Figure 10 depicts the former Engineering School of the Minas Gerais Federal University (UFMG), and nearby this building, there are three additional vacant buildings designated for commercial and/or services use. I also identified two buildings formally occupied by squatter settlements, shown in Figure 11 and Figure 12, which have remained vacant since their departure.
I also noted many parking lots in the immediate surroundings of areas that identify high relative values of Type 3 units, i.e., units with meters disconnected from the electric utility line. Figure 13, Figure 14 and Figure 15 evidence that some commercial buildings have been converted into parking lots. Also, in Figure 14 and Figure 15, there are demolished buildings that became vacant sites and parking lots, respectively. Thus, disconnected meters that ceased to exist are still registered in CEMIG’s system, and this means that the company does not maintain strict control over the deregistration of inactive units from its system. Later, I confirmed this hypothesis with the company.

- Commercial building converted into a parking lot and demolished building in Area 31. Source: Google Street View (Google Maps, 2024) [reference date: July 2009 and March 2020].
The discovery of 18 hotels or motels in the targeted areas underscores the method’s effectiveness, as these types of properties are likely not operating at full capacity, suggesting they could be considered possibly underoccupied11.
Conclusions
This study presents ZCREVIM, a method for identifying real estate vacancy using utility data. The process began with the collection of data from CEMIG, which was subsequently interpreted. This data was then processed in a GIS using two geoprocessing models: M1, which visualised the absolute densities of consumer units, and M2, which highlighted clusters of high and low relative values, identifying hot and cold spots. A municipal-scale analysis revealed a limitation of ZCREVIM: it cannot be used in areas where illegal electric connections are prevalent. On a local scale, 67 areas in the Centre were selected for investigation to validate ZCREVIM. These areas were examined to characterise regions and identify potential vacancy. Finally, information from these areas was collated and the findings from this directed sampling were discussed.
Despite its limitations, the study found strong evidence that ZCREVIM can accurately identify real estate vacancy on a detailed scale. I confirmed vacancy in 35 of the 67 targeted areas, with 16 buildings being definitively vacant and 23 showing significant evidence of vacancy. The typologies observed in the areas from the M1 and M2 models were in line with expectations. The significant presence of hotels and motels further validated the method’s effectiveness. Using electricity consumption data, ZCREVIM successfully identified vacant buildings in the Centre of Belo Horizonte, offering unprecedented insights into the city’s unoccupied property.
In the municipal-scale analysis, it became clear that in villages and favelas, the presence of units with inactive meters should not be linked to real estate vacancy. Therefore, we suggest removing these point features from the GIS before processing M1 and M2. This adjustment could present new hotspots throughout the municipality.
CEMIG’s data opens up the possibility for further territorial analysis in villages and favelas. A cluster of inactive meters might pinpoint an area of village or favela, enabling their identification. Furthermore, these territories are diverse, and a closer examination reveals varying income levels (Carvalho, 2016). By analysing the spatial distribution of units based on their electricity bill payment status (Types 1, 2, and 3), insights into the socio-economic patterns of these populations can be gained on a detailed scale.
In the Centre’s areas of interest, particularly those highlighted by M2, the presence of car parks caught my attention (Figure 16). This observation supports the hypothesis that CEMIG does not rigorously monitor the deregistration of inactive units, impacting the accuracy of results. That is, in areas where building demolition rates are higher, one can expect lower accuracy rates for the results. Despite this, evidence strongly indicates that the method effectively identifies real estate vacancy. The results were satisfactory in the Centre, where building turnover rates are higher than in other parts of the city. Interestingly, this data anomaly also helps identify vacant and undeveloped lots used solely for parking12.
In future studies on real estate vacancy, the method could be expanded to different scales, like the RMBH or to a more localised analysis, examining each neighbourhood individually. It could also be applied to other areas CEMIG serves, assuming the company’s data recording practices are consistent across different locations. The researcher should consider four main factors that affect the accuracy of ZCREVIM when setting territorial boundaries for analysis. They refer to the proportion of:
-
Properties serviced by the utility company.
-
Individual metering.
-
Illegal connections.
-
Property demolitions.
Higher service and individual metering rates improve accuracy, while more illegal connections and demolitions decrease it.
Access to more detailed data from CEMIG could enhance the study, especially concerning information on consumer classes13 and the duration of vacancy status for consumer units. This distinction could differentiate properties that have been vacant for an unusually long period, for example, three (Pan et al., 2020) or six months (Haramati & Hananel, 2016), from those that have just entered the real estate market. An unresolved issue from this study involves the Othon Palace Hotel, which has been vacant since November 2018 but was not identified as an area of interest (Maciel, 2021). It is recommended that the billing status of its consumer units be investigated to refine the accuracy of the findings.
The path is open for innovative spatial analyses. By integrating the findings with additional geographic information, researchers can explore relationships between real estate vacancy and factors such as market values, crime rates, population income, and the pace of new construction. Given CEMIG’s practice of monthly data recording, it is also possible to track changes over time, allowing an examination of how real estate vacancy trends evolve over specific periods, for example, by comparing data from the same month across different years.
This approach complements official national statistics and enriches our spatial understanding of vacancy phenomena. The method could be adapted for use in other areas that maintain georeferenced electricity consumption databases. I hope other researchers will see this study as a foundation for applying ZCREVIM in their investigations, utilising a variety of utility data such as electricity, water, internet, or telephone services. These data types, collected independently of expensive field surveys, have proven effective in identifying vacancy, as demonstrated by this and other studies (Haramati & Hananel, 2016; Kumagai et al., 2016; Li et al., 2019; Pan et al., 2020). They offer high spatiotemporal resolution, a key feature for analysing short-term and long-term vacancy trends. ZCREVIM is a crucial instrument for public authorities aiming to monitor and deal with the problem of real estate vacancy.
Data availability statement
The dataset supporting the results of this article is available on SciELO DATA and can be accessed at https://doi.org/10.48331/scielodata.VKXSCV
-
1
I conducted an interdepartmental survey in CEMIG to gather the information disclosed in this section.
-
2
This is a standard distance for urban areas.
-
3
These areas correspond to Special Zones of Social Interest (ZEIS-1 and ZEIS-2), determined by Law 11.181/19, which enforced the New Belo Horizonte Plan (Belo Horizonte, 2019a).
-
4
Maintained by the Company of Informatics and Information of Belo Horizonte Municipality (PRODABEL).
-
5
Thank you to Professor Dr Ana Clara Mourão Moura, who taught me the methodological approach to data processing.
-
6
Another hypothesis is that people in these areas would live without electricity. However, Map 1 shows that most domiciles in villages and favelas are supplied with electricity.
-
7
In this case, upon reaching 90 consecutive days of non-payment, the billing status of these meters becomes inactive in the company’s system. However, the unit receives energy, and CEMIG issues the bill. The only way to not receive a bill and receive electricity is through the illegal connection made by consumers directly to the pole.
-
8
Conducting an on-field survey of the building's occupancy percentage to verify if it is underused would be necessary. According to Devecchi (2010, p. 35), a building is considered underoccupied when less than 60% of its units are occupied.
-
9
Properties occupying the upper portion of the site and only with occupied street-level stores were considered possibly vacant or vacant, not possibly underoccupied.
-
10
Sources are reports and studies in which on-field verification was conducted. I did not adopt the classification “idle buildings” as I did not find sources that verified on-field the occupancy percentage of buildings in the Centre.
-
11
I did not include them in the total of 67 buildings unless they presented evidence of real estate vacancy, such as the former Imperial Palace Hotel (Figure 7).
-
12
Research developed by Pontes (2006) points to possibilities for the requalification of the Centre from the promotion of residential use in the area.
-
13
They are residential, rural, commercial, industrial, government, public lighting, public service, and self-consumption (CEMIG, 2020).
-
Como citar:
Souza-Mc Murtrie, A. A. P. (2024). Invisible voids: the zero consumption real estate vacancy identification method. urbe. Revista Brasileira de Gestão Urbana, v.16, e20240052. https://doi.org/10.1590/2175-3369.016.e20240052
References
- Barreto, I. R. (2019). Cotidiano e acessoria técnica na ocupação Vicentão [Trabalho de conclusão de curso]. Universidade Federal de Minas Gerais, Belo Horizonte.
- Belo Horizonte. (1985). Planta Geral da Cidade de Minas organisada sobre a Planta Geodesica, Topographica e Cadastral do Bello Horisonte pela Comissão Construtora da Nova Capital sob a Direção do Engenheiro Civil Aarão Reis e approvada pelo Decreto No 80 de 15 de Abril de 1985 [sic] Belo Horizonte: Comissão Construtora da Nova Capital de Minas.
-
Belo Horizonte. (2019a). Lei No 11.181, de 8 de agosto de 2019 Belo Horizonte: Prefeitura de Belo Horizonte. Retrieved in 2020, August 15, from https://prefeitura.pbh.gov.br/sites/default/files/estrutura-de-governo/meio-ambiente/lei11181-atual.pdf?__goc_wbp__=1682980027fK2GQxDCDlsZKfGtzhyJPo4y-s
» https://prefeitura.pbh.gov.br/sites/default/files/estrutura-de-governo/meio-ambiente/lei11181-atual.pdf?__goc_wbp__=1682980027fK2GQxDCDlsZKfGtzhyJPo4y-s -
Belo Horizonte. Prefeitura Municipal. (2019b). Listagem de Bens Tombados no Município de Belo Horizonte [Dataset]. Retrieved in 2020, May 12, from https://prefeitura.pbh.gov.br/sites/default/files/estrutura-de-governo/cultura/2019/listagem_bens_tombados_bh_atualizada_11_07_2019_sujeita_atualizacao%20-%20Plan1.pdf
» https://prefeitura.pbh.gov.br/sites/default/files/estrutura-de-governo/cultura/2019/listagem_bens_tombados_bh_atualizada_11_07_2019_sujeita_atualizacao%20-%20Plan1.pdf - Beltrame, G. (2013). Vazios urbanos: notas sobre a escassez social do imóvel urbano. Interseções: Revista de Estudos Interdisciplinares, 15(1), 113-138.
- Brasil. Agência Nacional de Energia Elétrica - ANEEL. (2014). Resolução Normativa n. 141 Brasília: Diário Oficial da União.
- Carvalho, C. L. S. (2016). ‘Cidades’ dentro da Cidade? A Estrutura Socioespacial de Favelas Cariocas no Período Lula (2003-2010) Rio de Janeiro: Universidade Federal do Rio de Janeiro.
- Companhia Energética de Minas Gerais – CEMIG (2019). Billing status of electricity meters in Belo Horizonte for June 2019 [Restricted access dataset]. Belo Horizonte: CEMIG.
-
Companhia Energética de Minas Gerais – CEMIG. (2020). Glossário—Tarifação por classe Retrieved in 2020, May 12, from http://ri.cemig.com.br/servicos-aos-investidores/glossario
» http://ri.cemig.com.br/servicos-aos-investidores/glossario -
Companhia Energética de Minas Gerais – CEMIG. (2021). Quem somos Retrieved in 2020, May 12, from www.cemig.com.br/quem-somos
» www.cemig.com.br/quem-somos - Devecchi, A. M. (2010). Reformar não é construir. A reabilitação de edifícios verticais: Novas formas de morar em São Paulo no Século XXI [Tese de doutorado]. Universidade de São Paulo, São Paulo.
-
Empresa de Informática e Informação do Município de Belo Horizonte – PRODABEL. (2020). Portal de Geoprocessamento da Prefeitura de Belo Horizonte (BHGeo) [Dataset]. Retrieved in 2020, May 12, from https://bhgeo.pbh.gov.br/
» https://bhgeo.pbh.gov.br/ - Fundação João Pinheiro – FJP, & Diretoria de Estatística e Informações - DIREI. (2018). Déficit Habitacional no Brasil 2015 Belo Horizonte: Fundação João Pinheiro.
-
Google Maps. (2024). Retrieved in 2020, August 15, from https://www.google.com.br/maps/preview
» https://www.google.com.br/maps/preview - Haramati, T., & Hananel, R. (2016). Is anybody home? The influence of ghost apartments on urban diversity in Tel-Aviv and Jerusalem. Cities, 56, 109-118. http://doi.org/10.1016/j.cities.2016.04.006
- Instituto Brasileiro de Geografia e Estatística - IBGE (2010b). Base de Informações do Censo Demográfico 2010: Resultados do Universo por setor censitário [Dataset]. Rio de Janeiro: IBGE.
- Instituto Brasileiro de Geografia e Estatística - IBGE. (2010a). Base de Informações do Censo Demográfico 2010: Resultados da Sinopse por setor censitário [Dataset]. Rio de Janeiro: IBGE.
-
Instituto Brasileiro de Geografia e Estatística - IBGE. (2010c). Tabela 1301—Área e Densidade Demográfica da Unidade Territorial [Dataset]. Rio de Janeiro: IBGE. Retrieved in 2020, May 12, from https://sidra.ibge.gov.br/tabela/1301
» https://sidra.ibge.gov.br/tabela/1301 -
Instituto Brasileiro de Geografia e Estatística - IBGE. (2020). Tabela 6579—População residente estimada [Dataset]. Retrieved in 2020, May 12, from https://sidra.ibge.gov.br/tabela/6579
» https://sidra.ibge.gov.br/tabela/6579 - Kapp, S., Santos, A. P. B., & Velloso, R. C. L. (2005). Morar de outras maneiras: pontos de partida para uma investigação da produção habitacional. Topos—Revista Arq. Urb., 4, 38–45.
- Kumagai, K., Matsuda, Y., & Ono, Y. (2016). Estimation of housing vacancy distributions: Basic bayesian approach using utility data. ISPRS - International Archives of the Photogrammetry, Remote Sensing and Spatial Information Sciences, XLI-B2, 709-713.
- Lefebvre, H. (1990). Survival of capitalism: reproduction of the relations of production London: Allison & Busby.
- Lefebvre, H. (2003). The urban revolution Minneapolis: University of Minnesota Press.
- Lemos, C. B. (1994). A construção simbólica dos espaços da cidade. In R. L. M. Monte-Mor (Ed.), Belo Horizonte: espaços e tempos em construção (Vol. 1). Belo Horizonte: Prefeitura Municipal de Belo Horizonte, Assessoria de Imprensa, Universidade Federal de Minas Gerais, Faculdade de Ciências Econômicas, Centro de Desenvolvimento e Planejamento Regional.
-
Li, J., Guo, M., & Lo, K. (2019). Estimating housing vacancy rates in rural China using power consumption data. Sustainability, 11(20), 5722. http://doi.org/10.3390/su11205722
» http://doi.org/10.3390/su11205722 -
Longley, P., Cheshire, J., & Singleton, A. (Eds.). (2018). Consumer Data Research – An Overview. In P. Longley, J. Cheshire, & A. Singleton. Consumer Data Research (pp. 8-11). London: UCL Press. http://doi.org/10.2307/j.ctvqhsn6.3
» http://doi.org/10.2307/j.ctvqhsn6.3 -
Maciel, D. (2021, January). Imbróglio: Imóvel do Othon Palace permanece à deriva Diário Do Comércio Retrieved in 2020, May 12, from https://diariodocomercio.com.br/negocios/imbroglio-imovel-do-othon-palace-segue-a-deriva/
» https://diariodocomercio.com.br/negocios/imbroglio-imovel-do-othon-palace-segue-a-deriva/ -
Marques, A. (2019, April). Imóveis abandonados levam medo a moradores da Região Central de Belo Horizonte G1 Retrieved in 2020, May 12, from https://g1.globo.com/mg/minas-gerais/noticia/2019/04/04/imoveis-abandonados-levam-medo-a-moradores-da-regiao-central-de-belo-horizonte.ghtml
» https://g1.globo.com/mg/minas-gerais/noticia/2019/04/04/imoveis-abandonados-levam-medo-a-moradores-da-regiao-central-de-belo-horizonte.ghtml - Marx, K. (1990). Capital: A critique of political economy London: Penguin Books.
- Monte-Mór, R. L. M. (2007). Cidade e campo, urbano e rural: o substantivo e o adjetivo. In S. Feldman & A. Fernandes (Eds.), O urbano e o regional no Brasil contemporâneo: mutações, tensões, desafios (pp. 93–114). Salvador: Universidade Federal da Bahia.
- Monte-Mór, R. L. M. (2014). What is the urban contemporary world? In Neil Brenner (Ed.), Implosions/Explosions: Towards a study of planetary urbanization (Vol. 21, pp. 260-267). Berlin: Jovis.
-
Nascimento, P. (2017, April 17). Abandonados? Não Mais! Metro. Retrieved in 2020, May 12, from https://www.pressreader.com/brazil/metro-brasil-belo-horizonte/20170419/281479276291365
» https://www.pressreader.com/brazil/metro-brasil-belo-horizonte/20170419/281479276291365 -
Oliveira, C. (2018, March). Há 40 anos no Centro de BH, Copiadora Brasileira fecha as portas após falência Hoje Em Dia. Retrieved in 2020, May 12, from https://www.hojeemdia.com.br/primeiro-plano/h%C3%A1-40-anos-no-centro-de-bh-copiadora-brasileira-fecha-as-portas-ap%C3%B3s-fal%C3%AAncia-1.606578
» https://www.hojeemdia.com.br/primeiro-plano/h%C3%A1-40-anos-no-centro-de-bh-copiadora-brasileira-fecha-as-portas-ap%C3%B3s-fal%C3%AAncia-1.606578 -
Pan, Y., Zeng, W., Guan, Q., Yao, Y., Liang, X., Yue, H., Zhai, Y., & Wang, J. (2020). Spatiotemporal dynamics and the contributing factors of residential vacancy at a fine scale: a perspective from municipal water consumption. Cities, 103, 102745. http://doi.org/10.1016/j.cities.2020.102745
» http://doi.org/10.1016/j.cities.2020.102745 - Peixoto, A. C. M. (2011). Vacância residencial na Região Metropolitana de Belo Horizonte: Mobilização do estoque vago para a promoção de habitação de interesse social [Dissertação de mestrado]. Universidade Federal de Minas Gerais, Belo Horizonte.
-
Pinheiro, E. (2013, May). Antigo prédio da UFMG sofre descaso UOL. Retrieved in 2020, May 12, from https://noticias.band.uol.com.br/cidades/minasgerais/noticias/100000600888/Antigo-predio-da-UFMG-sofre-descaso-e-abandono.html
» https://noticias.band.uol.com.br/cidades/minasgerais/noticias/100000600888/Antigo-predio-da-UFMG-sofre-descaso-e-abandono.html - Pontes, M. M. (2006). Requalificação do Hipercentro de Belo Horizonte: possibilidades de inserção do uso residencial [Dissertação de mestrado]. Universidade Federal de Minas Gerais, Belo Horizonte.
- Rennó, R. (2019). Entre Bahia e Espírito Santo: Integração, circulação e requalificação no Hipercentro de Belo Horizonte [Trabalho de conclusão de curso]. Universidade Federal de Minas Gerais, Belo Horizonte.
- Santiago, R. N. (2015). Obsolescência programada no mercado imobiliário: o espaço como forma de entesouramento [Dissertação de mestrado]. Universidade Federal de Minas Gerais, Belo Horizonte.
- Soja, E. W. (2000). Postmetropolis: critical studies of cities and regions Cidade: Blackwell Pub.
-
Suarez, J. (2016, April). Ocupação se muda e vira casa de referência à vítima O Tempo. Retrieved in 2020, May 12, from https://www.otempo.com.br/cidades/ocupacao-se-muda-e-vira-casa-de-referencia-a-vitima-1.1313675
» https://www.otempo.com.br/cidades/ocupacao-se-muda-e-vira-casa-de-referencia-a-vitima-1.1313675 - Tenny, S., & Abdelgawad, I. (2019). Statistical significance. In StatPearls Publishing. StatPearls Treasure Island: StatPearls Publishing.
- Vilela, N. M. (2006). Hipercentro de Belo Horizonte: movimentos e transformações espaciais recentes [Dissertação de mestrado]. Universidade Federal de Minas Gerais, Belo Horizonte.
Edited by
-
Editor:
Rodrigo Firmino