ABSTRACT
Bottom-dwelling elasmobranchs, such as guitarfishes, skates and stingrays are highly susceptible species to bycatch due to the overlap between their distribution and area of fishing operations. Catch data for this group is also often merged in generic categories preventing species-specific assessments. Along the east coast of Australia, the Eastern Fiddler Ray, Trygonorrhina fasciata (Muller & Henle, 1841), and the Sydney Skate, Dentiraja australis (Macleay, 1884), are common components of bycatch yet there is little information about their age, growth and reproductive timing, making impact assessment difficult. In this study the age and growth (from vertebral bands) as well as reproductive parameters of these two species are estimated and reported based on 171 specimens of Eastern Fiddler Rays (100 females and 71 males) and 81 Sydney Skates (47 females and 34 males). Based on von Bertalanffy growth curve fits, Eastern Fiddler Rays grew to larger sizes than Sydney Skate but did so more slowly (ray: L∞ = 109.61, t0 = 0.26 and K = 0.20; skate: L∞ = 51.95, t0 = -0.99 and K = 0.34 [both sexes combined]). Both species had higher liver weight ratios (HSI) during austral summer. Gonadal weight ratios (GSI) were higher in the austral winter for Eastern Fiddler and in the austral spring for Sydney Skates.
KEY WORDS:
Age and growth; Rajidae; Rhinobatidae; sexual maturity
INTRODUCTION
Demersal trawl fisheries have very high bycatch rates due to the low-selectivity of the gear. Very often, this bycatch includes species of bottom-dwelling elasmobranchs. There are very few directed elasmobranch fisheries worldwide (Clarke and Rose 2005Clarke S, Rose D (2005) Regional Fisheries and Trade. Sharks, Rays and Chimaeras: The Status of the Chondrichthyan Fishes Status Survey: 24-29.), and Australia is no exception, with the majority of these occurring on mixed species assemblages (AFMA 2015Australian Fisheries Management Authority (2015) Southern and Eastern Scalefish and Shark Fishery. http://www.afma.gov.au/fisheries/southern-eastern-scalefish-shark-fishery [Accessed: 02/07/2015]
http://www.afma.gov.au/fisheries/souther...
). Bottom-dwelling elasmobranchs, such as guitarfishes, skates and stingrays are highly susceptible to bycatch due to the substantial overlap between species’ general distribution and common area of fishing operations, which normally take place on the continental shelf (AFMA 2015Australian Fisheries Management Authority (2015) Southern and Eastern Scalefish and Shark Fishery. http://www.afma.gov.au/fisheries/southern-eastern-scalefish-shark-fishery [Accessed: 02/07/2015]
http://www.afma.gov.au/fisheries/souther...
, Kaschner et al. 2013Kaschner K, Rius-Barile J, Kesner-Reyes K, Garilao C, Kullander SO, Rees T, Froese R (2013) AquaMaps: Predicted range maps for aquatic species. http://www.aquamaps.org, v. 08/2013.
http://www.aquamaps.org...
, Stevens et al. 2000Stevens JD, Bonfil R, Dulvy NK, Walker PA (2000) The effects of fishing on sharks, rays, and chimaeras (chondrichthyans), and the implications for marine ecosystems. ICES Journal of Marine Science 57: 476-494. https://doi.org/10.1006/jmsc.2000.0724
https://doi.org/10.1006/jmsc.2000.0724...
). In addition, for species such as demersal batoids, generic categories are often used in records of landings (e.g., Fiddler Rays, Skates, Rays) which can lead to the underestimation of changes in community structure and can mask reductions in populations of these K-selected strategists (Agnew et al. 2000Agnew DJ, Nolan CP, Beddington JR, Baranowski R (2000) Approaches to the assessment and management of multispecies skate and ray fisheries using the Falkland Islands fishery as an example. Canadian Journal of Fisheries and Aquatic Sciences 57: 429-440. https://doi.org/10.1139/f99-264
https://doi.org/10.1139/f99-264...
, Dulvy et al. 2000Dulvy NK, Metcalfe JD, Glanville J, Pawson MG, Reynolds JD (2000) Fishery stability, local extinctions, and shifts in community structure in skates. Conservation Biology 14: 283-293.). In more recent years, species usually discarded, like skates and rays, are now retained and sold in local markets (Stevens and Valenti 2009). These issues have served to highlight the importance of species-specific management for bycatch of these (and other) chondrichthyans where data aggregation tends to occur. Among the several species affected by these issues along the east coast of Australia are the Eastern Fiddler Ray, Trygonorrhina fasciata (Muller & Henle, 1841), and the Sydney Skate, Dentiraja australis (Macleay, 1884), Rajidae.
Trygonorrhina fasciata is a relatively common inshore batoid throughout its range (Last et al. 2009Last PR, Stevens JD, Swainston R, Davis G, Publishing C, Last PR, Stevens JD, Swainston R, Davis G (2009) Sharks and rays of Australia. CSIRO Pub, East Melbourne, 644 pp.). The species is known to occur from shore to depths of 100m and inhabits shallow soft substrate habitats and seagrass meadows (Last et al. 2009Last PR, Stevens JD, Swainston R, Davis G, Publishing C, Last PR, Stevens JD, Swainston R, Davis G (2009) Sharks and rays of Australia. CSIRO Pub, East Melbourne, 644 pp., Michael 1993Michael SW (1993) Reef sharks and rays of the world: a guide to their identification, behavior, and ecology. Sea Challengers, Monterey, California, 112 pp.). However, no definitive population data exists on this species due to previous taxonomic confusion with the Southern Fiddler Ray, Trygonorrhina dumerilii (Castelnau, 1873), and the Eastern Shovelnose Ray, Aptychotrema rostrata (Shaw, 1794). Trend analysis performed on the Fiddler Ray from the Eastern region of the Southern and Eastern Scalefish and Shark Fishery Sector (which more likely referred to T. fasciata considering the species’ distribution) suggested a decreasing population trend where the estimated CPUE of 2.96 kg km-1 in 1998 dropped and remained somewhat stable at around 0.24 kg km-1 from 1999 to 2006 (Huveneers 2015Huveneers C (2015) Trygonorrhina fasciata. The IUCN Red List of Threatened Species 2015: e.T41866A43270478. https://doi.org/10.2305/IUCN.UK.2015-4.RLTS.T41866A43270478.en
https://doi.org/10.2305/IUCN.UK.2015-4.R...
, Walker and Stuart Gason 2007Walker T, Stuart Gason A (2007) Shark and other chondrichthyan byproduct and bycatch estimation in the Southern and Eastern Scalefish and Shark Fishery. Final Report to Fisheries Research and Development Corporation. Primary Industries Research ictoria, Queenscliff, Victoria, vi+182 pp. https://doi.org/10.13140/2.1.3353.8564
https://doi.org/10.13140/2.1.3353.8564...
). Furthermore, reports indicate that T. fasciata is likely to represent approximately 20% of the combined catches of the “shovelnose/fiddler ray” species complex (Huveneers 2015Huveneers C (2015) Trygonorrhina fasciata. The IUCN Red List of Threatened Species 2015: e.T41866A43270478. https://doi.org/10.2305/IUCN.UK.2015-4.RLTS.T41866A43270478.en
https://doi.org/10.2305/IUCN.UK.2015-4.R...
) in the East Coast.
Dentiraja australis was once one of the most common skates on the continental shelf off Eastern Australia. However, evidence shows that it has declined significantly throughout its range. Fishery independent surveys off southern New South Wales (NSW) have shown that catch rates for “skates” combined have declined by 83% between 1976/1977 and 1996/1997 (Graham et al. 2001Graham KJ, Andrew NL, Hodgson KE (2001) Changes in relative abundance of sharks and rays on Australian South East Fishery trawl grounds after twenty years of fishing. Marine and Freshwater Research 52: 549-561. https://doi.org/10.1071/MF99174
https://doi.org/10.1071/MF99174...
) and that D. australis was the dominant species in the upper depth zone surveyed (200-275 m). In 2005, 29% of D. australis were retained based on observer monitored catches (Walker and Stuart Gason 2007Walker T, Stuart Gason A (2007) Shark and other chondrichthyan byproduct and bycatch estimation in the Southern and Eastern Scalefish and Shark Fishery. Final Report to Fisheries Research and Development Corporation. Primary Industries Research ictoria, Queenscliff, Victoria, vi+182 pp. https://doi.org/10.13140/2.1.3353.8564
https://doi.org/10.13140/2.1.3353.8564...
). IUCN listed the Sydney Skate as Vulnerable (VU A2bd+4bd) based upon past and continued population declines, which was thought to be higher than 30% throughout its range (Stevens and Valenti 2009Stevens JD, Valenti SV (2009) Dipturus australis. The IUCN Red List of Threatened Species 2009: e.T161637A5470186. https://doi.org/10.2305/IUCN.UK.2009-2.RLTS.T161637A5470186.en
https://doi.org/10.2305/IUCN.UK.2009-2.R...
).
Information about life history traits is pivotal for fisheries management and conservation of any species. Elasmobranch management and conservation is frequently obstructed by the lack of knowledge at population levels (Baum et al. 2003Baum JK, Myers RA, Kehler DG, Worm B, Harley SJ, Doherty PA (2003a) Collapse and conservation of shark populations in the Northwest Atlantic. Science 299: 389-392. https://doi.org/10.1126/science.1079777
https://doi.org/10.1126/science.1079777...
) and of basic biological information. The latter has been used to improve information about effects of fishing mortality and predict population recovery trajectories (Musick 1999Musick JA (1999) Criteria to Define Extinction Risk in Marine Fishes: The American Fisheries Society Initiative. Fisheries 24: 6-14. https://doi.org/10.1577/1548-8446(1999)024<0006:CTDERI>2.0.CO;2
https://doi.org/10.1577/1548-8446(1999)0...
). Understanding the age structure of a population constitutes the basis for calculations of growth rate, mortality (natural and anthropogenic) and productivity, making it amongst the most important biological data in fisheries assessments (Campana 2001Campana S (2001) Accuracy, precision and quality control in age determination, including a review of the use and abuse of age validation methods. Journal of Fish Biology 59: 197-242.). The success in management of elasmobranch fisheries is intimately related to the quality of the species catch data, whether targeted or incidental (Bonfil 2005Bonfil R (2005) The purpose of stock assessment and the objectives of fisheries management. FAO Fisheries Technical Paper 474: 6.).
Demersal elasmobranchs frequently are among the species with less information available, hindering further evaluation of stocks and restricting modelling of impacts. When such data are inadequate it is virtually impossible to assess population declines (IUCN 2001IUCN (2001) IUCN Red List Categories and Criteria: Version 3.1. IUCN Species Survival Commission, Gland, ii+30 pp.). Such concerns are not recent, and resulted in an international plan of action for conservation and management of sharks made by the Food and Agriculture Organization (FAO). This has contributed to the development of a number of studies aiming to improve knowledge about the group’s relationship with fisheries and conservation since the late 90’s (Camhi et al. 1998Camhi M, Fowler S, Musick J, Bräutigam A, Fordham S (1998) Sharks and their relatives: Ecology and Conservation. Occasional Paper of the IUCN Species Survival Commission., Walker 1998Walker TI (1998) Can shark resources be harvested sustainably? A question revisited with a review of shark fisheries. Marine and Freshwater Research 49: 553-572., Stevens et al. 2000Stevens JD, Bonfil R, Dulvy NK, Walker PA (2000) The effects of fishing on sharks, rays, and chimaeras (chondrichthyans), and the implications for marine ecosystems. ICES Journal of Marine Science 57: 476-494. https://doi.org/10.1006/jmsc.2000.0724
https://doi.org/10.1006/jmsc.2000.0724...
, Baum et al. 2003Baum JK, Myers RA, Kehler DG, Worm B, Harley SJ, Doherty PA (2003a) Collapse and conservation of shark populations in the Northwest Atlantic. Science 299: 389-392. https://doi.org/10.1126/science.1079777
https://doi.org/10.1126/science.1079777...
Clarke and Rose 2005Clarke S, Rose D (2005) Regional Fisheries and Trade. Sharks, Rays and Chimaeras: The Status of the Chondrichthyan Fishes Status Survey: 24-29., Fowler et al. 2005Fowler SL, Cavanagh RD, Camhi M, Burgess GH, Cailliet GM, Fordham SV, Simpfendorfer CA, Musick JA (2005) Sharks, rays and chimaeras: the status of the chondrichthyan fishes. IUCN SSC Shark Specialist Group, Gland, 461 pp.). The aim of this study was to estimate age, growth and body and reproductive condition dynamics of two common bycatch endemic batoids in the Eastern coast of Australia: T. fasciata and D. australis. Age and growth were assessed using vertebral band pair counts while condition indices were evaluated based on weight and the relative stage and size of gonads.
MATERIAL AND METHODS
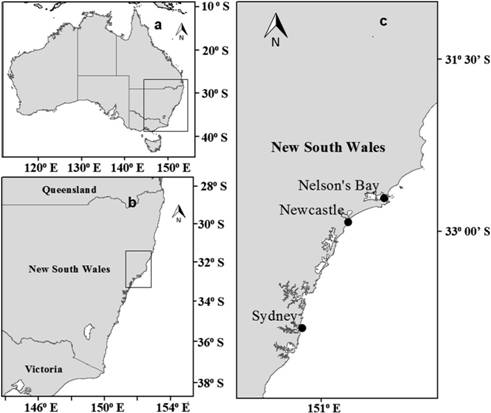
Samples were obtained by the Department of Primary Industries Fishery Observers program (DPI - Fisheries). Individuals were collected from October 2015 to December 2016; caught by commercial trawlers operating in the northern central coast of New South Wales (Fig. 1), namely the continental shelf of Sydney (33°50’S; 151°12’E), Newcastle (32°55’S; 151°46’E) and Nelson Bay (32°42’S; 152°11’E). After collection, individuals were stored frozen at the Sydney Institute of Marine Science (SIMS) where they were measured, weighted, and processed.

Map of Australia (a), New South Wales (b) and the upper central New South Wales coast (c) with landing locations of sampled individuals of Trygonorrhina fasciata and the Dentiraja australis.
Body measurements were made according to Ebert et al. (2013Ebert DA, Fowler SL, Compagno LJ (2013) Sharks of the world: a fully illustrated guide. Wild Nature Press, Plymouth, 528 pp.) with total length (Lt) measured from snout tip to tail tip (±0.1 cm). Weight was obtained to the nearest gram using digital platform scales, and a weight-length relationship (WLR) was estimated for males and females (including gravid females) separately using R (R Core Team 2018R Core Team (2018) R: A language and environment for statistical computing. Computing RFfS, Vienna. https://www.R-project.org.
https://www.R-project.org...
) according to the relationship: , where W is total weight (g), L is length (cm) and a (intercept) and b (slope) are constants.
The hepatosomatic index, which is the ratio of liver weight to total body weight (expressed as a percentage) and is used as an indicator of energy reserve, was calculated as: , where: WL = liver weight and W = total weight. Average values of HSI were calculated for combinations of sex and season (with exception of late austral summer and autumn months, due low number of samples) in order to identify periods of higher energy accumulation. Higher HSIs are normally found in periods preceding events of high metabolic activity such as migrations, reproduction, or cycles of low environmental productivity. Considering that neither of the species in this study is reported as migratory and both are endemic with relatively small distributions it is reasonable to assume that HSI seasonal changes will hinge mostly on reproduction cycles or seasonal oceanographic changes. Seasonal differences in average values of the Hepatosomatic Index between genders and species were tested through analysis of variance (two-way ANOVA) to test similarities of HSI values of males and females of both species on a seasonal basis.
A section of approximately 10 cm of the pre-caudal vertebrae for Eastern Fiddler Ray and 7.5 cm for Sydney Skates, consisting of approximately 8-10 vertebrae from the area above the pelvic girdle, was dissected from each specimen. The preparation of the vertebrae for enhancement, interpretation, and counting of growth rings was performed by washing with sodium hypochlorite (NaClO 0.05%) for 2-3 minutes and drying for 30 minutes at 60 °C before sectioning, following Goldman et al. (2012Goldman KJ, Cailliet GM, Andrews AH, Natanson LJ (2012) Assessing the age and growth of chondrichthyan fishes. Biology of Sharks and their Relatives 13: 423.). Vertebrae of less than 70 mm of diameter were mounted in polyester caster resin on numbered silicone molds to fit the saw’s clamp. Due the larger size, vertebrae with more than 70 mm were sectioned directly after being dried. All vertebrae were sectioned to a thickness of 0.4 mm using an Allied TechCut precision low-speed saw with 0.51 mm thick double diamond metal bond blades. Sections were polished using wet sandpaper of successive grits (600, 800, and 1200) to a thickness of approximately 0.3 mm and mounted on slides for reading.
Vertebral sections were examined for each set of wider opaque (calcified) and narrower translucent (less calcified) bands after the birth mark (Age 0) which was considered to be an individual growth band and represented the mark preceding one year of growth (Fig. 2) (Cailliet et al. 2006Cailliet GM, Smith WD, Mollet HF, Goldman KJ (2006) Age and growth studies of chondrichthyan fishes: the need for consistency in terminology, verification, validation, and growth function fitting. Environmental Biology of Fishes 77: 211-228.). The first band near the vertebrae centre was defined as a birth mark (from age zero) coinciding with a change in the angle of the centrum face. This represents growth differences between intra-uterine and post-natal hatching/birth in skates (Abdel-Aziz 1992Abdel-Aziz S (1992) The use of vertebral rings of the brown ray Raja miraletus (Linnaeus, 1758) off Egyptian Mediterranean coast for estimation of age and growth. Cybium 16: 121-132., Francis et al. 2001Francis MP, Maolagáin CÓ, Stevens D (2001) Age, growth, and sexual maturity of two New Zealand endemic skates, Dipturus nasutus and D. innominatus. New Zealand Journal of Marine and Freshwater Research 35: 831-842., Sulikowski et al. 2003Sulikowski JA, Morin MD, Suk SH, Howell WH (2003) Age and growth estimates of the winter skate (Leucoraja ocellata) in the western Gulf of Maine. Fishery Bulletin 101: 405-413.). Vertebrae sections were examined under a dissecting microscope with 2.0 to 3.2x magnification using transmitted light. Age counts were assigned to vertebral sections by marking individual band pairs along the corpus calcareum line on the digitalized images from birth mark to outer edge. The radius of each vertebra was measured on the corpus calcareum along a straight line to the margin to establish the vertebral radius (VR). The total length (cm) of both species was plotted against the vertebral radius (mm) and tested for a linear relationship.

Photos of vertebrae section of Trygonorrhina fasciata (left, sampling code AP085 - 632 mm TL) and Dentiraja australis (right, sampling code 053 - 328 mm DW). White dots indicated by arrows show birth mark (BM), while the remaining highlight the growth opaque bands and the bar indicate vertebral radius (VR).
Two independent, non-consecutive ring counts were made by a single reader without knowledge of the specimen’s ID, total length or disc width, previous counts, or sex. Final age estimates were assigned based on the agreement of two or more age readings. Reproducibility of the growth ring count was evaluated by age-bias plots and by the simple approach of calculating the percent reading agreement (PA = [No. agreed/No. read] x 100) within and between readings for all samples (Cailliet 1990Cailliet G (1990) Elasmobranch age determination and verification: an updated review. NOAA Tech Rep NMFS 90: 157-165., Goldman 2005Goldman KJ (2005) Age and growth of elasmobranch fishes. FAO Fisheries Technical Paper 474: 76.).
Growth curves were fit to size-at-age data using the von Bertalanffy growth model (Von Bertalanffy 1938Von Bertalanffy L (1938) A quantitative theory of organic growth (inquiries on growth laws. II). Human Biology 10: 181-213.) with total length for Eastern Fiddler Rays and for Sydney Skates: , where: Lt is the expected length at age t (in years), L∞ is the asymptotic mean length, K is the von Bertalanffy growth parameter, t0 is theoretical age at zero length. In this study, sample size was relatively small and therefore the growth curve of each species was calculated using both sexes.
Marginal increment analysis (MIA) was used in order to determine the time of band formation ( Musick and Bonfil 2005Musick JA, Bonfil R (2005) Management techniques for elasmobranch fisheries. FAO Fish Tech Paper 474, 251 pp.). The technique allows one to validate the annual nature of bands by assessing the expectation that the distance from the last band and the edge will get steadily greater through the year, being lowest right after band formation and highest at the end of the cycle, immediately prior to formation of the next band. Consistency in the periodicity of this discontinuity (large to suddenly small distance) supports the existence of consistent band formation at that interval. However, since there was a gap in sample availability during the late austral summer and autumn months (Jan-May), annual growth band formation could not be rigorously validated (see results). Therefore, age estimates presented in this study are based upon counts of growth bands which are assumed to be annual. This is not an unreasonable assumption given the existence of annual growth bands in other elasmobranch species in similar latitudes.
Maturity stage of individuals was determined for females by macroscopic examination of the gonads following a modified version of previous studies (Stehmann 1987Stehmann M (1987) Quick and dirty tabulation of stomach contents and maturity stages for skates (Rajidae), squaloid and other ovoviviparous and viviparous species of sharks. American Elasmobranch Society Newsletter 3: 5-9., 2002Stehmann MF (2002) Proposal of a maturity stages scale for oviparous and viviparous cartilaginous fishes (Pisces, Chondrichthyes). Archive of Fishery and Marine Research 50: 23-48.). Stages where defined as: I) Immature: ovarian eggs present with small ovaries (≤5 mm) and no vitellogenesis; II) Maturing: ovaries present, eggs of medium size (≥ 10 mm and ≤5 mm) and vitellogenesis producing yellow coloration; III) Mature: large ovarian eggs (≥ 10 mm) with vitellogenesis producing orange color; IV) Pregnant: Mature with presence of embryos and; V) Post-Partum: presence of birth marks, large and flaccid uterus. Maturity stages for males on a macroscopic level is frequently made by flexibility/calcification of claspers, where stages of immature, maturing and mature can usually be related in a scale where less flexible means more mature. However, because this approach is relative and conditioned by a number of external factors, maturity of males was only related to the Gonadosomatic Index (GSI), which was also calculated for females. Seasonal differences in average values of the Gonadosomatic Index between genders and species were tested using analysis of variance (two-way ANOVA) to test similarities of GSI values of males and females of both species on a seasonal basis.
RESULTS
In all, 171 specimens of T. fasciata (100 females and 71 males) and 81 D. australis (47 females and 34 males) were sampled. During the late austral summer and autumn months (January-May), sampling frequency was lower than expected, reflecting low catches of the species by the boats sampled for the observers’ program. This prevented more conclusive results from reproductive data as well age validation through Marginal Increment Analysis (MIA). Nonetheless, patterns were observed and are described in more detail below.
Length and length-weight relationships
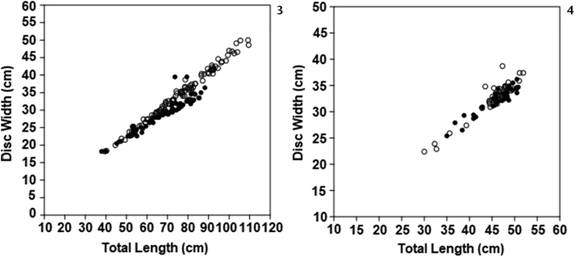
Sampled Fiddler Rays ranged between 37.9 and 109.2 cm Lt (72.53 ± 15.5) and between 220 and 8900 g total weight while Sydney Skates ranged between 22.4 and 38.7 cm DW (32.5 ± 2.89) and 160 and 1064 g total weight. The relationship between Lt and DW were linear for both species. In Fiddler Rays the relationship was Lt = 0.44469DW + 0.13879 (r2 = 0.9184, p < 0.0001, n = 171, Fig. 3) and in Sydney Skates it was Lt = 0.68255DW + 14424 (r2 = 0.89351, p < 0.0001, n = 81, Fig. 4).

Linear relationship between Total Length (Lt) and Disc Width (DW) for Trygonorrhina fasciata (3) and Dentiraja australis (4). Black dots (males) and white dots (females).

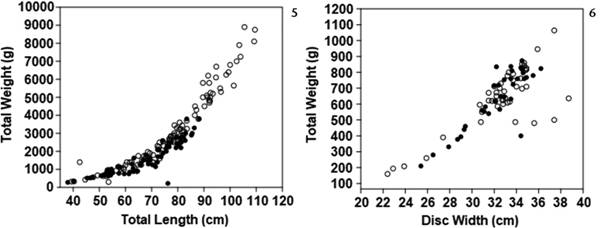
Length-weight relationship for males (black dots) and females (white dots) using total length for Trygonorrhina fasciata (5) and using disc width for Dentiraja australis (6).
There was no obvious difference in the nature of the length-weight relationships (using either DW or LT) of males vs females for either species though females tended to be bigger and heavier than males for both species, an effect that was more pronounced in T. fasciata (Figs 5, 6). Sampled males had an average (± SD) total length of 67.55 cm (±12.44 cm) and total weight of 1626.6g (±891.3 g) while among females the average length was 76.06 cm (±16.44 cm) and average total weight was 3092 g (±2118.6 g). Female specimens of D. australis had an average DW of 32.60 cm (±3.34 cm) and total weight of 647.17 g (±186.27 g), while males had an average DW of 32.23 cm (±2.5 cm) and weight of 635.67 g (±179.92 g).
Age and growth
Vertebrae of 141 individuals of T. fasciata and 72 D. australis were sectioned and read. Vertebral growth-band readability of T. fasciata was higher (3.8 ± 0.03) than D. australis (2.2 ± 0.08). Sections considered unreadable accounted for 9.3% of the slides of T. fasciata (n = 16) and 10% of D. australis (n = 8) and hence were excluded from any further analysis. Repeated age estimates agreed closely and there was no systematic bias between readings for either species. The percentage of reading agreement (PA) for T. fasciata was 95.74% and for D. australis was of 94.44%. There were significant linear relationships between the radius of pre-caudal vertebrae and total length for both species, indicating that these vertebrae were suitable structures for age determination (Table 1, Figs 7, 8).

Relationship between vertebral radius (mm) and total length (cm) with 95% confidence of Trygonorrhina fasciata (7) and for Dentiraja australis (8).
Linear relationship parameters between vertebral radius and species total length for Trygonorrhina fasciata and Dentiraja australis. Values of parameters for the equation TL = a+b*VR, where: (VR) vertebral radius, (TL) animal total length, (a) slope, (b) intercept, (n) sample size, (r2) square of regression correlation coefficient; and p is the probability of statistical significance.
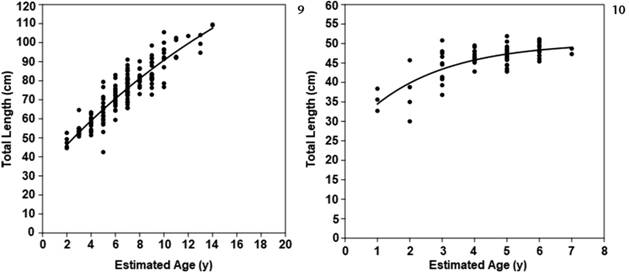
The oldest estimated age for a male of T. fasciata in this study was 10 years (Lt = 76.6 cm) whereas the largest male (Lt = 88.2cm) was estimated to be seven years old. The estimated age of the oldest female for the species was 15 years (Lt = 109.5cm) which was also the largest female. Among samples of D. australis the oldest male was estimated to be seven years old (TL = 48.7cm) while the largest male (TL = 50.8cm) was estimated to be 6 years old. The oldest female D. australis was also the largest with age estimated to be seven years (TL = 51.9cm). The growth curve for T. fasciata was described by the VBGM as L∞ = 109.61, t0 = 0.26 and K = 0.20 whereas the D. australis was L∞ = 51.95, t0 = -0.99 and K = 0.34 (Figs 9, 10, Table 2).

Von Bertalanffy growth curve for Trygonorrhina fasciata (9) and for Dentiraja australis (10). The line is the adjusted VBGM.
Summary of fitted parameter values and results for Trygonorrhina fasciata and Dentiraja australis. In parentheses are the upper and lower bounds of the 95% confidence intervals for each of the parameters.
The vertebral marginal increments for T. fasciata were highest in July, corresponding to mid austral winter (Fig. 11) and lowest in October, which corresponds to mid austral spring. In the discontinuous data obtained for samples of D. australis, the lowest marginal increment distances were present in July, decreasing from values obtained in June (Fig. 12). The highest overall values for D. australis were obtained in December (mid austral summer).
Body condition and reproductive data

Monthly averages (±SE) of marginal increments from sections of vertebral centra of Trygonorrhina fasciata (11) and Dentiraja australis (12). The values indicate the number of sampled individuals.
There were a limited number of samples available from January to May 2016 (late austral summer and autumn) for both species (n = 5, 3 T. fasciata, 2 D. australis). This was also the case for samples of D. australis in late winter and early spring, specifically between August and October, where only six individuals were caught (2 females and 4 males). These low numbers prevented a comprehensive evaluation of reproductive capacity throughout the year.
Results of the two-way analysis of variance comparing the seasonal average values of the Hepatosomatic Index (HSI) of T. fasciata indicated that seasons have a statistically significant effect (p < 0.05) (Table 3). Results of post hoc Tukey’s pairwise comparisons indicated statistically significant differences with lower values in austral winter (June - August) and higher in spring (September - November). This trend was mostly influenced by average HSI of females (Figs 13-15). Although there was a significant effect on the Gonadosomatic Index between genders, no significant differences were detected in the seasonal average GSI of T. fasciata or in the gender and season interaction (Table 3). Nonetheless the observed trend indicated highest GSI values in the austral winter, decreasing towards summer (Figs 16-18).

Hepatosomatic index (13-15) and gonadosomatic index (16-18) with standard error (±2 SE) for sampled specimens of Trygonorrhina fasciata. Results of HSI considering both sexes (13), females only (14) and males only (15) and GSI considering both sexes (16), females only (17) and males only (18).
Summary of results of the two-way analysis of variance for the Hepatosomatic Index (HSI) and the gonadosomatic index (GSI) of sampled specimens of Trygonorrhina fasciata and Dentiraja australis. Significant results are marked with (*).
Analysis of variance of the average Hepatosomatic Index (HSI) and Gonadosomatic Index (GSI) of sampled D. australis indicated a statistically significant effect of gender but not of seasons or in the interaction between these factors (Table 3). Nonetheless, there is a trend of increasing average values towards austral summer months (December - February), more clearly observed among male individuals (Figs 19-21). Overall, values of GSI were highest in spring (Figs 22-24).

Hepatosomatic index (19-21) and gonadosomatic index (22-24) with standard error (±2 SE) for sampled specimens of Dentiraja australis. Results of HSI considering both sexes (19), females only (20) and males only (21) and GSI considering both sexes (22), females only (23) and males only (24).
The highest ratios of maturing and more importantly, of pregnant females for T. fasciata were found in late austral spring and early summer, indicating that the austral summer might be the period likely to be related to reproduction (Table 3, Fig. 25). Furthermore, some samples of the species were also pregnant in late September, indicating that reproduction for the species may start just after the late austral winter or in the early austral spring. Despite the absence of female samples of D. australis in late austral winter and early austral spring, pregnant females were found in the late austral spring and early austral summer, and therefore suggesting similar periods of reproduction for T. fasciata (Fig. 26).

Ratio of females in each reproduction stage per month and season in the available samples of Trygonorrhina fasciata (25) and Dentiraja australis (26).
DISCUSSION
This study presents the partial estimations of age, growth and reproductive biology of two endemic demersal elasmobranchs of the Australian East Coast: T. fasciata and D. australis. The distribution patterns of these species and of fishing operations suggest a high probability of bycatch in demersal trawl and gillnet fishing, which combined, comprise the majority (94.75%) of the commercial fishing operations in the East Coast (AFMA 2015Australian Fisheries Management Authority (2015) Southern and Eastern Scalefish and Shark Fishery. http://www.afma.gov.au/fisheries/southern-eastern-scalefish-shark-fishery [Accessed: 02/07/2015]
http://www.afma.gov.au/fisheries/souther...
).
Despite similar distributions and generalized descriptive classification as batoids, direct morphometric and ontogenetic comparisons between the T. fasciata and D. australis are not plausible due to distinct features of both species. Nonetheless, the estimated growth rate of T. fasciata seems to be slower than those derived for D. australis. The Von Bertalanffy growth curve of T. fasciata suggested that bigger and therefore older individuals may not have been caught by the sampling. Perhaps these larger specimens inhabit deeper waters not exploited by the fishery. Similarly, due the relatively small sizes of D. australis, potentially smaller individuals were not caught due to mesh size.
The estimated growth rates of D. australis were relatively fast for an elasmobranch, even considering its small size. Almost all elasmobranch species have slower growth rates, with curvature parameters (Von Bertalanffy k) ranging normally from 0.05 to 0.25 (Abdel-Aziz 1992Abdel-Aziz S (1992) The use of vertebral rings of the brown ray Raja miraletus (Linnaeus, 1758) off Egyptian Mediterranean coast for estimation of age and growth. Cybium 16: 121-132., Francis et al. 2001Francis MP, Maolagáin CÓ, Stevens D (2001) Age, growth, and sexual maturity of two New Zealand endemic skates, Dipturus nasutus and D. innominatus. New Zealand Journal of Marine and Freshwater Research 35: 831-842., Sulikowski et al. 2003Sulikowski JA, Morin MD, Suk SH, Howell WH (2003) Age and growth estimates of the winter skate (Leucoraja ocellata) in the western Gulf of Maine. Fishery Bulletin 101: 405-413., Compagno 2005Compagno LJV (2005) Checklist of living Chondrichthyes. In: Hamlett WC (Ed.) Reproductive biology and phylogeny of Chondrichthyes: sharks, batoids and chimaeras. Science Publishers, Enfield, 503-548. (Compagno 2005), Goldman 2005Goldman KJ (2005) Age and growth of elasmobranch fishes. FAO Fisheries Technical Paper 474: 76., White et al. 2014White J, Simpfendorfer CA, Tobin AJ, Heupel MR (2014) Age and growth parameters of shark-like batoids. Journal of Fish Biology 84: 1340-1353. https://doi.org/10.1111/jfb.12359
https://doi.org/10.1111/jfb.12359...
) as compared to the k = 0.34 estimated for the species in this study. The readability of the vertebrae of D. australis was also lower than that of the T. fasciata, mostly due to their very small size (usually < 0.4 cm) and the complex process of locating the birth mark. Although a significant linear relationship was found between the vertebral radius and total length, we would recommend further analysis with polishing techniques usually applied to more fragile growth-marked structures such as otoliths and spines.
It should be noted that these age estimates are preliminary since this study has not explicitly validated the annual nature of the rings. This was partly due to the lack of sufficient samples from all months of the year, especially for D. australis. However, there was also a considerable variation in the marginal increment data. There was a relatively pronounced drop in the distance around October for T. fasciata suggesting this as the time of band formation. There is insufficient data to determine the same for D. australis. Nonetheless, from this low value, we did not see the expected steadily increasing increment width. It is possible this is due to measurement error caused by the lack of a defined border between the dark and light portions of the banding pattern. Despite this variance, vertebral radius was determined to be an appropriate ageing structure based on the positive linear relationship between vertebrae radius and total length. Thus while annual vertebral growth bands are quite common in other similar species (Timmons and Bray 1998Timmons M, Bray R (1998) Age, growth, and sexual maturity of shovelnose guitarfish, Rhinobatos productus (Ayres). Oceanographic Literature Review 1: 148., Lessa et al. 2004Lessa R, Santana FM, Hazin FH (2004) Age and growth of the blue shark Prionace glauca (Linnaeus, 1758) off northeastern Brazil. Fisheries Research 66: 19-30. https://doi.org/10.1016/s0165-7836(03)00193-0
https://doi.org/10.1016/s0165-7836(03)00...
, Izzo and Gillanders 2008Izzo C, Gillanders B (2008) Initial assessment of age, growth and reproductive parameters of the southern fiddler ray Trygonorrhina fasciata (Müller & Henle, 1841) from South Australia. Pan-American Journal of Aquatic Sciences 3: 321-327., Yıgın and Ismen 2010Yıgın C, Ismen A (2010) Age, growth, reproduction and feed of longnosed skate, Dipturus oxyrinchus (Linnaeus, 1758) in Saros Bay, the north Aegean Sea. Journal of Applied Ichthyology 26: 913-919. https://doi.org/10.1111/j.1439-0426.2010.01510.x
https://doi.org/10.1111/j.1439-0426.2010...
), results presented in this study are to be considered preliminary and annual periodicity in age classes of both species still requires validation.
Gonadosomatic Index results presented in this study suggest T. fasciata are reproducing in late austral winter/early spring whilst D. australis might be reproducing in late austral spring and summer. This assumption is supported by HSI results since both species had overall smaller averages during austral winter months and presented increasing values towards summer. Similar to related species at the same latitudes, HSI’s of females may not show significant differences during egg growth because lipids and proteins may be stored and processed continuously throughout seasons without significant changes in biomass (Maruska et al. 1996Maruska KP, Cowie EG, Tricas TC (1996) Periodic gonadal activity and protracted mating in elasmobranch fishes. Journal of Experimental Zoology 276: 219-232.). Gonadal stage results for T. fasciata support the conclusions based on GSI and HSI, indicating a larger frequency of pregnant females after austral winter and the presence of post-partum females in mid-spring. Results of gonadal stage analysis for D. australis are rather inconclusive due to the availability of female samples being restricted to June, November, and December. However, the high frequency of pregnant females in late austral spring and early summer, similar to the GSI results, suggests late austral spring and summer as the reproductive periods.
One of the biggest concerns to managers when assessing stocks of Elasmobranch bycatch is the uncertainty caused by the rarely differentiated species in landings information (Kennelly 1995Kennelly SJ (1995) The issue of bycatch in Australia’s demersal trawl fisheries. Reviews in Fish Biology and Fisheries 5: 213-234. https://doi.org/10.1007/bf00179757
https://doi.org/10.1007/bf00179757...
, Hall et al. 2000Hall MA, Alverson DL, Metuzals KI (2000) By-Catch: problems and solutions. Marine Pollution Bulletin 41: 204-219. https://doi.org/10.1016/S0025-326X(00)00111-9
https://doi.org/10.1016/S0025-326X(00)00...
, Sulikowski et al. 2003Sulikowski JA, Morin MD, Suk SH, Howell WH (2003) Age and growth estimates of the winter skate (Leucoraja ocellata) in the western Gulf of Maine. Fishery Bulletin 101: 405-413., Walker and Stuart Gason 2007Walker T, Stuart Gason A (2007) Shark and other chondrichthyan byproduct and bycatch estimation in the Southern and Eastern Scalefish and Shark Fishery. Final Report to Fisheries Research and Development Corporation. Primary Industries Research ictoria, Queenscliff, Victoria, vi+182 pp. https://doi.org/10.13140/2.1.3353.8564
https://doi.org/10.13140/2.1.3353.8564...
, AFMA 2015Australian Fisheries Management Authority (2015) Southern and Eastern Scalefish and Shark Fishery. http://www.afma.gov.au/fisheries/southern-eastern-scalefish-shark-fishery [Accessed: 02/07/2015]
http://www.afma.gov.au/fisheries/souther...
). Moreover, the increasing management of major commercial species in recent years has resulted in fisherman looking for alternate species, including skates and rays. In 2002, at one of the largest fish markets of east Australia, 43 tonnes of “flaps” were sold, which is estimated to represent approximately 134 tonnes live weight of rays and skates. As previously mentioned, there is also the problem of demersal batoids being sold under several categories and common names, making it difficult to determine the exact species (Stevens and Valenti 2009Stevens JD, Valenti SV (2009) Dipturus australis. The IUCN Red List of Threatened Species 2009: e.T161637A5470186. https://doi.org/10.2305/IUCN.UK.2009-2.RLTS.T161637A5470186.en
https://doi.org/10.2305/IUCN.UK.2009-2.R...
).
This study provides basic information about growth and reproduction of two endemic Australian species: T. fasciata and D. australis that like many other species of elasmobranchs, require species-directed management actions, especially considering the high susceptibility of these and many other demersal species to fishing bycatch and direct consequences such as overexploitation. The latter is a particularly serious problem to elasmobranchs because, compared to other marine fishes, the group have relatively low productivity and therefore differ from other fish in their ability to withstand and recover from exploitation (Hoenig and Gruber 1990Hoenig JM, Gruber SH (1990) Life-History Patterns in the Elasmobranchs: Implications for fisheries management. NOAA Technical Report NMFS: 1-16., Smith et al. 1999Smith SE, Au DW, Show C (1999) Intrinsic rebound potentials of 26 species of Pacific sharks. Marine and Freshwater Research 49: 663-678. https://doi.org/10.1071/MF97135
https://doi.org/10.1071/MF97135...
, Stevens et al. 2000Stevens JD, Bonfil R, Dulvy NK, Walker PA (2000) The effects of fishing on sharks, rays, and chimaeras (chondrichthyans), and the implications for marine ecosystems. ICES Journal of Marine Science 57: 476-494. https://doi.org/10.1006/jmsc.2000.0724
https://doi.org/10.1006/jmsc.2000.0724...
). Based on the results presented in this study, it would be reasonable to say that the species assessed here have different potentials to withstand bycatch. Dentiraja australis would be potentially more resilient than T. fasciata due a relatively fast growth rate. Nonetheless, many other factors such as population mortality and spatial interactions with fisheries are necessary and should be taken in account while evaluating stock status.
ACKNOWLEDGEMENTS
The authors would like to thank Daniel Johnson, Matt Harrison and Vic Peddemors and the Department of Primary Industries - Fisheries Observers Program for the samples provided for this study, the Sydney Institute of Marine Sciences (SIMS) for the use of facilities, Mark Macinante for the assistance with dissections and to the Coordenação de Aperfeiçoamento de Pessoal de Nível Superior for scholarship funding (Process BEX 13590-13-8). This research was conducted under animal ethics approval (ACEC ref: 16/02) to the NSW Department of Primary Industries. This is contribution 263 to the Sydney Institute of Marine Science. The authors are responsible for the content, including any improprieties in use of the English language.
LITERATURE CITED
- Abdel-Aziz S (1992) The use of vertebral rings of the brown ray Raja miraletus (Linnaeus, 1758) off Egyptian Mediterranean coast for estimation of age and growth. Cybium 16: 121-132.
- Australian Fisheries Management Authority (2015) Southern and Eastern Scalefish and Shark Fishery. http://www.afma.gov.au/fisheries/southern-eastern-scalefish-shark-fishery [Accessed: 02/07/2015]
» http://www.afma.gov.au/fisheries/southern-eastern-scalefish-shark-fishery - Agnew DJ, Nolan CP, Beddington JR, Baranowski R (2000) Approaches to the assessment and management of multispecies skate and ray fisheries using the Falkland Islands fishery as an example. Canadian Journal of Fisheries and Aquatic Sciences 57: 429-440. https://doi.org/10.1139/f99-264
» https://doi.org/10.1139/f99-264 - Baum JK, Myers RA, Kehler DG, Worm B, Harley SJ, Doherty PA (2003a) Collapse and conservation of shark populations in the Northwest Atlantic. Science 299: 389-392. https://doi.org/10.1126/science.1079777
» https://doi.org/10.1126/science.1079777 - Bonfil R (2005) The purpose of stock assessment and the objectives of fisheries management. FAO Fisheries Technical Paper 474: 6.
- Cailliet G (1990) Elasmobranch age determination and verification: an updated review. NOAA Tech Rep NMFS 90: 157-165.
- Cailliet GM, Smith WD, Mollet HF, Goldman KJ (2006) Age and growth studies of chondrichthyan fishes: the need for consistency in terminology, verification, validation, and growth function fitting. Environmental Biology of Fishes 77: 211-228.
- Camhi M, Fowler S, Musick J, Bräutigam A, Fordham S (1998) Sharks and their relatives: Ecology and Conservation. Occasional Paper of the IUCN Species Survival Commission.
- Campana S (2001) Accuracy, precision and quality control in age determination, including a review of the use and abuse of age validation methods. Journal of Fish Biology 59: 197-242.
- Clarke S, Rose D (2005) Regional Fisheries and Trade. Sharks, Rays and Chimaeras: The Status of the Chondrichthyan Fishes Status Survey: 24-29.
- Compagno LJV (2005) Checklist of living Chondrichthyes. In: Hamlett WC (Ed.) Reproductive biology and phylogeny of Chondrichthyes: sharks, batoids and chimaeras. Science Publishers, Enfield, 503-548.
- Dulvy NK, Metcalfe JD, Glanville J, Pawson MG, Reynolds JD (2000) Fishery stability, local extinctions, and shifts in community structure in skates. Conservation Biology 14: 283-293.
- Ebert DA, Fowler SL, Compagno LJ (2013) Sharks of the world: a fully illustrated guide. Wild Nature Press, Plymouth, 528 pp.
- Fowler SL, Cavanagh RD, Camhi M, Burgess GH, Cailliet GM, Fordham SV, Simpfendorfer CA, Musick JA (2005) Sharks, rays and chimaeras: the status of the chondrichthyan fishes. IUCN SSC Shark Specialist Group, Gland, 461 pp.
- Francis MP, Maolagáin CÓ, Stevens D (2001) Age, growth, and sexual maturity of two New Zealand endemic skates, Dipturus nasutus and D. innominatus New Zealand Journal of Marine and Freshwater Research 35: 831-842.
- Goldman KJ (2005) Age and growth of elasmobranch fishes. FAO Fisheries Technical Paper 474: 76.
- Goldman KJ, Cailliet GM, Andrews AH, Natanson LJ (2012) Assessing the age and growth of chondrichthyan fishes. Biology of Sharks and their Relatives 13: 423.
- Graham KJ, Andrew NL, Hodgson KE (2001) Changes in relative abundance of sharks and rays on Australian South East Fishery trawl grounds after twenty years of fishing. Marine and Freshwater Research 52: 549-561. https://doi.org/10.1071/MF99174
» https://doi.org/10.1071/MF99174 - Hall MA, Alverson DL, Metuzals KI (2000) By-Catch: problems and solutions. Marine Pollution Bulletin 41: 204-219. https://doi.org/10.1016/S0025-326X(00)00111-9
» https://doi.org/10.1016/S0025-326X(00)00111-9 - Hoenig JM, Gruber SH (1990) Life-History Patterns in the Elasmobranchs: Implications for fisheries management. NOAA Technical Report NMFS: 1-16.
- Huveneers C (2015) Trygonorrhina fasciata The IUCN Red List of Threatened Species 2015: e.T41866A43270478. https://doi.org/10.2305/IUCN.UK.2015-4.RLTS.T41866A43270478.en
» https://doi.org/10.2305/IUCN.UK.2015-4.RLTS.T41866A43270478.en - IUCN (2001) IUCN Red List Categories and Criteria: Version 3.1. IUCN Species Survival Commission, Gland, ii+30 pp.
- Izzo C, Gillanders B (2008) Initial assessment of age, growth and reproductive parameters of the southern fiddler ray Trygonorrhina fasciata (Müller & Henle, 1841) from South Australia. Pan-American Journal of Aquatic Sciences 3: 321-327.
- Kaschner K, Rius-Barile J, Kesner-Reyes K, Garilao C, Kullander SO, Rees T, Froese R (2013) AquaMaps: Predicted range maps for aquatic species. http://www.aquamaps.org, v. 08/2013.
» http://www.aquamaps.org - Kennelly SJ (1995) The issue of bycatch in Australia’s demersal trawl fisheries. Reviews in Fish Biology and Fisheries 5: 213-234. https://doi.org/10.1007/bf00179757
» https://doi.org/10.1007/bf00179757 - Last PR, Stevens JD, Swainston R, Davis G, Publishing C, Last PR, Stevens JD, Swainston R, Davis G (2009) Sharks and rays of Australia. CSIRO Pub, East Melbourne, 644 pp.
- Lessa R, Santana FM, Hazin FH (2004) Age and growth of the blue shark Prionace glauca (Linnaeus, 1758) off northeastern Brazil. Fisheries Research 66: 19-30. https://doi.org/10.1016/s0165-7836(03)00193-0
» https://doi.org/10.1016/s0165-7836(03)00193-0 - Maruska KP, Cowie EG, Tricas TC (1996) Periodic gonadal activity and protracted mating in elasmobranch fishes. Journal of Experimental Zoology 276: 219-232.
- Michael SW (1993) Reef sharks and rays of the world: a guide to their identification, behavior, and ecology. Sea Challengers, Monterey, California, 112 pp.
- Musick JA (1999) Criteria to Define Extinction Risk in Marine Fishes: The American Fisheries Society Initiative. Fisheries 24: 6-14. https://doi.org/10.1577/1548-8446(1999)024<0006:CTDERI>2.0.CO;2
» https://doi.org/10.1577/1548-8446(1999)024<0006:CTDERI>2.0.CO;2 - Musick JA, Bonfil R (2005) Management techniques for elasmobranch fisheries. FAO Fish Tech Paper 474, 251 pp.
- R Core Team (2018) R: A language and environment for statistical computing. Computing RFfS, Vienna. https://www.R-project.org
» https://www.R-project.org - Smith SE, Au DW, Show C (1999) Intrinsic rebound potentials of 26 species of Pacific sharks. Marine and Freshwater Research 49: 663-678. https://doi.org/10.1071/MF97135
» https://doi.org/10.1071/MF97135 - Stehmann M (1987) Quick and dirty tabulation of stomach contents and maturity stages for skates (Rajidae), squaloid and other ovoviviparous and viviparous species of sharks. American Elasmobranch Society Newsletter 3: 5-9.
- Stehmann MF (2002) Proposal of a maturity stages scale for oviparous and viviparous cartilaginous fishes (Pisces, Chondrichthyes). Archive of Fishery and Marine Research 50: 23-48.
- Stevens JD, Bonfil R, Dulvy NK, Walker PA (2000) The effects of fishing on sharks, rays, and chimaeras (chondrichthyans), and the implications for marine ecosystems. ICES Journal of Marine Science 57: 476-494. https://doi.org/10.1006/jmsc.2000.0724
» https://doi.org/10.1006/jmsc.2000.0724 - Stevens JD, Valenti SV (2009) Dipturus australis The IUCN Red List of Threatened Species 2009: e.T161637A5470186. https://doi.org/10.2305/IUCN.UK.2009-2.RLTS.T161637A5470186.en
» https://doi.org/10.2305/IUCN.UK.2009-2.RLTS.T161637A5470186.en - Sulikowski JA, Morin MD, Suk SH, Howell WH (2003) Age and growth estimates of the winter skate (Leucoraja ocellata) in the western Gulf of Maine. Fishery Bulletin 101: 405-413.
- Timmons M, Bray R (1998) Age, growth, and sexual maturity of shovelnose guitarfish, Rhinobatos productus (Ayres). Oceanographic Literature Review 1: 148.
- Von Bertalanffy L (1938) A quantitative theory of organic growth (inquiries on growth laws. II). Human Biology 10: 181-213.
- Walker T, Stuart Gason A (2007) Shark and other chondrichthyan byproduct and bycatch estimation in the Southern and Eastern Scalefish and Shark Fishery. Final Report to Fisheries Research and Development Corporation. Primary Industries Research ictoria, Queenscliff, Victoria, vi+182 pp. https://doi.org/10.13140/2.1.3353.8564
» https://doi.org/10.13140/2.1.3353.8564 - Walker TI (1998) Can shark resources be harvested sustainably? A question revisited with a review of shark fisheries. Marine and Freshwater Research 49: 553-572.
- White J, Simpfendorfer CA, Tobin AJ, Heupel MR (2014) Age and growth parameters of shark-like batoids. Journal of Fish Biology 84: 1340-1353. https://doi.org/10.1111/jfb.12359
» https://doi.org/10.1111/jfb.12359 - Yıgın C, Ismen A (2010) Age, growth, reproduction and feed of longnosed skate, Dipturus oxyrinchus (Linnaeus, 1758) in Saros Bay, the north Aegean Sea. Journal of Applied Ichthyology 26: 913-919. https://doi.org/10.1111/j.1439-0426.2010.01510.x
» https://doi.org/10.1111/j.1439-0426.2010.01510.x
Publication Notes
-
Available online:
December 17, 2020 -
Zoobank Register:
http://zoobank.org/51FFF676-C96D-4B1A-A713-15921D9844BF -
Publisher:
© 2020 Sociedade Brasileira de Zoologia. Published by Pensoft Publishers at https://zoologia.pensoft.net
Edited by
Editorial responsibility:
Publication Dates
-
Publication in this collection
18 Jan 2021 -
Date of issue
2020
History
-
Received
12 Dec 2019 -
Accepted
25 Sept 2020 -
Published
17 Dec 2020