 Differentially Expressed Genes in Oral Cavity and Thyroide Cancer: An In Silico Approach with GEO and TCGA Data
Abstract
Head and neck cancer comprises several pathologies occurring at distinct sites above the clavicle. Due to their anatomical position, these types of cancer may cause additional physical, physiological and psychosocial impairments. Early detection is known to improve clinical outcomes, highlighting a clear need for improved cancer screening such as employing molecular biomarkers. Technological advancements have led to an increasing volume of gene expression data deposited in public repositories. The present study conducted a differential gene expression analysis for head and neck cancer, focusing on oral cavity cancer and thyroid cancer. Expression data was extracted from the Gene Expression Omnibus and The Cancer Genome Atlas databases. The data was prepared and analyzed in the R environment. Four differentially expressed genes were identified for oral cavity cancer: LOXL2, FAT1, SOD3 and DPT; and 12 altered genes were found for thyroid cancer: CRABP1, CSGALNACT1, WSCD2, ITM2A, ID3, PAX8, SELENBP1, TNFRSF11B, SDPR, LRP1B, MT1F and SGK223. A survival analysis demonstrated that higher expression of FAT1 in oral cavity cancer is associated with lower survival. For thyroid cancer, lower expression of ITM2A and ID3 were associated with lower survival. This study identified potential diagnostic and prognostic genetic biomarkers for oral cavity and thyroid tumors.
Keywords:
head and neck cancer; thyroid cancer; oral cavity cancer; gene expression; biomarkers.
HIGHLIGHTS
Using GEO and TCGA data to identify differentially expressed genes;
Identification of 4 differentially expressed genes for oral cavity cancer;
Identification of 12 differentially expressed genes for thyroid cancer.
INTRODUCTION
Cancer is a disease of genetic origin which develops from single cells into a neoplastic mass with uncontrolled cell division, altered cellular function and potential to invade neighboring tissues [1]. The terminology “head and neck cancer” is utilized when referring to a group of cancers that occur above the clavicle, with exception for the brain, skin, lymph nodes, eyes, esophagus and trachea [2,3]. Among the main anatomic sites for this neoplasia are the oral cavity, pharynx, larynx, nasal cavity, paranasal sinuses, ears and thyroid. They are also subdivided into the histological types of squamous cell carcinoma and adenocarcinoma, the former being most common and accounting for 90% of instances [2,4,5].
Depending on the course of the disease upon diagnosis, treatment for head and neck cancer may require aggressive procedures such as surgical resections, chemotherapy, radiotherapy, the use of feeding bags and tracheostomy. Tumor resection, in particular, usually leads to the disfigurement of facial features. Accordingly, this group of cancers inflicts physical, physiological and psychosocial repercussions, which in turn affect self esteem, communication, loss of autonomy and difficulties in feeding [4,6,7]. According to World Health Organization (WHO) data, approximately 1.518.133 new cases and 5.510.771 cancer-related deaths were estimated worldwide for head and neck cancer in 2020, respectively representing 8.4% and 5.2% out of all cancer types [8]. Evidently, this landscape configures a major public health issue globally.
Early detection is known to improve clinical outcomes with a chance of survival reaching up to 80% [7], highlighting the need for reliable and improved diagnostic methods. To this regard, cancer biomarkers occupy an especially influential position in a clinical setting. They have been successfully applied for several purposes in patient assessment, including disease development risk estimation, screening, diagnosis, prognosis, monitoring and therapy response prediction [9].
In the current era of biological big data and high throughput technologies, the use of bioinformatics resources has become an essential first step in biomarker discovery [10]. From this perspective, an increasingly popular strategy to aid cancer screening is the identification of differentially expressed genes between normal and tumoral tissue, which may potentially be employed as biomarkers.
Gene expression may be analyzed through microarray or RNAseq techniques and experimental data is usually stored in public repositories, such as the Gene Expression Omnibus (GEO) database [11] and The Cancer Genome Atlas (TCGA) [12]. Several research efforts have combined and/or repurposed gene expression data from online databases in order to assess novel potential biomarkers for bladder cancer [13], pulmonary adenocarcinoma [14], pancreatic duct adenocarcinoma [15], cervical cancer [16], among others.
In this context, our study aimed to identify differentially expressed genes between tumoral and non-tumoral tissue for head and neck cancer, with emphasis on thyroid and oral cavity cancers by combining multiple studies from GEO and TCGA.
MATERIAL AND METHODS
Dataset acquisition
The data was obtained from GEOdatabase and TCGA. As a selection criterion, only studies that contained normal samples and biopsies performed on humans were chosen. Due to discrepancies in sample size for different anatomical sites of head and neck cancer, the dataset of this study is divided into two groups: five GEO studies for oral cavity cancer under the accession number: GSE13601, GSE38517, GSE58911, GSE83519, GSE146483 and four GEO studies for thyroid cancer under the accession number: GSE53072, GSE65144, GSE82208, GSE129562. Additionally, TCGA data was retrieved from the Thyroid Carcinoma project, with 118 tumors paired normal samples and the Head and Neck Squamous Cell Carcinoma project with 521 tumor paired normal samples, allowing a better size comparison sample (Table 1). The GEO data was acquired and preprocessed using the GEOquery package in the R environment, after that transformed to Log 2 [17], while TCGA data was acquired from the website, normalized in transcript per milion and then transformed to Log 2 [18,19].
Differential expression
Identification of differentially expressed genes (DEGs) was performed through a comparison of tumoral and non-tumoral expression data using bayesian statistics with Benjamini-Hochberg false discovery rate correction [30]. An adjusted p value <0.05 was considered significant and a Log 2 Fold Change threshold >|1| was set to filter out DEGs with less difference in expression. The intersection of DEGs obtained from each dataset was selected, aggregating evidence for diagnostic potential and providing more reliable results. These procedures were carried out in R programming language [31].
Functional enrichment and protein interaction
The list of DEGs obtained for both cancer types in the previous step was used as input for a functional enrichment analysis and in the construction of a protein-protein interaction network. To gain insight on the mechanisms surrounding thyroid and oral cavity cancers, we sought to identify over-representation of Gene Ontology terms [32,33] using g:Profiler [34]. The Homo sapiens ontology was queried for overrepresented biological processes, and an adjusted p-value <0.05 was considered as significant after Benjamini-Hochberg False Discovery Rate correction. Results were manually filtered to remove term redundancy.
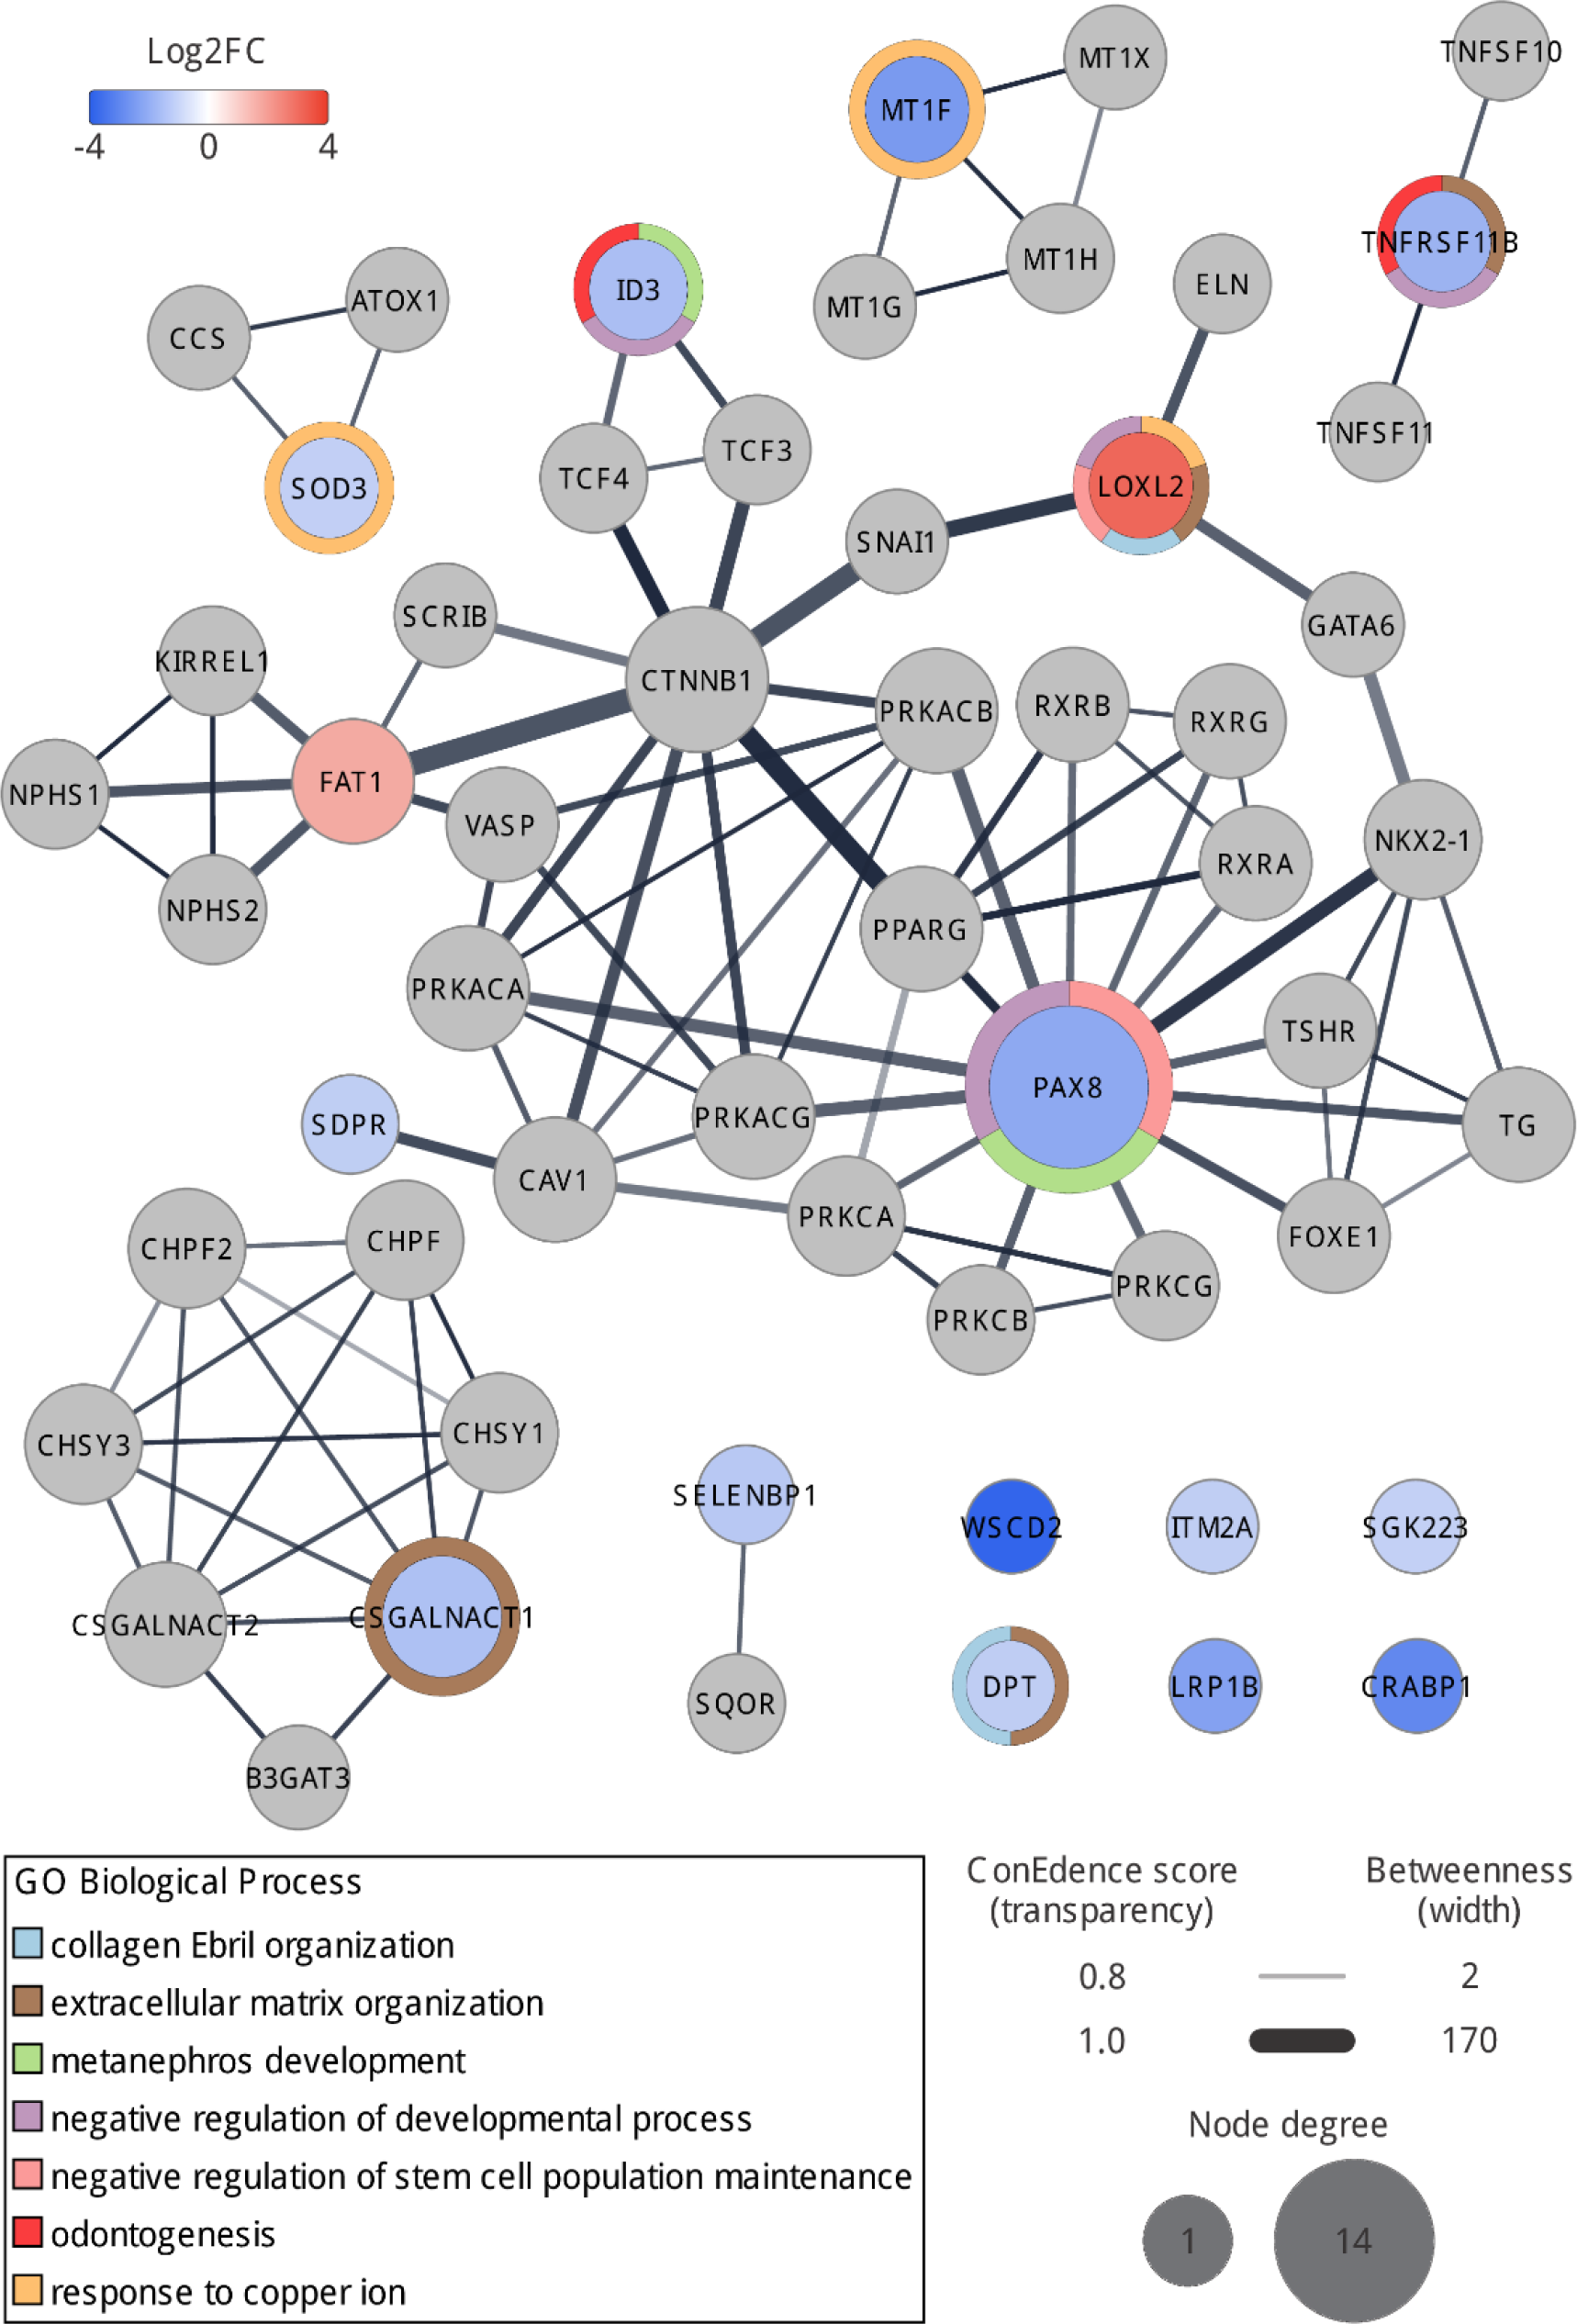
Uniprot identifiers corresponding to the DEGs were queried using the StringApp v2.1.1 extension [35] of Cytoscape 3.10.1 [36] in order to retrieve significant interactions from the STRING database [37]. The STRING protein query employed the following parameters: evidence score threshold >0.80 and target organism Homo sapiens, and 40 additional interactors. The resulting network was analyzed in terms of the quantity of connections established by a protein (node degree) and the extent to which a connection lies on the shortest path between two nodes (edge betweenness centrality) [38]. These variables were mapped to node size and edge width, respectively. Additionally, Log2 FC and enriched biological themes were mapped to the node coloring using the Omics Visualizer v1.3.1 extension [39].
Survival analysis
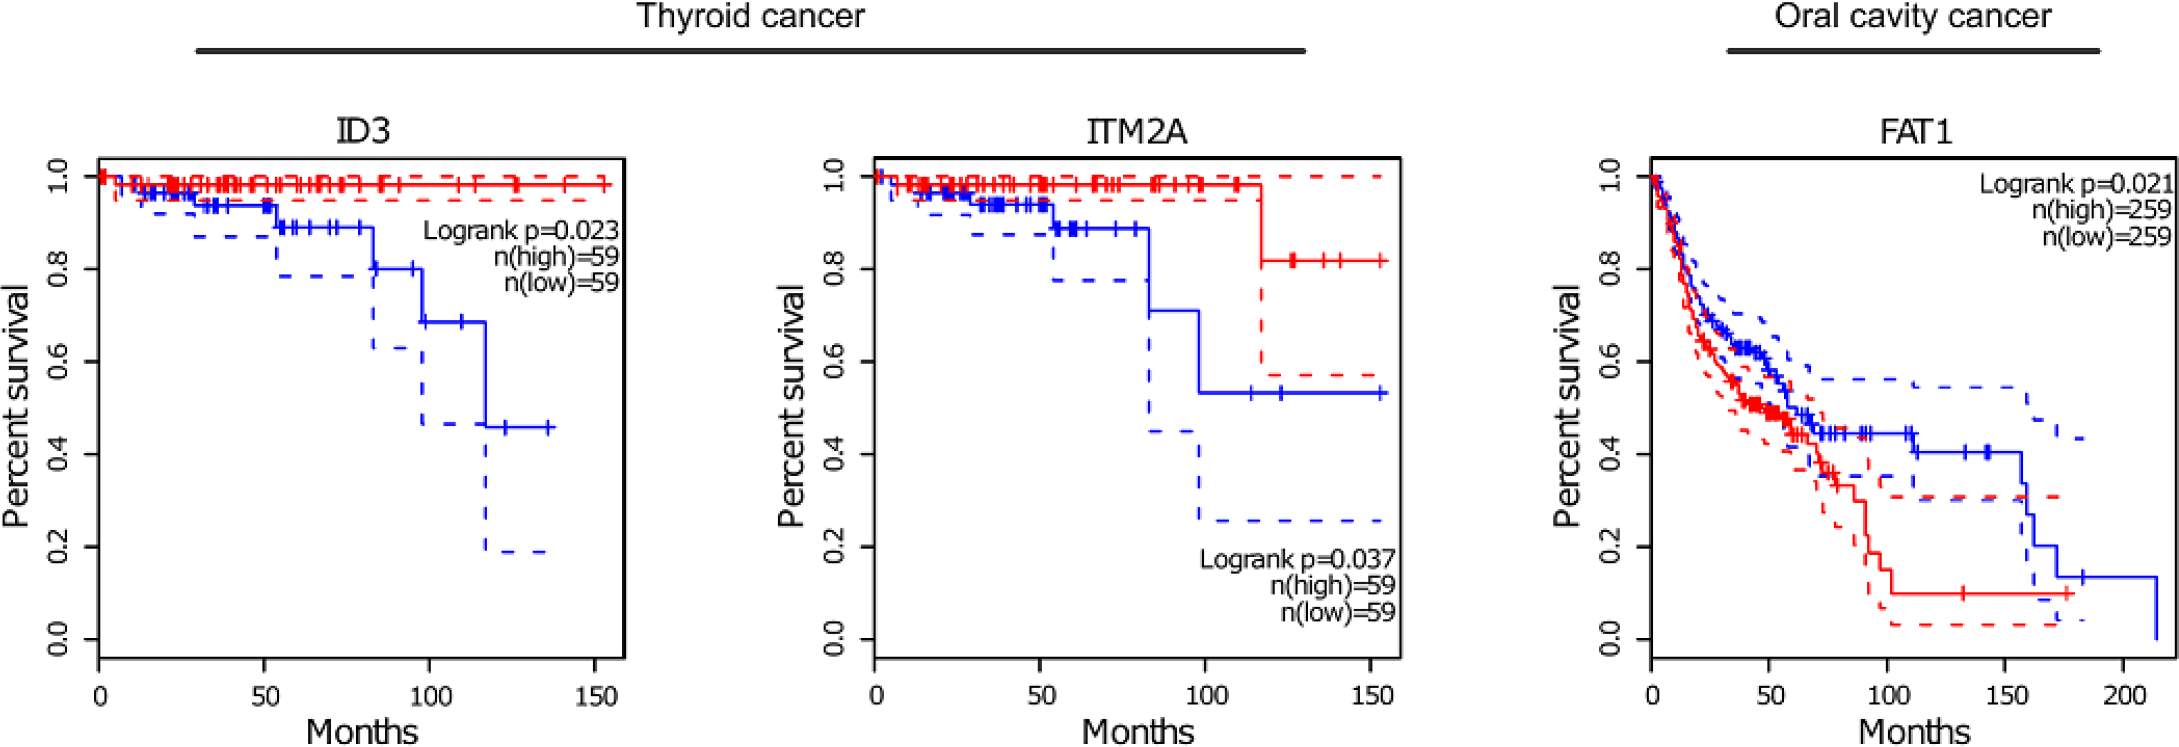
All identified DEGs underwent a survival analysis using TCGA patient data to evaluate their prognostic potential [15,40]. The Kaplan-Meier method was used to estimate the survival probability for patients. The Mantel-Haenszel test was employed to compare survival curves between groups of high-expression and low-expression for each gene (cutoff by median expression), taking p<0.05 as significant. These procedures were carried out with the Survival package in R [41].
RESULTS
Each dataset analyzed yielded a different number of DEGs (Table 2), which stems mainly from natural variability and particularities of the original experiments. In order to reduce this bias and provide a more comprehensive analysis, the intersection of DEGs between datasets was selected for each cancer site.
In oral cavity cancer, the intersection between datasets yielded 4 DEGs, namely LOXL2, FAT1, SOD3 and DPT. Out of these, LOXL2 and FAT1 show a significantly higher expression in tumoral tissue. In contrast, SOD3 and DPT appear as down-regulated in cancer when compared to adjacent non-tumoral samples. As for thyroid cancer, the intersection of DEGs resulted in 12 altered genes, all of which exhibit lower expression in cancer: CRABP1, CSGALNACT1, WSCD2, ITM2A, ID3, PAX8, SELENBP1, TNFRSF11B, SDPR, LRP1B, MT1F and SGK223.
Our network analysis for the combined cancer sites formed a main network of 31 nodes and 65 connections (Figure 1). Five DEGs form connections in the main network, although not directly to each other. A central path is established between FAT1, LOXL2 and PAX8, the latter of which is the most central node with a degree of 14. The significantly enriched biological processes for our set of DEGs are also highlighted in the network (Figure 1).
Network for differentially expressed genes in head and neck cancer obtained from STRING interaction data. Nodes colored in gray represent additional interactors.
A total of three DEGs displayed a significant association between expression and survival (Figure 2). The FAT1 gene, which was found up-regulated in tumor samples, displayed a significant association between higher expression samples and a lower survival rate in oral cavity cancer. As for thyroid cancer, survival analysis revealed two genes, ITM2A and IDE3, with an association between lower expression samples and a low survival rate. These two were found down-regulated in cancer.
DISCUSSION
The genes LOXL2, SOD3, differentially expressed in the oral cavity, and MT1F, differentially expressed in the thyroid cancer, were found enriched for response to copper ion. The presence of ions in the human body is observed in various biological processes, such as the cell cycle and protein composition. Neoplastic and metastatic processes tend to alter the homeostasis of ionic components, including copper [42,43]. LOXL2, DPT, TNFRSF11B and CSGALNACT1 were found enriched for biological processes related to cellular organization, namely collagen fibril organization and extracellular matrix organization. Cancer, in general, is known to cause local changes in terms of anatomy and histology, including cytoplasm, morphology and nuclear organization [44]. These structural changes usually lead to reduced oxygen levels [45,46]. To this regard, SOD3 is known to protect against oxidative stress by converting reactive oxygen species [47]. In our study we found this gene down-regulated in oral cavity cancer, which may aid in tumor development. This gene has been previously linked with aggressive phenotypes of oral squamous cell carcinoma [48].
The thyroid gland is an integral part of the endocrine system, producing hormones that have a role throughout the body [49]. Therefore, gene expression modulation in this organ may cause systemic changes. In this study, ID3 and PAX8 demonstrated, through functional enrichment, activity related to metanephros development and negative regulation of developmental process. Although a different and distant organ, this is a particularly interesting finding given the bidirectional relationship between thyroid cancer and kidney cancer, where patients who initially have the pathology in one of these two sites tend to have a recurrence in the second site [50]. Similarly general thyroid dysfunctions can lead to kidney alterations [51]. Additionally, PAX8 is enriched for negative regulation of stem cell population maintenance. In this case, downregulation of this gene, as it is observed in our study, may enhance tumoral cell proliferation.
About the survival rate, a higher overall is perceptible in thyroid cancer compared to oral cavity cancer, which is consistent with the low mortality rate of thyroid cancer reported by the WHO [8]. Additionally, a previous study for oral squamous cell carcinoma reported the genes PLAU, CLDN8, and CDKN2A as potential predictors of overall survival using data available from GEO and TCGA [52].
Out of the DEGs identified in our study, we could not find previous literature relating to head and neck cancer for LRP1B, TNFRSF11B, SELENBP1, WSCD2 and CSGALNACT1. In the case of CSGALNACT1, which encodes for a type of N-acetylgalactosaminyltransferase, there are some studies describing other molecules of this class and their expression in cancer. For instance, increased expression of GALNT14 has been associated with poor prognosis in head and neck cancer [53]. In contrast, we found CSGALNACT1 as down-regulated.
In oral cavity cancer, previous studies have been able to identify upregulation of genes LOXL2 [54,55] and FAT1 [56,57], as well downregulation of SOD3 [48,58] and DPT [59] in tumoral tissue, results which are in agreement with the current paper. FAT1 is frequently found mutated in various types of cancer, including a higher mutation rate in head and neck squamous cell cancer [60], and higher expression has been linked with a poor prognosis in oral squamous cell carcinoma [57].
Both an increase in LOXL2 expression levels as well as reduction in DPT have been associated with development of metastasis [55,61], which is reflected by their enriched roles in extracellular organization. Moreover, LOXL2 and SOD3 have a role in copper metabolism, and dysregulation of this biological process is closely related to the occurrence and progression of tumors [62]. In oral cavity cancer, increased LOXL2 expression had already been identified in tumor cells [54], playing a role in proliferation, migration, and tissue invasion [55].
Previous studies in thyroid cancer have reported genes CRABP1 [63], ID3 [64], ITM2A [65], PAX8 [66], SDPR [67], MT1F [68], SGK223 [69] with a lower expression in tumoral tissue, which is in agreement with the current study. PAX8 is a transcription factor involved in regulating the development of various tissues, primarily in the morphogenesis of the thyroid gland, renal system, and the female reproductive tract [70,71]. Accordingly, alterations in this gene are associated with the development of ovarian [72], renal [73], and thyroid cancers [66]. Additionally, ID3 downregulation shows a correlation with metastasis [64].
Furthermore, it’s necessary to be clear about the study limitations, since this study used just data available in GEO and TCGA without clinical analysis that proves our results. Additionally, some studies from GEO database contain just few samples, which may influence the results. However, for future works, local collections should be carried out with the aim of comparing the results obtained and better understanding the possible applications of the results.
CONCLUSION
The present study made use of data from public repositories to conduct a differential gene expression analysis in head and neck cancers, with special focus on oral cavity cancer and thyroid cancer. As a result, four differentially expressed genes were identified for oral cavity cancer: LOXL2, FAT1, SOD3, and DPT; and 12 genes for thyroid cancer: CRABP1, CSGALNACT1, WSCD2, ITM2A, ID3, PAX8, SELENBP1, TNFRSF11B, SDPR, LRP1B, MT1F and SGK223, all of which are potential diagnostic biomarkers. The intersection of multiple datasets performed in our study provides a less biased approach and accumulates more evidence to identify genes with differential expression between samples.
We identified, by means of a survival analysis, an association between higher expression levels of FAT1 and lower survival rates, suggesting that FAT1 could be a potential prognostic biomarker for oral cavity cancer. For thyroid cancer, we found ITM2A and ID3 as potential prognostic biomarkers given the association between lower expression levels and a lower survival rate. Additional laboratory studies are needed to confirm the use of these genes as diagnostic and prognostic biomarkers.
-
Funding:
“This research received no external funding”
Acknowledgments:
To the Coordenação de Aperfeiçoamento de Pessoal de Nível Superior (CAPES) for the master’s scholarship to the first author.
Data Availability Statement:
Research data are only available upon request for corresponding author.
REFERENCES
- 1 Hanahan D. Hallmarks of cancer: new dimensions. Cancer Discov. 2022;12(1):31-46.
- 2 Chow LQM. Head and neck cancer. N Engl J Med. 2020;382(1):60-72.
- 3 Konings H, Stappers S, Geens M, Winter BY, Lamote K, Meerbeeck JP, et al. A literature review of the potential diagnostic biomarkers of head and neck neoplasms. Front Oncol. 2020;10:1020.
- 4 Arquette M. Head and neck cancer. In: Morgensztern D, Govindan R, editors. Washington Oncology Manual. Rio de Janeiro: Guanabara Koogan; 2004. p. 259-75.
- 5 Galbiatti ALS, Padovani-Junior JÁ, Maniglia JV, Rodrigues CDS, Pavarino EC, Goloni-Bertollo EM. Head and neck cancer: causes, prevention and treatment. Braz J Otorhinolaryngol. 2013;79(2):239-47.
- 6 Genden EM. Head and neck cancer: management and reconstruction. 2nd ed. New York: Thieme; 2020.
- 7 Reis JB, Oliveira JM, Nascimento VF, Cabral JF, Lucinetto GC, Silva RA. Head and neck cancer: communication and its meanings. Rev Enferm. 2018;12(12):3263-70.
- 8 Sung H, Ferlay J, Siegel RL, Laversanne M, Soerjomataram I, Jemal A, et al. Global cancer statistics 2020: GLOBOCAN estimates of incidence and mortality worldwide for 36 cancers in 185 countries. CA Cancer J Clin. 2021;71(3):209-49.
- 9 Henry NL, Hayes DF. Cancer biomarkers. Mol Oncol. 2012;6(2):140-6.
- 10 Dall’Alba G, Casa PL, Abreu FP, Notari DL, Silva SA. A survey of biological data in a big data perspective. Big Data. 2022;10(4):279-97.
- 11 Edgar R, Domrachev M, Lash AE. Gene expression omnibus: NCBI gene expression and hybridization array data repository. Nucleic Acids Res. 2002;30(1):207-10.
- 12 Hutter C, Zenklusen JC. The cancer genome atlas: creating lasting value beyond its data. Cell.2018;173(2):283-5.
- 13 Xu Y, Wu G, Li J, Ruan N, Ma L, Han X, et al. Screening and identification of key biomarkers for bladder cancer: a study based on TCGA and GEO data. Biomed Res Int. 2020;2020:1-11.
- 14 Zheng Q, Min S, Zhou Q. Identification of potential diagnostic and prognostic biomarkers for LUAD based on TCGA and GEO databases. Biosci Rep. 2021;41(6):BSR20210433.
- 15 Sartor ITS, Zeidán-Chuliá F, Albanus RD, Dalmolin RJS, Moreira JCF. Computational analyses reveal a prognostic impact of TULP3 as a transcriptional master regulator in pancreatic ductal adenocarcinoma. Mol Biosyst. 2014;10(6):1461-8.
- 16 Abreu FP, Casa PL, Rossetto MV, Oliveira NS, Bevenuti JL, Cassol MP, et al. Gene expression analysis in cervical cancer progression: towards unveiling alterations from normal to tumoral tissue. Hum Gene. 2022;131(34):1-12.
- 17 Stekel D. Microarray bioinformatics. Cambridge: Cambridge University Press; 2003.
- 18 Korpelainen E, Tuimala J, Somervuo P, Huss M, Wong G. RNA-seq data analysis: a practical approach. 1st ed. New York: Chapman and Hall/CRC Press; 2014.
- 19 Song Y, Gao N, Yang Z, Zhang S, Fan T, Zhang B. Comprehensive molecular analyses of Notch pathway-related genes to predict prognosis and immunotherapy response in patients with gastric cancer. J Oncol. 2023;2023:2205083.
- 20 Estilo CL, O-Charoenrat P, Talbot S, Socci ND, Carlson DL, Ghossein R, et al. Oral tongue cancer gene expression profiling: identification of novel potential prognosticators by oligonucleotide microarray analysis. BMC Cancer. 2009;9:11.
- 21 Costea DE, Hills A, Osman AH, Thurlow J, Kalna G, Huang X, et al. Identification of two distinct carcinoma-associated fibroblast subtypes with differential tumor-promoting abilities in oral squamous cell carcinoma. Cancer Res. 2023;73(13):3888-901.
- 22 Lobert S, Graichen ME, Hamilton RD, Pitman KT, Garrett MR, Hicks C, et al. Prognostic biomarkers for HNSCC using quantitative real-time PCR and microarray analysis: B-tubulin isotypes and the p53 interactome. Cytoskeleton (Hoboken). 2014;71(11):628-37.
- 23 Kase Y, Uzawa K, Wagai S, Yoshimura S, Yamamoto JI, Toeda Y, et al. Engineered exosome delivering specific tumor-suppressive RNAi attenuate oral cancer progression. Sci Rep. 2021;11(1):5897.
- 24 Pita JM, Figueiredo IF, Moura MM, Leite V, Cavaco BM. Cell cycle deregulation and TP53 and RAS mutations are major events in poorly differentiated and undifferentiated thyroid carcinomas. J Clin Endocrinol Metab. 2014;99(3):497-507.
- 25 Roemeling CAV, Marlow LA, Pinkerton AB, Crist A, Miller J, Tun HW, et al. Aberrant lipid metabolism in anaplastic thyroid carcinoma reveals stearoyl CoA desaturase 1 as a novel therapeutic target. J Clin Endocrinol Metab. 2015;100(5):697-709.
- 26 Wojtas B, Pfeifer A, Oczko-Wojciechowska M, Krajewska J, Czarniecka A, Kukulska A, et al. Gene expression (mRNA) markers for differentiating between malignant and benign follicular thyroid tumours. Int J Mol Sci. 2017;18(6):1184.
- 27 Lee S, Bae JS, Jung CK, Chung WY. Extensive lymphatic spread of papillary thyroid microcarcinoma is associated with an increase in expression of genes involved in epithelial mesenchymal transition and cancer stem cell-like properties. Cancer Med. 2019;9(15):6528-37.
- 28 Cancer Genome Atlas Network. Integrated genomic characterization of papillary thyroid carcinoma. Cell. 2014;159(3):676-90.
- 29 Cancer Genome Atlas Network. Comprehensive genomic characterization of head and neck squamous cell carcinomas. Nature. 2015;517(7536):576-82.
- 30 Sinha BK, Tokar EJ, Li J, Bushel PR. Gene expression profiling elucidates cellular responses to NCX4040 in human ovarian tumor cells: implications in the mechanisms of action of NCX4040. Cancers (Basel). 2023;15(1):285.
- 31 R Core Team. R: A language and environment for statistical computing. Vienna: R Foundation for Statistical Computing; 2023.
- 32 Gene Ontology Consortium, Aleksander SA, Balhoff J, Carbon S, Cherry JM, Drabkin HJ, et al. The Gene Ontology knowledgebase in 2023. Genetics. 2023;224(1).
- 33 Ashburner M, Ball CA, Blake JA, Botstein D, Butler H, Cherry JM, et al. Gene ontology: tool for the unification of biology. Nat Genet. 2000;25(1):25-9.
- 34 Kolberg L, Raudvere U, Kuzmin I, Adler P, Vilo J, Peterson H. g:Profiler-interoperable web service for functional enrichment analysis and gene identifier mapping. Nucleic Acids Res. 2023;51(W1):W207-12.
- 35 Doncheva NT, Morris JH, Gorodkin J, Jensen LJ. Cytoscape StringApp: network analysis and visualization of proteomics data. J Proteome Res. 2018;18(2):623-32.
- 36 Shannon P, Markiel A, Ozier O, Baliga NS, Wang JT, Ramage D, et al. Cytoscape: a software environment for integrated models of biomolecular interaction networks. Genome Res. 2003;13(11):2498-504.
- 37 Szklarczyk D, Kirsch R, Koutrouli M, Nastou K, Mehryary F, Hachilif R, et al. The STRING database in 2023: protein-protein association networks and functional enrichment analyses for any sequenced genome of interest. Nucleic Acids Res. 2023;51(D1):D638-46.
- 38 Assenov Y, Ramirez F, Schelhorn SE, Lengauer T, Albrecht M. Computing topological parameters of biological networks. Bioinformatics. 2008;24(2):282-4.
- 39 Legeay M, Doncheva NT, Morris JH, Jensen LJ. Visualize omics data on networks with Omics Visualizer, a Cytoscape app. F1000Res. 2020;9:157.
- 40 Clark TG, Bradburn MJ, Love SB, Altman DG. Survival analysis part I: basic concepts and first analyses. Br J Cancer. 2003;89(2):232-8.
-
41 Therneau TM. A package for survival analysis in R. 2024. Available from: https://CRAN.R-project.org/package=survival
» https://CRAN.R-project.org/package=survival - 42 Fnu G, Weber GF. Alterations of ion homeostasis in cancer metastasis: implications for treatment. Front Oncol. 2021;11:765329.
- 43 Lelievre P, Sancey L, Coll JL, Deniaud A, Busser B. The multifaceted roles of copper in cancer: a trace metal element with dysregulated metabolism, but also a target or a bullet for therapy. Cancers (Basel). 2020;12(12):3594.
- 44 Muthuswamy S. Self-organization in cancer: implications for histopathology, cancer cell biology, and metastasis. Cancer Cell. 2021;39(4):443-6.
- 45 Dunn T. Oxygen and cancer. N C Med J. 1997;58(2):140-3.
- 46 Orang AV, Petersen J, McKinnon RA, Michael MZ. Micromanaging aerobic respiration and glycolysis in cancer cells. Mol Metab. 2019;23:98-126.
- 47 Zelko IN, Mariani TJ, Folz RJ. Superoxide dismutase multigene family: a comparison of the CuZn-SOD (SOD1), Mn-SOD (SOD2), and EC-SOD (SOD3) gene structures, evolution, and expression. Free Radic Biol Med. 2002;33(3):337-49.
- 48 Yokoe H, Nomura H, Yamano Y, Fushimi K, Sakamoto Y, Ogawara K, et al. Alteration of extracellular superoxide dismutase expression is associated with an aggressive phenotype of oral squamous-cell carcinoma. Exp Ther Med. 2010;4(1):585-90.
- 49 Tortora GJ, Derrickson B. Principles of anatomy and physiology. 14th ed. Rio de Janeiro: Guanabara Koogan; 2019.
- 50 Bellini MI, Lori E, Forte F, Lauro A, Tripodi D, Amabile MI, et al. Thyroid and renal cancers: a bidirectional association. Front Oncol. 2022;12:951976.
- 51 Basu G, Mohapatra A. Interactions between thyroid disorders and kidney disease. Indian J Endocrinol Metab. 2012;16(2):204-13.
- 52 Zhao X, Sun S, Zeng X, Cui L. Expression profiles analysis identifies a novel three-mRNA signature to predict overall survival in oral squamous cell carcinoma. Am J Cancer Res. 2018;8(3):450-61.
- 53 Lin NC, Shih YH, Chiu KC, Li PJ, Yang HW, Lanc WC, et al. Association of rs9679162 genetic polymorphism and aberrant expression of polypeptide N-acetylgalactosaminyltransferase 14 (GALNT14) in head and neck cancer. Cancers (Basel). 2022;14(17):4217.
- 54 Zhu G, Wang L, Meng W, Lu S, Cao B, Liang X, et al. LOXL2-enriched small extracellular vesicles mediate hypoxia-induced premetastatic niche and indicate poor outcome of head and neck cancer. Theranostics. 2021;11(19):9198-216.
- 55 Liu C, Guo T, Sakai A, Ren S, Fukusumi T, Ando M, et al. A novel splice variant of LOXL2 promotes progression of human papillomavirus-negative head and neck squamous cell carcinoma. Cancer. 2020;126(4):737-48.
- 56 Wang Z, Lin K, Xiao H. A pan-cancer analysis of the FAT1 in human tumors. Sci Rep. 2022;12(1):21598.
- 57 Lan T, Ge Q, Zheng K, Huang L, Yan Y, Zheng L, et al. FAT1 upregulates in oral squamous cell carcinoma and promotes cell proliferation via cell cycle and DNA repair. Front Oncol. 2022;12:870055.
- 58 Griess B, Tom E, Domann F, Teoh-Fitzgerald M. Extracellular superoxide dismutase and its role in cancer. Free Radic Biol Med. 2017;112:464-79.
- 59 Koike K, Uzawa K, Miyamoto I, Kimura Y, Kasama H, Ishige S, et al. Inactivation of dermatopontin via histone deacetylation in human oral cancer. J Oral Maxillofac Surg Med Pathol. 2017;29(5):400-4.
- 60 Chen ZG, Saba NF, Teng Y. The diverse functions of FAT1 in cancer progression: good, bad, or ugly? J Exp Clin Cancer Res. 2022;41(1):248.
- 61 Yamatoji M, Kasamatsu A, Kouzu Y, Koike H, Sakamoto Y, Ogawara K, et al. Dermatopontin: a potential predictor for metastasis of human oral cancer. Int J Cancer. 2012;130(12):2903-11.
- 62 Chang W, Li H, Zhong L, Zhu T, Chang Z, Ou W, et al. Development of a copper metabolism-related gene signature in lung adenocarcinoma. Front Immunol. 2022;13:1040668.
- 63 Celestino R, Nome T, Pestana A, Hoff AM, Gonçalves AP, Pereira L, et al. CRABP1, C1QL1 and LCN2 are biomarkers of differentiated thyroid carcinoma, and predict extrathyroidal extension. BMC Cancer. 2018;18(1):68.
- 64 Xu S, Mo C, Lin J, Yan Y, Liu X, Wu K, et al. Loss of ID3 drives papillary thyroid cancer metastasis by targeting E47-mediated epithelial to mesenchymal transition. Cell Death Discov. 2021;7(1):226.
- 65 Cao Z, Ao Y, Guo Y, Zhou S. Comprehensive analysis of mRNA expression profiles in head and neck cancer by using robust rank aggregation and weighted gene coexpression network analysis. Biomed Res Int. 2020;2020:4908427.
- 66 Rosignolo F, Sponziello M, Durante C, Puppin C, Mio C, et al. Expression of PAX8 target genes in papillary thyroid carcinoma. PLoS One. 2016;11(6):e0159233.
- 67 Wang Y, Song Z, Leng P, Liu Y. A systematic analysis reveals gene expression alteration of serum deprivation response (SDPR) gene is significantly associated with the survival of patients with cancer. Oncol Rep. 2019;42(3):1161-72.
- 68 Wojtczak B, Pula B, Gomulkiewicz A, Olbromski M, Podhorska-Okolow M, Domoslawski P, et al. Metallothionein isoform expression in benign and malignant thyroid lesions. Anticancer Res. 2017;37(9):5179-85.
- 69 Shen Y, Dong S, Liu J, Zhang L, Zhang J, Zhou H, et al. Identification of potential biomarkers for thyroid cancer using bioinformatics strategy: a study based on GEO datasets. Biomed Res Int. 2020;2020:9710421.
- 70 Cristofaro T, Mascia A, Pappalardo A, D’Andrea B, Nitsch L, Zannini M. Pax8 protein stability is controlled by sumoylation. J Mol Endocrinol. 2009;42(1):35-46.
- 71 Khizer K, Padda J, Khedr A, Tasnim F, Al-Ewaidat OA, Patel V, et al. Paired-box gene 8 (PAX8) and its association with epithelial carcinomas. Cureus. 2021;13(8):e17208.
- 72 Xiang L, Kong B. PAX8 is a novel marker for differentiating between various types of tumor, particularly ovarian epithelial carcinomas. Oncol Lett. 2013;5(3):735-8.
- 73 Patel SA, Hirosue S, Rodrigues P, Vojtasova E, Richardson EK, Ge J, et al. The renal lineage factor PAX8 controls oncogenic signalling in kidney cancer. Nature. 2022;608(7923):999-1006.
-
Editor-in-Chief:
Paulo Vitor Farago
-
Associate Editor:
Marcelo Ricardo Vicari