
ABSTRACT
Although soybean production has been increasing in the state of Rondônia in the last decade, soybean planted area has been estimated indirectly using secondary datasets, which has limited understanding of its spatiotemporal distribution patterns. This study aimed to map and analyze spatial patterns of soybean expansion in Rondônia. We developed a classification technique based on Spectral Mixture Analysis (SMA) derived from Landsat imagery and Decision Tree Classification to detect and map soybean plantations in 2000, 2005, 2010, and 2014. The soybean classification map showed 93% global accuracy, 23% omission and 0% of commission errors for soybean crop fields. The greatest increases of soybean cropped area in the state of Rondônia were observed between 2000-2005 and 2005-2010 time-periods (33,239 ha and 59,628 ha, respectively), mostly located in Southern Rondônia. The expansion of soybean areas to Northern Rondônia (25,627 ha) has mostly occurred in the 2010-2014 time period. We estimate that 95.4% of all newly created soybean plantations, detected by 2014, were established on lands deforested nine or more years earlier. We concluded that the incursion of soybean plantations on lands deforested for other land uses (e.g. ranching) is contributing to their displacement (pastures) from older colonization zones toward more remote frontier areas of the Amazon, exacerbating new deforestation there.
Keywords:
Brazilian Amazon; Tropical deforestation; Land-use and land-cover change; Geoprocessing; Agricultural commodities
RESUMO
Os plantios de soja têm aumentado ao Norte e Sul dos municípios de Rondônia na última década, entretanto a área plantada de soja tem sido estimada utilizando dados secundários, o que limita o entendimento da distribuição espaço temporal da soja. Este estudo buscou analisar e mapear os padrões espaciais de expansão da soja em Rondônia. O mapeamento de plantios de soja nos anos 2000, 2005, 2010 e 2014 foi feito a partir de uma técnica de classificação baseada na análise de mistura espectral de imagens Landsat e em uma árvore de decisão. A acurácia global, erros de omissão e comissão para o mapeamento da soja foram 93%, 23% e 0%, respectivamente. Os resultados mostraram que os maiores incrementos da área de soja ocorreram no estado de Rondônia entre os períodos de 2000-2005 e 2005-2010 (33,239 ha e 59,628 ha, respectivamente). A expansão das áreas de soja para o norte de Rondônia (25,627 ha) ocorreu em sua maioria no período de 2010 a 2014. Observou-se que 95,4% de todos os plantios de soja detectados em 2014 ocorreram em áreas com pelo menos nove anos de desmatamento. Além disso, encontramos evidências de que os plantios de soja estão contribuindo para o deslocamento de usos da terra prévios de antigas zonas de colonização, predominantemente pastos que foram empurrados para outras áreas de fronteiras da Amazônia, e lá exacerbando novos desmatamentos.
Palavras-chave:
Amazônia Brasileira; Desmatamento; Mudanças no uso e cobertura da terra; Geoprocessamento; commodities agrícolas
INTRODUCTION
The trade of agricultural commodities plays an important role in the Brazilian economy (Simon and Garagorry 2005Simon, M.F. and Garagorry, F.L. 2005.The expansion of agriculture in the Brazilian Amazon. Environmental Conservation, 32:203-212.). The Brazilian federal government has invested massively to achieve high agricultural production in recent decades, especially in the Amazon region (Chaddad and Jank 2006Chaddad, F.R. and Jank, M.S. 2006.The evolution of agricultural policies and agribusiness development in Brazil. CHOICES: The Magazine of food, farm, and resource issue, 21:85-90.). Public investments have included funding for improving transport infrastructure to foster the soybean boom (Vera-Diaz et al. 2009Vera-Diaz, M.C.; Kaufmann, R.K.; Nesptad, D.C. 2009. The environmental impacts of soybean expansion and infrastructure development in Brazil's Amazon basin. Global Development and Environment Institute, working paper n. 09-05:1 - 21.). Soybean plantations were initially introduced in the Brazilian Amazon in the 1990s after new plant varieties were developed that could tolerate the regional climate (Fearnside 2001Fearnside, P.M. 2001. Soybean cultivation as a threat to the environmental in Brazil. Environmental Conservation, 28: 23-38.).
As a result of these favorable economic conditions, soybean plantations have become an increasing environmental concern in the Brazilian Amazon because of their potential impacts on land use and land cover change patterns (Morton et al. 2006Morton, D.C.; Defries, R.S.; Shimabukuro, Y.E. 2006. Cropland expansion changes deforestation dynamics in the southern Brazilian Amazon. Proceedings of the National Academy of Sciences of the United States of America, 103:14637-41.; Lapola et al. 2010Lapola, D.M.; Schaldach, R.; Alcamo, J.; Boundeau, A.; Koch, J.; Koelking, C.; Priess, J.A. 2010. Indirect land-use changes can overcome carbon savings from biofuels in Brazil. Proceedings of the National Academy of Sciences, 107:3388-3393.; Arima et al. 2011Arima, E.Y.; Richards, P.;Walker, R.; Caldas, M. 2011. Statistical confirmation of indirect land use change in the Brazilian Amazon. Environmental Research Letters, 6:1-7.).
In the case of the Western Brazilian Amazon state of Rondônia, the area occupied by soybean plantations has substantially increased in the last decade (Brown et al. 2004Brown, J.C.; Jepson, W.; Price, K.P. 2004. Expansion of mechanized agriculture and land-cover change in southern Rondônia, Brazil. Journal of Latin American Geography, 3:96-102.), with areas cropped with soybean increasing from 118 km² to 1000 km² between 2000 and 2005 (IBGE 2015IBGE - Brazilian Institute for Geography and Statistics, 2015. Cattle herds and soybean area in Rondônia municipalities ( Cattle herds and soybean area in Rondônia municipalities (http://www.ibge.gov.br
.). Access on:10/08/2015.
http://www.ibge.gov.br...
). The expansion of soybean plantations is directly related to land availability, relatively lower land prices, high foreign demand for soybean, and increased tax incentives for cultivation of this commodity (Fearnside 2001Fearnside, P.M. 2001. Soybean cultivation as a threat to the environmental in Brazil. Environmental Conservation, 28: 23-38.; Brown et al. 2005Brown, J.C.; Koeppe, M.; Price, K.P. 2005. Soybean production and conversion of tropical forest in the Brazilian Amazon: the case of Vilhena, Rondônia. Ambio, 34: 462-469.).
Several studies have used Landsat images to map land use and land cover changes inside areas affected by soybean expansion within the Brazilian Amazon (Brown et al. 2005Brown, J.C.; Koeppe, M.; Price, K.P. 2005. Soybean production and conversion of tropical forest in the Brazilian Amazon: the case of Vilhena, Rondônia. Ambio, 34: 462-469.; Morton et al. 2006Morton, D.C.; Defries, R.S.; Shimabukuro, Y.E. 2006. Cropland expansion changes deforestation dynamics in the southern Brazilian Amazon. Proceedings of the National Academy of Sciences of the United States of America, 103:14637-41.; Mello et al. 2012Mello, A.Y.I.; Alves, D.S.; Linhares, C.A.; Lima, F.B. 2012. Classification techniques for Landsat TM imagery under different landscape patterns in Rondônia. Revista Árvore,36: 537-547.). In addition, Roberts et al. (2002Roberts, D.A.; Numata, I.; Holmes, K.; Batista, G; Krug, T.; Monteiro, A.; Powell, B.; Chadwick, O.A. 2002. Large area mapping of land-cover change in Rondônia using multitemporal spectral mixture analysis and decision tree classifiers. Journal of Geophysical Research, 107: LBA 40 -1 - 40-8.) used SMA (Spectral Mixture Analysis) and a decision tree classifier to assess land use changes in three municipalities of Rondônia between 1975 and 1999. Brown et al. (2005) assessed land use and land cover change between 1996 and 2001 in the municipality of Vilhena, which is located in of the southern portion of Rondônia. In their research, Brown and his collaborators did not observe significant changes caused by soybean plantation on areas occupied by native forests. Similarly, Brandão et al. (2005Brandão, A.S.P.; Rezende, G.C.; Marques, R.W.C. 2005. Agricultural growth in the period 1999-2004, outburst in soybeans area and environmental impacts in Brazil. Instituto de Pesquisa Econômica Aplicada, 1062:18.) suggested that newly deforested land would be not suitable for soybean plantations because of forest leftovers (i.e., wood debris and tree roots) that resist the slash-and-burn process. Moreover, Gollnow and Lakes (2014Gollnow, F. and Lakes, T. 2014. Policy change, land use, and agriculture: the case of soy production and cattle ranching in Brazil, 2001-2012. Applied Geography, 55:201-211.) found associations between cattle raising, soy expansion and deforestation along the BR -163 in the state of Mato Grosso. These authors also affirmed that cattle ranching had a strong relationship with deforestation until 2004.
In this study we examined the extent of time required for soybean plantations to be established and inferred the potential deforestation leakage effects due to soybean plantations displacing pastures, many of which appear to be being reestablished by deforesting previously undisturbed forested areas along Rondônia´s frontier areas. This study aimed to investigate the soybean spatiotemporal expansion in Rondônia during the period of 2000, 2005, 2010 and 2014.
MATERIALS AND METHODS
Our study area comprised the entire state of Rondônia (~230,000 km2) and it included portions of 18 Landsat scenes. Signs of soybean crop lands were searched for throughout the study area. We focused our analysis most strongly in those municipalities that were consistently reported by IBGE (2015IBGE - Brazilian Institute for Geography and Statistics, 2015. Cattle herds and soybean area in Rondônia municipalities ( Cattle herds and soybean area in Rondônia municipalities (http://www.ibge.gov.br
.). Access on:10/08/2015.
http://www.ibge.gov.br...
) as hotspots for soybean production in Rondônia over the last decade. Evidence of soybean plantations were found within 7 (2000-2005-2010) and 8 (2014) individual Landsat scenes, respectively, which defined the effective area of study used in subsequent analyses (Figure 1).

municipalities and SPOT and Landsat scenes used to map and verify soybean plantations in 2014 within the state of Rondônia, Brazil. 1 - Cujubim, 2 - Rio Crespo, 3 - Vale do Anari, 4 - Theobroma, 5 - Monte Negro, 6 - Cacaulândia, 7 - Vale do Paraíso, 8 - Governador Jorge Teixeira, 9 - Ouro Preto do Oeste, 10 - Nova União, 11 - Teixeiropólis, 12 - Presidente Médici, 13 - Ministro Andreazza, 14 - Castanheiras, 15 - Nova Brasilândia do Oeste, 16 - Novo Horizonte do Oeste, 17 - Rolim de Moura, 18 - Santa Luzia D'oeste, 19 - São Felipe D'oeste, 20 - Primavera de Rondônia, 21- Alto Alegre do Parecis, 22 - Chupinguaia, 23 - Corumbiara, 24 - Cerejeiras, 25 - Colorado do Oeste, 26 - Pimenteiras, 27 - Cabixi.
After our initial assessment, we analyzed the Landsat scenes from four time periods (2000, 2005, 2010, and 2014) that encompassed all municipalities where evidence of soybean plantations existed. The Landsat images used in our analysis were provided by the National Institute for Space Research (INPE). Landsat images were acquired between May and August, the most cloud-free period, which also minimized seasonal effects due to moisture and vegetation growth within the remote sensing data. In addition, we used two SPOT 5 scenes (2.5 meter spatial resolution) and one Landsat TM scene acquired in May 2008 for the accuracy assessment of the soybean classification map (see further details in Table 1).
Fieldwork was carried out in February 2012 to validate the remote sensing techniques and to acquire further land use datasets. This fieldwork included road surveys on the BR-364 federal highway and on the state roads RO-399, RO-370, RO-497, RO-487, and RO-485 for field observations and interviews with government agency employees while searching for supporting data (location and preferred soybean fields, soybean crop cycles, and land prices). The surveys started on February 13th, 2012 and lasted ten days. During the fieldwork, we visited and collected in situ soybean and deforestation data from sixteen municipalities (Porto Velho, Itapuã do Oeste, Alto Paraíso, Ariquemes, Jaru, Ouro Preto, Ji-Paraná, Presidente Médici, Castanheiras, Rolim de Moura, Pimenta Bueno, Vilhena, Colorado, Corumbiara, Cerejeiras, and Pimenteiras do Oeste).
Radiometric corrections were conducted on the Landsat imagery by converting digital numbers into physical values of radiance and, subsequently, radiance into apparent reflectance at top of atmosphere (Chander and Markham 2003Chander, G. and Markham, B. 2003. Revised Landsat-5 TM radiometric calibration procedures and post calibration dynamic ranges. IEEE transactions on Geoscience and Remote Sensing, 41:2674-2677.) using ENVI 4.5(r) software calibration tools. Geometric correction was carried out using orthorectified images acquired from the Global Land Cover Facility (GLCF 2014Global Land Cover Facility (GLCF). 2014. Data and Products: Landsat Imagery. ( (http://glcf.umd.edu/
). Access on: 02/06/2014.
http://glcf.umd.edu/...
), University of Maryland. The Landsat images were georeferenced using first-order polynomial models and the nearest neighbor resampling technique. Individual geometric correction was deemed acceptable only when RMS was less than 0.5 pixel.
Spectral Mixture Analysis (SMA) was applied to retrieve fraction images (Shade, Non-Photosynthetic Vegetation, Vegetation, and Soil) (eq. 1) used as input in a decision tree classifier from Envi 4.5(r) to detect soybean cropped areas. The spatial mixing proportions of each pixel can be estimated by SMA, which compares mixed spectral signatures of different targets to a group of endmember pixels. This comparison resulted in estimates of different proportions of each endmember within mixed pixels (Adams et al. 1995Adams, J. B.; Sabol, D. E.; Kapos, V.; Filho, R. A.; Roberts, D. A.; Smith, M. O.; Gillespie, A. R. 1995. Classification of multispectral images based on fractions of endmembers: application to land-cover change in the Brazilian Amazon. Remote Sensing of Environment, 52:137-154.; Lillesand et al. 2004Lillesand, T.M.; Kiefer, R.W.; Chipman, J.W. 2004. Remote Sensing and Image Interpretation.6 ed. John Wiley and Sons, New York, 804p.). Each pixel is decomposed into a collection of fractions corresponding to the proportion of each endmember present in the pixel (Keshava and Mustard 2002Keshava, N. and Mustard, J.F. 2002.Spectral Unmixing. IEEE Signal Processing Magazine, 19:44-57.). The endmember pixels were extracted from 2-D scatter plots, using the red and near infrared bands for each scene of Landsat 5 TM and Landsat 8 OLI. Endmembers were collected under similar atmospheric conditions. Field observations of known sites and a visual and spectral examination of spectral shape and image context was conducted accordingly to select the final endmembers for the SMA. Each pixel composition was unmixed into vegetation, bare soil, NPV (non-photosynthetic vegetation) and shadow fractions (Roberts et al. 1993Roberts, D. A.; Smith, M.O.; Adams, J.B. 1993. Green Vegetation, nonphotosynthetic vegetation, and soils in AVIRIS data. Remote Sensing of Environment, 44:255-269.). The Linear mixture model is defined by (Rencz 1999Rencz, A. N. and Ryerson, R. A. 1999. Remote sensing of the earth sciences. Manual of Remote Sensing. 3rd ed. American Society for Photogrammetry and Remote, Canada. Sensing.728p.):
(eq.1)
where:
DNb = intensity of a given pixel in bandpass 'b'
DNib = intensity of image endmember 'i' at wavelength 'b'
Rib= reflectance of endmember 'i' in bandpass 'b'
N = number of endmembers
ɛb = error of the fit for bandpass 'b'
Based on RMS (Root Mean Square) matrix of SMA, we discarded models with RMS values greater than 5%. In addition, we inspected histograms of fraction images and only models that presented at least 95% of values within 0% and 100% were kept.
The endmembers used in SMA are a result of mixing with different materials and, therefore, fractional abundance of an endmember may be slightly less than 0 or greater than 1. This conditions indicates that two materials were combined, resulting in a negative or greater than 1 fraction value but those values do not necessarily mean that there are method errors (Rencz 1999Rencz, A. N. and Ryerson, R. A. 1999. Remote sensing of the earth sciences. Manual of Remote Sensing. 3rd ed. American Society for Photogrammetry and Remote, Canada. Sensing.728p.).
The mean texture algorithm was used to estimate texture of bands 4 and 7 (Landsat 5 TM) and of bands 5 and 7 (Landsat 8 OLI). For the texture parameters, we applied the filter mean based on occurrence measures in 3 x 3 kernel size. The maximum and minimum values of band 4 and band 5 texture images for soybean areas were defined based on a detailed analysis of the spectral profile of known soybean cropped lands.
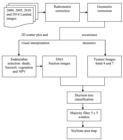
Subsequently, we developed a decision tree classification technique using as input the SMA fraction images and texture images to detect soybean cropped areas (Figure 2). We used spectral responses of SMA and texture images as inputs in the different nodes of the decision tree.
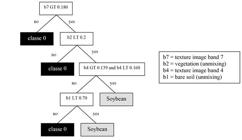
First, the vegetation fraction images retrieved from SMA were used to detect forested and non-forested areas, and soil fraction images were used to detect soybean areas (fallow areas). Based on our field observations in Rondônia, we assumed that a three month-fallow period (between July 15th and September 15th) was adopted by the farmers to control plant diseases, following the government policy locally known as "vazio sanitário".
In addition, we used texture images retrieved from bands 4 and 7 for each Landsat scene as an additional input to the decision tree classifier to differentiate pastures from soybean areas. Our field observations indicated that most pasture areas in our study site were formed by a mosaic of grass and isolated trees. The presence of trees created a rougher texture surface on Landsat imagery when compared to soybean cropped areas that are generally free from any trees. Figure 3 shows the different steps used to detect soybean cropped area within our study area.
The accuracy assessment was conducted by comparing binary classifications (1 = soybean cropped areas, 0 = non-soybean cropped areas) from the soybean map derived from Landsat 5 TM imagery with 130 random spatially distributed points which were checked on two higher resolution SPOT 5 scenes. Both Landsat and SPOT images were acquired in May 2008. A confusion matrix developed by Cohen (1960Cohen, A.D.1960. A coefficient of agreement for nominal scales. Educational and Psychological Measurement, 20:37-46.) was used to provide the accuracy quantification of the soybean cropped area classification in this analysis.
Multi-annual deforestation dataset layers for 1997 through 2014, produced by the Amazonian Deforestation Satellite Monitoring Program (PRODES) at the Brazilian National Institute of Space Research (INPE) were used in this research to identify the year of deforestation for each of the soybean cropped lands. Between 1988 and 2002, the PRODES project used visual interpretation to map deforestation throughout the Amazon. Between 2003 and 2005, PRODES applied SMA and unsupervised classification. Since then, PRODES has been applying the Terra Amazon Classification System and subsequent visual inspection and editing to classify deforestation in the Amazon region. Each annual layer included six classes of land cover types (deforestation, forest, non-forest, water bodies, clouds, residual). Piontekowski et al. (2014Piontekowski, V.J.; Matricardi, E.A.T.; Pedlowski, M.A.; Fernandes, L.C. 2014. Deforestation assessment in the State of Rondônia between 2001 and 2011. Floram:Brazilian Journal of Forestry and Environment. 21: 297-306.) have assessed the accuracy of the PRODES dataset for the state of Rondônia and reported an overall accuracy of 93.3% for forest and deforestation classes.
RESULTS
Fieldwork
We observed in our fieldwork that farmers till the soils, apply herbicides and remove grasses. Subsequently, in the middle of September, soybean crops are finally planted. The full soybean cycle takes from 100 days (very early-soybean) to 130 days (late or semi-late soybean). Soybean crop harvest begins in January and finishes in March. Just after the end of soybean harvest, a period locally called "safrinha" is started. The "safrinha" is a practice of planting cover crops of corn or sorghum in the same areas of the soybean harvest. The "safrinha" partly overlaps with the period in which soybean planting is not allowed (the "vazio sanitário") which begins on June 15th and lasts 90 days. This annual soybean cultivation break has been enforced since 2006 in Rondônia to reduce the spread of diseases in soybeans plantations.
Most of the soybean croplands in Rondônia were observed in municipalities located in the Southern portion of the state (i.e., Vilhena, Corumbiara, Colorado, Cerejeiras, and Pimenteiras do Oeste), but we also observed increasing numbers of plantation areas in municipalities located in the Northern portion (i.e., Ariquemes, Itapuã do Oeste, and Porto Velho) in more recent years. The fieldwork was especially important because it allowed the development of techniques to discriminate soybean and corn areas from pasture within the satellite images.
Accuracy Assessment
The classifier presents a satisfactory performance with 93% global accuracy, greater than the good accuracy value suggested by Jensen (1986Jensen, J.R. 1986. Introductory digital image processing.3 ed. Englewood Cliffs: Prentice - Hall, Upper Saddle River, New Jersey, 544p.) and Congalton (1991Congalton, R. G. 1991. A review of assessing the accuracy of classifications of remotely sensed data. Remote Sensing of Environmental, 37:35-46.).
Our results showed that the decision tree classification technique correctly detected 77% of soybean areas, without any commission errors. According to Landis and Koch (1977Landis, J.R. and Koch, G.G.1977. The measurement of observer for categorical data. Biometrics, 33:159-174.) our accuracy results indicate a strong agreement with the classified imagery and the high spatial resolution reference image. Furthermore, this technique showed better results for classifying ripe soybeans, immediately before or just after the end of the harvesting season. Table 2 shows further details on the accuracy assessment of the soybean classification maps.
Accuracy assessment based on two reference SPOT images and the soybean cropped land classification.
Soybean fields
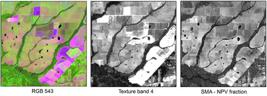
The semi-automated soybean classification approach allowed the detection of soybean areas. Most pastures were easily detected because of the presence of palm trees. As a result, NPV fractions from SMA mapping were used to exclude pastures in some cases.
Soybean and pasture areas can be misclassified because of their spectral similarity. The fieldwork was crucial to differentiate soybean from pasture. During the fieldwork we observed that most pasture lands in Rondônia (including those located in the Vilhena municipality) showed presence of palm and other tree species. Based on this feature, we assumed the trees were already present in the pasture areas for 2000 and 2005. As a result, we used the near infrared and shortwave infrared bands to estimate texture images (mean algorithm). The texture and SMA images (Figure 3) enhanced presence of palm and other tree species within pasture lands, which helped to differentiate pasture lands from soybean lands.
Our results showed that soybean cropped areas substantially increased from 28,503 to 61,472 ha between 2000 and 2005, further 121,370 ha by 2010, and 147,812 ha by 2014 (Figure 4). The relatively small amount of soybean lands in 2000 was highly concentrated in Southern Rondônia, mostly in the municipality of Vilhena. In 2010, the distribution of soybean plantations was spread among different municipalities in Southern Rondônia: Vilhena (36,362 ha), Corumbiara (24,576 ha), Chupinguaia (15,836 ha), Cerejeiras (13,306 ha), and Pimenteiras do Oeste (13,228 ha). In 2014, the greatly expanded soybean area had spread further out to Central and Northern Rondônia (Figure 5). Our results are comparable to IBGE (2015IBGE - Brazilian Institute for Geography and Statistics, 2015. Cattle herds and soybean area in Rondônia municipalities ( Cattle herds and soybean area in Rondônia municipalities (http://www.ibge.gov.br
.). Access on:10/08/2015.
http://www.ibge.gov.br...
) statistics , with each estimating a similar soybean planted area across Rondônia´s municipalities.

Soybean areas detected in 2000, 2005, 2010, and 2014 were overlapped with the deforestation dataset provided by the Amazonian Deforestation Satellite Monitoring Program (PRODES) (Table 3). This analysis showed that more than 95% of new soybean cropped lands were established on lands deforested nine or more years earlier, with 72% deforested by 1997, and 23% deforested between 1997 and 2005. Our results for Rondônia are consistent with previous research suggesting that cattle pastures are being replaced by soybean plantations in the Amazonian state of Mato Grosso (Pongratz et al 2006Pontgraz, J.; Bounoua, L.; DeFries, R.S.; Morton, D.C.; Anderson, L.O. 2006. The impact of land cover change on surface energy and water balance in Mato Grosso, Brazil. Earth Interactions, 10:1-17.).
We observed that soybean fields tend to be concentrated in larger cropping fields in Southern Rondônia (Vilhena, Cerejeiras, Colorado do Oeste, Pimenteiras, Corumbiara, and Chupinguaia municipalities), a more consolidated region, while being more fragmented and smaller in Northern Rondônia (Porto Velho, Machadinho, Nova Mamoré, Cujubim and Buritis municipalities) as of 2014. In the recent northern soybean frontier, 58.3% of soybean fields were less than 100 ha, 41.7% were between 100 and 1000 ha, and none were larger than 1,000 ha. In comparison, 24.4% of soybean fields were less than 100 ha, 47.7% sized between 100 and 1000 ha, and 28% were larger than 1,000 ha within the older southern region.
DISCUSSION
Despite the historic role of cattle raising as a major driver for the expansion of deforestation, soybean is rapidly becoming an important cause of land clearing in the Brazilian Amazon . The increase in soybean plantations is indirectly affecting the rates of deforestation in several Brazilian Amazon States (e.g., Rondônia, Pará, and Mato Grosso) because of the displacement of cattle ranching to areas still covered with primary forests (Barona et al. 2010Barona, E.; Ramankutty, N.; Hyman, G.; Coomes, O.T. 2010.The role of pasture and soybean in deforestation of the Brazilian Amazon. Environmental Research Letters, 5:9.). The relationship between soybean expansion and fresh deforestation is particularly important because farmers are moving from old colonization frontiers to remote areas in the Brazilian Amazon. In addition, instead of adopting the traditional cycle starting with annual crops and ending with pastures, these farmers may convert forested lands directly into pastures (Brandão et al. 2005Brandão, A.S.P.; Rezende, G.C.; Marques, R.W.C. 2005. Agricultural growth in the period 1999-2004, outburst in soybeans area and environmental impacts in Brazil. Instituto de Pesquisa Econômica Aplicada, 1062:18.; Barona et al. 2010).
Barona et al. (2010Barona, E.; Ramankutty, N.; Hyman, G.; Coomes, O.T. 2010.The role of pasture and soybean in deforestation of the Brazilian Amazon. Environmental Research Letters, 5:9.) estimated that there is a high statistical correlation between deforestation and pastures and low correlation between deforestation and soybean expansion. Their results also indicated a high correlation between the decline of pasture quality and soybean expansion in the state of Mato Grosso. Assuming that a similar correlation might be applied to Rondônia, soybean plantations may have been replacing pastures after they reach a certain economic and environmental threshold. However, Barona and his collaborators could not conclude the extension to which deforestation in the Legal Amazon is related to pasture expansion or soybean expansion. Accordingly, Barona et al. (2010) and Morton et al. (2006Morton, D.C.; Defries, R.S.; Shimabukuro, Y.E. 2006. Cropland expansion changes deforestation dynamics in the southern Brazilian Amazon. Proceedings of the National Academy of Sciences of the United States of America, 103:14637-41.) observed that while cattle raising is expanding into forest edges, mechanized agriculture (e.g. soybean plantations) is concentrating on old colonization areas in the Brazilian Amazon.
Moreover, pastures are more likely to be converted to soybean plantations when the profits of soy production increase and, consequently, cause the displacement of cattle raising to new colonization areas (Arima et al. 2011Arima, E.Y.; Richards, P.;Walker, R.; Caldas, M. 2011. Statistical confirmation of indirect land use change in the Brazilian Amazon. Environmental Research Letters, 6:1-7.). Macedo et al. (2011Macedo, M.N.; DeFries, R.S.; Morton, D.C.; Stickler, C.M.; Galford, G.L.; Shimabukuro, Y.E. 2011. Decoupling of deforestation and soy production in the southern Amazon during the late 2000s. Proceedings of the National Academy of Sciences of the United States of America, 109:1341-1346.) confirm that a wide range of forested areas were replaced by pasture and, subsequently, converted into soybean areas in the southern Brazilian Amazon. Macedo and her collaborators have estimated that between 2000 and 2005, 91% of pastures in the state of Mato Grosso were replaced by soybean plantations.
Our results lend support to the model of cattle raising displacement operations from older frontiers to new colonization areas occurring in Rondônia. Spatial patterns of land concentration and movement of soybean plantation over the years may indicate that small farmers and ranchers are increasingly being displaced from the older consolidated regions of southern Rondônia towards frontier areas of Northern Rondônia where standing forests are steadily being converted into pasture lands. Consequently, in the north, there has been a large increase in cattle herd numbers and deforestation rates (126,996 head year-1 and 774,300 ha year-1, respectively) between 2002 and 2013 (IBGE 2015IBGE - Brazilian Institute for Geography and Statistics, 2015. Cattle herds and soybean area in Rondônia municipalities ( Cattle herds and soybean area in Rondônia municipalities (http://www.ibge.gov.br
.). Access on:10/08/2015.
http://www.ibge.gov.br...
; INPE 2015INPE - National Institute for Spatial Research, 2015. Satellite images and geographic data of Rondônia ( Satellite images and geographic data of Rondônia (http://www.inpe.br
.). Access on: 08/06/2015.
http://www.inpe.br...
). Meanwhile, cattle numbers and deforestation rates have increased only modestly (5,980 head year-1 and 115,691 hayear-1, respectively) in the southern region during the same period of time (IBGE 2015; INPE 2015).
Recently, several authors have mentioned that the Soy Moratorium and other policies have contributed to declining deforestation rates in the Brazilian Amazon. The Soy Moratorium was signed by major soybean traders in an agreement not to purchase any soybeans grown on lands deforested after July 24th2006. Our research results suggest that many forested areas in Rondônia that were cleared and converted to pasture since 2006 are now economically viable for conversion to soybean cropping. Therefore, the effectiveness of the Soy Moratorium, as reported by Rudorff et al. (2011Rudorf, B.F.T.; Adami, M.; Aguiar, D.A.; Moreira, M.A.; Mello, M.P.; Fabiani, L.; Amaral, D.F.; Pires, B.M. 2011. The Soy moratorium in the Amazon Biome Monitored by Remote Sensing Images. Remote Sensing, 3:185-202.) and the hypothesis of the positive effects of the soy supply chain to reduce deforestation rates in the Amazon region, as suggested by Nepstad et al. (2014Nepstad, D.; McGrath, D.; Stickler, C.; Alencar, A.; Azevedo, A.; Swette, B. et al. 2014. Slowing Amazon deforestation through public policy and interventions in beef and soy supply chains. Science. 344: 1118-1123.) and Gibbs et al. (2015Gibbs, H.K.; Rausch, L.; Munger, J.; Schelly, I.; Morton, D.C.; Noojipady, P.; Soares-Filho, B.; Barreto, P.; Micol, L.; Walker, N.F. 2015. Brazil´s Soy Moratorium, supply-chain governance is needed to avoid deforestation. Science, 347(6220):377-378.) may only now be directly assessed for the case of Rondônia.
CONCLUSIONS
This study presented an alternative approach to map soybean plantations in the Brazilian Amazon based on remotely sensed data and techniques and field work combined. Our soybean mapping showed a new increasing frontier of soybean cropped areas in Northern Rondônia in recent years. We concluded that soybeans plantations are possibly replacing old deforestation sites and moving those former land uses to new colonization of fresh deforestation areas. Moreover, soybean plantations can only settle in areas with 9 or more years after deforestation, in compliance with the dictates of the Soy Moratorium. Finally, we argue that, because soybean cultivations are a lucrative and increasingly widespread land use, its impacts on the overall rates of deforestation have yet to be accurately quantified or appropriately considered by policymakers for the Brazilian Amazon.
ACKNOWLEDGMENTS
Financial support for this study was provided by Coordenação de Aperfeiçoamento de Pessoal de Nível Superior (CAPES), by the Brazilian National Council of Science and Technology (CNPQ), and MAC was funded by NASA grant NNX11AB89G
- Adams, J. B.; Sabol, D. E.; Kapos, V.; Filho, R. A.; Roberts, D. A.; Smith, M. O.; Gillespie, A. R. 1995. Classification of multispectral images based on fractions of endmembers: application to land-cover change in the Brazilian Amazon. Remote Sensing of Environment, 52:137-154.
- Arima, E.Y.; Richards, P.;Walker, R.; Caldas, M. 2011. Statistical confirmation of indirect land use change in the Brazilian Amazon. Environmental Research Letters, 6:1-7.
- Barona, E.; Ramankutty, N.; Hyman, G.; Coomes, O.T. 2010.The role of pasture and soybean in deforestation of the Brazilian Amazon. Environmental Research Letters, 5:9.
- Brandão, A.S.P.; Rezende, G.C.; Marques, R.W.C. 2005. Agricultural growth in the period 1999-2004, outburst in soybeans area and environmental impacts in Brazil. Instituto de Pesquisa Econômica Aplicada, 1062:18.
- Brown, J.C.; Jepson, W.; Price, K.P. 2004. Expansion of mechanized agriculture and land-cover change in southern Rondônia, Brazil. Journal of Latin American Geography, 3:96-102.
- Brown, J.C.; Koeppe, M.; Price, K.P. 2005. Soybean production and conversion of tropical forest in the Brazilian Amazon: the case of Vilhena, Rondônia. Ambio, 34: 462-469.
- Chaddad, F.R. and Jank, M.S. 2006.The evolution of agricultural policies and agribusiness development in Brazil. CHOICES: The Magazine of food, farm, and resource issue, 21:85-90.
- Chander, G. and Markham, B. 2003. Revised Landsat-5 TM radiometric calibration procedures and post calibration dynamic ranges. IEEE transactions on Geoscience and Remote Sensing, 41:2674-2677.
- Cohen, A.D.1960. A coefficient of agreement for nominal scales. Educational and Psychological Measurement, 20:37-46.
- Congalton, R. G. 1991. A review of assessing the accuracy of classifications of remotely sensed data. Remote Sensing of Environmental, 37:35-46.
- Fearnside, P.M. 2001. Soybean cultivation as a threat to the environmental in Brazil. Environmental Conservation, 28: 23-38.
- Gibbs, H.K.; Rausch, L.; Munger, J.; Schelly, I.; Morton, D.C.; Noojipady, P.; Soares-Filho, B.; Barreto, P.; Micol, L.; Walker, N.F. 2015. Brazil´s Soy Moratorium, supply-chain governance is needed to avoid deforestation. Science, 347(6220):377-378.
- Global Land Cover Facility (GLCF). 2014. Data and Products: Landsat Imagery. ( (http://glcf.umd.edu/ ). Access on: 02/06/2014.
» http://glcf.umd.edu/ - Gollnow, F. and Lakes, T. 2014. Policy change, land use, and agriculture: the case of soy production and cattle ranching in Brazil, 2001-2012. Applied Geography, 55:201-211.
- IBGE - Brazilian Institute for Geography and Statistics, 2015. Cattle herds and soybean area in Rondônia municipalities ( Cattle herds and soybean area in Rondônia municipalities (http://www.ibge.gov.br ). Access on:10/08/2015.
» http://www.ibge.gov.br - INPE - National Institute for Spatial Research, 2015. Satellite images and geographic data of Rondônia ( Satellite images and geographic data of Rondônia (http://www.inpe.br ). Access on: 08/06/2015.
» http://www.inpe.br - Jensen, J.R. 1986. Introductory digital image processing3 ed. Englewood Cliffs: Prentice - Hall, Upper Saddle River, New Jersey, 544p.
- Keshava, N. and Mustard, J.F. 2002.Spectral Unmixing. IEEE Signal Processing Magazine, 19:44-57.
- Landis, J.R. and Koch, G.G.1977. The measurement of observer for categorical data. Biometrics, 33:159-174.
- Lapola, D.M.; Schaldach, R.; Alcamo, J.; Boundeau, A.; Koch, J.; Koelking, C.; Priess, J.A. 2010. Indirect land-use changes can overcome carbon savings from biofuels in Brazil. Proceedings of the National Academy of Sciences, 107:3388-3393.
- Lillesand, T.M.; Kiefer, R.W.; Chipman, J.W. 2004. Remote Sensing and Image Interpretation6 ed. John Wiley and Sons, New York, 804p.
- Macedo, M.N.; DeFries, R.S.; Morton, D.C.; Stickler, C.M.; Galford, G.L.; Shimabukuro, Y.E. 2011. Decoupling of deforestation and soy production in the southern Amazon during the late 2000s. Proceedings of the National Academy of Sciences of the United States of America, 109:1341-1346.
- Mello, A.Y.I.; Alves, D.S.; Linhares, C.A.; Lima, F.B. 2012. Classification techniques for Landsat TM imagery under different landscape patterns in Rondônia. Revista Árvore,36: 537-547.
- Morton, D.C.; Defries, R.S.; Shimabukuro, Y.E. 2006. Cropland expansion changes deforestation dynamics in the southern Brazilian Amazon. Proceedings of the National Academy of Sciences of the United States of America, 103:14637-41.
- Nepstad, D.; McGrath, D.; Stickler, C.; Alencar, A.; Azevedo, A.; Swette, B. et al 2014. Slowing Amazon deforestation through public policy and interventions in beef and soy supply chains. Science 344: 1118-1123.
- Piontekowski, V.J.; Matricardi, E.A.T.; Pedlowski, M.A.; Fernandes, L.C. 2014. Deforestation assessment in the State of Rondônia between 2001 and 2011. Floram:Brazilian Journal of Forestry and Environment 21: 297-306.
- Pontgraz, J.; Bounoua, L.; DeFries, R.S.; Morton, D.C.; Anderson, L.O. 2006. The impact of land cover change on surface energy and water balance in Mato Grosso, Brazil. Earth Interactions, 10:1-17.
- Rencz, A. N. and Ryerson, R. A. 1999. Remote sensing of the earth sciences Manual of Remote Sensing 3rd ed. American Society for Photogrammetry and Remote, Canada. Sensing.728p.
- Roberts, D. A.; Smith, M.O.; Adams, J.B. 1993. Green Vegetation, nonphotosynthetic vegetation, and soils in AVIRIS data. Remote Sensing of Environment, 44:255-269.
- Roberts, D.A.; Numata, I.; Holmes, K.; Batista, G; Krug, T.; Monteiro, A.; Powell, B.; Chadwick, O.A. 2002. Large area mapping of land-cover change in Rondônia using multitemporal spectral mixture analysis and decision tree classifiers. Journal of Geophysical Research, 107: LBA 40 -1 - 40-8.
- Rudorf, B.F.T.; Adami, M.; Aguiar, D.A.; Moreira, M.A.; Mello, M.P.; Fabiani, L.; Amaral, D.F.; Pires, B.M. 2011. The Soy moratorium in the Amazon Biome Monitored by Remote Sensing Images. Remote Sensing, 3:185-202.
- Simon, M.F. and Garagorry, F.L. 2005.The expansion of agriculture in the Brazilian Amazon. Environmental Conservation, 32:203-212.
- Vera-Diaz, M.C.; Kaufmann, R.K.; Nesptad, D.C. 2009. The environmental impacts of soybean expansion and infrastructure development in Brazil's Amazon basin. Global Development and Environment Institute, working paper n. 09-05:1 - 21.
Publication Dates
-
Publication in this collection
Jan-Mar 2017
History
-
Received
31 May 2016 -
Accepted
27 Aug 2016


