Resumos
A carga de doença atribuída às doenças crônicas não transmissíveis (DCNT) está aumentando globalmente, sendo em geral maior em homens. O objetivo deste artigo é descrever os diferenciais por gênero na mortalidade e tendências por DCNT no Brasil. Taxas padronizadas de mortalidade foram calculadas para os anos 1991-2010 após correção por subregistro e causas mal definidas, empregando faixas etárias de cinco anos específicas para homens e mulheres. As tendências foram analisadas com modelos de regressão joinpoint. Em 2010 as taxas para todas as DCNTs (homens: 479/100000; mulheres: 333/100000) e para os principais grupos de DCNTs (doenças cardiovasculares, câncer, doenças crônicas respiratórias e outra doenças crônicas) eram mais altas em homens. Entre 1991-2010, observou-se um declínio nas taxas padronizadas de mortalidade, em homens e mulheres, iniciando em 1993, e tornado-se menos intenso em anos recentes. A probabilidade incondicional de morrer entre as idades de 30 e 70 devido a um dos quatro principais grupos de DCNTs baixou de 1993 até 2010 de 32,3% para 22,8% em homens, e de 23,5% para 15,4% em mulheres. Concluindo, apesar do notável declínio nas taxas padronizadas de mortalidade por DCNT nas últimas duas décadas, o predomínio em homens persiste e, a se manter essa tendência, em termos relativos, irá aumentar.
Doença crônica; Brasil; Mortalidade; Sexo
The relative burden due to non communicable diseases (NCD) is increasing worldwide and has been shown to be generally greater for men than women. The objective of this paper is to describe gender differences in NCD mortality rates and trends in Brazil. Standardized mortality rates for the years 1991-2010 were corrected for sub notification and ill defined causes of death and calculated using sex specific five year age grades. Trends in standardized mortality were studied using joinpoint regression models. In 2010, rates for NCDs (men: 479/100000; women: 333/100000) and for most major NCD categories (cardiovascular diseases, cancer, chronic respiratory diseases and other chronic diseases) were higher for men than women. Age standardized mortality rates declined for both sexes over the period, beginning in 1993 and attenuating in more recent years. From its peak in 1993 to 2010, the unconditional probability of dying between the ages of 30 and 70 due to one of the four principal NCD groupings decreased for men from 32.3% to 22.8%; for women, from 23.5% to 15.4%. In conclusion, age standardized NCD mortality, though decreasing dramatically over the past two decades in Brazil, remains notably greater in men than in women and, this difference, in relative terms, will increase if these trends continue.
Chronic disease; Brazil; Mortality; Sex
ARTIGO ARTICLE
Desigualdades de gênero na mortalidade por doenças crônicas não transmissíveis no Brasil
Gender inequalities in non communicable disease mortality in Brazil
Antony Stevens; Maria Inês Schmidt; Bruce Bartholow Duncan
Programa de Pós-Graduação em Epidemiologia, Universidade Federal do Rio Grande do Sul. R. Ramiro Barcelos 2600/414. 90035-003 Porto Alegre RS. maria.schmidt@ufrgs.br
RESUMO
A carga de doença atribuída às doenças crônicas não transmissíveis (DCNT) está aumentando globalmente, sendo em geral maior em homens. O objetivo deste artigo é descrever os diferenciais por gênero na mortalidade e tendências por DCNT no Brasil. Taxas padronizadas de mortalidade foram calculadas para os anos 1991-2010 após correção por subregistro e causas mal definidas, empregando faixas etárias de cinco anos específicas para homens e mulheres. As tendências foram analisadas com modelos de regressão joinpoint. Em 2010 as taxas para todas as DCNTs (homens: 479/100000; mulheres: 333/100000) e para os principais grupos de DCNTs (doenças cardiovasculares, câncer, doenças crônicas respiratórias e outra doenças crônicas) eram mais altas em homens. Entre 1991-2010, observou-se um declínio nas taxas padronizadas de mortalidade, em homens e mulheres, iniciando em 1993, e tornado-se menos intenso em anos recentes. A probabilidade incondicional de morrer entre as idades de 30 e 70 devido a um dos quatro principais grupos de DCNTs baixou de 1993 até 2010 de 32,3% para 22,8% em homens, e de 23,5% para 15,4% em mulheres. Concluindo, apesar do notável declínio nas taxas padronizadas de mortalidade por DCNT nas últimas duas décadas, o predomínio em homens persiste e, a se manter essa tendência, em termos relativos, irá aumentar.
Palavras-chave: Doença crônica, Brasil, Mortalidade, Sexo
ABSTRACT
The relative burden due to non communicable diseases (NCD) is increasing worldwide and has been shown to be generally greater for men than women. The objective of this paper is to describe gender differences in NCD mortality rates and trends in Brazil. Standardized mortality rates for the years 1991-2010 were corrected for sub notification and ill defined causes of death and calculated using sex specific five year age grades. Trends in standardized mortality were studied using joinpoint regression models. In 2010, rates for NCDs (men: 479/100000; women: 333/100000) and for most major NCD categories (cardiovascular diseases, cancer, chronic respiratory diseases and other chronic diseases) were higher for men than women. Age standardized mortality rates declined for both sexes over the period, beginning in 1993 and attenuating in more recent years. From its peak in 1993 to 2010, the unconditional probability of dying between the ages of 30 and 70 due to one of the four principal NCD groupings decreased for men from 32.3% to 22.8%; for women, from 23.5% to 15.4%. In conclusion, age standardized NCD mortality, though decreasing dramatically over the past two decades in Brazil, remains notably greater in men than in women and, this difference, in relative terms, will increase if these trends continue.
Key words: Chronic disease, Brazil, Mortality, Sex
Introduction
The burden due to non-communicable diseases (NCDs) is increasing world-wide, posing a great threat to the development of the nations1,2. If current tendencies continue, a recent study estimates that the cost of NCD to the world´s economies over the next two decades could reach US$47 trillion; and for Brazil, the annual cost could reach 4% of the gross national product3. These global challenges, with particular reference to the low- and middle-income countries, have been widely discussed in recent years, culminating with the High-Level meeting of Heads of State held at the United Nations in September, 20114.
Brazil has developed a strategic plan to deal with the NCD burden5. The main lines of the plan are based on the Action Plan developed by the World Health Organization (WHO)6. Attention is focused on four main groups of diseases (cardiovascular, cancer, chronic respiratory and diabetes). As an indicator to measure the progress towards the established goals related to mortality from NCD, the WHO has proposed using the unconditional probability of a premature death due to these four groups, defined as occurring between the ages 30 and 707.
In Brazil NCD mortality is below that estimated in 2008 for most low income countries, but greater than that estimated for high income countries and also most Latin American countries8. A clear decline in NCD mortality has been observed when examining age-adjusted trends. The decline started in the 1990´s and persisted up to now, although at a lower rate in more recent years9. To be able to compare these rates over time and across groups, these mortality analyses took into account corrections for sub notification and ill-defined causes of death.
Notably, little information is available regarding gender inequalities in NCDs mortality and trends. From the WHO site, estimates indicate an almost uniformly greater mortality due to NCDs across nations8. The objective of this paper is to describe gender differences in mortality trends due to NCDs in Brazil. Additionally, given the importance of developing heath indicators for NCD prevention globally, we will estimate also, separately by sex, the unconditional probability of dying due to the four main NCD between ages 30 and 70, which is likely to be the indicator to be used in the years to follow.
Methods
Records of mortality were obtained from the Ministry of Health mortality information system (SIM; Sistema de Informação sobre Mortalidade). In this system causes of death are recorded according to the ICD-9 codes from 1991-1995 and to ICD-10 codes from 1996 until the present. The codes were divided into the major disease groups according to the WHO scheme10.
SIM became a computer-based system in 1979 and covers the whole of the national territory. The quality of the recorded information has improved consistently over the years, both from the point of view of coverage as well as the proportion of deaths due to ill-defined causes. In order to make valid comparisons across the years, the numbers of registered NCD deaths were corrected for sub-notification and ill-defined causes.
A mixed approach to estimate mortality system coverage was used. For 1991 a model life-table separated by 5-year age-groups (with 80+ being the final open ended group), regions and sexes furnished by the IBGE was used11. Data obtained from field-work carried out for the year 200812 provided empirically-based estimates of coverage for the years 2000-2010, with a single estimate for each state for each year applied to both sexes and to all age-grades. For the years 1992-1999 values were obtained using a linear interpolation between estimates for the year 1991 and those for the year 2000.
Differently from previous analyses13 the model life-table regional value generated correction factors (equal to the ratio of expected/observed deaths) for sub notification at the state rather than the regional level. Since only one sub notification correction factor value was available for each of the states for the year 2000, the values available for each state for 1991 in 34 strata (17 age-grades x 2 sexes) are converged to this one value. When the correction factor is greater than 1 (number of estimated deaths was greater than those observed), a corrected number of deaths was obtained multiplying the observed number by this correction factor ratio.
The deaths due to ill-defined causes were redistributed to the other disease categories using the methodology proposed by Mathers et al.10 This assumes that the ill-defined causes of death may be divided in the same proportions as those due to natural, non-external, causes. Thus, for each year and for each strata defined by sex, state, and age-grade, the number of deaths due to natural causes was modified by multiplying it by the following formula:
(t-e)/((t-e)-d)
where
t is the total number of deaths in the strata,
e is the number of deaths in the strata due to external causes, and
d is the number of ill-defined deaths in the strata.
This correction was not applied to deaths due to external causes.
Mortality rates were calculated per 100.000 inhabitants. The population figures, furnished by IBGE, were obtained from the DATASUS site. For the years 1991, 2000 and 2010 the numbers of residents are derived from censuses. For the year 1996 the numbers are based on the IBGE population count. Linear interpolation, done at the strata level, was used to obtain the values for the intervening years.
The mortality rates were calculated for each sex-specific five-year age-grade, with 80+ being the final open ended group. The rates were then standardized according to the direct method using the WHO standard population14. Trends in mortality rates were analyzed by joinpoint regression models using the Joinpoint Software, available from the National Cancer Institute15. Models are fit to the data so as to allow for testing of whether an apparent change in trend is statistically significant. The trend is computed in segments whose start and end are determined to best fit the data. These segments are connected together at "joinpoints"16.
The unconditional probability of death due to the four disease groups cardiovascular disease, cancer, chronic respiratory disease and diabetes was obtained using a formula provided by the WHO. The first step consists in calculating the mortality rates for each five year interval:
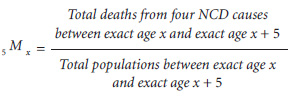
The usual demographic practice of turning this rate into a probability was followed using the following formula:
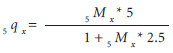
The individual probabilities are then combined with the following formula to obtain an estimate for the interval as a whole:

This is the statistic which is then interpreted to be the unconditional probability of death between the ages of 30 and 70.
The analyses described in this paper are part of a project approved by the Hospital das Clínicas de Porto Alegre Ethics Committee.
Results
In the year 2010, a total of 1,132,732 deaths were recorded, 646,069 (57.0%) for men and 486,663 (43%) for women (Table 1). Of the total number of the men, 409,484 (63.3%) had an NCD as a basic cause of death. Of the total number of the women, 362,100 (74.4%) had a NCD as a basic cause of death. After correction for sub notification and for ill defined causes of death, a total of 1,209,676 records were available. Table 1 also shows the proportional mortality for groups of diseases in 2010 for men and women, before and after correction for sub notification and ill defined causes of death.
The remaining results will always be presented with correction for sub notification and ill defined causes of death. For women, 80.2% of all deaths were due to NCD, while for men this percentage was 69.0%. The main reason for the difference is the higher proportion of external causes of death observed for men (18.2 vs. 5.0%). Considering NCD, for men and women, the main causes of death were cardiovascular diseases (28.8% men, 34.4% women) and cancer (15.8% men, 17.8% women). The percentages for chronic respiratory disease are 5.9% men, 6.2% women; and for diabetes 4.1% men, 6.9% women. The percentages for other chronic diseases are 14.5% men and 14.9% women.
Tables 2 and 3 complement these numbers, showing NCD and total deaths and the mortality rates separately by sex for the years 1991-2010. In 1991 the total number of deaths was 1,049,229; 675756 (73.8%) were due to NCDs, 367530 (54.4%) among men and 308226 (45.6%) among women. In 2000 the total number of deaths was 1,047,365; 751,859 (71.8%) were due to NCDs, 407,395 (54.2%) among men and 344,464 (45.8%) among women.
It can also be seen from Tables 2 and 3 that between 1991 and 2010 the population of men increased 29% (from 72,485,122 to 93,406,990) and the total of NCD deaths for men increased 30% (from 367,530 to 477,175). For women the population increase was 31% (from 74,340,353 to 97,348,809) and the total of NCD deaths for women increased 35% (from 308,226, to 416,131).
The proportional mortality for men and women increased steadily from 1991 to 2010. The crude NCD mortality rate did not change significantly during this period (507/100.000 to 511/100.000) for men and (415/100.000 to 427/100.000) for women. The crude rate peaked in 1993 for both men and women.
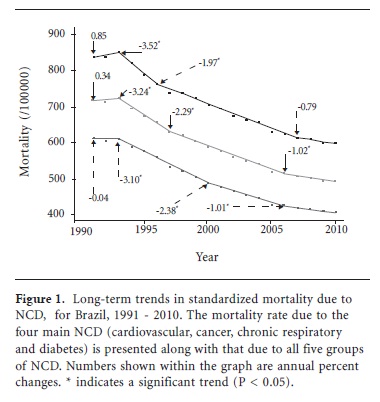
Nevertheless after the direct age standardization, the mortality rate for both sexes underwent a steady decline during this period: 28% for men (from 838/100.000 to 601/100.000); and 33% for women (615/100.000 to 409/100.000).
An analysis of these trends using joinpoint regression models shows (Figure 1) that, although points of inflexion were somewhat different for men and women, for both the decline began in 1993 and was greater in earlier than in more recent years. The latest observable trends were an annual decline for men of 0.79%, and for women, of 1.0%.
Figure 2 shows that rates for most categories cardiovascular diseases, cancer, chronic respiratory diseases and other NCD are higher for men than for women. For both sexes the most important decline over the period occurred with cardiovascular disease. The predominance of cardiovascular disease in these graphs masks the fact that important falls occurred with chronic respiratory disease after 1998 (men) and 1996 (women).
Figure 3 shows the probability of dying due to the main causes of NCD death at ages 30 to 70 years for men and women. A joinpoint analysis shows that for men the probability of death from 1993 to present date has declined by 2.08% per year. For women the decline from 1994 to 2006 was 2.77% per year but at present it is 1.62% per year. When both sexes are combined, the decline from 2006 to the present is 1.54% per year.
Discussion
Little has been done to estimate gender inequalities in NCD mortality, particularly in low or middle income countries. Our results clearly show that NCD is the main cause of death for both men and women. The crude NCD mortality rate did not change significantly between 1991 and 2010 for men (507/100.000 to 511/100,000) and (415/100,000 to 427/100,000) for women. However, important declines in age-standardized NCD mortality were seen during this period for men (28%, from 838/100.000 to 601/100.000) and for women (33%, 615/100.000 to 409/100.000). (Figure 1) The inflection points identified in the joinpoint analyses indicate that the rate of decline is diminishing across the period, for both men and women. These findings are similar to those previously reported9,17 using slightly different methodologies for correction for sub notification.
Notably, age-standardized NCD mortality rates were always higher for men than for women, except for diabetes. In 1991, the ratio of mortality rates in men and women was 1.36 and, by 2010, this had increased to 1.47. The World Health Organization reports mortality rates from NCD for men and women around the world8. The ratio of these rates in men and women is generally between 1 and 2. Very few countries, mainly very small ones, have rates less than 1, and a few countries, mostly those belonging to the former Soviet Union, have rates greater than 2.
Why are NCD rates higher in men than in women? Empirically, the two main causes of death are cardiovascular and cancer; and we found both to be higher in men (Figure 2). The most common cause of cancer death, men and women combined, is lung cancer, mortality rates from which are approximately double in men compared to women18. This is consistent with the greater prevalence of smoking in men over the last decades19.
In Brazil, similar increased overall mortality rates have been described for men from 1980 to 2005, and the same was noted for preventable causes of death20. Notably, higher rates of mortality, in men than women, which have been recorded for centuries21.
The global challenge faced by the rising burden of NCDs is enormous. As has been emphasized by WHO1,2, the burden will always be more unfavorable to countries and peoples with fewer resources. Understanding and confronting the observed gender inequality is also of paramount importance in meeting the challenge. In Brazil, in 2010, the unconditional probability of dying from the four main categories of NCD between the ages 30 to 70 years is about 22.8% for men and 15.4 % for women. Further investigation is warranted regarding possible explanations for differential mortality. Are they related to higher risk factors in men (smoking, alcohol drinking)? Are they a result of greater occupational exposures? Could they be due to less chronic medical treatment (blood pressure, diabetes and cholesterol control)? Could they be caused by delayed diagnosis and treatment of fatal condition such as acute myocardial infarction, stroke and cancer?
Although corrections for sub notification and ill defined cause of death will continue to be necessary in analyses of mortality in Brazil, this should become less important over time, assuming that current improvements in both coverage and quality of death coding will continue. However, to permit analysis of past trends we will always need to rely on some type of correction. Thus, improvements in our understanding of the declines may benefit from further refinement in methods. For example, the estimation of coverage using the model life table approach in 1991 might be reviewed. Additional investigation of current rates of sub notification may improve current estimates of the decline. Nevertheless, the joinpoint analysis here presented indicates that declines have lessened in recent years.
In conclusion, NCD mortality is considerably higher in men than in women, despite the declines observed for both over the last two decades. This scenario, coupled with the greater risk of external causes of death in men, forecasts an increasingly greater gender differential in premature mortality. This is a remarkable challenge to overcome.
Collaborations
A Stevens, MI Schmidt and BB Duncan participated in the design, analyses and interpretation. A Stevens created the computational system for the analyses.
Artigo apresentado em 02/08/2012
Aprovado em 28/08/2012
-
1World Health Organization (WHO). Global Status Report on noncommunicable diseases 2010 [Homepage at Internet]. WHO. 2011 [cited 2012 Jul 14]. Available at: http://www.who.int/chp/ncd_global_status_report/en/
-
2World Health Organization (WHO). Preventing chronic diseases: a vital investment [Book at Internet]. Geneva: WHO; 2005 [cited 2012 Jul 14]. Available at: http://www.who.int/chp/chronic_disease_report/full_report.pdf
- 3. Bloom DE, Cafiero ET, Jané-Llopis E, Abrahams-Gessel S, Bloom LR, Fathima S, Feigl AB, Gaziano T, Mowafi M, Pandya A, Prettner K, Rosenberg L, Seligman B, Stein AZ, Weinstein C. The Global Economic Burden of Non-communicable Diseases Geneva: World Economic Forum; 2011.
-
4United Nations (UN). High-level Meeting on Non-communicable Diseases [Homepage at Internet]. General Assembly of the United Nations 2011 [cited 2012 Jul 14]. Available at: http://www.un.org/en/ga/president/65/issues/ncdiseases.shtml/
-
5Brasil. Ministério da Saúde (MS). Plano de Ações Estratégicas Para o Enfrentamento das Doenças Crônicas Não Transmissíveis (DCNT) no Brasil, 2011-2022 Brasília: MS; 2011.
-
6World Health Organization (WHO). 2008-2013 Action Plan for the Global Strategy for the Prevention and Control of Noncommunicable Diseases [Book at Internet]. Geneva: WHO; 2009 [cited 2012 Jul 14]. Available at: http://whqlibdoc.who.int/publications/2009/9789241597418_eng.pdf
-
7World Health Organization (WHO). Monitoring framework and targets for the prevention and control of NCDs [Homepage at Internet]. WHO. 2012 [cited 2012 Jul 14]. Available at: http://www.who.int/nmh/events/2011/consultation_dec_2011/en/
- 8. World Health Organization (WHO). Global Health Observatory Data Repository [Homepage at Internet]. WHO. 2011 [cited 2012 Jul 16]. Available at: http://apps.who.int/ghodata/
- 9. Duncan BB, Stevens A, Iser BPM, Malta DC, Silva GA, Schmidt MI. Mortalidade por doenças crônicas no Brasil: situação em 2009 e tendências de 1991 a 2009. In: Brasil. Ministério da Saúde (MS). Saúde Brasil 2010 [Documento na Internet]. Brasília: MS; 2011. [cited 2012 Jul 14]. p. 117-134. Available at: http://portal.saude.gov.br/portal/arquivos/pdf/cap_5_saude_brasil_2010.pdf
- 10. Mathers CD, Bernard C, Iburg KM, Inoue M, Fat DM, Shibuya K, Stein C, Tomijima N, Xu H. Global Burden of Disease in 2002: data sources, methods and results [Book at Internet]. Geneva: WHO; 2003 [cited 2012 jul 14]. Available at: http://www.who.int/healthinfo/paper54.pdf
- 11. Albuquerque FRP, Senna JR. Tábuas de Mortalidade por sexo e grupos de idade: Grandes Regiões e Unidades da Federação de 1980, 1991 e 2000. Rio de Janeiro: IBGE; 2005.
- 12. Szwarcwald CL, Morais Neto OL, Frias PG, Souza Júnior PRB de, Escalante JJC, Lima RB de, Viola RC. Busca ativa de óbitos e nascimentos no Nordeste e na Amazônia Legal: Estimação das coberturas do SIM e dos Sinasc nos municípios brasileiros. In: Brasil. Ministério da Saúde (MS). Saúde Brasil 2010 Brasília: MS; 2011. p. 117-134.
- 13. Schmidt M, Duncan B, Stevens A, Luft V, Iser BPM, Moura L, Malta DC. Doenças Crônicas não transmissíveis no Brasil: mortalidade, morbidade e fatores de risco. In: Brasil. Ministério da Saúde (MS). Saúde Brasil 2009: uma análise da situação de saúde e da agenda nacional e internacional de prioridades em saúde. Brasília: MS; 2010.
- 14. Ahmad O, Boschi-Pinto C, Lopez A, Murray C, Lozano R, Inoue M. Age standardization of rates: a new WHO standard. Geneva: WHO; 2001.
-
15National Cancer Institute. Joinpoint Regression Program [Homepage at Internet]. Surveillance Research Program 2012 [cited 2012 Jul 16]. Available at: http://surveillance.cancer.gov/joinpoint/
- 16. Kim H-J, Fay MP, Feuer EJ, Midthune DN. Permutation tests for joinpoint regression with applications to cancer rates. Stat Med 2000; 19(3):335-351.
- 17. Schmidt MI, Duncan BB, e Silva GA, Menezes AM, Monteiro CA, Barreto SM, Chor D, Menezes PR. Chronic non-communicable diseases in Brazil: burden and current challenges. The Lancet 2011; 377(9781):1949-1961.
- 18. Silva GA, Noronha CP, Santos MO, Oliveira JFP. Diferenças de gênero na tendência de mortalidade por câncer de pulmão nas macrorregiões brasileiras. Rev Bras Epidemiol 2008; 11(3):411-419.
- 19. Monteiro CA, Cavalcante TM, Moura EC, Claro RM, Szwarcwald CL. Population-based evidence of a strong decline in the prevalence of smokers in Brazil (1989-2003). Bull World Health Organ 2007; 85(7):527-534.
- 20. Abreu DMX de, César CC, França EB. Gender differences in avoidable mortality in Brazil (1983-2005). Cad Saúde Públ 2009; 25(12):2672-2682.
- 21. Kalben BB. Why men die younger: causes of mortality differences by sex. N Am Actuar J 2000; 5(4):83-116.
Datas de Publicação
-
Publicação nesta coleção
23 Out 2012 -
Data do Fascículo
Out 2012
Histórico
-
Recebido
02 Ago 2012 -
Aceito
28 Ago 2012