Abstracts
Using stable nitrogen and carbon isotope signatures, we investigated the trophic ecology and identified potential prey fish groups supporting the giant Arapaima within floodplain lakes of the Essequibo River basin in southwestern Guyana. Morphological descriptions of feeding structures and digestive tract are presented together with preliminary data on Arapaima diets. Stable isotope results suggest that algivorous/detritivorous and omnivorous fishes contributed most to Arapaima biomass, and generally, that was consistent with what is known about Arapaima diets. Stable nitrogen isotope ratios for piscivorous fishes in these lakes were higher than nitrogen isotope ratios for Arapaima, indicating that piscivorous fishes are unlikely to constitute a major source of energy for Arapaima. This population of Arapaima has an intestine averaging 1.45 times total body length, relatively small teeth, and numerous, closely-spaced gill rakers. These morphological features, together with isotope data, support our inference that Arapaima are secondary consumers and may be better characterized as omnivores and not top predators.
Conservation; Essequibo River basin; Management; Osteoglossidae; Stable isotopes
Utilizando firmas de isotopos estables de nitrógeno y carbón, investigamos la ecología trófica e identificamos los grupos de peces que potencialmente mantienen a la Arapaima en los lagos inundables de la cuenca del río Essequibo, al suroeste de Guyana. Presentamos descripciones morfológicas de las estructuras alimentarias y tracto digestivo de la Arapaima, conjuntamente a datos preliminares de sus dietas. Los isotopos estables sugieren que peces algívoros/detritívoros y peces omnívoros son los principales contribuyentes de la biomasa de la Arapaima, y estos resultados son compatibles con lo que se conoce actualmente de la dieta de la Arapaima. A diferencia, las proporciones del isotopo estable de nitrógeno para peces piscívoros en estos lagos resultaron más altas que los valores obtenidos para el isotopo estable de nitrógeno en la Arapaima. Esto indica que es improbable que sean peces piscívoros los que constituyan la fuente energética principal de la Arapaima. La población de Arapaima estudiada presenta un intestino que promedia 1,45 veces la longitud total del cuerpo, dientes relativamente pequeños, y agallas con branquiespinas numerosas y cercanamente espaciadas. Estas características morfológicas, conjuntamente a los datos obtenidos a través del uso de isotopos estables apoyan nuestra inferencia que la Arapaima es un consumidor secundario y que puede ser caracterizada como un pez omnívoro y no como un depredador mayor.
Introduction
Neotropical freshwaters support very high fish diversity and productivity (Lowe-McConnell, 1987; Lundberg et al., 2000; Allan et al., 2005; Martelo et al., 2008), which in turn provide protein and income for the vast majority of people who live near those waters (Bayley & Petrere, 1989; Almeida et al., 2009; Junk, 2007). Unfortunately, many exploited species are declining (Allan et al., 2005; Estes et al., 2011; Castello et al., 2013), and developing effective management and conservation programs will require, among other things, an understanding of feeding ecology and energy sources fueling fish food webs. Information on trophic ecology of fishes often has been derived from stomach content analyses which can provide high-resolution data on food items consumed but has several shortcomings. For instance, stomach content analyses are time consuming, offer only a relative snapshot of the most recent foraging activity, and more importantly, some ingested materials may fail to assimilate and supply animal cells with nutrients (Michener & Schell, 1994). The actual contribution of a food item to an organism's biomass or energy needs, thus, may not be accurately reflected by its relative mass as determined by stomach content analyses alone.
An alternative method to assess time-integrated, assimilated diet is to analyze stable isotope ratios of an organism's tissues (Melville & Connolly, 2003; Garcia et al., 2006). Stable isotopes of nitrogen become enriched in the heavier isotope as they move to higher levels within a food web, and they are generally used as an indicator of trophic position (Peterson & Fry, 1987; Kelly, 2000; Post, 2002). In contrast, once stable carbon isotopes are fixed by a primary producer, they change little as they pass through the food web, but their ratios differ markedly among primary producers using different photosynthetic pathways (e.g., C3 vs. C4 plants). Stable carbon isotopes thus are useful for evaluating an animal's primary energy sources (Post, 2002). Here we analyze stable nitrogen and carbon isotope ratios (15N:14N and 13C:12C) in a tropical floodplain ecosystem in Guyana to infer the trophic ecology of the giant fish Arapaima.
Historically, Arapaima have been among the most important food fishes in the Amazon and Essequibo River basins, and intense harvesting has resulted in substantial population declines and even near extirpations in some areas (Queiroz & Sardinha, 1999; Castello & Stewart, 2010). Community-based management programs and protected areas have been effective in facilitating recovery of depleted populations in some areas (Castello et al., 2009; McGrath et al., 2008). Recent studies on growth (Arantes et al., 2010), nesting (Castello, 2008a), and migration (Castello, 2008b) also have contributed information necessary for effective conservation and management of Arapaima. For Guyana and many areas of the Amazon basin, however, there are few or no published observations on trophic ecology of Arapaima, and there are few published studies on stable isotope ratios in Arapaima (Forsberg et al., 1993, present only δ13C values for five individuals). Arapaima are sometimes characterized as 'predators' (e.g., Forsberg et al., 1993) or 'top predators' in food webs, but some diet studies in Brazil (Queiroz, 2000; de Oliveira et al., 2005) suggest that the characterization of Arapaima as a top predator may be an overly simplistic assumption. Information on sources of energy assimilated by Arapaima can contribute to an understanding of their role in the ecosystem and may have implications for estimating carrying capacity of various habitats for Arapaima populations. Our objective here is to further our understanding of Arapaima trophic ecology through stable isotope analyses of components of the food web and gut content analysis of Arapaima from Guyanese floodplain lakes. We also describe morphology of the digestive tract and feeding structures of Arapaima, because those features can be used to infer trophic position and have not been previously considered in the context of understanding the ecosystem role of Arapaima. Systematic status of the Guyanese Arapaima population remains unresolved, so here we only use the genus name. We anticipate that, ultimately, these fishes will be classified as A. arapaima (Valenciennes, in Cuvier and Valenciennes, 1847), a nominal species previously described from the Essequibo River basin (Stewart, 2013, in press; Stewart & Watson, pers. comm.).
Material and Methods
Field sampling
This study was conducted on the floodplains of the Essequibo River basin in south-western Guyana (approximately 4°N, 58°W; Fig. 1). There is a well-defined wet and dry season in this region and annual fluctuation in river water level is approximately 5 m. We sampled six floodplain lakes (surrounded by undisturbed primary rain forest) during the early part of the dry season (October-December 2008). During our field sampling, water level had receded and most lakes and ponds were disconnected from the main river channels.
Map of collecting localities for stable isotope samples from the Essequibo River basin of southwestern Guyana. Sites are as follows: a) Banana Sucker Pond, b) Grass Pond, c) Makarapan Pond, d) Small Kumaka Pond, e) Inkapati Head Pond, and f) Stanley Lake. Inset shows location of study area in northern South America (black box with arrow) in relation to natural distribution of the genus Arapaima (grey shading).
We collected samples of Arapaima and potential prey fishes from three trophic guilds (i.e., algivores/detritivores, omnivores, and piscivores; see Table 1 for a list of species and number of specimens for each species). Potential prey fishes were categorized as algivores/detritivores, omnivores, and piscivores based on literature reports. Arapaima were captured with a large seine (150 m x 7 m, with 17 cm stretch mesh) and several gillnets (50 m x 3 m, with 8, 10 and 12 cm stretch meshes). Prey fishes were collected using a combination of seines, castnets and gillnets. For all fishes, we recorded total length (TL, tip of upper jaw to tip of caudal fin) to the nearest 0.5 cm using a measuring tape. A skinless, boneless sample of white muscle (~5 g) was removed from the dorso-lateral region of each fish specimen, covered with non-iodized salt (NaCl) and stored in sealed plastic bags for transport to the lab.
Mean δ13C and δ15N values (± standard deviation - SD) for fishes from the Essequibo River basin, Guyana.
Stable isotope analyses
Salt-preserved fish muscle samples were first rinsed and then soaked in distilled water for 4 h. Salt preservation causes minimal isotopic shifts in fish muscle tissues (Arrington & Winemiller, 2002). All samples were dried at 60°C for 48 h and ground to a fine powder using a mortar and pestle. Aliquots (500-1000 µg) of each sample were loaded into 4 x 6 mm Ultra-Pure tin capsules. Samples were analyzed for δ15N and δ13C at the Environmental Science Stable Isotope Laboratory (EaSSIL), State University of New York, College of Environmental Science and Forestry (SUNY-ESF), using a Costech elemental analyzer linked via a ThermoFinnigan Conflo III interface to a ThermoFinnigan Delta XL Plus stable isotope mass spectrometer (EA-IRMS). Standards were Pee Dee Belemnite for carbon isotopes and atmospheric nitrogen for nitrogen isotopes.
Accuracy and precision of stable isotope measurements (expressed in the standard per mil notation, ± 95% CI) were verified using National Institutes of Standards and Technology RM8573 (δ13C = -26.4 ± 0.1‰ [n = 38]), (δ15N = -4.5 ± 0.3‰ [n = 38]), and RM8574 (δ13C = +37.6 ± 0.2‰ [n = 38]), (δ15N = +47.6 ± 0.3‰ [n = 38]). Daily precision of the instrument was verified by repeated analyses of internal laboratory standards during the sample runs, including acetanilide (δ13C = -30.1 ± 0.1‰, δ15N = -0.2 ± 0.3‰ [n = 16]), valine (δ13C = -10.9 ± 0.1‰, δ15N = -6.6 ± 0.3‰ [n = 5]), and Daphnia (δ13C = -24.8 ± 0.1‰, δ15N = +17.2 ± 0.5‰ [n = 3]).
Data analyses and food source modeling
We tested for differences in δ15N and δ13C values among Arapaima and fish prey using a one way ANOVA followed by post-hoc multiple comparisons using Tukey's HSD test (significance level of 0.05). We used IsoSource v1.3.1 software to calculate feasible combinations of prey fish groups (algivores/detritivores, omnivores, and piscivores) that could explain Arapaima nitrogen and carbon isotopic signatures (Phillips & Gregg, 2003). This method examines all possible combinations of potential contributions (0-100%, in 1% increments) by each prey fish group. Tolerance values were initially set at 0.1‰ and increased incrementally by 0.1‰ up to a maximum of 2‰. To account for fractionation between trophic levels, +2.3‰ and +0.4‰ per trophic level were added to δ 15N and δ13C values, respectively, for each prey fish group (McCutchan et al., 2003). Bi-plots of δ15N and δ13C were constructed to visualize potential energy flows among prey fishes and Arapaima.
An underlying assumption of the IsoSource model is that the proportional contribution of a source to the mixture is similar for different elements (Philips & Koch, 2002). In our study, this assumption is reasonable as the three diets are highly proteinaceous fish muscle with similar elemental concentrations (C/N = 4.5, 95% CI = ± 0.8).
We examined stomach contents for 17 Guyanese Arapaima as additional non-isotopic dietary inputs, so we were able to impose additional constraints to the output of the IsoSource model (following Phillips & Gregg, 2003). The feasible contributions of each prey item to the diet of Arapaima were imported into Excel(r), and we constrained our data by assuming that: 1) algivores/detritivores are a greater proportion of the diet than piscivores, and 2) omnivores represent a greater proportion of the diet than piscivores. The feasible contributions of each of these dietary groups were subsequently reduced using this approach. As recommended by Phillips & Gregg (2003), results are reported as the distribution of feasible solutions for each dietary source. The 1st (minimum) and 99th (maximum) percentile also are given, rather than the full range, which is sensitive to small numbers of observations on the extreme tails of the distribution.
Diets and morphology of trophic structures
We examined stomach contents for 24 Arapaima, and measured gut and pyloric caeca lengths for 23 individuals ranging from 96 to 202 cm. Stomach contents were typically removed within 1-3 hr of capture. Prey items in Arapaima stomachs were identified in the field to the lowest taxonomic level possible. In most cases, prey fish were partially digested and could only be identified to genus or family. Gut length was measured (to nearest 0.5 cm) by removing the entire alimentary canal, straightening out the intestine and measuring the distance from the posterior end of the stomach (i.e., at the pylorus) to the anus using a measuring tape. Pyloric caeca were similarly measured from their origin to distal tip. We provided a qualitative description of jaw teeth and buccal cavity structures used in feeding based on dissections and skeletal preparations of several fishes.
Results
Arapaima and prey-fish isotope signatures
The δ15N values of Arapaima were significantly different from their potential prey sources (ANOVA: F3, 30 = 7.279, p < 0.001; Fig. 2). Piscivores were more enriched in 15N than algivores/detritivores (p < 0.001) and omnivores (p = 0.006). The mean δ15N value was highest for piscivores (+12.6‰) and lowest for algivores/detritivores (+9.8‰), while Arapaima (+11.2‰) and omnivores (+10.6‰) were intermediate. The highest variability in δ15N signatures was found for omnivores (range +12.1 to +8.6 ‰) and algivores/detritivores (+11.3 to +7.4‰), while the lowest variation was found for piscivores (+13.3 to +11.5‰) and Arapaima (+12.1 to +10.2‰).
Scatter plot of δ13C and δ15N signatures for Arapaima and prey fish. The plot includes points for individual Arapaima (stars) and mean for values of prey taxa when possible (diamonds = piscivores, n = 6, triangles = omnivores, n = 12, squares = detritivores, n = 10). Species names for prey fishes are: Amb = Amblydoras sp., Anc = Ancistrus sp., Apt = Apteronotus cf. albifrons, Ch = Chilodus sp., Cre = Crenicichla sp., Cur = curimatid, Eig = Eigenmannia sp., Geo = Geophagus surinamensis, Hop = Hoplias malabaricus, Hyp = Hypostomus sp., Pla = Platydoras sp., Rin = Rineloricaria sp., Ste = Sternopygus sp., Tra = Trachycorystes trachcorystes.
Differences in δ13C values were significant among the three trophic groups of potential prey fishes and Arapaima (ANOVA: F3, 33 = 5.201, p = 0.005). Piscivores were more enriched than algivores/detritivores (p = 0.01) and omnivores were more enriched than algivores/detritivores (p = 0.01). The average δ13C value for algivores/detritivores was a result of one species group, curimatids, which were more depleted in 13C compared to all other fish species sampled (Fig. 2). When curimatids were excluded from the analysis, difference in δ13C among trophic groups were not significant (ANOVA: F3, 30 = 1.667, p = 0.195). Carbon signatures for Arapaima ranged from -27.4 to -30.9‰, and the mean was not significantly different from any of the prey fish trophic groups when curimatids were excluded from the comparison.
IsoSource modeling
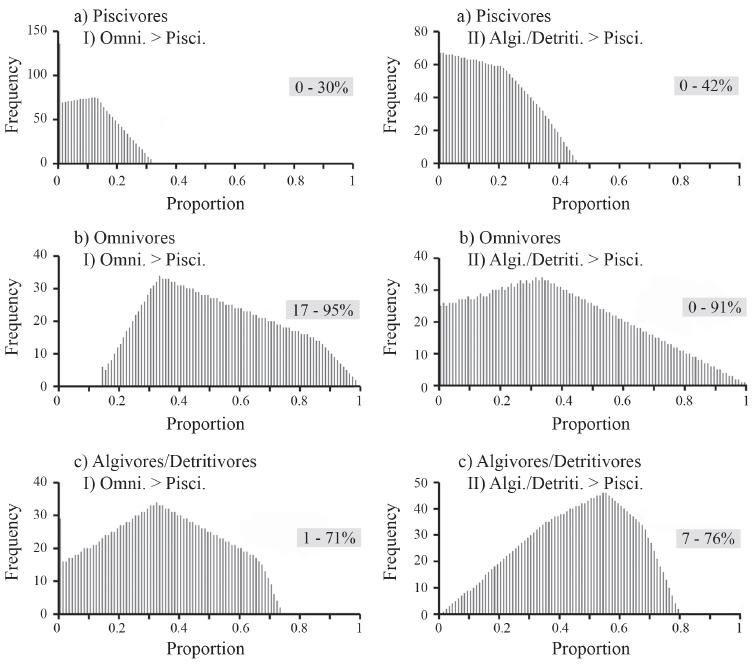
There were 2,381 feasible combinations of the three diet sources that reproduced the observed δ15N and δ13C signatures in Arapaima diet within a 2% tolerance. There was a wide range of feasible solutions for each diet source: 0-42% for piscivores, 0-94% for omnivores, and 1-75% for algivores/detritivores (Fig. 3). Applying additional constraints, based on stomach contents of Arapaima, the number of feasible combinations was reduced to 1,726 for omnivores > piscivores, and to 2,125 for algivores/detritivores > piscivores (Fig. 4), and showed that Arapaima derived their biomass from a wide range of dietary sources. Piscivores were consistently the lowest component of the diet, with the majority of the diet (up to 95%) being omnivores and up to 75% being algivores/detritivores.
Histograms of the distribution of all feasible contributions of the three dietary fish groups for Arapaima: a) piscivores, b) omnivores, and c) algivores/detritivores based on the IsoSource model. Values in boxes are 1% percentile and 99% percentile ranges for these distributions.
Histograms of the distribution of feasible contributions of the three dietary fish groups for Arapaima: a) piscivores, b) omnivores, and c) algivores/detritivores after imposing additional constraints of: I) omnivores > carnivores, and II) algivores/detritivores > carnivores. Values in boxes are 1% percentile and 99% percentile ranges for these distributions.
Diets and morphology of trophic structures
Of the 24 Arapaima stomachs examined, seven were empty. Most stomachs contained fish remains, while a few contained crustaceans (shrimps and crabs) and seeds in addition to fish remains. Catfishes (loricariids, callichthyids, and pimelodids) were the most frequent prey items with 25% of stomachs examined containing catfish remains, followed by knifefishes (16%), and characins (8%).
Teeth on the dentary, premaxillary and maxillary bones of the jaws were all in single rows and relatively short (Fig. 5c). Tips of the jaw teeth were bluntly conical. Dorsally inside the buccal cavity, small, villiform teeth covered bony plates on the roof of the mouth (Fig. 5a). Opposing those bones, the anterior basibranchial tooth plate also was covered with similar fine, villiform teeth (i.e., the 'bony tongue' that characterizes all osteoglossomorph fishes; Fig. 5b). Farther posterior on the gill arches was a rounded tooth patch and a few small, irregular patches of fine teeth. Gill rakers on the first gill arch were relatively close-spaced, long, slender and bony (Fig. 5b). Total number of gill rakers on the first arch averaged 42.95 (± 0.71 = 95% C.I., n = 40), with about 29 rakers on the lower part of that arch and 14 on the upper limb.
Structures associated with feeding in Arapaima, including: a) bony plates on the roof of the buccal cavity (vo = vomer, pas = parasphenoid, enp = entopterygoid, and dpt+ecp = fused dermopalatine+ectopterygoid), b) bony tongue (abbtp = anterior basibranchial toothplate) and gill rakers (gr), and c) jaw teeth (jaw bones are d = dentary, mx = maxilla, and pmx = premaxilla). Panels a and b are for a specimen from Mamirauá Reserve, Brazil (now a dried skeleton at Instituto Nacional de Pesquisas da Amazônia, Manaus, Brazil (INPA 26583, 121 cm TL, collected by C. Arantes, Nov. 2006); panel c is of a dried skull specimen from the Essequibo River that was on display at Iwokrama Centre, Guyana (estimated 239 cm TL, based on morphometric data for Essequibo basin Arapaima, Stewart & Watson, pers. comm.).
The digestive tract (Fig. 6) was relatively long, with the intestine looping back and forth along the length of the abdominal cavity (see Nelson, 1972: Fig. 4c). The stomach was a muscular sack about 25% of TL of the fish. The intestine was relatively thick-walled; it was well differentiated from the stomach and measured on average 1.45 times TL of the fish (± 0.06 = 95% C.I., n = 23). Over the length range of fishes observed (96-202 cm TL), gut length as a proportion of TL showed a slight negative allometry, but slope of that trend was not significant. At the beginning of the intestine, two muscular pyloric caeca branched out (Fig. 6), the longest of which measured an average of 0.203 TL (± 0.01 = 95% C.I., n = 23); the shorter one was 0.149 TL (± 0.009 = 95% C.I., n = 22). As with intestine length, the pyloric caeca did not show significant allometry.
Anatomy of the digestive tract from a 78 cm TL juvenile Arapaima from Mamirauá Reserve, Brazil (now a dried skeleton in Manaus, INPA 26582, collected by C. Arantes, Nov. 2006). The intestine in this specimen was 1.77 times TL, which was longer than the average for both Essequibo and Mamirauá populations.
Discussion
Our results suggest that algivorous/detritivorous and omnivorous fishes contributed most to Arapaima biomass. Piscivorous fishes were on average too enriched in 15N to be making substantial contributions to Arapaima biomass (Fig. 2). Several species belonging to the algivore/detritivore and omnivore trophic guilds had nitrogen signatures that were depleted compared to Arapaima and, potentially, could have served as important prey items. Estimates derived from IsoSource modeling suggested that out of the three trophic guilds, algivores/detritivores and omnivores contributed most to Arapaima biomass. The isotope results are supported by our stomach content analyses where algivorous/detritivorous and omnivorous fishes were the most abundant prey items. Our sample of diets was limited by constraints on sacrificing fishes, because Arapaima populations in the Essequibo River basin were seriously depleted (Watson, 2011). Nonetheless, our limited diet observations were consistent with extensive diet samples reported for Arapaima from Mamirauá Reserve in central Brazil (Queiroz, 2000). Queiroz (2000) found that piscivorous fishes generally were not important in Arapaima diets, but that Arapaima favored callichthyid, loricariid, and pimelodid catfishes together with knifefishes, some curimatids, and erythrinids; during the flood season, they also fed more heavily on macroinvertebrates, especially decapods. In general terms, Queiroz (2000) considered Arapaima to be "specialized carnivores".
The armored catfishes that we encountered in Arapaima stomachs were fairly abundant in our study lakes, perhaps because their bony plates protect them from other predators. Arapaima however, can compress their bony-tongues against toothed plates on the roof of the mouth (Fig. 5), and thus, may be able to crush the bony armor and locked pectoral spines that characterize loricariids, callichthyids and other catfishes. Pinese (1996) also suggested that Arapaima may be able to crush and perhaps shred prey by working the bony tongue against teeth on the vomer and parasphenoid bones. The presence of catfishes and knifefishes in the diets also might suggest that Arapaima feed at night, because those fish groups tend to be active nocturnally. Our isotope results, taken together with both Guyanese and Brazilian (Queiroz, 2000) diet data, indicate that Arapaima feed relatively low or in the middle of the food web, and thus, were among the group of fishes that we broadly considered to be omnivorous. So, they typically would be secondary consumers, one trophic level above primary consumers. Queiroz (2000) inferred that plant materials found in Arapaima stomachs were ingested incidental to their powerful suction feeding on animal prey. We also found seeds and other pieces of plant materials in some Arapaima stomachs but were unable to determine if such vegetation was ingested deliberately or incidental to feeding on animal prey.
Our observations on gut morphology (Fig. 6) also are consistent with an omnivore trophic level, because strict piscivores typically would have a gut shorter than body length, while an herbivore would have a gut much longer than observed in Arapaima (Kapoor et al., 1975; German & Horn, 2006). The function of the pyloric caeca in Arapaima has never been studied, but in various temperate fishes, caeca are a major site of nutrient uptake and serve to increase gut surface area (Buddington & Diamond, 1986). Occurrence of precisely two caeca is characteristic of most osteoglossomorph fishes (Nelson, 1972). Most piscivores also have sharper, more pronounced conical or canine teeth on the jaws and often have sharp, conical teeth on the roof of the mouth or even on pharyngeal tooth plates. The jaw and buccal teeth of Arapaima clearly do not fit that stereotype (Fig. 5). The relatively high number of closely-spaced gill rakers in Arapaima is another indicator of a varied diet, including relatively smaller-bodied prey. Juvenile Arapaima (22-26.5 cm standard length) from the Araguaia River basin of southern Brazil were observed to feed on a variety of invertebrates together with about 53% by volume of detritus (de Oliveira et al., 2005), and ingesting such fine particles would be difficult with widely-spaced gill rakers. Pinese (1996) also concluded that functional morphology of Arapaima feeding structures was more consistent with that of an omnivore than a piscivore.
In general, stable nitrogen and carbon isotope signatures for fishes from the different trophic guilds in floodplain lakes of the Essequibo River basin are similar to those reported for Amazonian floodplain systems (e.g., Araujo-Lima et al., 1986; Forsberg et al., 1993; Manetta et al., 2003). Stable isotope signatures for Arapaima in Guyana, however, were less variable than those reported for a small sample of Arapaima from the central Amazon basin (i.e., δ13C = -28.4 to -18.9‰; δ15N = +8.5 to +12.3‰, n = 6; Domingues, University of Utah, pers. comm.). Isotope values in a particular consumer at any point in time most likely reflect feeding behavior over the previous few months. Perhaps isotope variation in Guyanese Arapaima that we sampled was relatively low because they were feeding on prey organisms that were less diverse than the full suite of potential prey fishes that we sampled.
The depleted 13C values observed for curimatids suggest that these fishes are receiving their carbon from a source that is different from other prey fishes in our sample. Other studies in tropical South America also have reported low 13C values for curimatid fishes (e.g., Jepsen & Winemiller, 2007; δ13C = -38.1‰). In the central Amazon, fishes with such low δ13C values were primarily detritivorous characiforms, especially curimatids and prochilodontids that apparently fed on phytoplankton and/or detritus derived from phytoplankton (Forsberg et al., 1993).
Results show considerable promise for isotope analyses to improve our understanding of the ecosystem role of Arapaima. Stable isotope analyses have the advantage of providing an integrative perspective on recent feeding habits without having to sacrifice large numbers of individuals over time for stomach analyses (e.g., Melville & Connolly, 2003; Garcia et al., 2006). Our results taken as a whole (i.e., isotope values, morphology and diets) suggest that Guyanese Arapaima are more appropriately considered omnivores rather than top predators. That does not take away from their role as consumers in Neotropical ecosystems, however, because their rapid growth (Arantes et al., 2010), large adult size, and relatively low trophic level may allow them to attain very high biomass. It also is evident that there are more than one species of Arapaima in the Amazon River basin (Stewart, 2013, in press), so further studies may reveal that some species are trophic specialists, including top predators. To date, there are no studies on ecosystem effects of these huge fishes at their historic abundances, which were estimated to be about eight times higher than today's overall average abundances in the Amazon (Castello et al., 2011). If conservation and management efforts ultimately are successful in bringing Arapaima back to their former abundances, economic returns from harvesting their populations could be substantially greater than at present. There are no free lunches, however, so some prey populations are likely to decline as a result. Studies like this one can be important for understanding both potential effects on food webs and related carrying capacities of floodplain ecosystems for sustaining Arapaima. Managing Neotropical floodplains with an ecosystem perspective should be our long-term goal.
We thank Karin Limburg, Alex Flecker, Jorge Hurtado, and an anonymous referee for constructive comments on earlier drafts. We are especially grateful to the fishermen of the North Rupununi; without their assistance this study would not have been possible. We also thank Kim Schulz for advice on field sampling. The North Rupununi District Development Board, Iwokrama Centre, and Karanambu Ranch provided logistic and material support in the field. This study was funded, in part, by National Geographic Society, Wildlife Conservation Society, World Wildlife Fund, Conservation International-Guyana, Rufford Foundation and SUNY College of Environmental Science and Forestry. The Guyana Environmental Protection Agency granted permission to conduct this study (Permit n° 060706 BR 055).
Literature Cited
- Allan, J. D., R. Abell, Z. Hogan, C. Revenga, B. W. Taylor, R. L. Welcomme & K. Winemiller. 2005. Overfishing of inland waters. BioScience, 55: 1041-1051.
- Almeida, O., K. Lorenzen & D. McGrath. 2009. Fishing agreements in the lower Amazon: for gain and restraint. Fisheries Management and Ecology, 16: 61-67.
- Arantes, C. C., L. Castello, D. J. Stewart, M. Cetra & H. L. Queiroz. 2010. Population density, growth and reproduction of arapaima in an Amazonian river-floodplain. Ecology of Freshwater Fish, 19: 455-465.
- Araujo-Lima, C. A. R. M., B. R. Forsberg, R. Victoria & L. Martinelli. 1986. Energy sources for detritivorous fishes in the Amazon. Science, 234: 1256-1258.
- Arrington, D. A. & K. O. Winemiller. 2002. Use of preserved biological specimens for stable isotope analysis. Transactions of the American Fisheries Society, 131: 337-342.
- Bayley, P. B. & M. Petrere Jr. 1989. Amazon fisheries: assessment methods, current status and management options. Pp. 385-398. In: Dodge, D. P. (Ed.). Proceedings of the International Large River Symposium. Canadian Special Publication of Fisheries and Aquatic Sciences 106.
- Buddington, R. K. & J. M. Diamond. 1986. Aristotle revisited: The function of pyloric caeca in fish. Proceedings of the National Academy of Sciences, 83: 8012-8014.
- Castello, L. 2008a. Nesting habitat of Arapaima gigas (Schinz) in Amazonian floodplains. Journal of Fish Biology, 72: 1520-1528.
- Castello, L. 2008b. Lateral migration of Arapaima gigas in floodplains of the Amazon. Ecology of Freshwater Fish, 17: 38-46.
- Castello, L., D. G. McGrath, L. L. Hess, M. T. Coe, P. A. Lefebvre, P. Petry, M. N. Macedo, V. F. Reno & C. C. Arantes. 2013. The vulnerability of Amazon freshwater ecosystems. Conservation Letters, 0: 1-13.
- Castello, L., J. P. Viana, G. Watkins, M. Pinedo-Vasquez & V. A. Luzadis. 2009. Lessons from integrating fishers of arapaima in small-scale fisheries management at the Mamirauá Reserve, Amazon. Environmental Management, 43: 197-209.
- Castello, L. & D. J. Stewart. 2010. Assessing CITES non-detriment findings procedures for Arapaima in Brazil. Journal of Applied Ichthyology, 26: 49-56.
- Castello, L. , D. J. Stewart & C. C. Arantes. 2011. Modeling population dynamics and conservation of arapaima in the Amazon. Reviews in Fish Biology and Fisheries, 21: 623-640.
- Cuvier, G. & A. Valenciennes. 1847. Histoire naturelle des poissons. Tome dix-neuvième. Suite du livre dix-neuvième. Brochets ou Lucioïdes. Livre vingtième. De quelques familles de Malacoptérygiens, intermédiaires entre les Brochets et les Clupes. P. Bertrand, Paris V.
- de Oliveira, V., S. L. Poleto & P. C. Venere. 2005. Feeding of juvenile pirarucu (Arapaima gigas, Arapaimidae) in their natural environment, lago Quatro Bocas, Araguaiana-MT, Brazil. Neotropical Ichthyology, 3: 312-314.
- Estes, J. A., J. Terborgh, J. S. Brashares, M. E. Power, J. Berger, W. J. Bond, S. R. Carpenter, T. E. Essington, R. D. Holt, J. B. C. Jackson, R. J. Marquis, L. Oksanen, T. Oksanen, R. T. Paine, E. K. Pikitch, W. J. Ripple, S. A. Sandin, M. Scheffer, T. W. Schoener, J. B. Shurin, A. R. E. Sinclair, M. E. Soulé, R. Virtanen, D. A. Wardle. 2011. Trophic downgrading of planet Earth. Science, 333: 301-306.
- Forsberg, B. R., C. A. R. M. Araujo-Lima, L. A. Martinelli, R. L. Victoria & J. A. Bonassi. 1993. Autotrophic carbon sources for fish of the central Amazon. Ecology, 74: 643-652.
- Garcia, A. M., D. J. Hoeinghaus, J. P. Vieira, K. O. Winemiller, D. M. L. Motta Marques & M. A. Bemvenuti. 2006. Preliminary examination of food web structure of Nicola Lake (Taim Hydrological System, south Brazil) using dual C and N stable isotope analyses. Neotropical Ichthyology, 4: 279-284.
- German, D. P. & M. H. Horn. 2006. Gut length and mass in herbivorous and carnivorous prickleback fishes (Teleostei: Stichaeidae): ontogenetic, dietary, and phylogenetic effects. Marine Biology, 148: 1123-1134.
- Jepsen, D. B. & K. O. Winemiller. 2002. Structure of tropical river food webs revealed by stable isotope ratios. Oikos, 96: 46-55.
- Jepsen, D. B. & K. O Winemiller. 2007. Basin geochemistry and isotopic ratios of fishes and basal production sources in four Neotropical rivers. Ecology of Freshwater Fish, 16: 267-281.
- Junk, W. J. 2007. Freshwater fishes of South America: Their biodiversity, fisheries, and habitat - a synthesis. Aquatic Ecosystem Health and Management, 10: 228-242.
- Kapoor, B. C., H. Smith & I. A. Verighina. 1975. The alimentary canal and digestion in teleosts. Advances in Marine Biology, 13: 109-239.
- Kelly, J. F. 2000. Stable isotopes of carbon and nitrogen in the study of avian and mammalian trophic ecology. Canadian Journal of Zoology, 78: 1-27.
- Lowe-McConnell, R. H. 1987. Ecological Studies in Tropical Fish Communities. Cambridge University Press, Cambridge.
- Lundberg, J. G., M. Kottelat, G. R. Smith, M. L. J Stiassny & A. C. Gill. 2000. So many fishes, so little time: an overview of recent ichthyological discovery in continental waters. Annals of the Missouri Botanical Garden, 87: 26-62.
- Manetta, G. L., E. Benedito-Cecilio & M. Martinelli. 2003. Carbon sources and trophic position of the main species of fishes of Baía River, Paraná River floodplain, Brazil. Brazilian Journal of Biology, 63: 283-290.
- Martelo, J., K. Lorenzen, M. Crossa & D.G. McGrath. 2008. Habitat associations of exploited fish species in the Lower Amazon river-floodplain system. Freshwater Biology, 53: 2455-2464.
- McCutchan Jr., J. H., W. M. Lewis Jr., C. Kendall & C. C. McGrath. 2003. Variation in trophic shift for stable isotope ratios of carbon, nitrogen, and sulfur. Oikos, 102: 378-390.
- McGrath, D., A. Cardoso, O. Almeida & J. Pezzuti. 2008. Constructing a policy and institutional framework for an ecosystem-based approach to managing the Lower Amazon floodplain. Environment, Development and Sustainability, 10: 677-695.
- Melville, A. J. & R. M. Connolly. 2003. Spatial analysis of stable isotope data to determine primary sources of nutrition for fish. Oecologia, 136: 499-507.
- Michener, R. H. & D. M. Schnell. 1994. Stable isotope ratios as tracers in marine aquatic food webs. Pp. 138-157. In: Lajtha, K. & R. Michener (Eds.). Stable Isotopes in Ecology and Environmental Science. Blackwell Scientific, Oxford.
- Nelson, G. J. 1972. Observations on the gut of the Osteoglossomorpha. Copeia, 1972: 325-329.
- Peterson, B. J. & B. Fry. 1987. Stable isotopes in ecosystem studies. Annual Reviews of Ecology, Evolution and Systematics, 18: 293-320.
- Philips, D. L. & P. L. Koch. 2002. Incorporating concentration dependence in stable isotope mixing models. Oecologia, 130: 114-125.
- Phillips, D. L. & J. W. Gregg. 2003. Source partitioning using stable isotopes: coping with too many sources. Oecologia, 136: 261-269.
- Pinese, J. F. 1996. Morfologia funcional da alimentação do pirarucu (Arapaima gigas). Unpublished Ph.D. Dissertation, Universidade Federal de São Carlos, São Carlos, Brazil, 60p.
- Post, D. M. 2002. Using stable isotopes to estimate trophic position: models, methods, and assumptions. Ecology, 83: 703-718.
- Queiroz, H. L. 2000. Natural history and conservation of pirarucu, Arapaima gigas, at the Amazonian várzea: red giants in muddy waters. Unpublished Ph.D. Dissertation, University of St. Andrews, Scotland , 226p .
- Queiroz, H. L. & A. D. Sardinha. 1999. A preservação e o uso sustentado dos pirarucus em Mamirauá. Pp. 108-141. In: Queiroz, H. L. & W. G. R. Crampton (Eds.). Estratégias para o manejo de recursos pesqueiros em Mamirauá. Conselho Nacional de Desenvolvimento Científico e Tecnológico Sociedade Civil Mamirauá, Tefé, Brazil.
- Stewart, D. J. 2013. Re-description of Arapaima agassizii (Valenciennes), a rare fish from Brazil (Osteoglossomorpha, Osteoglossidae). Copeia, 2013: 38-51.
- Stewart, D. J. in press. A new species of Arapaima (Osteoglossomorpha, Osteoglossidae) from the Solimões River, Amazonas State, Brazil. Copeia.
- Watson, L. C. 2011. Ecology and Conservation of Arapaima in Guyana: Recovery of a Giant Fish in Distress. Unpublished Ph.D. Dissertation, SUNY College of Environmental Science and Forestry, Syracuse, New York.
-
Published June 28, 2013
Publication Dates
-
Publication in this collection
June 2013
History
-
Received
27 Sept 2012 -
Accepted
19 Apr 2013