 Anti-obesity and anti-diabetic activities of leaves extract from Morus nigra L. in mice submitted to a hypercaloric diet
Abstract
Obesity is a major public health concern that is associated with endocrine and metabolic disorders. Morus nigra L. is traditionally used in folk medicine owing to its anti-obesity and anti-diabetic effects. The effect of the lyophilized aqueous extract of the leaves of M. nigra L. (MN) on body weight gain and adipose tissue deposition in mice fed a hypercaloric diet was analyzed. A total of 46 male mice were divided into four groups: standard diet (SD), standard diet and extract (SD+MN), hypercaloric diet (HFD), and hypercaloric diet and extract (HFD+MN) for 12 weeks. The macroscopic, physiological, and biochemical parameters were evaluated. Use of M. nigra leaves extract in mice into hypercaloric diet (HFD+MN) reduced the blood glucose levels (mg/dl) and body weight gain (Δ%), what reflected in a lowest weight of adipose cushions (g) and gastrocnemius muscles (g) in comparison with control group (HFD) (p < 0.05). Other obesity-related biomarkers, including plasma lipid profiles and hepatic and renal functions, also showed improvement. Morus nigra leaf extract has the potential to be an alternative therapy for obesity-related metabolic disorders, primarily by improving glucose regulation and reducing fat mass in mice.
Key words
Morus nigra L; Hipercaloric diet; Anti-obesity effect; Anti-diabetic effect
INTRODUCTION
Obesity is a universal condition that is increasingly prevalent in the modern society (Malik et al. 2020), it affects approximately two billion adults, and is a concerning public health issue worldwide (Kerr et al. 2025, WHO 2025, Swinburn et al. 2019). A recent global forecasting study suggests obesity linked diabetes, may affect 1.31 billion people globally by the year 2050 (Kerr et al. 2025).
Obesity is a chronic, endocrine-metabolic, and inflammatory disease characterized by abnormal/excess accumulation of adipose tissue in the body (Fitch & Bays 2022, WHO 2025, Gulati & Murphy 2025). It has multifactorial etiology related to both genetic and environmental factors (Allum & Grundberg 2020, Tirthani et al. 2023). It can be triggered by metabolic errors, dietary deficiency, or positive energy balance. Thus, promoting increased energy and body weight storage (Ritze et al. 2015, Liu et al. 2025). In adults, the incidence and persistence of obesity are linked to the development of chronic diseases that may result in an elevated risk of premature mortality (Kerr et al. 2025, WHO 2025, Conde & Borges 2011). Individuals with progressive accumulation of body fat have morbidity and mortality rates up to 12 folds higher than eutrophic individuals, with poor nutrition being an attributable factor to obesity (Malik et al. 2020).
The most commonly used method to assess overweight and obesity is the relationship between weight (kg) and height (m2), known as BMI (kg/m ²) or the Quetelet index (Muscogiuri et al. 2023, WHO 2025). Although BMI is routinely used in research and clinical practice to assess body composition; it does not reflect skeletal muscle mass or adipose tissue distribution (Rios-Olais et al. 2025). The BMI may overestimate adiposity in overweight individuals and underestimate adiposity in individuals with reduced muscle mass (Sizoo et al. 2023, Liu et al. 2022). In such cases, different standards should be used to assess the body composition with greater accuracy (Rios-Olais et al. 2025).
Diet and exercise are proven cornerstones in the treatment of obesity. The development of alternative newer therapies is also necessary in view of the high morbidity rates associated with the increase in obesity (Pickett-Blakely & Newberry 2016). Phytotherapy is a complementary strategy to the treatment of obesity, aiming not only to reduce weight, but also to reduce the risks associated with being overweight (Almeida et al. 2007, Keith 2016). Among the herbal medicines used for the control of endocrine and metabolic diseases, blackberry (Morus nigra L.), belonging to the Moraceae family stands out, it is often used by the population of northeast Brazil for its therapeutic properties such as anti-inflammatory, diuretic, antitussive, analgesic, and antipyretic properties (Oliveira et al. 2013, James et al. 2024). Their medicinal properties are related to the production of bioactive compounds, such as alkaloids, terpenoids, and triterpenes, and phenolic compounds, such as tannins and flavonoids (James et al. 2024, Yao et al. 2024, Vukmirović et al. 2023). Most research concentrates on the edible parts, such as fruits, roots, and bark, whereas leaves are rarely used. The fruit is used to treat liver, kidney, and hypoglycemic diseases (James et al. 2024, Liu et al. 2025, He et al. 2019). The roots are used in the treatment of hypertension, whereas the leaves are used as anti-inflammatory and hypercholesterolemic agents (Awad et al. 2012, James et al. 2024). However, there are few studies reporting the benefits of M. nigra leaf extract for the reduction of metabolic disorders associated with obesity.
Currently, plants are grown in the San Francisco Valley, where no commercial insecticides, fungicides, or herbicides are used (Oliveira et al. 2013, Volpato et al. 2011). In recent years there has been an increasing use of leaf tea (decoction) of Morus nigra by the northeastern population. It is employed for the treatment of diabetes, cholesterol, cardiovascular disorders, and obesity (Oliveira et al. 2013, Souza et al. 2015). Despite its deliberate use in the general population, no studies have been conducted to prove this effect. In this context, the present study investigated the effects of prolonged administration of a freeze-dried aqueous extract of Morus nigra on weight control of mice, fed a hypercaloric diet.
MATERIALS AND METHODS
Extract preparation
The leaves of Morus nigra were picked in the morning from Petrolina city, Pernambuco State, Brazil, during March and August 2017. The plant was identified and authenticated by experts from the Reference Center for the Recovery of Degraded Areas (CRAD). The specimen was compared to exsiccate #1764 deposited at the San Francisco Valley Herbarium (HVASF) of the Federal University of São Francisco Valley (UNIVASF).
The leaves of the plant were dried at 45°C for a period of 36 h in an aerated stove, ground and a powder were prepared, similarly to the folk-medicine preparation method. Samples of crushed leaves were used for mineral composition analysis, according to the methodology described by Malavolta et al. (1997). The Morus nigra aqueous extract was prepared by boiling 12 g of leaf powder in a kettle containing 1 L of water for 10 min (Oliveira et al. 2013). The extract was chilled to room temperature. The residue was removed by filtration (UNIFIL® 125 mm) and the extract was stored at −80°C and then lyophilized in UPLC Waters Xevo G2-S QTof (Waters Micromass®, USA), obtaining the dry lyophilized extract of M. nigra (MN).
Feed preparation and weight gain induction
Two types of diets were used: 1) Control groups were fed a commercial diet (Labina®), called the Standard Diet (SD) [approximately 53 g of carbohydrates, 22 g of protein, 5 g of fat, and 5 g of fiber in 100 g of diet] and 2) a junction of the standard diet with other high-fat ingredients called the High Fat Diet (HFD) [approximately 49 g of carbohydrates, 17 g protein, 22 g fat, and 3 g fiber in 100 g of diet]. The HFD consisted of a standard diet supplemented with peanuts, milk chocolate, sweet cookies in a ratio of 3:2:2:1, and lard (9 g: 1000 g of feed). All ingredients were ground using a food processor (C.A.F, model PA190, Brazil) to form granules ~2 mm in diameter. The grains were mixed until a homogeneous mass was formed. Subsequently, they were shaped into pellets with a diameter of 21 mm, allowing for rapid and uniform drying. Thus, eliminating the possibility of mold growth during storage. The pellets were dried at 45°C for a period of 48 h in an aerated oven (Ethik Technology, model 420-6TD), thus avoiding saturation of lipid chains and conversion of amino acids. The proximate analysis was realized according to procedures of the Instituto Adolfo Lutz and AOAC International, which includes quantitative determinations of the following parameters: carbohydrates, proteins, fiber, fat, ash, and moisture. The amount the crude protein was realized by kjeldahl digestion method, total lipids by Soxhlet extraction, crude fiber by acid/base digestion method, moisture by oven drying, and ash by incineration. Total carbohydrates were calculated by subtracting amount of crude protein, crude fibre, ash and lipid from the total amount of dry matter. All analyses were performed in triplicate (AOAC International 2012, Instituto Adolfo Lutz 2008). The caloric density was determined using the adiabatic method (IKA-C400). The hypercaloric diet obtained a density of 4.6 kcal/g, with 42.4% of the caloric content coming from carbohydrates and 43% from lipids (Estadella et al. 2004, Bueno et al. 2011, Santos et al. 2013).
Animal and experimental conditions
Adult male Mus musculus albine Swiss mice (5- to 8-week-old; weighing 25-40 g) were obtained from the Central Bioterium of the UNIVASF. The mice were housed (one animal per cage) and maintained at 22±3°C, 55-60% humidity with food and water available ad libitum on a 12h light/dark cycle (lights on at 6 a.m. and off at 6 p.m.). All animal procedures followed the guidelines of the National Council for the Control of Animal Experimentation (CONCEA). All experimental protocols involving animals were approved by the Ethics Committee on the Use of Animals (CEUA-UNIVASF; protocol #0006/180817).
After one week of adaptation, the mice were randomly divided into four groups (n=10- 13/group) as follows: SD, SD+MN (246 mg/kg), HFD, and HFD+MN (246 mg/kg). The lyophilized extract of Morus nigra (MN) was administered daily by gavage according to the weight of the animal. The concentration used was based on popular use and was converted to mice using dose variation (Nair & Jacob 2016). The adaptation of human reference doses to mice was performed using allometric correction based on body surface area, calculated according to standardized Km factors. The strategy adopted follows the methodology described by Reagan-Shaw et al. (2008). The body surface area (BSA) normalization method is more appropriate for conversion of drug doses from animal studies to human studies. A simple conversion based on body weight is not appropriate (Reagan-Shaw et al. 2008).
The animals were weighed daily and the extracts were diluted in distilled water. The experiment lasted for 12 weeks; weekly water and food intake along with weight gain was analyzed. At the end of the experiment, the lipid and glycemic profiles, total calorie intake, food efficiency, organ weight, relative weight of the gastrocnemius muscle, Lee’s index, fat tissue, and adiposity index were determined.
Food and water intake
Food and water intake were determined as the difference between the quantity offered and leftovers, according to the following equation:
Caloric ingestion and food efficiency analysis
Caloric intake was calculated by multiplying the amount of ration consumed (g) by the caloric density (kcal/g) of the respective ratios. Feed efficiency was determined using the Food Efficiency Ratio (FER) and calorific efficiency (CE) (Nery et al. 2011). The first was the relationship between body weight gain and the amount of food consumed. The second was the relationship between weight gain and the number of calories consumed.
Being calculated using the following equations:
where:
Increased feed efficiency indicates that the animal makes better use of the food consumed, reflecting greater weight gain.
Body mass and Lee index analysis
To calculate the evolution or reduction in body mass, the in vivo delta weight formula was used (Zambon et al. 2009):
The Lee Index was determined at the end of the experiment. This index was calculated by dividing the cube root of body weight (g) by the nasoanal length (cm) and multiplying the result by 1000 (Araujo et al. 2009).
Measurements of blood parameters
Serum concentrations of total cholesterol (TC), triglycerides (TG), high-density lipoprotein (HDL), and blood glucose levels were determined using enzymatic methods. All were obtained from commercial kits (Labtest Diagnostics S.A, Brazil). Values were expressed in milligrams (mg) per deciliter (dL). Serum levels of low-density lipoprotein (LDL) and very low-density lipoprotein (VLDL) were calculated from triglyceride concentrations (Friedewald et al. 1972).
Macroscopic analysis and relative body weight
After euthanasia and blood collection, the hearts, livers, and kidneys of all the animals were removed, immersed in saline solution, and immediately weighed. After macroscopic analysis, the relative weights of the organs were determined. The following formula was used:
Determination of fat tissue, adiposity index and gastrocnemius muscle
The total body fat was determined by removing the epididymal, perirenal, and retroperitoneal fat pads. In addition to the gastrocnemius muscle. Consequently, dipped in saline solution. Following which the excess solution was removed with gauze and immediately weighed. Adiposity index was determined by dividing the weight of the three cushions by the final weight of the animal (White et al. 2013).
Statistical analysis
All data in this study were expressed as mean ± SEM. To test the hypothesis of a difference between the means of parametric data from two independent samples, the unpaired Student’s t-test was used. To test the hypothesis of a difference between the means of parametric data grouped in pairs of experimental conditions, a two-way analysis of variance (two-way ANOVA) was used, followed by the Sidak post-hoc test. The established level of statistical significance was p<0.05.
RESULTS
Mineral element determination
Chemical analyses of the plant tissues from the dry samples were performed as per the Malavolta et al. (1997) reported methodology. Samples of M. nigra leaves contained an abundance of macro-and micronutrients that are important for normal cell metabolism. Table I shows the mineral composition of blackberry leaves. The most abundant macroelements were N, Ca, and K, followed by P and Mg. Microelements (B, Cu, Fe, Mn, Zn, and Na) had the highest iron concentration (591 mg/kg), followed by sodium (200 mg/kg) and boron (101 mg/kg).
Effect of extract on water intake
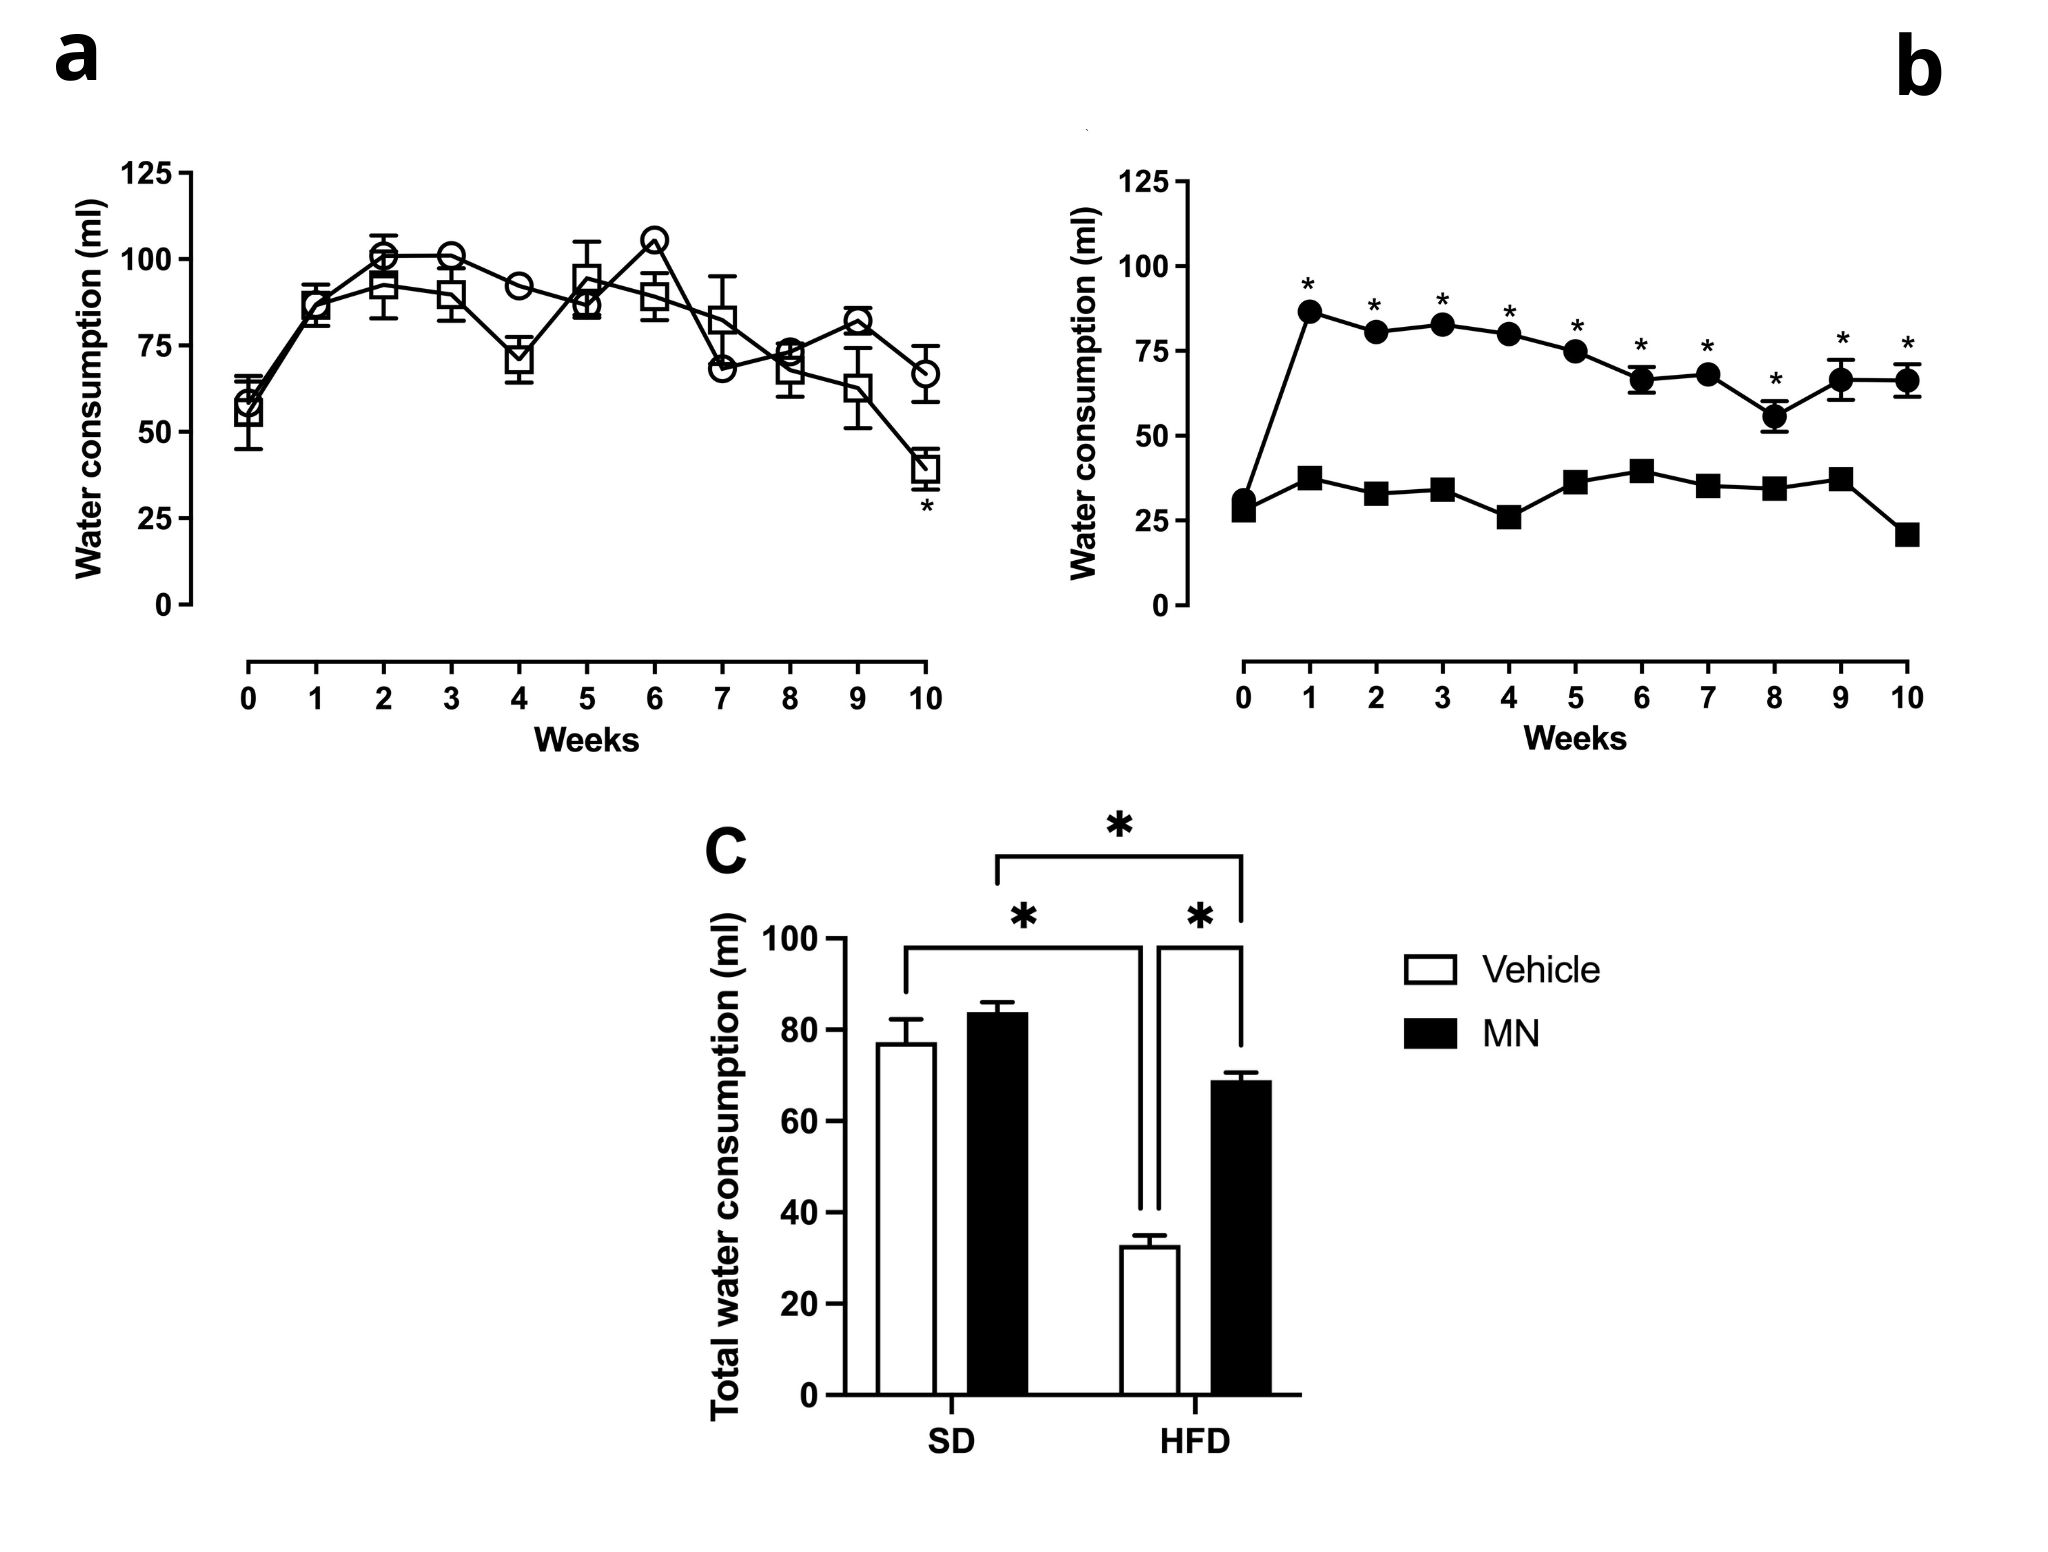
The groups fed with a hypercaloric food diet (HFD) and extract treatment (HFD + MN) showed a significantly higher difference in water intake from the first week (Figure 1b), whereas this behavior was not observed in the animals that received the standard diet or extract added to this treatment (Figure 1a). M. nigra extract significantly improved the total average water intake of animals fed with the hypercaloric diet (Figure 1c). During the trial period, the HFD+MN group consumed an average of 68.98 ± 4.70 mL of water per week, compared to 32.9 ± 1.7 mL per week in the HFD group (Figure 1c), representing a 109.6% increase in water intake relative to the HFD control. In contrast, the results showed that there was no statistical difference in water consumption between the animals that received standard food (SD) and those that received standard food plus were treated with M. nigra (SD+MN) (Figure 1c). However, overall, there was a significant reduction in water intake in animals fed with a hypercaloric food diet compared to those with the standard diet (Figure 1c). Moreover, the two-way ANOVA revealed a significant interaction between diet and treatment, which accounted for 12.21% of the total variance in water intake. Individually, the treatment accounted for 25.4% of the total variance and the diet accounted for 49.15% of the total variance in water intake.
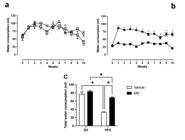
Effects of Morus nigra extract (MN) on water intake of mice: (a) fed with standard diet (□, n=10) and standard diet + MN (○, n=10) for 10 days of treatment; (b) fed with high fat diet (■, n=13) and high fat diet + MN (●, n=13) for 10 days of treatment; (c) Overall water consumption by experimental group. All values are expressed as mean ± standard error of the mean (SEM). *p<0.05 (Two-way ANOVA followed by Sidak post-hoc test).
Effect of extract on food and calorie intake
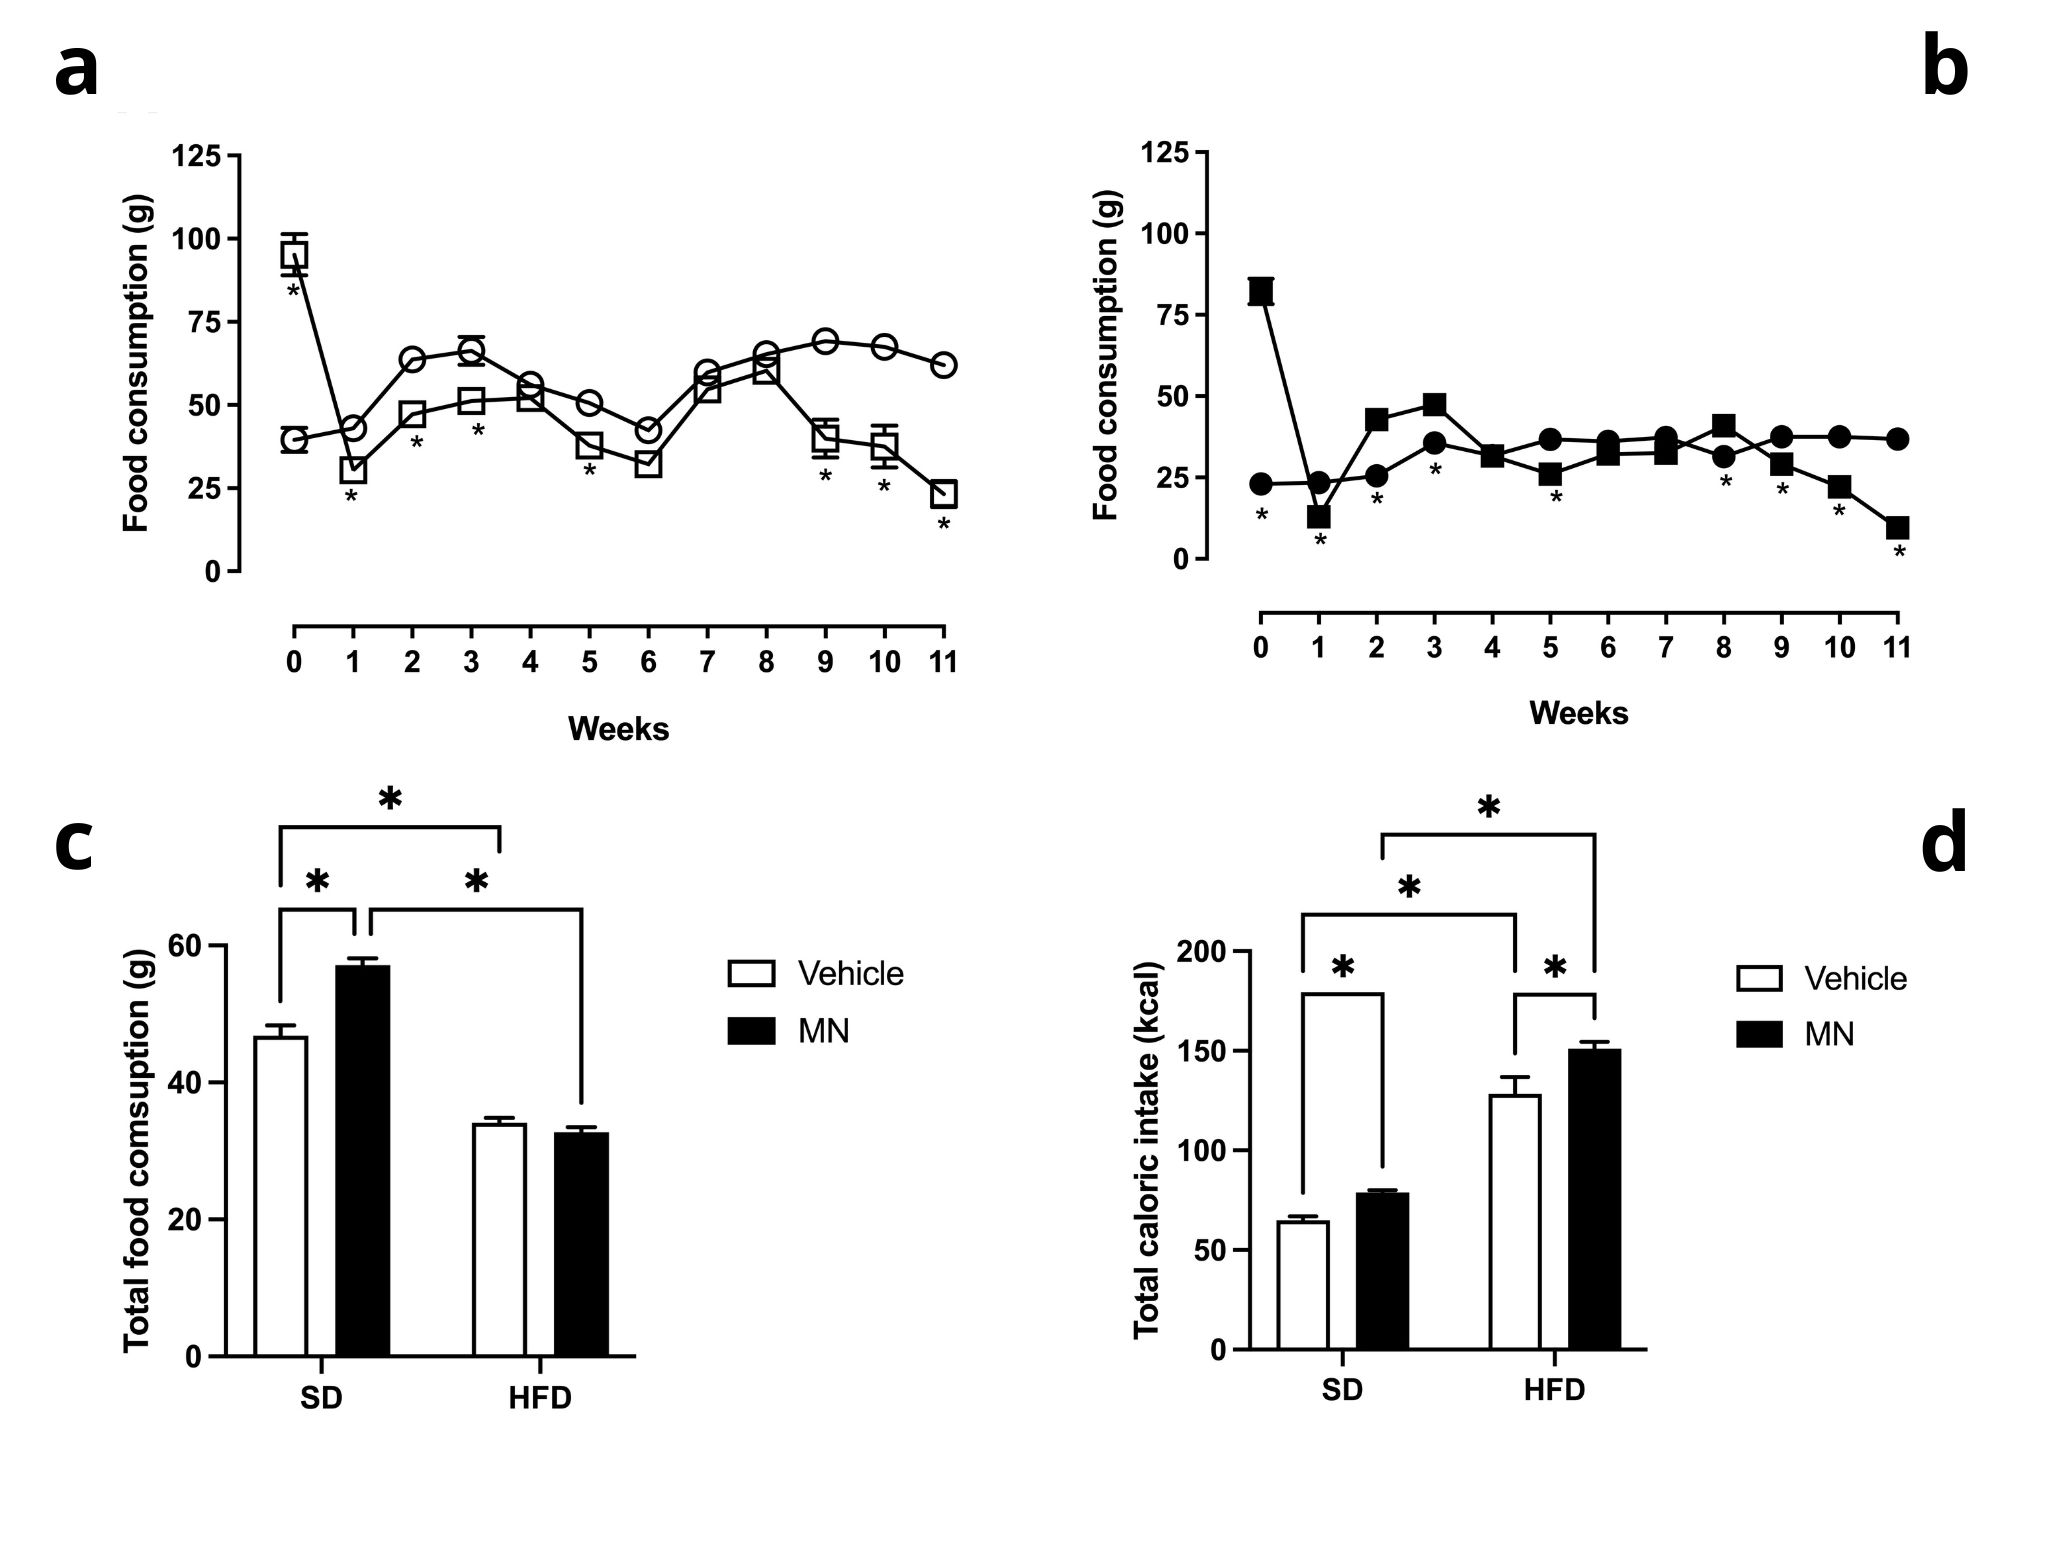
In relation to food intake, it was observed that from eighth week, a significantly higher difference in food consumption of the SD group compared to the SD+MN group (Figure 2a) with the SD+MN group obtaining better nutrient absorption performances during this period. Overall, the SD group consumed an average of 46.81±18.80 g of food per week while the SD+MN food group consumed 57.14±3.07 g of food per week, a significant increase of 22.06% in food consumption (Figure 2c).
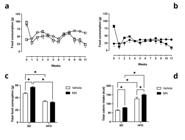
Effects of mulberry leaf extract on food intake of mice: (a) fed with standard diet (□, n=10) and standard diet + MN (○, n=10); (b) fed with high fat diet (■, n=13) and high fat diet + MN (●, n=13); (c) Total food consumption by experimental group and (d) total caloric intake by experimental group. All values are expressed as mean ± standard error of the mean (SEM). *p<0.05 (Two-way ANOVA followed by Sidak post-hoc test).
The HFD and HFD+MN groups also showed a significantly higher difference in feed consumption from nine week (Figure 2b) with HFD+MN group obtaining better nutrient absorption performances during this period. The group fed HFD consumed an average of 34.10±5.45 g of feed per week, while the HFD+MN group ingested an average of 32.72±1.64 g of food per week. There was no significant difference in total feed consumption between the groups (Figure 2c).
With regard to food intake, the two-way ANOVA revealed a significant interaction between diet and treatment, which accounted for 7.15% of the total variance in food consumption. Individually, the treatment accounted for only 4.19% of the total variance and the diet accounted for 71.93% of the total variance in water intake.
However, regarding caloric intake, the results show that total calorie intake was significantly increased in both SD and HFD groups of animals at the end of the experiments (Figure 2d). In general, during the 12 weeks, the SD group consumed an average of 64.90±7.4 kcal/week against 78.85±4.14 for the SD+MN group, a significant increase of 21.49%. The HFD group consumed on average 128.45±14.4 kcal/week against 151.0±7.6 kcal/week consumed by the HFD+MN group, a significant increase of 17.76%. Besides that, the two-way ANOVA revealed no significant interaction between diet and treatment, which accounted for only 0.31% of the total variance in caloric intake. Individually, the treatment accounted for only 5.62% of the total variance and, as expected, the diet accounted for 77.73% of the total variance in caloric intake.
As demonstrated (Figure 2c, d), the groups fed standard diet (SD and SD+MN) and hyper calorie diet (HFD and HFD+MN) had an average feed intake inversely proportional to caloric intake. Fact attributed to the caloric density of the feed, which makes the animals reach their nutritional and metabolic needs with less amount feed. In a general way, M. nigra extract does alter food and caloric intake in mice, regardless of the type of diet used.
Effect of extract on weight gain and Δ weight loss (PPD)
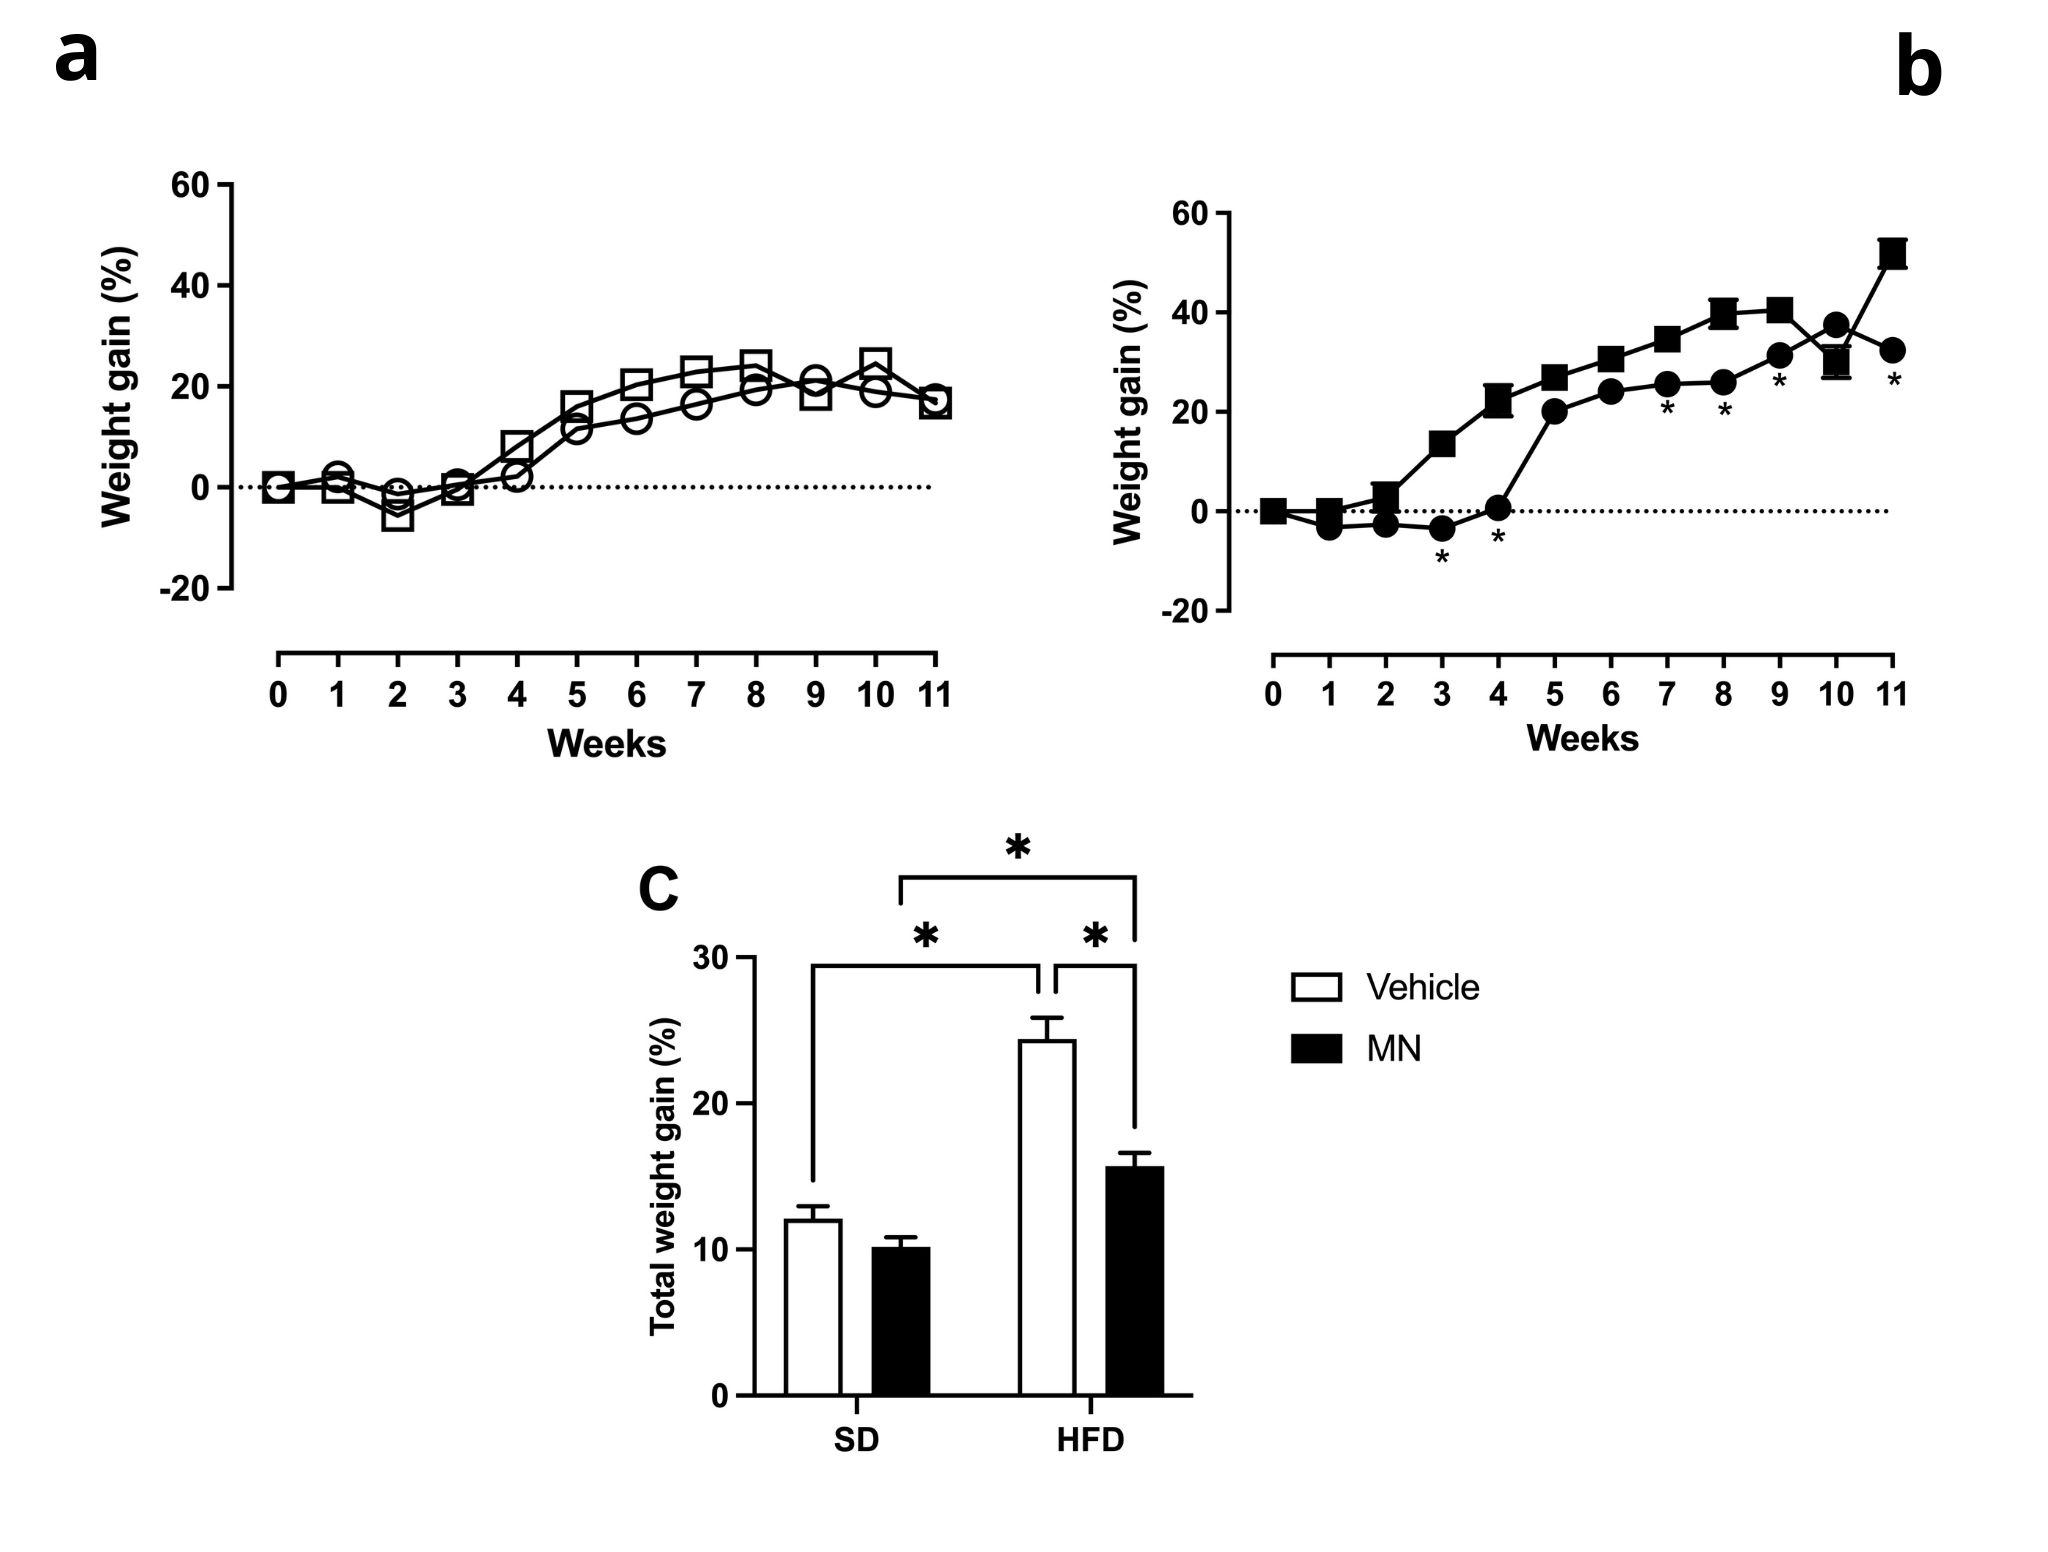
The treatment of M. nigra reduced the weight of the animals with the use of a hypercaloric diet (Figure 3b) but not in animals fed with the standard diet (Figure 3a). As shown in Figure 3c, the HFD+MN group had an average weight gain percentage lower than the HFD group, displaying an average of 15.71±4.63% of the HFD+MN group against 24.40±4.93% HFD, a significant decrease of 35.61%. Analysing the percentage of weight gain week by week (Figure 3b) through the two-way ANOVA, it was possible to verify that the HFD+MN group presented a significant weight percentage reduction in the weeks (3rd, 4th, 7th, 8th, 9th and 11th) when compared to the HFD group (Figure 3b). In addition, the monitoring of the percentage of weight gain showed that the HFD group presented an average weight gain significantly higher than SD (Figure 3c). The HFD group presented an average percentage 24.40±4.93% of body weight gain per week against 12.11±3.18% of the SD group, representing an increase of 101.48%. Moreover, the two-way ANOVA revealed a significant interaction between diet and treatment, which accounted for 7.51% of the total variance in weight gain. Individually, the treatment accounted for 18.47% of the total variance and the diet accounted for 52.07% of the total variance in weight gain.
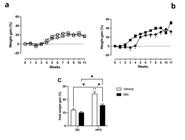
Effects of mulberry leaf extract on average weight gain of mice: (a) fed with standard diet (□, n=10) and standard diet + MN (○, n=10); (b) fed with high fat diet (■, n=13) and high fat diet + MN (●, n=13); (c) Total weight gain by experimental group. All values are expressed as mean ± standard error of the mean (SEM). *p<0.05 (Two-way ANOVA followed by Sidak post-hoc test).
Effect of extract on food and calorie efficiency
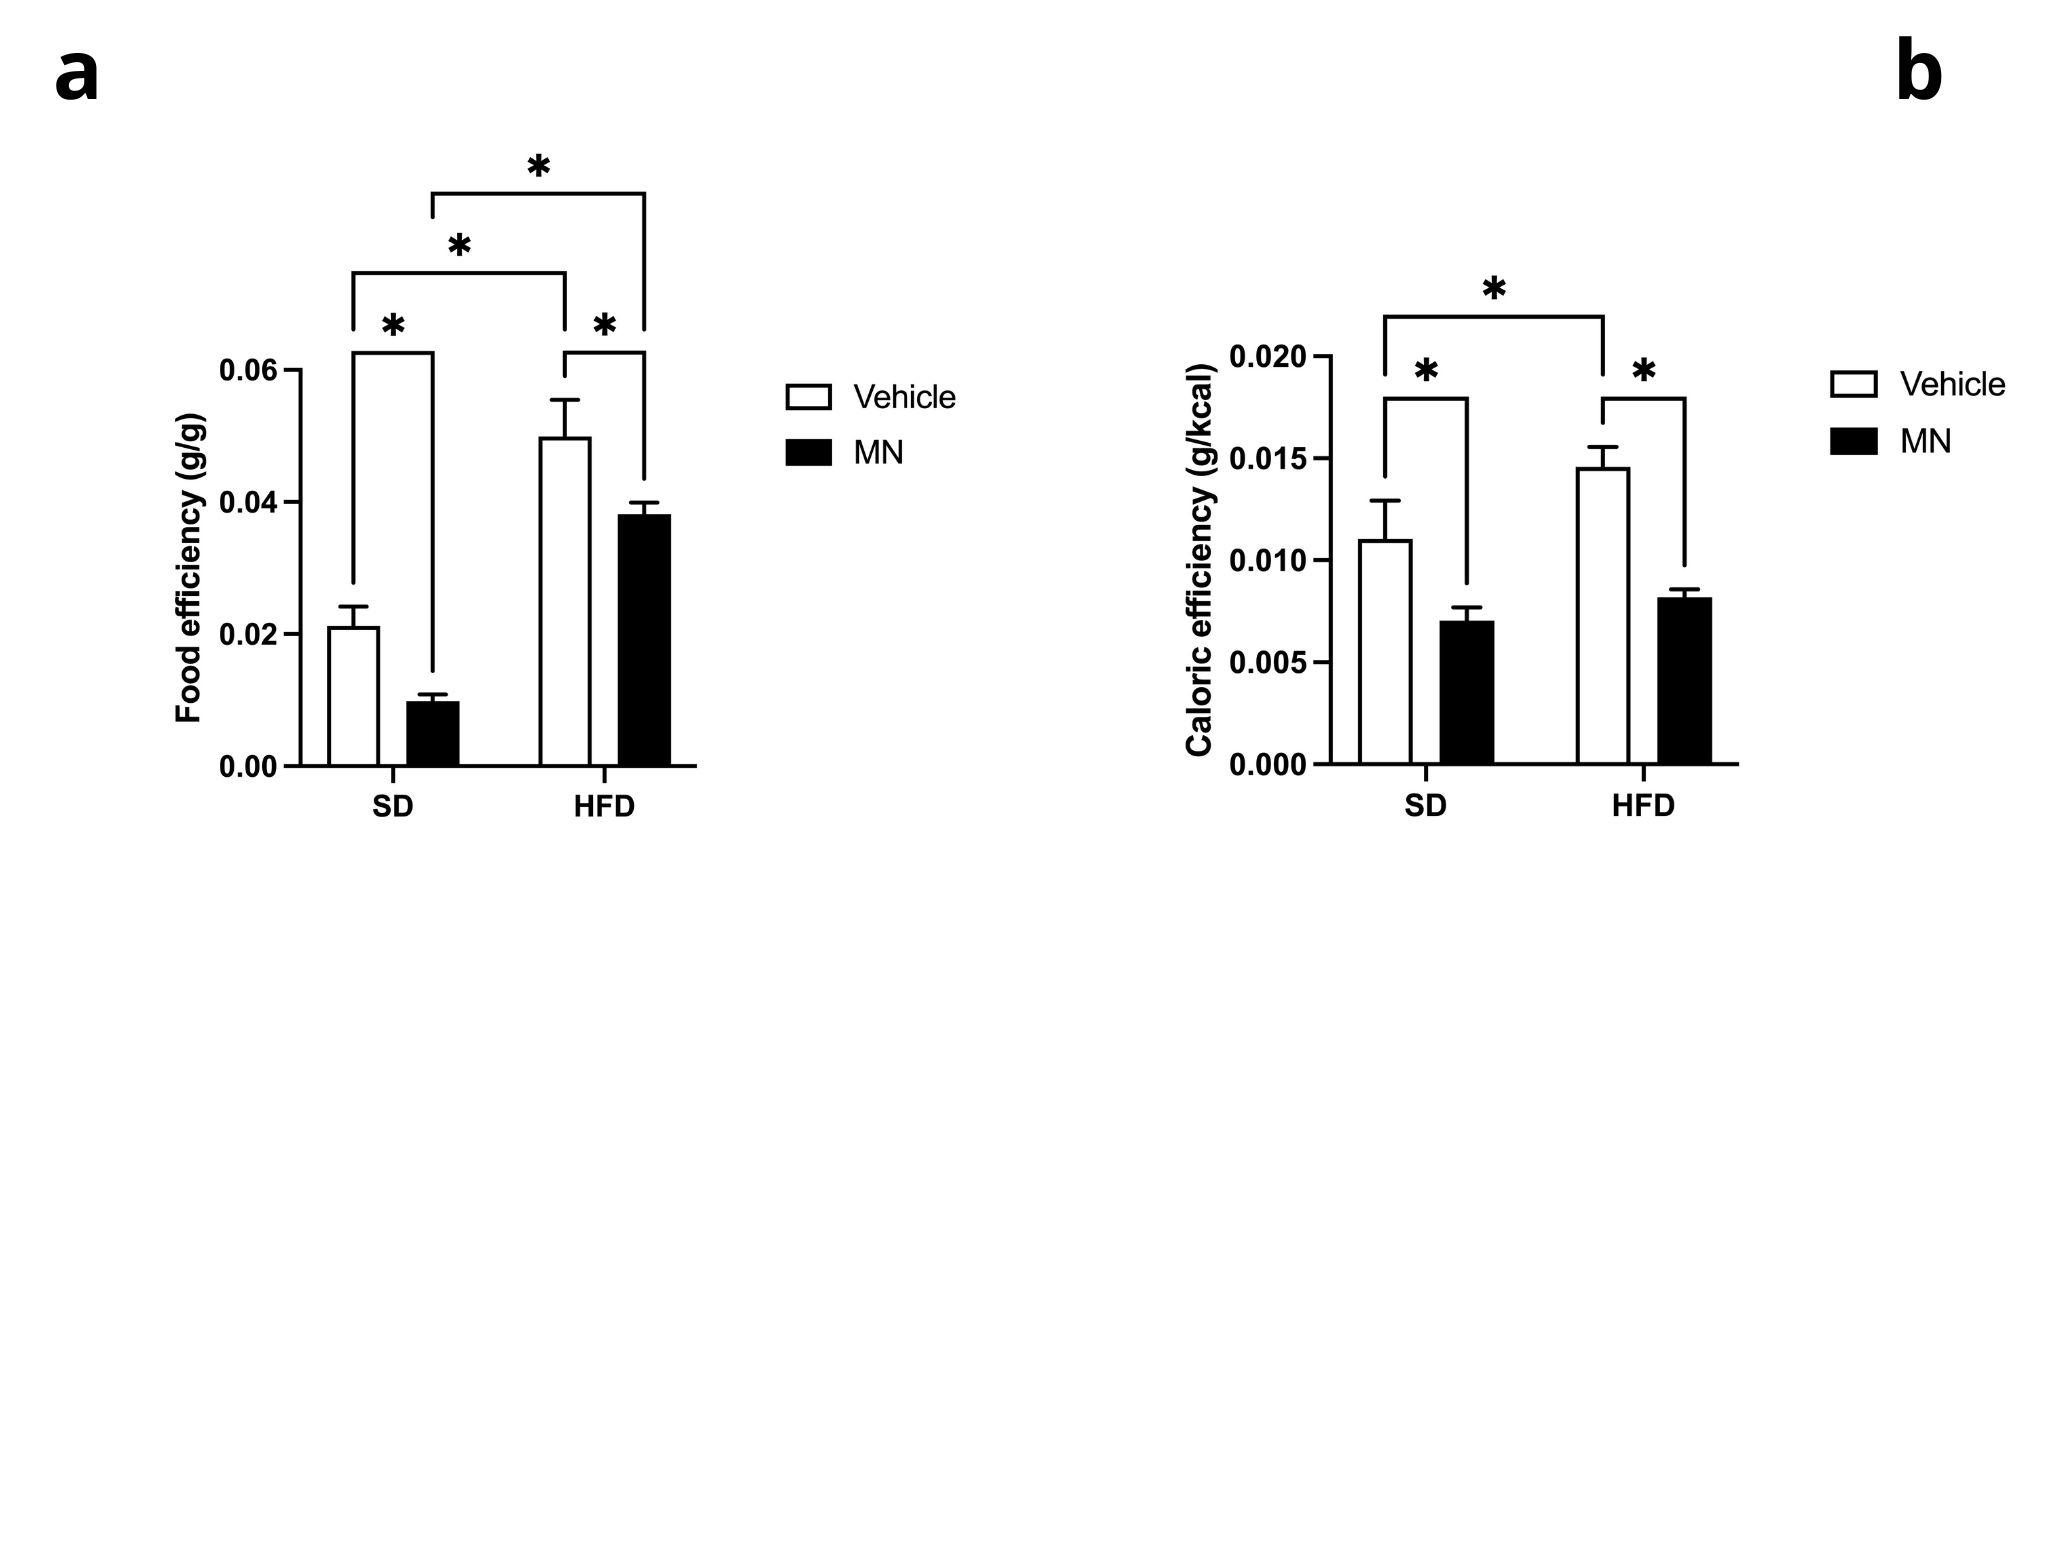
As shown in Figure 4, the groups treated with MN extract showed a reduction in food and caloric efficiency when compared to their respective controls and consequently, lower weight gain in relation to the amount of food and calories consumed. As shown in the Figure 4a, the SD+MN group presented an average of 0.0098±0.0009 g/g (weight gain by weight of feed consumed) against SD group 0.02115±0.0072 g/g for food efficiency, which represents a significant reduction of 53.66%. Moreover, the HFD+MN group showed an average of 0.0382±0.0017 g/g against 0.0499±0.0056 g/g for HFD, a significant reduction of 22.45%. There was no significant interaction between diet and treatment in the total variance in food efficiency. However, individually, the treatment accounted for 9.86% of the total variance and the diet accounted for 60.23% of the total variance, both being significant in food efficiency.
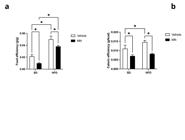
Food efficiency (a) and caloric efficiency (b) by experimental group fed with standard diet (SD, n=8), standard diet + M. nigra (DP+MN, n=13), hight fat diet (HFD, n=10) and hight fat diet + M. nigra (HFD+MN, n= 13). All values are expressed as mean ± standard error of the mean (SEM). *p<0.05 (Two-way ANOVA followed by Sidak post-hoc test).
Regarding to caloric efficiency, which is the relationship between weight gain and caloric intake (g of weight by kcal consumed), it can be observed that the SD+MN group presented an average of 0.0070±0.0006 g/kcal and SD group of 0.0084±0.0030 g/kcal (Figure 4b), a significant reduction of 16.66% on the caloric efficiency in animals treated with the plant extract. The HFD+MN group presented more expressive results, with an average of 0.0082±0.0004 g/kcal against 0.0499±0.0056 g/kcal of HFD group, which represents a massive and significant reduction of 83.56% in the caloric efficiency in HFD group. Moreover, the treatment had a significant impact on this effect, accounting for 35.04% of the total variance in caloric efficiency, whereas the diet accounted for only 7.18%.
Effect of extract on Lee’s Index
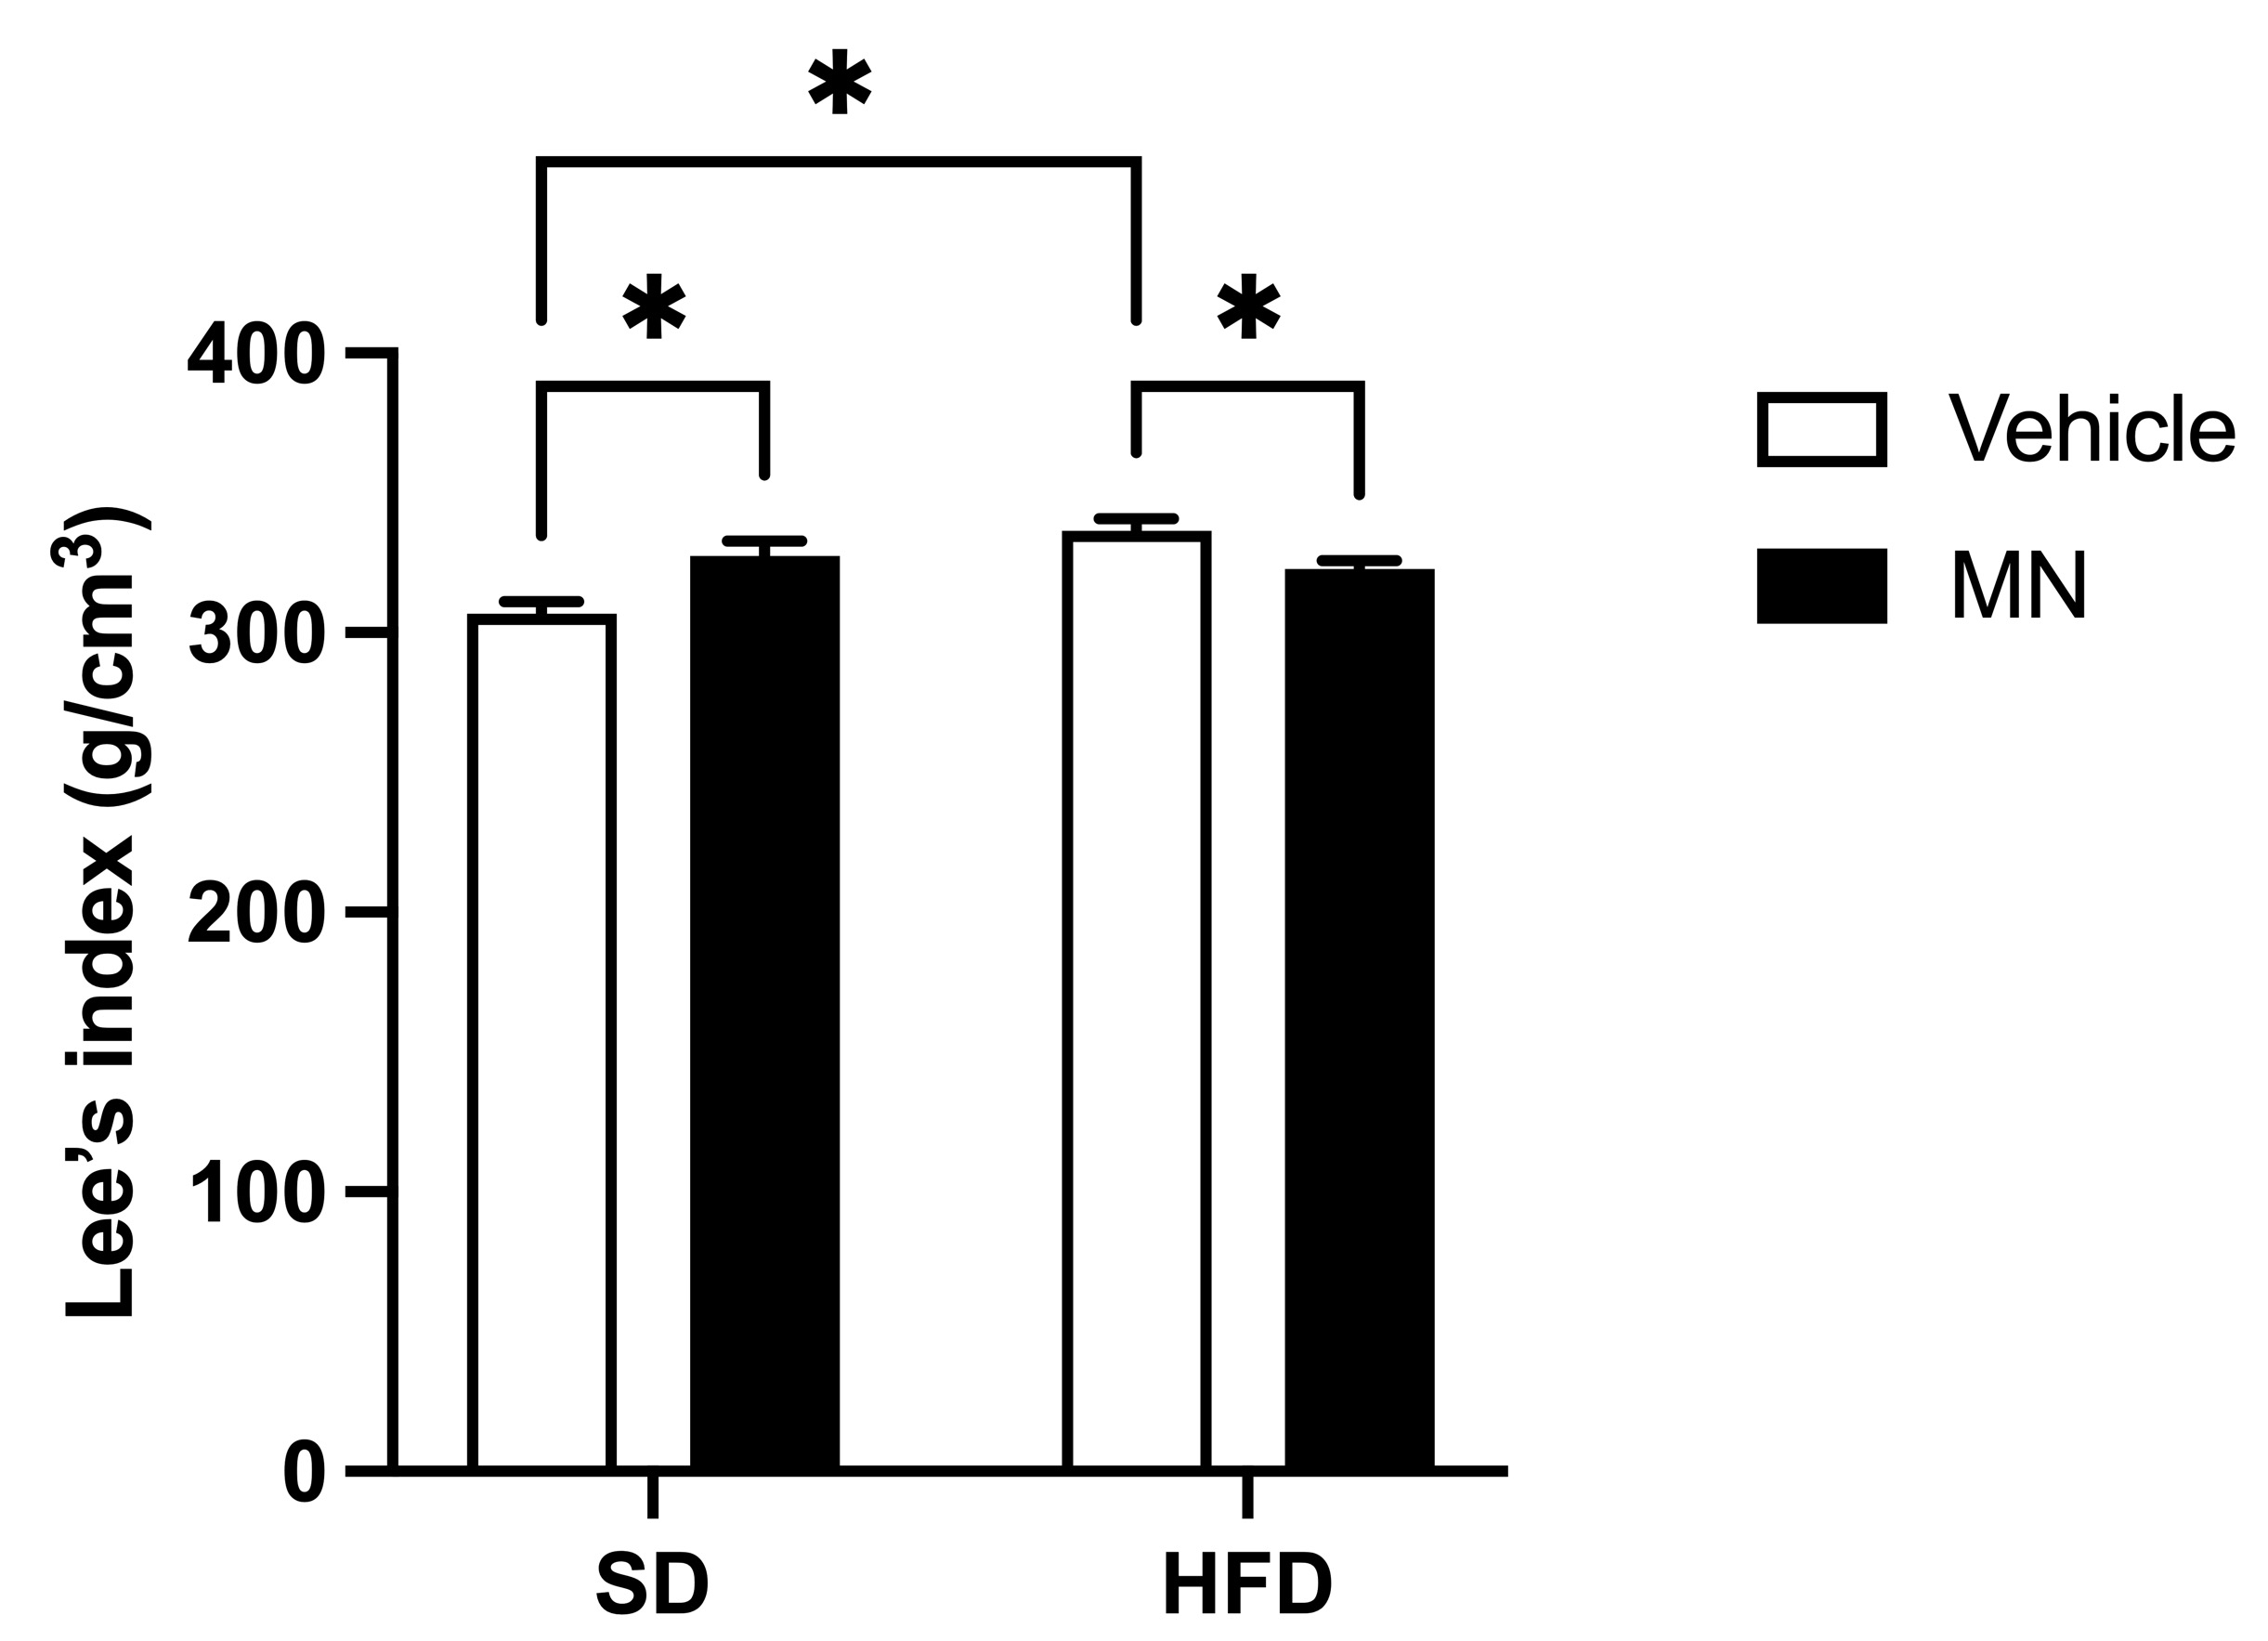
Final body weight of the HFD group was significantly higher compared to the SD group, represented by higher Lee’s index (Figure 5). After the 12 weeks period of treatment, the HFD group showed an average of 336.5±4.40 g/cm3 of body weight compared to 306.8±4.242 g/cm3 of body weight of the SD group, an increase of 9.68%. On the other hand, the Lee’s index in the HFD+MN group decreased significantly compared to the HFD group. In contrast, the SD+MN group showed a significant 6.73% increase in the Lee’s index, rising from 306.79±4.40 g/cm³ in the SD group to 327.50±5.46 g/cm³ in the SD+MN group. In this context, the treatment alone had a minor impact on changes in Lee’s index, with the diet accounting for 14.24% of the total variance, while the interaction between treatment and diet accounted for the majority of the effect, 26.33%.
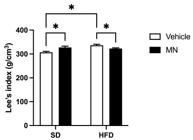
Effects of mulberry leaf extract on the Lee’s index (g/cm3) by experimental group fed with standard diet (SD, n=8), standard diet + M. nigra (DP+MN, n=10), hight fat diet (HFD, n=10) and hight fat diet + M. nigra (HFD+MN, n= 10). All values are expressed as mean ± standard error of the mean (SEM). *p<0.05 (Two-way ANOVA followed by Sidak post-hoc test).
However, despite being a widely used index, it cannot be used as an isolated parameter to determine overweight or obese status. Similarly, among humans, Lee’s index does not discriminate between fat and lean body masses.
Effect of the extract on adipose tissue, adiposity index and gastrocnemius muscle
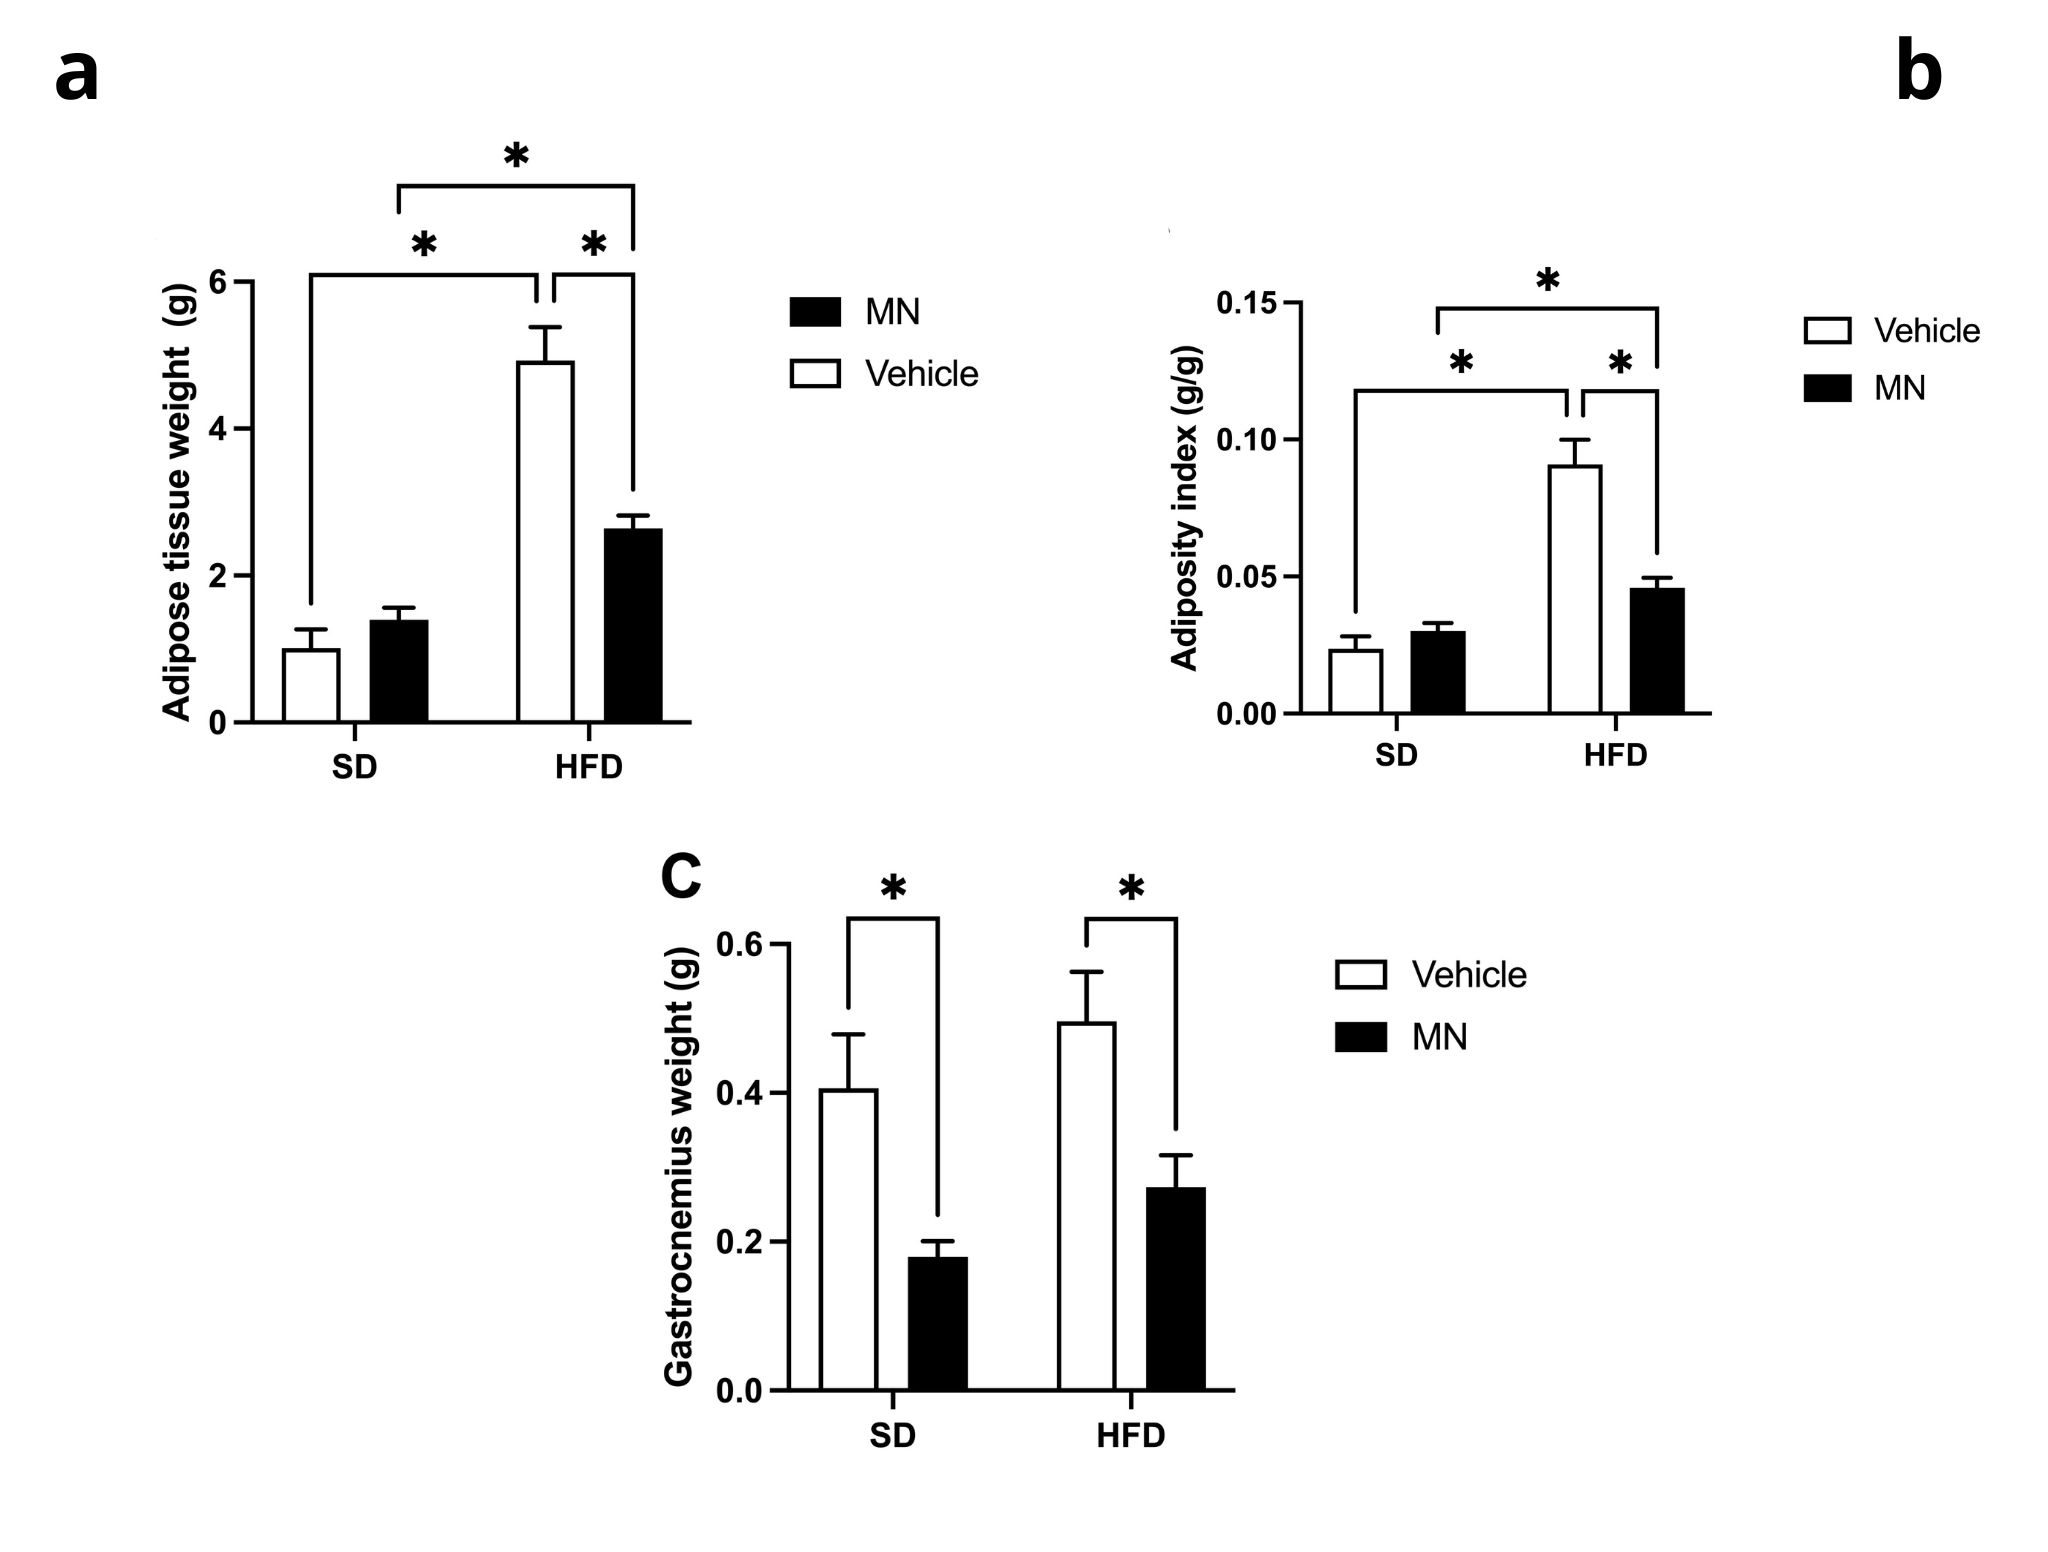
Comparing the animals fed with SD and those fed with HFD, we observed a significant increase in adipose tissue weight (from 1.011±0.255 g to 4.926±0.459 g) and in the adiposity index (from 0.023±0.045 g/g to 0.091±0.009 g/g), but not in gastrocnemius muscle weight (from 0.406±0.072 g to 0.496±0.066 g) (Figure 6).
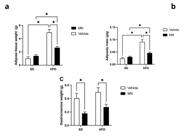
Adipose tissue (a), adiposity index (b) and gastrocnemius muscle (c), by experimental group fed with standard diet (SD, n=8), standard diet + M. nigra (DP+MN, n=10), hight fat diet (HFD, n=10) and hight fat diet + M. nigra (HFD+MN, n= 10). All values are expressed as mean ± standard error of the mean (SEM). *p<0.05 (Unpaired t test: SD vs. SD+MN or HFD vs. HFD+MN).
At the end of the experimental period, the HFD+MN group exhibited an average fat pad weight of 2.645±0.173 g compared to 4.926±0.459 g in the HFD group, representing a significant 46.31% reduction in adipose tissue. In contrast, the SD+MN group showed an average adipose tissue weight of 1.397±0.173 g versus 1.011±0.255 g in the SD group, an increase with no statistical significance (Figure 6a). There was a significant interaction between diet and treatment, which accounted for 14.94% of the total variance in adipose tissue weight. Individually, the treatment accounted for only 7.54% of the total variance, while the diet accounted for 55.98% of the total variance in weight gain.
Regarding the adiposity index, it was also observed that the group HFD+MN had the average of 0.051±0.006 g/g versus 0.091±0.009 g/g of the HFD group, representing a significant reduction of 43.95%, while the SD+MN group averaged 0.030±0.003 g/g versus 0.024±0.005 g/g for the SD group, an increase with no statistical significance (Figure 6b). There was a significant interaction between diet and treatment, which accounted for 17.93% of the total variance in adiposity index. Individually, the treatment accounted for only 9.98% of the total variance, while the diet accounted for 46.83% of the total variance in adiposity index.
At last, the gastrocnemius muscle weight was also measured, serving in this study as a representative indicator of the animal’s overall musculature. As shown in Figure 6c, at the end of 12 weeks, the SD+MN group presented a gastrocnemius average weight of 0.179±0.021 g compared to 0.406±0.072 g in the SD group, a significant decrease of 55.91%. The HFD+MN group presented a gastrocnemius average weight of 0.273±0.043 g compared to 0.496±0.066 g in the HFD group, a significant decrease of 44.95%. Unlike the previous results, there was no significant interaction between diet and treatment on the average gastrocnemius weight change. The diet accounted for only 5.71% of the total variance in gastrocnemius weight, and this influence was not significant. However, the treatment had a significant effect on the average gastrocnemius weight change, accounting for 34.40% of the total variance.
Effect of extract on relative weight and morphology of organs
In relation to the relative organ weight, the group of animals treated with MN extract showed a significantly higher (p<0.05) difference in kidney weight than the respective controls (Table II). The HFD+MN group presented a mean relative weight of the kidneys in grams of 1.468±0.1000 g compared to 1.090±0.0249 g for the HFD group, an increase of 34.67%. This difference was also observed in groups fed the standard diet. The SD+MN group presented statistical difference (p<0.05), with mean kidney weight of 1.670±0.0644 g compared to 1.413±0.0754 g in the SD group, representing an 18% increase. In relation to the other organs analyzed, no significant difference was found in the relative weights of the organs of the groups analyzed (Table II).
Effects of mulberry leaf extract on the relative weight of organs. Standard diet (SD, n=8), standard diet + M. nigra (SD+MN, n= 8), Hight fat diet (HFD, n=8) and Hight fat diet + M. nigra (HFD+MN, n=8). Date are represented as mean ± SEM. *significant change at p <0.05 in comparison with HFD group; # significant change at p <0.05 in comparison with SD group, as determined by unpaired t test.
Effect of extract on biochemical parameters
As shown in Table III, administration of the MN extract significantly reduced blood glucose levels in all groups. The HFD+MN group obtained an average of 139.3±3.38 mg/dl of blood glucose against 362.3±31.56 mg/dl of the HFD group with reduction of 61.56% when compared to the HFD group, this difference being statistically significant (p<0.05).
Effects of mulberry leaf extract on serum biochemical parameters. Standard diet (SD, n=7), Hight fat diet (HFD, n= 8), (SD+MN, n=8) and (HFD+MN, n=8). Date are represented as mean ±SEM. *significant change at p < 0.05 in comparison with HFD group; # significant change at p < 0.05 in comparison with SD group, as determined by unpaired t test.
The SD+MN group also showed a reduction in this parameter, presented values of 121.4±13.44 mg/dl compared to 162.8±21.27 mg/dl in the SD group, although this difference represents a 25 % reduction in glycemic levels, that difference was not statistically significant. Based on the data obtained, we inferred that the extract has a hypoglycemic effect.
The evaluation of the lipid profile (Table III) showed that the HFD+MN group had not statistically significant values of total cholesterol, triglycerides, HDL-c, VLDL-c, non-HDL-c and LDL-c when compared to the HFD group. In relation to animals fed a standard diet, the SD+MN group presented statistically significant high values of total cholesterol, LDL-c and non-HDL-c (p<0.05) when compared to the SD group. The SD+MN group presented mean values of total cholesterol, LDL-c and not HDL-c, of 172.0±4.46, 83.23±2.06 and 108.0±1.52 mg/dl, respectively, against 122.8±5.52, 30.24±8.66 and 53.29±9.93 mg/dl from the SD group, statistically significant difference (p<0.05).
Regarding the triglycerides, although the SD+MN group showed reduced triglyceride values of 124.0±17.27 mg/dl compared to 181.0±35.44 mg/dl in the SD group, representing a reduction of 31%, this difference was not considered statistically significant.
DISCUSSION
Treatment with M. nigra extract in mice on a hypercaloric diet led to increased water consumption, reductions in total body weight, adipose tissue, and gastrocnemius muscle mass, along with lower blood glucose levels and improved lipid profiles.
Water intake is regulated by the thirst mechanism, which, in conjunction with the osmoreceptor ADH hormone (anti-diuretic hormone) mechanism, maintains the control of osmolarity and sodium concentration of the extracellular volume. Thus, factors that stimulate the secretion of ADH hormones synthesized in the supraoptic nucleus of the hypothalamus and released by the pituitary gland also stimulate thirst. This, in turn, leads to increased water intake (Mckinley et al. 2004, Inenaga et al. 2017). Another important area for this control is the anteroventral region of the third ventricle, called the AV3V region. This leads to deficits in ADH secretory control and the control of thirst, hunger, and blood pressure (Augustine et al. 2018, Gizowski & Bourque 2018). Studies indicate that one day of exposure to a hyperlipidemic diet causes systemic and hypothalamic inflammation, with consequent deregulation in the mechanisms of hunger and thirst, and consequently, their intake (Millington 2007, Gao et al. 2017). Thus, we can infer that M. nigra extract possibly exerts a protective action against injuries to the hypothalamus, with consequent effects on the headquarters’ mechanism. This effect is probably attributed to phenolic compounds. Especially the quercetin present in that species is able to promote lipophagy by reducing the level of perillipine 2 (PLIN 2) and increasing AMPK’s activity (Zeng et al. 2019). The M. nigra extract used in this study was characterized using HPLC (Sampaio et al. 2018), and some important flavonoids (rutin and isoquercetin) were identified, corroborating this hypothesis. However, these data were not made available here. In any case, it is necessary a more complete characterization by HPLC or LC-MS the leaf extract of M. nigra, to determine the metabolites with possible activity against diabetes and obesity.
Two other factors may have influenced this outcome: the levels of glucose and sodium in the feed and leaves of M. nigra (Table I). Elevated sodium and high concentrations of blood glucose levels increase plasma osmolarity as detected by osmoreceptors in the hypothalamus, thereby activating the thirst mechanism (Popkin et al. 2010). In this study, M. nigra leaves presented interesting nutritional values, revealing an abundance of macro and micronutrients, with an emphasis on N, P, Ca, Fe, Na, and B. The latter influences the activity of many metabolic enzymes and the metabolism of nutrients such as calcium, magnesium, and vitamin D (Shireen et al. 2018). Although, sodium is an essential element, only small quantities are needed. High intake of this mineral is often related to increased blood pressure, the development of cardiovascular disease, and renal complications. The Fe and Na values observed in this study were higher than those reported by Sánchez-Salcedo et al. (2017), who documented iron levels of 119.3 mg/kg and sodium levels of 0.01 mg/100 g. Thus, sodium may initially have potentiated water intake in the HFD-MN treatment (Figure 1) and the phenolic compounds may have exerted a protective effect on the hypothalamus, which was not observed in the HFD group. However, further studies are needed to understand the protective role of these compounds.
Although no significant changes were observed in average of the total food consumption for HFD group, M. nigra extract reduced body weight gain in mice subjected to hypercaloric diets, as evidenced by decreased feed efficiency and caloric efficiency (Figure 4). These results suggest that M. nigra extract may limit the intestinal absorption of carbohydrates and lipids, thereby contributing to the observed reduction in body weight. Specifically, the reduction in body weight was associated with lower values of fat tissue and gastrocnemius muscle, as well as a lower adiposity index (Figure 6). It is known that a reduction in body mass involves the loss of proteins and fats in certain amounts. Such losses are usually associated with muscle protein metabolism and mobilization of reserve lipids under hypoglycemic conditions (Kim et al. 2010). Recent studies have suggested that polyphenols derived from different Morus species, including Morus alba and Morus nigra, may modulate the gene expression of key adipokines such as leptin, resistin, and adiponectin (Metwally et al. 2019, Fan et al. 2020). Furthermore, phytochemicals, such as quercetin, caffeic acid, hydroxiflavin, and hesperetin, inhibit the differentiation of pre-adipocytes (Chang et al. 2016).
In the gastrocnemius muscle, prolonged fasting resulted in reduced muscle mass (Mendonça et al. 2020, Laurens et al. 2021). During prolonged fasting, hunger, or malnutrition, there is loss of fat and muscle mass. Fats are mobilized to support the body’s energy requirements and gluconeogenesis. Muscle proteins are degraded into amino acids that serve as substrates for gluconeogenesis, which is the primary source of blood glucose during fasting and starvation. This catabolic process is accompanied by increased urinary nitrogen excretion, mainly in the form of urea (Dimitriadis et al. 2021).
Therefore, the polyphenols present in M. nigra extract may have contributed to reducing body weight in mice by stimulating the mobilization of reserve lipids in adipocytes and the breakdown of muscle proteins for glucose production. This premise is reinforced by the higher water consumption observed in the group treated with M. nigra extract (Figure 1). The oxidation of amino acids derived from diet or body proteins can result in the formation of ammonia, which is toxic to animals. It is then converted to urea by the liver and excreted in urine by the kidneys (Weiner & Verlander 2013). However, not all urea is excreted in the urine because of resorption in the renal tubules (Rondon-Berrios & Berl 2019). Diuresis reduces tubular resorption of urea and increases its excretion. However, dehydration had the opposite effect. Thus, the amount of fluid and urinary flow influences the excretion of urea and blood urea nitrogen, increasing and decreasing, respectively. Therefore, accelerated water consumption is associated with the catabolism of proteins and lipids and the presence of sodium in the leaves of M. nigra. In addition, the liver and kidneys are important organs for the catabolism of glycogenic amino acids and urea excretion, respectively. Loss of muscle mass can be considered a negative effect of the extract used, especially for the treatment of important metabolic disorders such as obesity and diabetes. The extent or attenuation of this negative effect can be better observed with future experiments testing different doses of the extract.
Strengthening the hypothesis set out above, the use of a hypercaloric diet only (HFD) reduced the weight of the kidneys compared with the other treatments (Table III). This possibly resulted in kidney damage from oxidative stress (Rosas-Villegas et al. 2017). Dyslipidemia and hyperinsulinemia are usually accompanied by obesity and affect kidney structure, contributing to vasodilation, hypertension, and kidney injury (Koppe et al. 2014, Yoon et al. 2024). Obesity promotes an inflammatory state and intestinal dysbiosis, increasing the production of lipopolysaccharide (LPS), which in turn activates the transcription factor NF-κB (nuclear factor-κB), that mediates the induction of pro-inflammatory cytokine, such tumor necrosis factor-α (TNF-α), interleukin -1β (IL-1β) and interleukin -6 (IL-6). The production of these cytokines produces a redox imbalance and an increase in reactive oxygen species (ROS). This establishes a continuous cycle of inflammation and oxidative stress (Small et al. 2012, Pedruzzi et al. 2012, Han 2016, Rosas-Villegas et al. 2017), compromising insulin signalling, and affecting kidney function.
The kidneys play an important role in glucose homeostasis and urea excretion. Together with the liver, it responds to a common neurohormonal control system by mobilizing and storing nutrients in the body to maintain normal blood glucose levels. The kidney contributes to 15-20% of total glucose production, while the liver is largely responsible for the rest (Wilding 2014, Gerich 2000, Rosen & Spiegelman 2014). The kidneys and liver also play important role in the post-absorption state. They released approximately equal amounts of glucose via gluconeogenesis (Kaneko et al. 2018, Wilding 2014, Kaneko 2008). Thus, a hypercaloric diet may cause possible kidney damage and reduce metabolic activity. In addition, it can be said that the extract of M. nigra had a possible protective effect on the liver and kidneys, stimulating the correct action in the excretion of urea and restoring glucose to basal levels.
The hepatic and renal protective effects against oxidative stress may be related to the anti-inflammatory and antioxidant activities attributed to the presence of flavonoids, mainly quercetin-3- O-glucoside present in M. nigra (Yoon et al. 2024, Tang et al. 2023). Studies have indicated that a high-fat diet (HFD) in mice cause systemic metabolic abnormalities and subsequent kidney damage (Deji et al. 2009, Carmo et al. 2009, Gelber et al. 2005). A similar result was found by Deji et al. (2009), in which a high-fat diet in mice caused systemic changes such as obesity, hyperglycemia, and kidney damage. Although studies in humans and animals have demonstrated the relationship between obesity and kidney damage, the underlying mechanisms have not yet been fully elucidated (Fox 2004, Hsu et al. 2006, Carmo et al. 2009). Studies have shown that the active components of blackberry leaves modulate blood glucose and lipid levels, reducing damage to the liver and kidneys by inhibiting the expression of spinal tissue growth factors (CTGF) and related genes (Zhang et al. 2019). On the other hand, some studies have also shown that the weight change of organs such as the kidney may be associated with stress or an adaptive effect (Nwogueze et al. 2023, Oh et al. 2025). In this sense, the M. nigra extract may have triggered a toxic effect and caused kidney damage (Manu et al. 2022). However, these discussions about protective effects, toxic effect, and other mechanisms mentioned are merely hypothetical, requiring more data and additional experiments to prove such reports.
The hypoglycemic effect of the extract (Table III) has been confirmed in other studies (Zhang et al. 2019, He et al. 2019, Hago et al. 2021, Tang et al. 2023). The extract is proposed to exert its effects by inhibiting the absorption of dietary carbohydrates and lipids, thereby reducing the availability of simple sugars. This mechanism may decrease caloric utilization efficiency, ultimately favoring weight reduction and contributing to improved glycemic control (Tang et al. 2023, Jan et al. 2022, Júnior et al. 2017). The low blood glucose levels probably activated the breakdown of muscle proteins and the catabolism of glycogenic amino acids to generate glucose, thereby restoring basal levels. They also stimulated the mobilization of reserve lipids in adipocytes for ATP production through β-oxidation of fatty acids. This premise is supported by the low weights of the gastrocnemius muscle and adipose tissue in this study. Thus, activation of the catabolic routes may have been a direct effect of low carbohydrate and lipid absorption in the intestine, influenced by the active principles present in the M. nigra extract.
In fact, the presence of bioactive compounds in plant extract, such as: flavonoids, alkaloids, terpenoids, anthocyanins, glycosides, phenolic compounds among others (Chen et al. 2023, Abudurexiti et al. 2023), reduces carbohydrate uptake and consequently hyperglycemia by inhibiting α-glucosidase (Júnior et al. 2017, James et al. 2024, Tang et al. 2023). In addition, phenolic compounds such as flavonoids and terpenoids, which are abundant in M. nigra extract, may be related to reduced carbohydrate absorption in the intestine and the mobilization of reserve lipids (Volpato et al. 2011, He et al. 2019). However, other regulatory functions of the active principles in reducing body weight and blood glucose are not disregarded, such as attenuation of insulin resistance by modulating the expression of genes and proteins involved in glucose homeostasis in liver cells (Liu et al. 2018, Rodrigues et al. 2019, Zhang et al. 2019).
Slightly elevated concentrations of total cholesterol, LDL and non-HDL in the blood of SD+MN group, as well as no changes in other biochemical parameters of lipids in both groups (Table III), showed that the use of M. nigra extract can alter lipid metabolism, which may be important for understanding its role in the treatment or prevention atherosclerosis and other obesity-related diseases. Divergent results were reported by Jiao et al. (2017), who observed reductions in high-density lipoprotein (HDL), total cholesterol, and triglyceride levels. However, most research has focused on the fruit of this species. Some studies have shown that mice tend to have high cholesterol levels, whereas triglyceride levels and the main cholesterol esters remain unchanged (Eisinger et al. 2014, Roza et al. 2016).
According to the data obtained in this study, it is possible to validate an overweight induction model using a hypercaloric diet in Swiss mice for 12 weeks, efficiently studying the pathophysiology of overweight/obesity and associated complications, as it is the closest model to the genesis of obesity in humans. It can also be said that the extract had a positive effect on glycemic and weight control, especially in the first 4 weeks. However, this effect is limited by the continued long-term use of a high-fat, glucose diet in the long term.
In addition, the data possibly suggests that the extract exerted a protective effect on renal and hepatic function, as well as a positive effect on body fat reduction, as evidenced by the % weight gain, fat pads, and adiposity index. In general, the extract influences the absorption of carbohydrates and lipids, resulting in several changes in cell metabolism. However, further studies are needed to elucidate the possible mechanisms of action of extract of M. nigra in the metabolism of lipids and carbohydrates. Furthermore, another important limitation of this study was the use of only one dose (246 mg/kg). Therefore, future studies should propose different doses and biochemical mechanisms of the reported benefits.
CONCLUSIONS
The findings of this study demonstrate that Morus nigra leaf extract exhibits promising biological activity against obesity, particularly under hypercaloric dietary conditions. The extract significantly increased water intake in animals fed a high-fat diet and affect food or caloric intake across groups. Furthermore, significant reduction in total weight gain and reduced food and caloric efficiency were observed, especially in the HFD+MN group, indicating metabolic modulation.
Moreover, M. nigra extract significantly reduced adipose tissue accumulation, adiposity index, and gastrocnemius muscle mass in animals fed a hypercaloric diet, suggesting a favorable influence on body composition. Biochemically, the extract induced a substantial hypoglycemic effect in both diet models and altered some lipid parameters.
Collectively, these results suggest that Morus nigra extract has potential as an alternative therapy for obesity-related metabolic disorders, primarily by improving glucose regulation and reducing fat mass. However, further studies are required to clarify the mechanisms of action and determine its long-term safety and efficacy in clinical settings. Finally, it is also important to highlight that this study has some significant limitations, such as a lack of phytochemical characterization, use of a single dose, and muscle mass loss. Future studies should address these issues.
Acknowledgements
We thank the following for their all-round support: Postgraduate Program in Biosciences (PPGB), Federal University of the São Francisco Valley (UNIVASF), Campus Centro, Av. José de Sá Maniçoba, 56304-205, Petrolina, Pernambuco, Brazil; Dr. Luciano Augusto de Araújo Ribeiro, Associate Professor, Collegiate of Pharmaceutical Sciences (CFARM), Federal University of the São Francisco Valley (UNIVASF), Campus Centro, Av. José de Sá Maniçoba, 56.304-205, Petrolina, Pernambuco, Brazil. This study was financed in part by Coordenação de Aperfeiçoamento de Pessoal de Nível Superior (CAPES) (Finance code 001). The authors declare no conflict of interest.
References
- ABUDUREXITI A, ZHANG R, ZHONG Y, TAN H, YAN J, BAKE S & MA X. 2023. Identification of α-glucosidase inhibitors from Mulberry using UF-UPLC-QTOF-MS/MS and molecular docking. J Funct Foods 101: 105362.
- ALLUM F & GRUNDBERG E. 2020. Capturing functional epigenomes for insight into metabolic diseases. Mol Metab 38: 100936.
- ALMEIDA AA, FAVA D & NAVARRO F. 2007. Interação da ingestão diária de chá verde (camellia sinensis) no metabolismo celular e na célula adiposa promovendo emagrecimento. RBONE - Rev Bras Obes, Nutr Emagrecimento 1: 27-37.
- AOAC INTERNATIONAL. 2012. Official Methods of Analysis of the Association of Official Analytical Chemists, 19th ed.
- ARAUJO GG, ARAÚJO MB, DANGELO RA, MANCHADO FB, MOTA CSA, RIBEIRO C & MELLO MAR. 2009. Máxima Fase estável de lactato em ratos obesos de ambos os gêneros. Rev Bras Med Esporte 15: 46-49.
- AUGUSTINE V, GOKCE SK, LEE S, WANG B, DAVIDSON TJ, REIMANN F, GRIBBLE F, DEISSEROTH K, LOIS C & OKA Y. 2018. Hierarchical neural architecture underlying thirst regulation. Nature 555: 204-209.
- AWAD NE, SEIDA AA, HAMED MA, MAHMOUD AH & ELBATANONY MM. 2012. Phytochemical and in vitro screening of some Ficus and Morus spp. for hypolipidaemic and antioxidant activities and in vivo assessment of Ficus mysorensis (Roth). Nat Prod Res 26(12): 1101-1111.
- BUENO AA, HABITANTE CA, OYAMA LM, ESTADELLA D, RIBEIRO EB & OLLER CM. 2011. White adipose tissue re-growth after partial lipectomy in high fat diet induced obese Wistar rats. J Physiol Sci 61: 55-63.
- CARMO JM, TALLAM LS, ROBERTS JV, BRANDON EL, BIGLANE J, DA SILVA AA & HALL JE. 2009. Impact of obesity on renal structure and function in the presence and absence of hypertension: evidence from melanocortin-4 receptor-deficient mice. Am J Physiol Regul Integr Comp Physiol 297: R803.
- CHANG YC, YANG MY, CHEN SC & WANG CJ. 2016. Mulberry leaf polyphenol extract improves obesity by inducing adipocyte apoptosis and inhibiting preadipocyte differentiation and hepatic lipogenesis. J Funct Foods 21: 249-262.
- CHEN Y, LIU C, YANG F, CHEN H, YANG C, FAN Z, XIAO Y & XIAO D. 2023. UPLC–QQQ–MS/MS-based widely targeted metabolomic analysis, antioxidant and α-glucosidase inhibitory activities of mulberry leaves processed by solid-state fermentation. LWT 188: 115351.
- CONDE WL & BORGES C. 2011. O risco de incidência e persistência da obesidade entre adultos Brasileiros segundo seu estado nutricional ao final da adolescência. Rev Bras Epidemiol 14: 71-79.
- DEJI N ET AL. 2009. Structural and functional changes in the kidneys of high-fat diet-induced obese mice. Am J Physiol Renal Physiol 296: F118-F126.
- DIMITRIADIS GD, MARATOU E, KOUNTOURI A, BOARD M & LAMBADIARI V. 2021. Regulation of Postabsorptive and Postprandial Glucose Metabolism by Insulin-Dependent and Insulin-Independent Mechanisms: An Integrative Approach. Nutrients 13: 1-33.
- EISINGER K, LIEBISCH G, SCHMITZ G, ASLANIDIS C, KRAUTBAUER S & BUECHLER C. 2014. Lipidomic Analysis of Serum from High Fat Diet Induced Obese Mice. Int J Mol Sci 15: 2991-3002.
- ESTADELLA D, OYAMA LM, DÂMASO AR, RIBEIRO EB & OLLER NCM. 2004. Effect of Palatable Hyperlipidic Diet on Lipid Metabolism of Sedentary and Exercised Rats. Nutrition 20: 218-224.
- FAN L, PENG Y, WU D, HU J, SHI X, YANG G & LI X. 2020. Dietary supplementation of Morus nigra L. leaves decrease fat mass partially through elevating leptin-stimulated lipolysis in pig model. J Ethnopharmacol 249: 112416.
- FITCH AK & BAYS HE. 2022. Obesity definition, diagnosis, bias, standard operating procedures (SOPs), and telehealth: An Obesity Medicine Association (OMA) Clinical Practice Statement (CPS) 2022. Obes Pillars 1: 100004.
- FOX CS. 2004. Predictors of New-Onset Kidney Disease in a Community-Based Population. JAMA 291: 844.
- FRIEDEWALD WT, LEVY RI & FREDRICKSON DS. 1972. Estimation of the Concentration of Low-Density Lipoprotein Cholesterol in Plasma, Without Use of the Preparative Ultracentrifuge. Clin Chem 18: 499-502.
- GAO Y ET AL. 2017. Lipoprotein Lipase Maintains Microglial Innate Immunity in Obesity. Cell Rep 20: 3034-3042.
- GELBER RP, KURTH T, KAUSZ AT, MANSON JE, BURING JE, LEVEY AS & GAZIANO JM. 2005. Association Between Body Mass Index and CKD in Apparently Healthy Men. Am J Kidney Dis 46: 871-880.
- GERICH JE. 2000. Physiology of glucose homeostasis. Diabetes Obes Metab 2: 345-350.
- GIZOWSKI C & BOURQUE CW. 2018. Hypothalamic neurons controlling water homeostasis: it’s about time. Curr Opin Physiol 5: 45-50.
- GULATI S & MURPHY WJ. 2025. Defining obesity in the context of cancer: thinking beyond body mass index. Trends Cancer 11: 441-447.
- HAGO S, MAHROUS EA, MOAWAD M, ABDEL-WAHAB S & ABDEL-SATTAR E. 2021. Evaluation of antidiabetic activity of Morus nigra L. and Bauhinia variegata L. leaves as Egyptian remedies used for the treatment of diabetes. Nat Prod Res 35(5): 829-835.
- HAN CY. 2016. Roles of Reactive Oxygen Species on Insulin Resistance in Adipose Tissue. Diabetes Metab J 40: 272.
- HE X, LI H, GAO R, ZHANG C, LIANG F, SHENG Y, ZHENG S, XU J, XU W & HUANG K. 2019. Mulberry leaf aqueous extract ameliorates blood glucose and enhances energy expenditure in obese C57BL/6J mice. J Funct Foods 63: 103505.
- HSU C, MCCULLOCH CE, IRIBARREN C, DARBINIAN J & GO AS. 2006. Body Mass Index and Risk for End-Stage Renal Disease. Ann Intern Med 144: 21.
- INENAGA K, ONO K, HITOMI S, KUROKI A & UJIHARA I. 2017. Thirst sensation and oral dryness following alcohol intake. Jpn Dent Sci Rev 53(3): 78-85.
- INSTITUTO ADOLFO LUTZ. 2008. Métodos físico-químicos para análise de alimentos, 4a ed.
- JAMES A, WANG K, CHEN Y & WANG Y. 2024. Functional benefits of mulberry leaf tea or extracts to alleviate metabolic diseases: Current opinion and perspectives. Food Biosci 59: 104218.
- JAN B, ZAHIRUDDIN S, BASIST P, IRFAN M, ABASS S & AHMAD S. 2022. Metabolomic Profiling and Identification of Antioxidant and Antidiabetic Compounds from Leaves of Different Varieties of Morus alba Linn Grown in Kashmir. ACS Omega 7: 24317.
- JIAO Y, WANG X, JIANG X, KONG F, WANG S & YAN C. 2017. Antidiabetic effects of Morus alba fruit polysaccharides on high-fat diet- and streptozotocin-induced type 2 diabetes in rats. J Ethnopharmacol 199: 119-127.
- JÚNIOR S ET AL. 2017. Brazilian Morus nigra Attenuated Hyperglycemia, Dyslipidemia, and Prooxidant Status in Alloxan-Induced Diabetic Rats. The Sci World J 2017: 1-10.
- KANEKO JJ. 2008. Carbohydrate Metabolism and Its Diseases. In: Clinical Biochemistry of Domestic Animals, Elsevier, p. 45-80.
- KANEKO K, SOTY M, ZITOUN C, DUCHAMPT A, SILVA M, PHILIPPE E, GAUTIER-STEIN A, RAJAS F & MITHIEUX G. 2018. The role of kidney in the inter-organ coordination of endogenous glucose production during fasting. Mol Metab 16: 203-212.
- KEITH JN. 2016. Pharmacotherapy in Treatment of Obesity. Gastroenterol Clin North Am 45: 663-672.
- KERR JA ET AL. 2025. Global, regional, and national prevalence of adult overweight and obesity, 1990-2021, with forecasts to 2050: a forecasting study for the Global Burden of Disease Study 2021. The Lancet 405: 813-838.
- KIM YS, LEE YM, KIM H, KIM J, JANG DS, KIM JH & KIM JS. 2010. Anti-obesity effect of Morus bombycis root extract: Anti-lipase activity and lipolytic effect. J Ethnopharmacol 130: 621-624.
- KOPPE L, PELLETIER CC, ALIX PM, KALBACHER E, FOUQUE D, SOULAGE CO & GUEBRE-EGZIABHER F. 2014. Insulin resistance in chronic kidney disease: new lessons from experimental models. Nephrol Dial Transplant 29: 1666-1674.
- LAURENS C ET AL. 2021. Is muscle and protein loss relevant in long-term fasting in healthy men? A prospective trial on physiological adaptations. J Cachexia Sarcopenia Muscle 12: 1690-1703.
- LIU J, TSILINGIRIS D & DALAMAGA M. 2022. The non-linear relationship between muscle mass and BMI calls into question the use of BMI as a major criterion for eligibility for bariatric surgery. Metabol Open 13: 100164.
- LIU L, JIAN J, YU S, LI S, WANG J, BU T & WU J. 2025. Rice protein-derived hypoglycemic peptides IQP,VEP and IPQ alleviated obesity-related metabolic disorders in HFD-induced C57BL/6J mice through activation of AMPK and modulation of gut microbiota and related metabolites. Food Biosci 72: 107427.
- LIU XX, ZHANG XW, WANG K, WANG XY, MA WL, CAO W, MO D, SUN Y & LI XQ. 2018. Kuwanon G attenuates atherosclerosis by upregulation of LXRα-ABCA1/ABCG1 and inhibition of NFκB activity in macrophages. Toxicol Appl Pharmacol 341: 56-63.
- MALAVOLTA E, VITTI GC & OLIVEIRA SA. 1997. Avaliação do estado nutricional de plantas: princípios e aplicações, 2a ed., Piracicaba: Patafós, 319 p.
- MALIK VS, WILLET WC & HU FB. 2020. Nearly a decade on — trends, risk factors and policy implications in global obesity. Nat Rev Endocrinol 16: 615-616.
- MANU AA, MUSA BM & BEDAN HI. 2022. Ethanolic Extract of Syzygium cumini Causes Toxic Effects on Ethanol-induced Liver and Kidney Damage in Albino Wistar Rats: A Biochemical and Histological Study. Iran J Toxicol 16: 63-72.
- MCKINLEY M, CAIRNS M, DENTON D, EGAN G, MATHAI M, USCHAKOV A, WADE J, WEISINGER R & OLDFIELD B. 2004. Physiological and pathophysiological influences on thirst. Physiol Behav 81: 795-803.
- MENDONÇA CR, COELHO SLS, NOLL M, SILVEIRA EA & ARRUDA JT. 2020. Effects of auriculotherapy on weight and body mass index reduction in patients with overweight or obesity: Systematic review and meta-analysis. Complement Ther Clin Pract 38: 101069.
- METWALLY FM, RASHAD H & MAHMOUD AA. 2019. Morus alba L. Diminishes visceral adiposity, insulin resistance, behavioral alterations via regulation of gene expression of leptin, resistin and adiponectin in rats fed a high-cholesterol diet. Physiol Behav 201: 1-11.
- MILLINGTON GWM. 2007. The role of proopiomelanocortin (POMC) neurones in feeding behaviour. Nutr Metab 4: 18.
- MUSCOGIURI G, VERDE L & COLAO A. 2023. Body Mass Index (BMI): Still be used? Eur J Intern Med 117: 50-51.
- NAIR A & JACOB S. 2016. A simple practice guide for dose conversion between animals and human. J Basic Clin Pharm 7: 27.
- NERY CS, PINHEIRO IL, MUNIZ GS, VASCONCELOS DAA, FRANÇA SP & NASCIMENTO E. 2011. Medidas murinométricas e eficiência alimentar em ratos provenientes de ninhadas reduzidas na lactação e submetidos ou não ao exercício de natação. Rev Bras Med Esporte 17: 49-55.
- NWOGUEZE BC, OFILI IM, NNAMA TN & ALOAMAKA CP. 2023. Oxidative stress-induced by different stressors alters kidney tissue antioxidant markers and levels of creatinine and urea: the fate of renal membrane integrity. Sci Rep 13: 19.
- OH SH ET AL. 2025. High-fat diet promotes lipotoxicity in the podocytes of uninephrectomized mice: a targeted lipidomics and kidney podocyte-specific analysis. Cell Death Discov 11: 1-13.
- OLIVEIRA ACB, OLIVEIRA AP, GUIMARÃES AL, OLIVEIRA RA, SILVA FS, REIS SAGB, RIBEIRO LAA & ALMEIDA JRGS. 2013. Avaliação toxicológica pré-clínica do chá das folhas de Morus nigra L. (Moraceae). Rev Bras Plantas Med 15(2): 244-249.
- PEDRUZZI LM, STOCKLER PMB, LEITE M & MAFRA D. 2012. Nrf2–keap1 system versus NF-κB: The good and the evil in chronic kidney disease? Biochimie 94: 2461-2466.
- PICKETT-BLAKELY O & NEWBERRY C. 2016. Future Therapies in Obesity. Gastroenterol Clin North Am 45: 705-714.
- POPKIN BM, D’ANCI KE & ROSENBERG IH. 2010. Water, hydration, and health. Nutr Rev 68: 439-458.
- REAGAN-SHAW S, NIHAL M & AHMAD N. 2008. Dose translation from animal to human studies revisited. FASEB J 22: 659-661.
- RIOS-OLAIS FA, GIL LF, MORA-CAÑAS A, ZALAPA-SOTO J, ROSALES-SOTOMAYOR G, GABUTTI-THOMAS A & DEMICHELIS-GOMEZ R. 2025. The prognostic impact of body composition assessed by computed tomography in adult patients with newly diagnosed acute lymphoblastic leukemia. Clin Nutr ESPEN 66: 539-546.
- RITZE Y, HENGELHAUPT C, BÁRDOS G, ERNST B, THURNHEER M, D’HAESE JG, BISCHOFF SC & SCHULTES B. 2015. Altered intestinal neuroendocrine gene expression in humans with obesity. Obesity 23: 2278-2285.
- RODRIGUES E, MARCELINO G, SILVA G, FIGUEIREDO P, GARCEZ W, CORSINO J, GUIMARÃES R & FREITAS K. 2019. Nutraceutical and Medicinal Potential of the Morus Species in Metabolic Dysfunctions. Int J Mol Sci 20(2): 301.
- RONDON-BERRIOS H & BERL T. 2019. Physiology and Pathophysiology of Water Homeostasis. In: Frontiers of Hormone Research, p. 8-23.
- ROSAS-VILLEGAS A, SÁNCHEZ-TAPIA M, AVILA-NAVA A, RAMÍREZ V, TOVAR A & TORRES N. 2017. Differential Effect of Sucrose and Fructose in Combination with a High Fat Diet on Intestinal Microbiota and Kidney Oxidative Stress. Nutrients 9: 393.
- ROSEN ED & SPIEGELMAN BM. 2014. What We Talk About When We Talk About Fat. Cell 156: 20-44.
- ROZA NAV, POSSIGNOLO LF, PALANCH AC & GONTIJO JAR. 2016. Effect of long-term high-fat diet intake on peripheral insulin sensibility, blood pressure, and renal function in female rats. Food Nutr Res 60: 28536.
- SAMPAIO PA, GRASIELLY RS, PEDRO GSS, NATHÁLIA ACS, JOSÉ MTAF, PEDRO JRN, JACKSON RGSA & LARISSA AR. 2018. Development and validation of a high performance liquid chromatography-diode array detection (HPLC-DAD) method for the quantification of rutin and isoquercetin in Morus nigra L. (Moraceae). Afr J Biotechnol 17: 1048-1056.
- SÁNCHEZ-SALCEDO EM, AMORÓS A, HERNÁNDEZ F & MARTÍNEZ JJ. 2017. Physicochemical Properties of White (Morus alba) and Black (Morus nigra) Mulberry Leaves, a New Food Supplement. J Food Nutr Res 5: 253-261.
- SANTOS B, ESTADELLA D, HACHUL ACL, OKUDA MH, MORENO MF, OYAMA LM, RIBEIRO EB & OLLER NASCIMENTO CMP. 2013. Effects of a Diet Enriched with Polyunsaturated, Saturated, or Trans Fatty Acids on Cytokine Content in the Liver, White Adipose Tissue, and Skeletal Muscle of Adult Mice. Mediat Inflamm 2013: 1-10.
- SHIREEN F, NAWAZ MA, CHEN C, ZHANG Q, ZHENG Z, SOHAIL H, SUN J, CAO H, HUANG Y & BIE Z. 2018. Boron: Functions and Approaches to Enhance Its Availability in Plants for Sustainable Agriculture. Int J Mol Sci 19: 1856.
- SIZOO D, STAM SP, DE HEIDE LJM, EMOUS M, VAN ZUTPHEN T, VAN DIJK PR & VAN BEEK AP. 2023. The association of low muscle mass with prevalence and incidence of type 2 diabetes in different BMI classes. Diabetes Res Clin Pract 195: 110197.
- SMALL DM, COOMBES JS, BENNETT N, JOHNSON DW & GOBE GC. 2012. Oxidative stress, anti-oxidant therapies and chronic kidney disease. Nephrology 17: 311-321.
- SOUZA GR, SILVA JC, OLIVEIRA JÚNIOR RG, LIMA-SARAIVA SRG, GUIMARÃES AL, DE OLIVEIRA AP & DA SILVA ALMEIDA JRG. 2015. Atividade antinociceptiva do extrato etanólico das folhas de Morus nigra L. (Moraceae). Rev Cienc Farm Basica Apl 36: 137-142.
- SWINBURN BA ET AL. 2019. The Global Syndemic of Obesity, Undernutrition, and Climate Change: The Lancet Commission report. The Lancet 393: 791-846.
- TANG C, BAO T, ZHANG Q, QI H, HUANG Y, ZHANG B, ZHAO L & TONG X. 2023. Clinical potential and mechanistic insights of mulberry (Morus alba L.) leaves in managing type 2 diabetes mellitus: Focusing on gut microbiota, inflammation, and metabolism. J Ethnopharmacol 306: 116143.
- TIRTHANI E, SAID MS & REHMAN A. 2023. Genetics and Obesity. StatPearls.
- VOLPATO GT, CALDERON IMP, SINZATO S, CAMPOS KE, RUDGE MVC & DAMASCENO DC. 2011. Effect of Morus nigra aqueous extract treatment on the maternal-fetal outcome, oxidative stress status and lipid profile of streptozotocin-induced diabetic rats. J Ethnopharmacol 138(3): 691-696.
- VUKMIROVIĆ S, ILIĆ V, TADIĆ V, ČAPO I, PAVLOVIĆ N, TOMAS A, PAUT KUSTURICA M, TOMIĆ N, MAKSIMOVIĆ S & STILINOVIĆ N. 2023. Comprehensive Analysis of Antioxidant and Hepatoprotective Properties of Morus nigra L. Antioxidants 12: 382.
- WEINER ID & VERLANDER JW. 2013. Renal ammonia metabolism and transport. Compr Physiol 3: 201-220.
- WHITE PAS ET AL. 2013. Modelo de obesidade induzida por dieta hiperlipídica e associada à resistência à ação da insulina e intolerância à glicose. Arq Bras Endocrinol Metab 57: 339-345.
-
WHO - WORLD HEALTH ORGANIZATION. 2025. Obesidade e sobrepeso. Available at: https://www.who.int/
» https://www.who.int/ - WILDING JPH. 2014. The role of the kidneys in glucose homeostasis in type 2 diabetes: Clinical implications and therapeutic significance through sodium glucose co-transporter 2 inhibitors. Metabolism 63: 1228-1237.
- YAO Y ET AL. 2024. Black mulberry extract inhibits hepatic adipogenesis through AMPK/mTOR signaling pathway in T2DM mice. J Ethnopharmacol 319: 117216.
- YOON J, HAN T, HEO SJ & KWON YJ. 2024. Comprehensive assessment of the combined impact of dyslipidemia and inflammation on chronic kidney disease development: A prospective cohort study. J Clin Lipidol 18: e251-e260.
- ZAMBON L, DUARTE FO, FREITAS LF, SCARMAGNANI FRR, DÂMASO A, DUARTE ACGO & SENE-FIORESE M. 2009. Efeitos de dois tipos de treinamento de natação sobre a adiposidade e o perfil lipídico de ratos obesos exógenos. Rev Nutr 22(5): 707-715.
- ZENG H, GUO X, ZHOU F, XIAO L, LIU J, JIANG C, XING M & YAO P. 2019. Quercetin alleviates ethanol-induced liver steatosis associated with improvement of lipophagy. Food Chem Toxicol 125: 21-28.
- ZHANG L, SU S, ZHU Y, GUO J, GUO S, QIAN D, OUYANG Z & DUAN J. 2019. Mulberry leaf active components alleviate type 2 diabetes and its liver and kidney injury in db/db mice through insulin receptor and TGF-β/Smads signaling pathway. Biomed Pharmacother 112: 108675.
Edited by
-
Handling editor
Cecilia Skoug
The datasets generated and/or analyzed during the current study are available from the corresponding author upon reasonable request.