 Non-destructive characterization of atmospheric particulate matter using SEM-EDS: Elemental mapping as a tool for chemical composition assessment
Abstract
The scanning electron microscopy (SEM) technique, coupled with energy dispersive X-ray spectrometry (EDS), is a key tool for characterizing particulate matter (PM), offering advantages such as in natura and non-destructive sample analysis. Published studies typically present SEM images alongside the elemental spectrum from EDS. Less commonly explored in the literature, the EDS elemental maps, performed with successive scans at appropriate resolution, can identify substances even when SEM analysis is compromised. In this present study performed PM analyses via SEM-EDS on samples collected using quartz and fiberglass filters during an environmental monitoring campaign across three regions of Rio de Janeiro, with no filter pre-treatment required. Blank filter characterization revealed that fiberglass filters contained Na, Ba, and Zn (~ 6%), while quartz filters is cleaner. The analysis enabled PM classification as organic/inorganic and natural/anthropogenic. Organic particles in the inland city included pollen and soot from biomass burning, while in the metropolitan area, clusters of small carbon spheres were linked to incomplete fuel combustion. Inorganic particles in the environmental reserve included aluminosilicates from crustal sources, while the inland city had iron-rich particles. Despite the long operation time, EDS elementary maps identified overlapping elements, enabling more accurate determination of PM’s chemical composition.
Key words
EDS elemental maps; Fiberglass filter; Particulate matter; Quartz filter; SEM-EDS
INTRODUCTION
More pronounced changes in the climate are becoming increasingly frequent around the world, with one of the main causes being atmospheric pollution, driven by industrial activities, burning of fossil fuels, urban growth, among others. Despite the influence on temperature and rainfall factors (Fuzzi et al. 2015), different types and levels of air pollution are correlated with deaths from respiratory, cardiovascular diseases, and even some types of cancer (Ortiz et al. 2017). Therefore, monitoring air quality becomes indispensable, both for a better understanding of the interrelationship between phenomena and for proposing affirmative actions that can minimize negative effects on the climate or prevent health damage.
Atmospheric pollution, composed of a complex mixture of organic and inorganic substances (WHO 2000), contributes to the formation of airborne particulate matter (PM). PM refers to a complex mixture of solid particles and liquid droplets suspended in the air, generally ranging in size up to 100 µm in aerodynamic diameter (Seinfeld & Pandis 1998). These particles can originate from natural sources such as wildfires, sea spray, and others, or from anthropogenic activities like biomass burning and vehicle emissions. They may be emitted directly into the atmosphere as primary particles or formed through reactions between primary pollutants, resulting in secondary particles (Spencer & Van Heyst 2019). PM is classified based on particle size into three categories: PM0.1, known as ultrafine or nanoparticles with diameters smaller than 0.1 µm; PM2.5, consisting of fine particles with diameters less than 2.5 µm; and PM10, which includes particles up to 10 µm (Avram et al. 2025, Sanderson et al. 2014). Typically, primary PM originates from coarse particles formed through mechanical fragmentation, while the fine fraction mainly comprises secondary particles generated via nucleation/condensation processes and chemical reactions (Seinfeld & Pandis 2006). PM serves as a crucial variable for assessing air pollution levels and is referenced as a quality parameter in various standards, including those set by the Brazilian National Environment Council (CONAMA 2024), the United States Environmental Protection Agency (US EPA 2020), the European Union Directorate-General for Environment (Directive EU 2024), among others.
PM is collected through its deposition onto filters, which can be constructed from materials such as fiberglass, quartz, or Teflon, tailored to capture particles of specific sizes defining their class (PM0.1, PM2.5, or PM10). The main classes of filters are divided into fibrous and membrane types, and the choice of filter type for use in a sampling campaign should consider factors such as mechanical, chemical, and thermal stability, particle sampling efficiency, flow pressure resistance, loading capacity, as well as cost and availability (EPA/625/R96/010a, Chapter IO-2 (US EPA 1999)). Although the membrane filter offers a flat surface, which can aid in the morphological study of particles, its cost and its capacity for collecting and retaining large quantities of PM are unfavorable aspects when compared to fibrous filters (Vicent 2007). These membranes are arranged in a high-volume air samplers (Hi-Vol), with collections scheduled at regular intervals. An alternative method for simultaneous collection of fine and coarse aerosol particles is the utilization of stacked filter units (SFU) (Artaxo et al. 1999, Hopke et al. 1997).
The formation of PM may vary depending on external factors including topography, wind direction and speed, and seasonal changes (Jaconis et al. 2017), besides being influenced by atmospheric pollution and occasional events (Gioda et al. 2021). Despite the numberless of variables, its approximate composition typically comprises carbon as the primary constituent, with water-soluble species accounting for approximately 30 % (Shen et al. 2009), traces of polycyclic aromatic hydrocarbons (PAHs), metals (Bilos et al. 2001), and biological material such as cells and pollen fragments (Al-Thani et al. 2018).
Given its complexity, characterizing PM requires the utilization of various instrumental techniques. Most analyses are conducted after chemical treatment, converting the sample into a liquid state. Elemental composition can be determined using Flame Atomic Absorption Spectrometry (FAAS) (Almeida et al. 2020), Inductively Coupled Plasma Optical Emission Spectrometry (ICP OES) (Quiterio et al. 2005, Ventura et al. 2014), and Inductively Coupled Plasma Mass Spectrometry (ICP MS) (Mateus et al. 2013). Ionic composition is assessed using Ion Chromatography (IC) (Soluri et al. 2007, Justo et al. 2020), total carbon content is measured by Total Carbon Analyzer (TOC) (Mateus & Gioda 2017), and HPA are analyzed using Gas Chromatography-Mass Spectrometry (GC-MS) (Oliveira et al. 2018). PM analysis can also be conducted on the solid sample itself. For this purpose, X-ray fluorescence (Nascimento et al. 2011, Yatkin et al. 2012), X-ray diffraction (Moazami et al. 2023), or scanning electron microscopy (SEM) coupled with energy-dispersive X-ray spectrometry (EDS) techniques are employed (Ramirez-Leal et al. 2014). Although semi-quantitative in nature, SEM-EDS analysis allows for additional elemental composition and morphological characterization, aiding in the elucidation of sample origin, and has been widely utilized in PM studies (Margiotta et al. 2015, González et al. 2016, 2017, Campos-Ramos et al. 2009, Quijano et al. 2019). The SEM/EDS technique enables the acquisition of elemental maps, which illustrate the spatial distribution of elements in a region of interest (Yuksel et al. 2022, 2025). These maps can be particularly useful in identifying and characterizing the substances present. Despite their potential, EDS elemental maps have not been explored in the context of PM monitoring, representing a gap that this study seeks to address.
The state of Rio de Janeiro makes a significant socio-economic and cultural contribution at the national level. Its coastal location plays a pivotal role in the oil and port industries, and it also harbors a substantial portion of the Atlantic Forest, one of Brazil’s primary biomes. The capital, Rio de Janeiro city, stands as one of the world’s largest metropolises, hosting international events and blending densely populated urban areas with natural landscapes (notably, the Tijuca National Park, home to one of the largest urban forests globally). Surrounding the capital, the metropolitan region encompasses 21 municipalities encircling Guanabara Bay, making it the second-largest region in Brazil. Consequently, both the state and the city of Rio de Janeiro, along with its metropolitan area, have been subjects of studies regarding exposure to atmospheric particles. In the state’s interior, research has been conducted across various scenarios, including cities influenced by industrial complexes (Gioda et al. 2004), tourism (Sella et al. 2006), high volumes of road transport (Ventura et al. 2021, Loyola et al. 2006), agriculture (Azevedo et al. 2002), and natural reserves (Quitério et al. 2006, Mateus et al. 2020). Similarly, the municipalities within the Rio de Janeiro metropolitan region have also been investigated concerning particulate matter (Paulino et al. 2010, 2014, Gioda et al. 2011, Loyola et al. 2009). In the capital city of Rio de Janeiro, studies have examined various neighborhoods with diverse occupancy profiles (Loyola et al. 2012, Godoy et al. 2009, Toledo et al. 2008, Quitério et al. 2004, Ventura et al. 2022, Gioda et al. 2016), with specific air quality monitoring conducted during major events such as the FIFA World Cup in 2014 and the Olympic Games in 2016 (Justo et al. 2020, De La Cruz et al. 2019a, Ventura et al. 2019). A recent comprehensive review encompassing the work conducted over the years in the state of Rio de Janeiro was published (Beringui et al. 2021).
In this study, our objective was to utilize the SEM-EDS technique for the elemental and morphological characterization of PM collected during an air quality monitoring campaign. Additionally, we aimed to assess the impact of factors as time, location, filter type, and particle size. The study included three distinct regions: a metropolitan urban area, an urban environment affected by agricultural fires, and a remote area within an environmental reserve. Data collection occurred between February 2022 and June 2023, spanning both dry and rainy seasons to capture climate variability’s influence. Sampling encompassed PM2.5 and PM10, employing two filter types - quartz and fiberglass.
MATERIALS AND METHODS
Area description
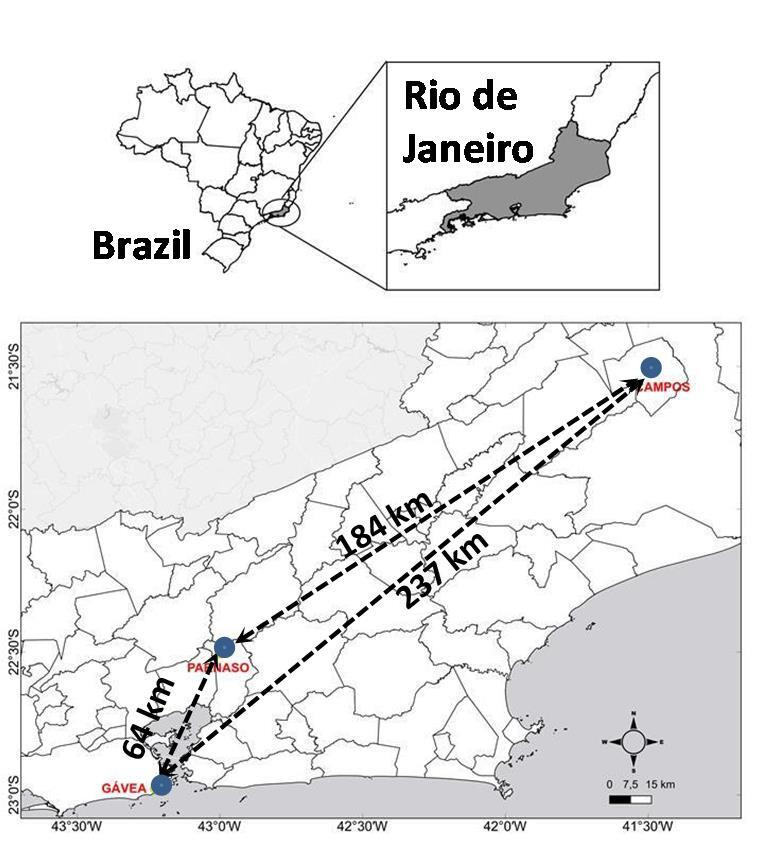
The study was conducted considering three distinct areas in the state of Rio de Janeiro: the Serra dos Órgãos National Park (PARNASO), the city of Campos dos Goytacazes, located in the north of Rio de Janeiro, and the capital Rio de Janeiro itself, specifically in the neighborhood of Gávea. Geographically, the monitoring stations are represented in Figure 1, with the distance between the sites, and their respective coordinates are as follows: Serra dos Órgãos National Park (PARNASO, 22°29’47.5’’ S and 43°00’05.2’’ W), Campos dos Goytacazes (CAMPOS, 21°45’39.1’ ‘S 41°17’31.1’’ W), and in the capital Rio de Janeiro (GÁVEA, 22°58’50” S and 43°13’58” W).
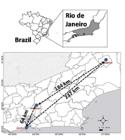
PM10 and PM2.5 monitoring stations: PARNASO (Serra dos Órgãos National Park); CAMPOS (Campos dos Goytacazes); GAVEA (Cidade do Rio de Janeiro). Distance between sites: GAVEA - PARNASO (64 km); GAVEA - CAMPOS (237 km); PARNASO – CAMPOS (184 km).The monitoring sites are the same as those presented in Silva et al. (2024), and the figure is based on and adapted from that study.
Each site presents peculiar characteristics:
PARNASO hosts the Atlantic Forest biome with a high-altitude ecosystem and is a strategic site for the preservation of endemic species and biodiversity (Meire et al. 2012). It is an environmentally protected area, located in the municipalities of Teresópolis, Petrópolis, Magé, and Guapimirim, and is influenced by the Metropolitan Region of Rio de Janeiro (MRRJ), large-scale construction projects such as the Petrochemical Complex of Rio de Janeiro (COMPERJ), and nearby highways.
The city of Campos dos Goytacazes, situated 280 km from the capital Rio de Janeiro, is the main city in the northern region of the State of Rio de Janeiro. It serves as a residential hub for workers employed in the Campos oil basin and Porto do Açu, the largest industrial port complex in Latin America. In addition to industrial activities, agriculture plays a significant role in the local economy, with sugarcane being the primary driver in this sector. However, despite legislative advancements aimed at gradually reducing the practice, burning sugarcane before harvesting remains common in the region (Ferreira et al. 2021).
Finally, in the case of the capital, the sampling location was in the Gávea neighborhood, close to the Pontifical Catholic University of Rio de Janeiro (PUC-Rio) and the Zuzu Angel road tunnel, an important connection between the west and south zones of the city. Therefore, it is a region influenced by sea breezes, fragments of the Atlantic Forest, and intense traffic.
Particulate matter sampling and mass concentration
The campaign duration extended from February 2022 to June 2023, adhering to the protocol for semi-automatic stations outlined by the State Institute of the Environment (INEA 2020). Sampling occurred periodically, aiming to encompass every day of the week, including weekends.
The PM samples were collected using high-volume air samplers (Hi-Vol 3000, Energética, São Paulo, Brazil), in accordance with Standard Brazilian methods (ABNT-NBR 13412/95), which align with US EPA methods. Sampling occurred over a 24-hour period every 6 days, maintaining an average air flow rate of 1.07 m3 min-1. At the three monitoring sites, PM₂.₅ samples were collected using fiberglass filters (Merck Millipore, Darmstadt, Germany), measuring 20 × 25 cm with a pore size of 1.6 µm. At the CAMPOS site, where sampling logistics were more favorable, a more extensive campaign was conducted. This included the additional use of quartz microfiber filters (Whatman, Fisher Scientific, Maidstone, United Kingdom), with dimensions and porosity equivalent to those of the fiberglass filters, as well as concurrent PM₁₀ sampling. The distinction between particle sizes was achieved in the field using size-selective inlets (impactors) attached to the high-volume samplers. These inlets perform aerodynamic separation of particles, allowing only those with diameters ≤2.5 µm or ≤10 µm to reach the filter, depending on the inlet used. Finally, sampling was performed accounting for both dry and rainy seasons. The filters underwent a conditioning process in a desiccator for 24 hours and underwent gravimetric analysis before and after sampling sessions using an analytical balance (Gehaka AG200 ± 0.0001, Marte Científica, Brazil) to ensure precise measurement of particulate mass. Relative humidity levels were maintained between 25 +/- 5 (%), and temperatures ranged from 23 +/- 2 (°C) during filter weighing procedures.
Elemental and morphologycal characterization of blank filters and PM
The morphological and elemental composition of airborne particles were analyzed using scanning electron microscopy – SEM (JEOL JSM-7100F, Japan) with an energy dispersive X-ray spectrometer - EDS (Oxford, USA) using Aztec software (Oxford, USA). Representative portions of the filter (approximately 0.6 cm2) containing samples were affixed to copper stubs using carbon sticky tape. Due to the characteristic deposition pattern of particulate matter on filter surfaces, typically concentrated in discrete spots rather than uniformly distributed, the regions selected for SEM-EDS analysis were chosen based on the visible presence of particles, avoiding areas devoid of material or exhibiting excessive accumulation. While not statistically randomized, these areas were selected to be representative of the general deposition pattern observed on each sample. Blank filters were also analyzed. The samples, regardless of the filter used, did not receive any pretreatment before the analysis. Although quartz and glass fiber filters have relatively low electrical conductivity, they are inorganic substrates and tend to accumulate minimal surface charge under electron beam exposure. Moreover, their porous and fibrous structures contribute to partial charge dissipation, which reduces the occurrence of charging artifacts. Consequently, the analyses were conducted without applying a conductive metal coating. Morphological and chemical parameters were assessed at various magnifications (500x, 1,000x, 2,000x, 5,000x, and 10,000x), depending on the particle size range. SEM images were captured using both secondary (SE) and back-scattered (BSE) electrons under low vacuum conditions (30 Pa). Individual EDS spectra of the particles were obtained with an acceleration voltage ranging from 1 to 15 kV and a sampling depth of 25 μm. The choice of using low accelerating voltage combined with low vacuum mode during SEM/EDS analyses aimed not only to minimize charging effects but also to preserve the integrity of the samples. Lower beam energy reduces electron penetration and localized heat generation, helping to prevent thermal damage and morphological alterations - particularly in porous or sensitive materials, such as quartz and glass fiber filters containing deposited particulate matter. Additionally, the low vacuum mode, by introducing a thin gas atmosphere into the chamber, assists in dissipating surface charges and creates a less aggressive environment for the sample, avoiding structural collapse and loss of adhered particles. Thus, the combination of these operating conditions contributed to the preservation of the samples throughout the analyses, without compromising the quality of the data obtained.
RESULTS AND DISCUSSION
Particulate matter content and filter appearance
The PM2.5 concentrations ranged between 5 and 45 µg m-3, while PM10 ranged between 8 and 41 µg m-3. CONAMA (2024) 506/2024 resolution established pollutant emission control standards for several substances, including PM2.5 and PM10. The standard incorporates a provision for the gradual restriction of values over time, ultimately converging to a single final standard, as suggested by the WHO (2021), which would be valid nationwide. The establishment of provisional intermediate values was deemed necessary due to significant differences between old standards and the final standard. However, individual state authorities were tasked with determining the transition period for these values. Within the current regulatory framework (PI-2), the concentrations identified in this study remain below the limits outlined by the standard, particularly within the context of short-term exposure (PM2.5, 24 h: 50 µg m-3 and PM10, 24 h: 100 µg m-3).
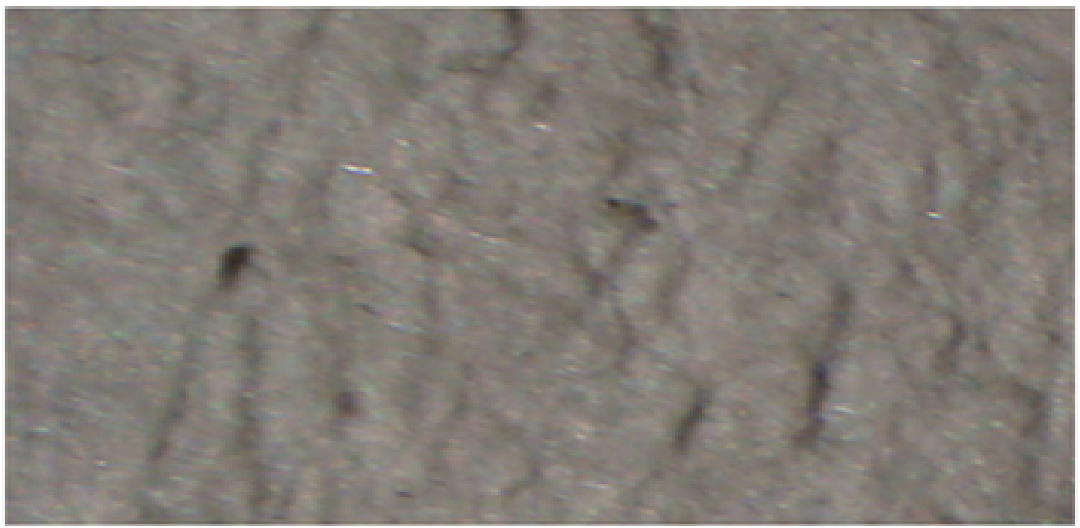
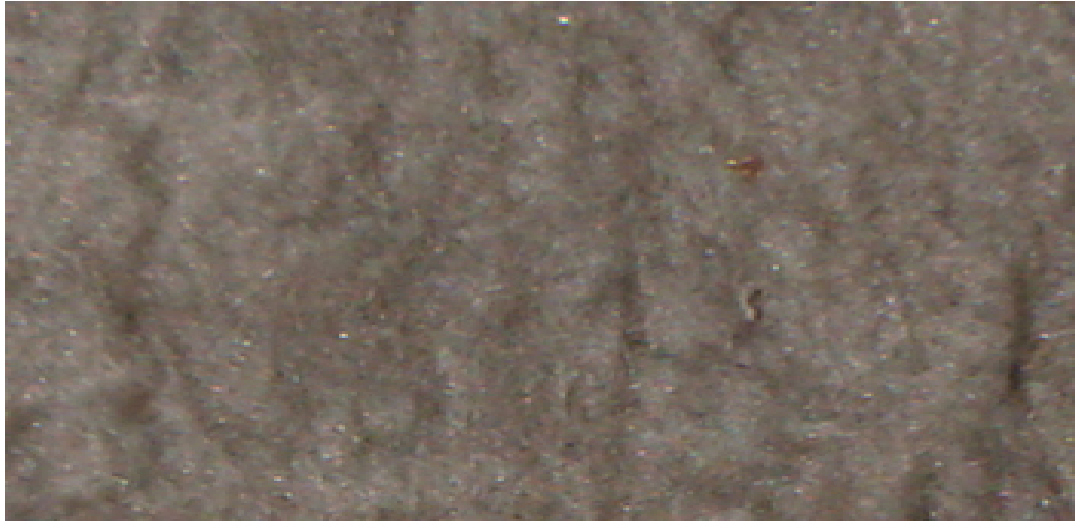
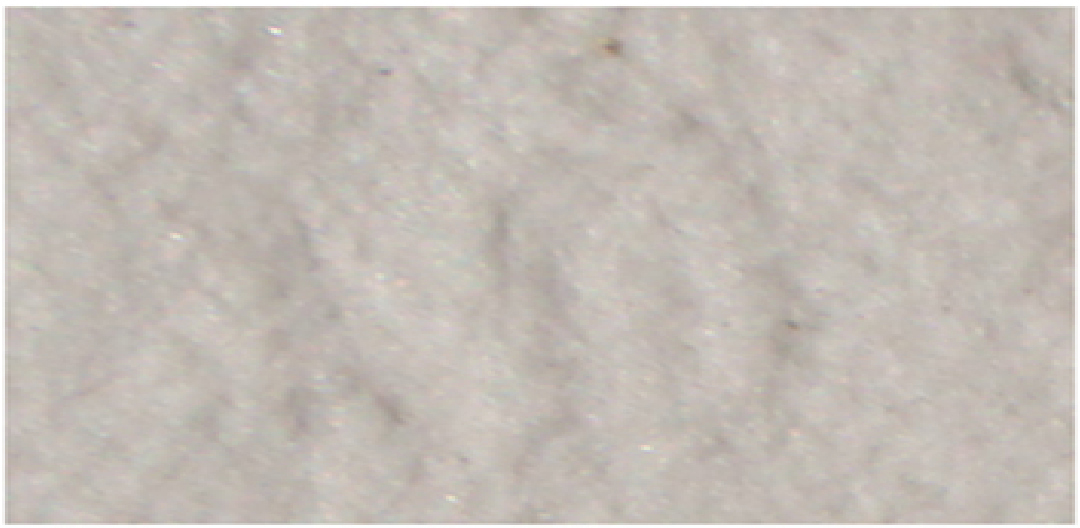
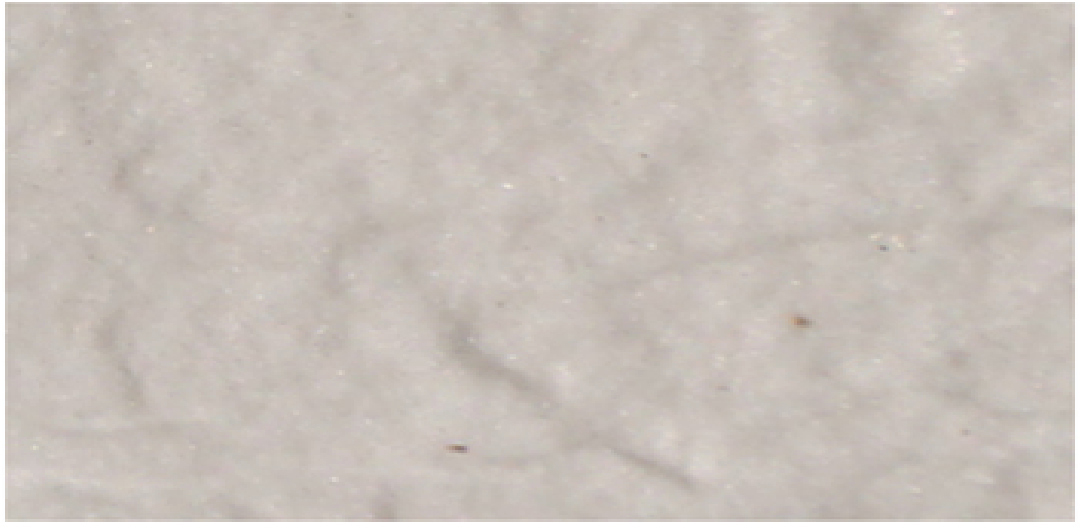
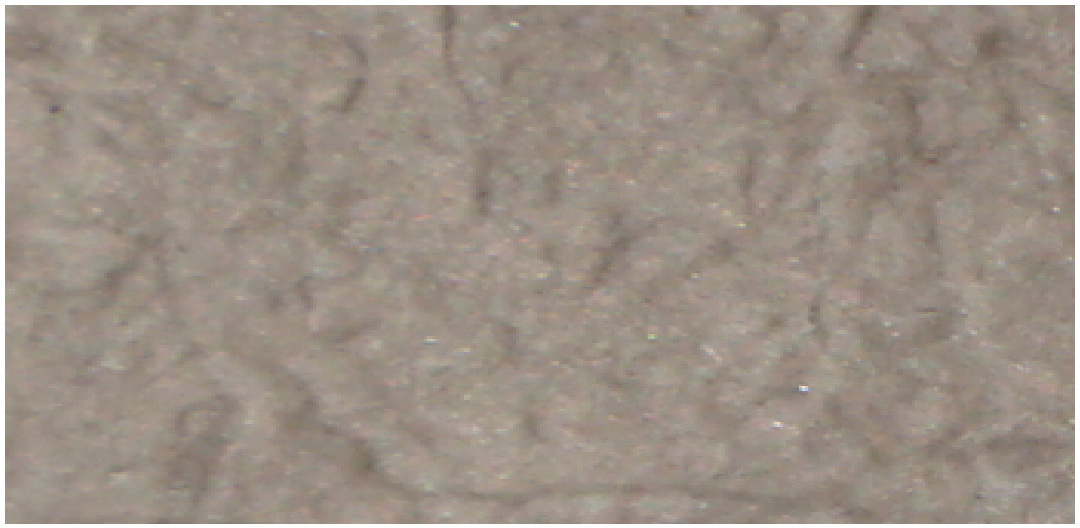
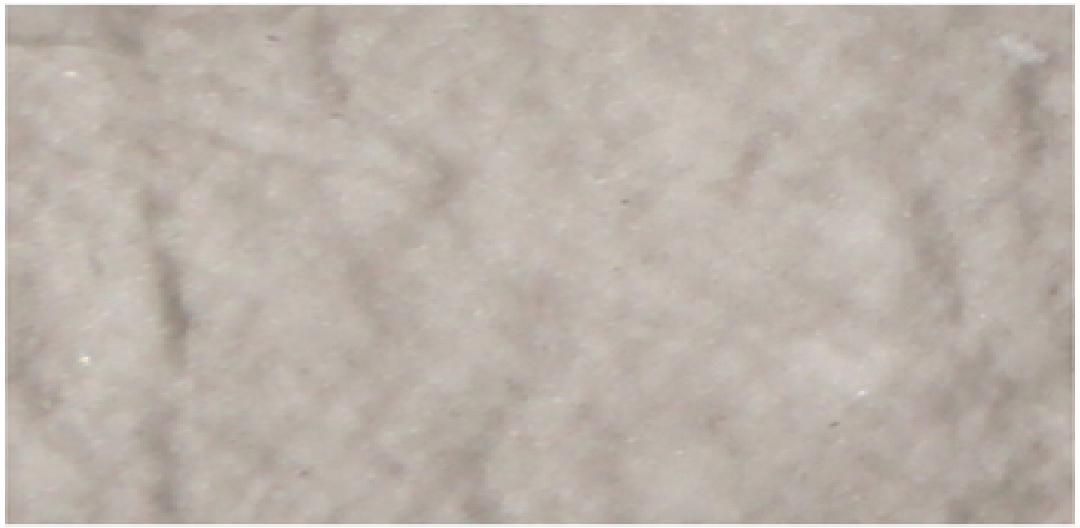
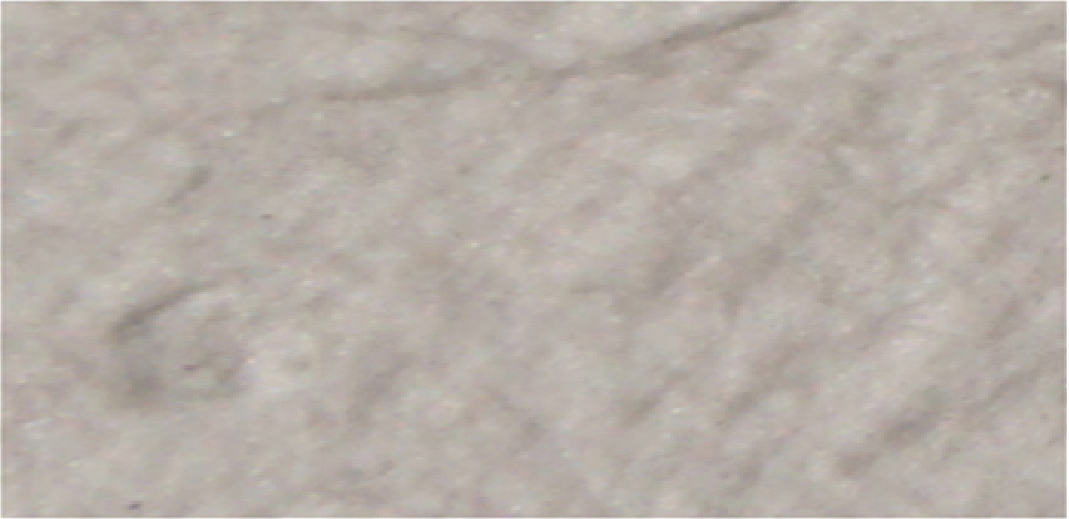
Table I showcases a comprehensive overview of filters characterized via SEM-EDS analysis, detailing the sampling location, season, filter type and size, along with the determined PM content and accompanying images. Initially, there was an expectation to link the intensity of the dark tone with the concentration of PM retained on the filter. However, this assumption was not consistently upheld throughout the study. For instance, despite Filters 001 and 003 displaying similar clear appearances, they exhibited disparate PM contents. Conversely, Filters 020 and 022, despite differing visually, demonstrated identical PM content. While the chemical composition of the deposited material undoubtedly plays a pivotal role in the visual appearance of the PM, our findings suggest that the type of filter may also contribute significantly to the observed distinctions. Filters 001 and 020 comprise fiberglass, whereas Filters 003 and 022 consist of quartz.
The PARNASO station exhibited the highest concentration of PM at 45 µg m-3. Similar findings have been documented in prior research (Loyola et al. 2012, Mateus et al. 2020). Despite its location within an environmental reserve, past studies have hinted at anthropogenic sources to the PM composition, due to the adjacency to a highway and the influence of the MRRJ.
A seasonal comparison can be conducted using samples from the Campos region, revealing a notable increase in PM concentration during the dry season. This observation aligns with findings reported in Peru by De La Cruz et al. (2019b). Additionally, research conducted by Jirau-Cólon et al. (2021) on Puerto Rico’s island demonstrated that seasons exert a more significant influence on deposited PM content than the urban or rural nature of the location.
Analysis of blank filters
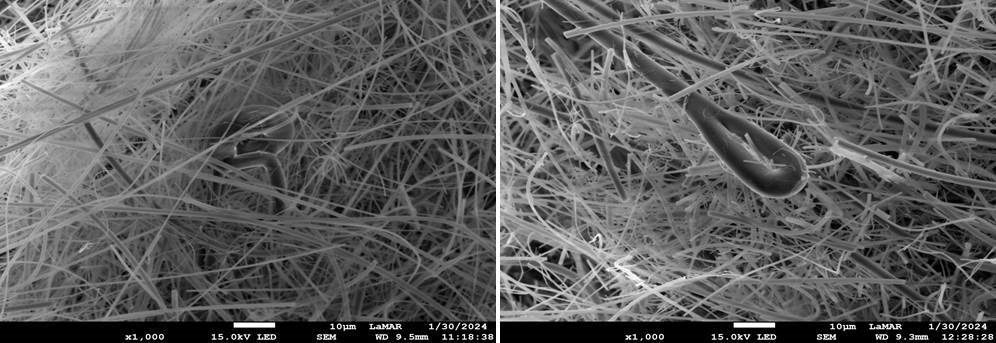
In this study, PM sampling was conducted utilizing fibrous filters made of either fiberglass or quartz. Prior to analysis, each filter type underwent a ‘clean’ examination. Figure 2 illustrates micrographs showcasing the materials’ similarity, characterized by a complex network of fibers arranged in a highly random manner.
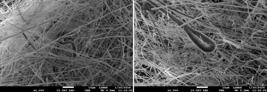
SEM images of fiberglass (left) and quartz (right) filters, highlighting the finish at the fiber end amidst the tangle of fibers composing the filter.
Despite the similarity in SEM images, elemental analysis through energy-dispersive spectroscopy (EDS) reveals a significant difference between fiberglass and quartz filters. Table II summarizes the elemental composition of each material, obtained from three regions of each filter. The purity level of the quartz filter is higher, with 97.5 % consisting of O and Si. In the case of the glass filter, these elements comprise only 71.4 % of the composition. Na is other present elements in the filters, but is present in higher amounts in the fiberglass filter. The other elements detected in the quartz filter were Ca and Mg, albeit in trace amounts (< 0.3 %). Conversely, in the fiberglass filter, there is the presence of Ba (5.8 %), Zn (5.4 %), Al, and K (both at 2.7 %). Therefore, the identification, particularly of Ba and Zn, in PM samples collected using fiberglass filters should be approached with caution.
Suárez-Peña et al. (2016) assessed the characteristics of the quartz filter and concluded that the fiber concentration, as well as the size and distribution of voids, are neither uniform nor continuous within the substrate, resulting in differential particle absorption across the cross-section. In the outer regions, particles of a wide range of sizes can be captured, whereas in the inner zones, capturing particles with diameters smaller than 1 µm is more efficient. This random profile in its structure may explain the high relative standard deviation for the minor elements Na. In particular, the results found for C may be influenced by the carbon adhesive tape, once this component can be detected through the filter’s meshes.
Elemental and morphologycal characterization of PM
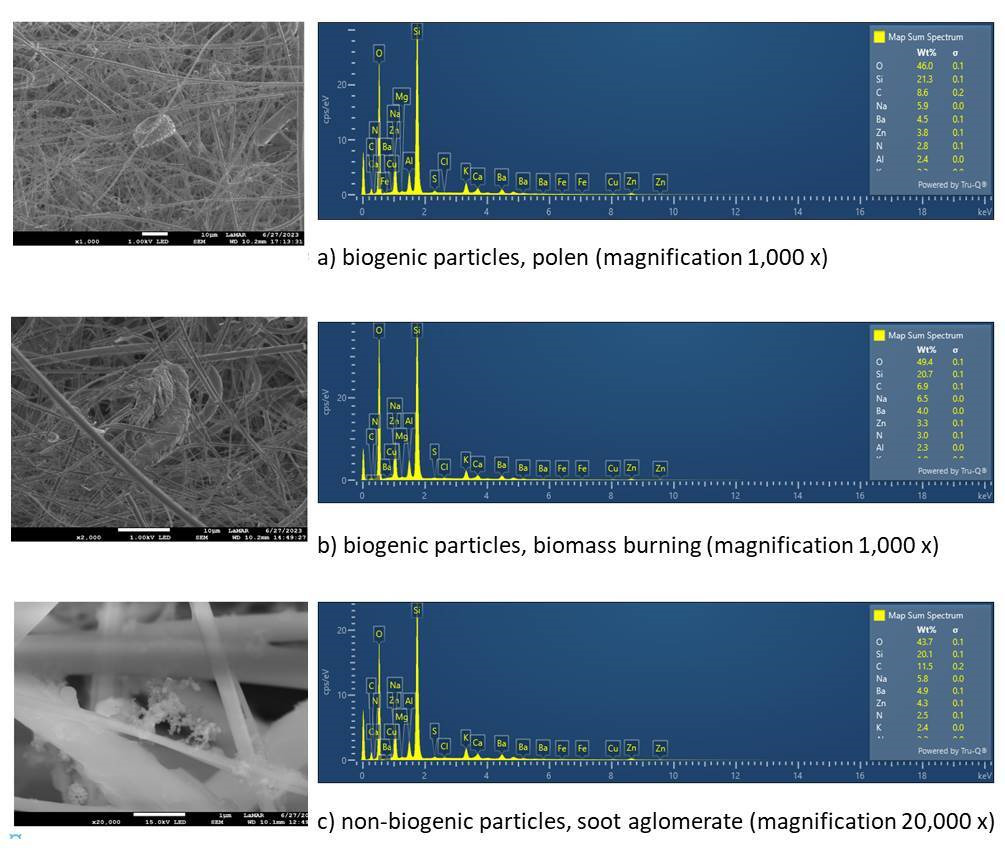
The SEM-EDS enabled the analysis of PM in its natural state, providing both morphological characterization and elemental composition. SEM images were captured using both back-scattered (BSE) and secondary (SE) electrons, allowing for the exploration of particle shape, the topographical unevenness, and size. The standard classification of PM is based on factors such as size, emission, or origin, categorizing it as coarse or fine, natural or anthropogenic, and primary or secondary (Fuzzi et al. 2015). However, according to the interest of the study, the authors also propose alternative classifications, such as grouping by morphological similarity (Quijano et al. 2019, Ramirez-Leal et al. 2014) or by the most abundant chemical element (Quijano et al. 2019, González et al. 2016), among others. Although PM is primarily composed of carbon in its various forms (Pöschl 2005), an alternative approach to subdividing particulate matter may be categorizing it into organic (Figure 3) and inorganic (Figure 4). The first category includes carbon-rich particles (C-rich particles), which can be either naturally emitted (biogenic) or anthropogenic (non-biogenic). Biogenic particles may originate from spores, microorganisms, or pollen (Fig. 3a), as well as from biomass burning (Fig. 3b) (Pósfai et al. 2003). In both cases, the samples were collected from the Campos region, an area influenced by agricultural activities, primarily sugarcane cultivation, where the practice of burning sugarcane fields is common to facilitate harvesting. In contrast, a cluster of small carbon spheres, forming a branched-chain amorphous structure with a spongy appearance (Fig. 3c), was identified at the Gávea station, located near heavy vehicle traffic. This example of non-biogenic particles may result from the incomplete combustion of fuel hydrocarbons (Hen et al. 2010).
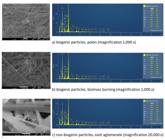
Scanning electron micrograph of C-rich particles, collected in the wet season using PM2.5: Biogenic particles, observed in the CAMPOS site – Polen (a) and biomass burning (b); Non-biogenic particles, detected in the GAVEA site – soot aglomerate (c).
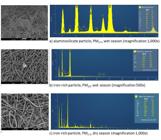
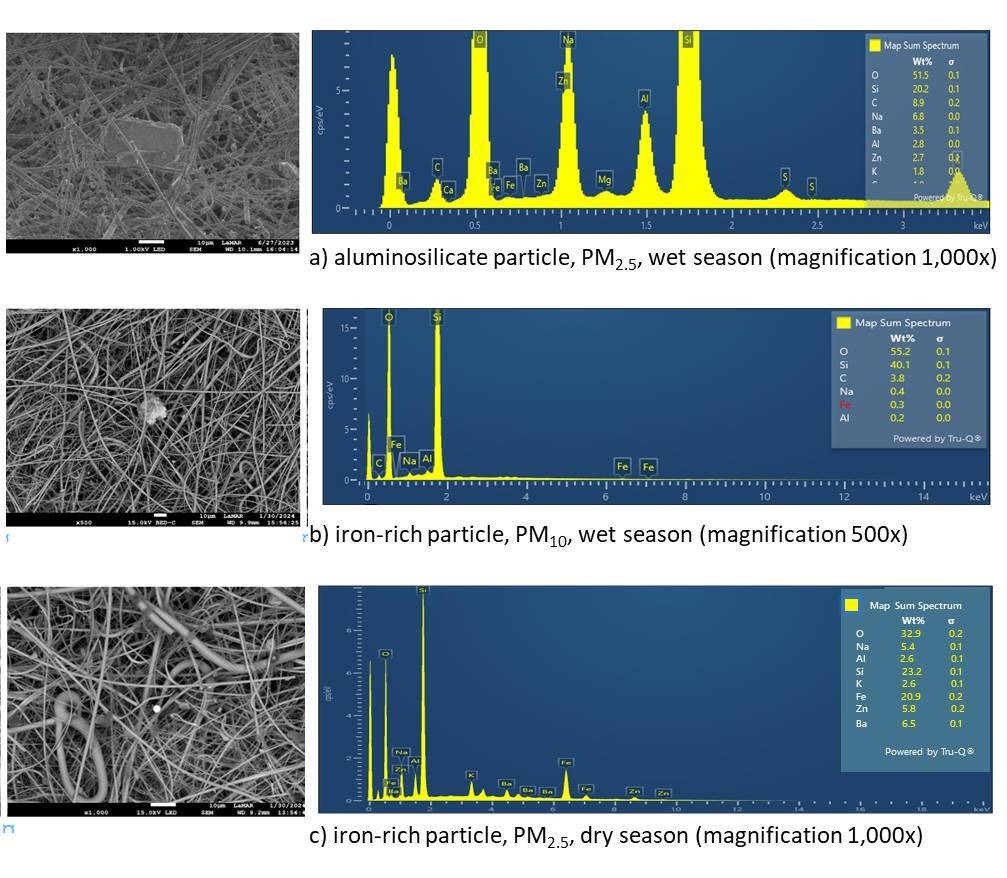
Scanning electron micrograph of inorganic particles. Natural emission, observed in the PARNASO site, during wet season, with PM2.5 - aluminosilicate particles (a) Antropogenic sources, iron-rich samples, collected in the CAMPOS site, during dry season, with PM2.5 (b), and during wet season, with PM10 (c).
Similarly, the inorganic particle category includes material from both natural and anthropogenic emissions. The primary contribution from natural emissions comes from mineral particles, while anthropogenic emissions are influenced by various industrial activities in the studied area’s vicinity. In the remote region of PARNASO Park, aluminosilicate particles with a blade-shaped morphology and faceted structure were identified (Fig. 4a). This material, rich in Si, O, and Al, was linked to natural emissions, primarily from crustal sources or road dust (Alves et al. 2015, González et al. 2017). Iron-rich samples with varied characteristics were collected at the CAMPOS station. In Fig. 4b, a particle with an irregular shape and rough texture, containing both Fe and Al, suggests a natural origin, likely from the rocky substrate (Pereira et al. 2007, Samara & Voutsa 2005). The other particle (Fig. 4c) corresponds to spheroidal iron oxide particles, indicating an anthropogenic source (Xie et al. 2005, Aragon-Pina 2011). This type of particles may be linked to coal combustion processes in industrial furnaces or to vehicle emissions, such as brake wear (Quijano et al. 2019). The absence of titanium in the particles rules out the possibility of them being of natural origin, such as ilmenite (FeTiO3).
Using the SEM technique, another important piece of information that can be obtained is particle size, which plays a critical role in environmental monitoring. In many cases, this information helps to infer the source of PM, contributing to the understanding of events related to both natural and anthropogenic influences in the studied region. In this context, Figures 3a, 4a, and 4b illustrate particles larger than 10 μm, which are typical of natural emissions. In contrast, particles from anthropogenic sources are shown in Figures 3c and 4c, with sizes well below 10 μm. Specifically, Fig. 3b displays PM characteristic of soot from combustion, which can be classified as a secondary source, although it is not possible to clearly determine the emission type (whether natural or the result of intentional burning).
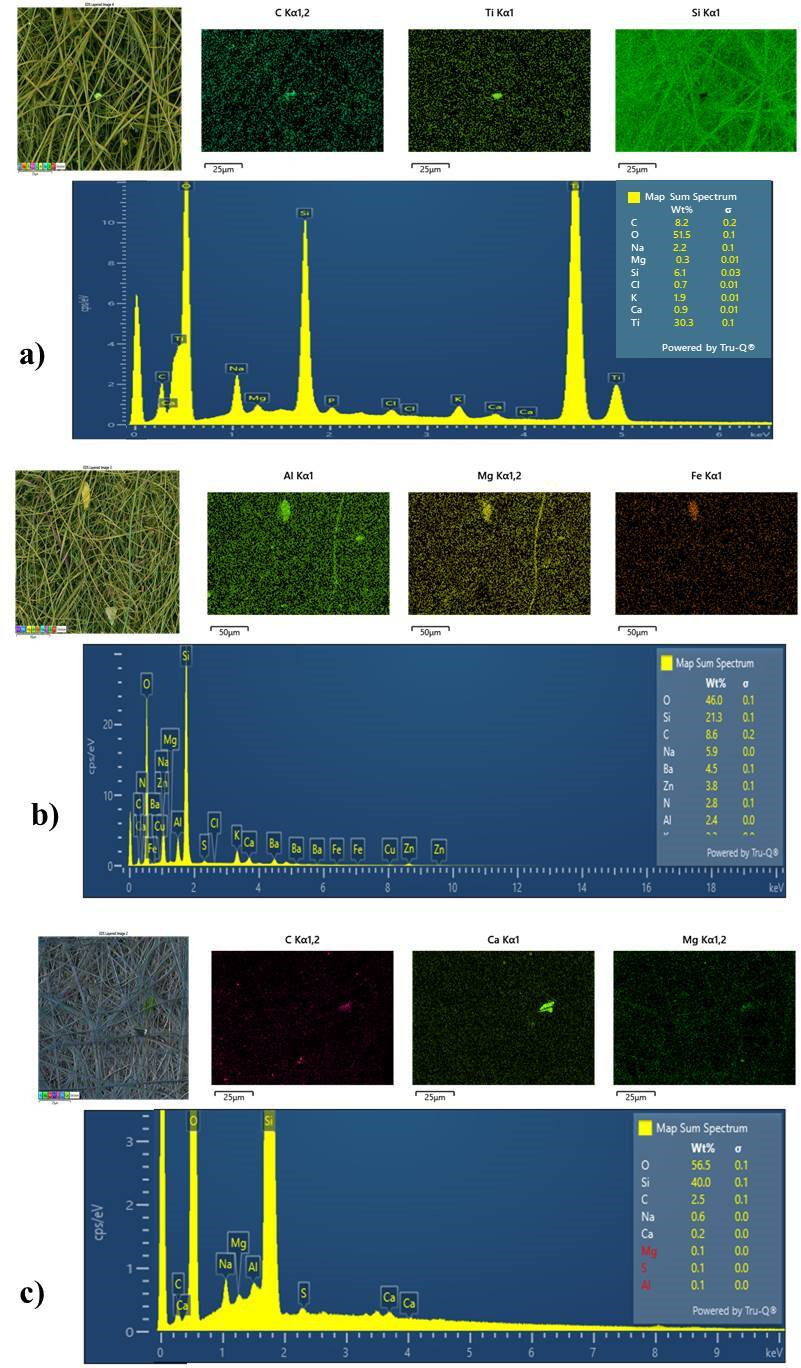
Additionally, EDS coupled with SEM is another valuable tool in PM research, as it enables elemental-level characterization of the analyzed surface. When the electron beam interacts with the sample, it induces the emission of characteristic X-rays from the elements present. By detecting these X-rays, it is possible to identify and map the distribution of chemical elements across the surface. The analyses presented in Figure 5 correspond to samples collected at the CAMPOS site during a period of lower rainfall, in the winter season, which favors the dispersion of particles in the atmosphere.
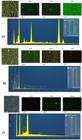
Elucidation of chemical composition by EDS elemental maps for different particulate matter.
Titanium was identified in the PM associated with carbon (Fig. 5a), and the combination of these elements suggests the presence of titanium carbide, commonly used in the ceramic industry to enhance hardness and friction resistance in floors. Other studies have also identified Ti, either in the liquid phase after the PM extraction process (Mateus et al. 2013, Mateus & Gioda 2017) or associated with soil dust (Godoy et al. 2009, Fernandez-Camacho et al. 2012). In another analysis, the combination of Al, Mg, and Fe was observed (Fig. 5b), suggesting the presence of clay minerals, specifically ferromagnesian aluminosilicates (Margiotta et al. 2015, Zarazúa et al. 2011). The EDS analysis, revealing the overlap of C, Ca, and Mg, indicates the presence of calcium and magnesium carbonates, suggesting dolomite. The origin of this PM could be either natural or the result of the deterioration of building surfaces (Ramirez-Leal et al. 2007, Okada & Kai 2004).
The sharpness and contrast of the EDS elemental maps are influenced by both the elemental concentration and the atomic number of the constituent materials. In this context, elements such as Ti (Fig. 5a) and Ca (Fig. 5c) appear with greater brightness due to their higher atomic number and/or localized enrichment. Although Si is a known component of the fibrous filter material, its signal is less visually prominent in regions where heavier elements like Ti are concentrated. It is important to note, however, that this is not due to spectral interference, as the characteristic X-ray energies of Ti and Si are well separated. Instead, the visual suppression of Si in the EDS map (Fig. 5a) may be attributed to the relative signal intensity and contrast settings used in the image rendering.
Despite the long analysis time required for multiple scans of a surface, the EDS technique enables the identification of the elements that make up the material, even when the SEM images do not provide a clear view (Fig. 5c).
It is important to note that while SEM-EDS analysis provided essential insights into particle morphology and elemental composition, several limitations must be considered. The use of fiberglass and quartz filters, although ideal for gravimetric PM quantification, may introduce background elemental signals that can complicate the interpretation of particle composition. The decision not to apply a conductive coating reduced both cost and preparation time; however, it also introduced challenges related to material conductivity, as these types of filters have relatively low electrical conductivity. On the other hand, they are inorganic substrates that tend to accumulate minimal surface charge under electron beam exposure, and their porous, fibrous structure contributes to partial charge dissipation, thereby reducing charging artifacts. The choice of operating under low vacuum and low accelerating voltage, while potentially limiting the detection of heavier elements, introduces a thin gas layer in the chamber that helps dissipate surface charges and creates a less aggressive environment for the sample. Thus, a balance between imaging conditions and analytical quality must be carefully managed by the operator. Additionally, the qualitative approach adopted here did not include blank subtraction or calibration standards, which limits the potential for quantitative analysis. Nevertheless, the technique’s reduced sensitivity to light elements and limited capacity for source attribution (natural or antropogenic) based solely on elemental and morphological features suggest that SEM-EDS should be combined with complementary analytical approaches.
CONCLUSIONS
Analysis of the particulate matter data collected from three regions of the state of Rio de Janeiro reveals that the concentrations found are within the limits established by current legislation, particularly regarding short-term exposure. However, significant variation in PM concentrations was observed depending on both the season and the type of filter used. The seasonal comparison showed an increase in concentrations during the dry season.
The characterization of the fiberglass and quartz filters revealed differences in their composition. The fiberglass filters showed significant levels of Ba, Zn, and Na, which may challenge the analysis of these elements in PM. While quartz filters are purer, they are also more expensive. During the rainy season, with less particle dispersion in the air, the quartz filter demonstrated better efficiency in particle retention (Filter 003 vs. Filter 001). In the dry season, both filters showed uniformity in particle capture (Filter 022 vs. Filter 020). Overall, the choice of filter type is a crucial consideration in the decision-making process for the sampling campaign.
The SEM technique enabled the characterization of PM in terms of morphology, texture, and size. From the particle size, it was possible to infer the natural or anthropogenic origin of the material, which is a crucial factor for environmental monitoring. Particles smaller than 10 μm identified in the study may be linked to pollution from combustion-powered vehicles or industrial processes in the monitored area. A suggested classification for the particles is to divide them into organic and inorganic types. The organic class, rich in carbon, includes both biogenic and anthropogenic particles, which were associated with activities such as biomass burning and incomplete combustion of fuels. In contrast, inorganic particles displayed distinct characteristics, such as mineral particles from rock substrates and iron-rich particles linked to industrial activity.
The EDS technique enabled the identification of overlapping elements that compose a given PM by imaging the sample surface. The particles identified included titanium carbide, ferromagnesian aluminosilicate, and calcium and magnesium carbonate. Although the analysis time is lengthy due to the need for multiple scans, the EDS technique can still identify elements even without a clear image provided by the SEM technique.
Thus, the combination of SEM and EDS proves to be a valuable tool in PM research, particularly for characterizing particles more accurately in terms of their chemical composition and origin. Such studies can contribute to understanding the dispersion of particulate aerosols in the atmosphere and assist in the monitoring of environmental pollution in the region.
Acknowledgements
This work was supported by the Coordenação de Aperfeiçoamento de Pessoal de Nível Superior – Brasil (CAPES, Finance Code 001). The authors thank the Fundação Carlos Chagas Filho de Amparo à Pesquisa do Estado do Rio de Janeiro (FAPERJ) for the financial support (Edital Temáticos - SEI-260003/001168/2020 Ref. 210.006/2020). Adriana Gioda thanks FAPERJ (Auxílio Cientista do Nosso Estado) and Conselho Nacional de Desenvolvimento Científico e Tecnológico (CNPq - Bolsa de Produtividade) for the grants.
References
- AL-THANI H, KOÇ M & ISAIFAN RJ. 2018. A review on the direct effect of particulate atmospheric pollution on materials and its mitigation for sustainable cities and societies. Environ Sci Pollut Res 25: 27839.
-
ALMEIDA TS, BRANCHER M, LISBOA HM, FRANCO D, MARANHÃO TA & BORGES DLG. 2020. Direct analysis of particulate matter (PM10) for the determination of Be, Cd and Pb using high resolution-continuum source electrothermal atomic absorption spectrometry: Assessment of the potential correlation between analyte content and meteorological parameters. Spectrochim Acta Part B: At Spectrosc 172: 105951. https://doi.org/10.1016/j.sab.2020.105951.
» https://doi.org/10.1016/j.sab.2020.105951 -
ALVES DD, SCHUCK S, MONTANARI D & SIQUEIRA MA. 2015. Morfologia e composição do material particulado atmosférico da bacia hidrográfica do Rio dos Sinos (RS) analisados por microscopia eletrônica de varredura. Geochim Bras 29: 45-57. https://doi.org/10.21715/GB2358-2812.2015292045.
» https://doi.org/10.21715/GB2358-2812.2015292045 - ARAGON-PINA A. 2011. Diferencias que revelan la naturaleza de las particulas atmosféricas. In: ¿Como son las partículas atmosféricas antropogénicas y cuál es su relación com los divers. Universidad Autónoma de San Luis Potosí, Instituto de Metalurgia-Facultad de Ingeniería, San Luis Potosí, México, Groppe Libros, p. 1-184. https://doi.org/10.13140/RG.2.1.2561.0409.
- ARTAXO P, OYOLA P & MARTINEZ R. 1999. Aerosol composition and source apportionment in Santiago de Chile. Nucl Instrum Meth Phys Res B 150: 409-416.
-
AVRAM SE, TUDORAN LB, BORODI G, FILIP MR & PETEAN I. 2025. Urban Traffic’s Influence on Noise and Particulate Matter Pollution. Sustainability 17: 2077. https://doi.org/10.3390/su17052077.
» https://doi.org/10.3390/su17052077 - AZEVEDO DA, DOS SANTOS CYM & NETO FRA. 2002. Identification and seasonal variation of atmospheric organic pollutants in Campos dos Goytacazes, Brazil. Atmos Environ 36: 2383.
-
BERINGUI K, QUIJANO MFC, JUSTO EPS, VENTURA LMB & GIODA A. 2021. Avaliação da concentração e composição inorgânica do material particulado coletado no estado do Rio de Janeiro. Quim Nova 44(6): 737-754. http://doi.org/10.21577/0100-4042.20170717.
» https://doi.org/10.21577/0100-4042.20170717 - BILOS C, COLOMBO JC, SKORUPKA CN & RODRIGUEZ PRESA MJ. 2001. Sources, distribution and variability of airborne trace metals in La Plata City area, Argentina. Environ Pollut 111: 149.
-
CAMPOS-RAMOS A, ARAGÓN-PIÑA A, GALINDO-ESTRADA I, QUEROL X & ALASTUEY A. 2009. Characterization of atmospheric aerosols by SEM in a rural area in the western part of México and its relation with different pollution sources. Atmos Environ 43: 6159-6167. https://doi.org/10.1016/j.atmosenv.2009.09.004.
» https://doi.org/10.1016/j.atmosenv.2009.09.004 -
CONAMA - CONSELHO NACIONAL DO MEIO AMBIENTE. 2024. Resolution n⁰ 506/2024 of 5 July 2024, Brazil, Annex 1, 2024; Published at DOU – National Impress, 09/07/2024, Edition: 130, Section: 1, p. 133. Available at: https://conama.mma.gov.br/ Accessed on: November, 2024.
» https://conama.mma.gov.br/ -
DE LA CRUZ AH, ROCA YB, SUAREZ-SALAS L, POMALAYA J, TOLENTINO DA & GIODA A. 2019b. Chemical Characterization of PM2.5 at Rural and Urban Sites around the Metropolitan Area of Huancayo (Central Andes of Peru). Atmosphere 10: 21. https://doi.org/10.3390/atmos10010021.
» https://doi.org/10.3390/atmos10010021 -
DE LA CRUZ ARH, DIONISIO CALDERON ER, FRANÇA BB, RÉQUIA WJ & GIODA A. 2019a. Evaluation of the impact of the Rio 2016 Olympic Games on air quality in the city of Rio de Janeiro, Brazil. Atmos Environ 203: 206-215. https://doi.org/10.1016/j.atmosenv.2019.02.007.
» https://doi.org/10.1016/j.atmosenv.2019.02.007 -
DIRECTIVE EU. 2024. 2024/2881 of the European Parliament and of the Council of 23 October 2024 on ambient air quality and cleaner air for Europe (recast). Available at: http://data.europa.eu/eli/dir/2024/2881/oj Acessed on: December, 2024.
» http://data.europa.eu/eli/dir/2024/2881/oj -
FERNÁNDEZ-CAMACHO R, RODRÍGUEZ S, DE LA ROSA J, SÁNCHEZ DE LA CAMPA AM, ALASTUEY A, QUEROL X, GONZÁLEZ-CASTANEDO Y, GARCIA-ORELLANA I & NAVA S. 2012. Ultrafine particle and fine trace metal (As, Cd, Cu, Pb and Zn) pollution episodes induced by industrial emissions in Huelva, SW Spain. Atmos Environ 61: 507-517. https://doi.org/10.1016/j.atmosenv.2012.08.003.
» https://doi.org/10.1016/j.atmosenv.2012.08.003 -
FERREIRA RS, NUNES CRO, SOUZA MO & CANELA MC. 2021. Multivariate Optimization of Extraction Variables of PAH in Particulate Matter (PM 10) in Indoor/Outdoor Air at Campos dos Goytacazes, Brazil. J Braz Chem Soc 32(3): 618-625. https://doi.org/10.21577/0103-5053.20200216.
» https://doi.org/10.21577/0103-5053.20200216 - FUZZI S, BALTENSPERGER U, CARSLAW K, DECESARI S, GON HD, VAN DER FACCHINI MC, FOWLER D & NAZIONALE C. 2015. Particulate matter, air quality and climate: lessons learned and future needs. Atmos Chem Phys 15: 8217.
-
GIODA A, AMARAL BS, MONTEIRO ILG & SAINT’PIERRE TD. 2011. Chemical composition, sources, solubility, and transport of aerosol trace elements in a tropical region. J Environ Monit 13: 2134-2142. http://doi.org/10.1039/C1EM10240K.
» https://doi.org/10.1039/C1EM10240K -
GIODA A ET AL. 2021. A Review on Atmospheric Analysis Focusing on Public Health, Environmental Legislation and Chemical Characterization. Crit Rev Anal Chem 52 (8): 1772-1794. https://doi.org/10.1080/10408347.2021.1919985.
» https://doi.org/10.1080/10408347.2021.1919985 -
GIODA A, MARIA L, VENTURA B, RAMOS MB, PALAGANO M & SILVA R. 2016. Half century monitoring air pollution in a Megacity: a case study of Rio de Janeiro. Water Air Soil Pollut 227 (86): 1. https://doi.org/10.1007/s11270-016-2780-8.
» https://doi.org/10.1007/s11270-016-2780-8 - GIODA A, SALES JA, CAVALCANTI PMS, MAIA MF, MAIA LFPG & AQUINO NETO FR. 2004. Evaluation of air quality in Volta Redonda, the main metallurgical industrial city in Brazil. J Braz Chem Soc 15: 856.
-
GODOY MLDP, GODOY JM, ROLDÃO LA, SOLURI DS & DONAGEMMA RA. 2009. Coarse and fine aerosol source apportionment in Rio de Janeiro, Brazil. Atmos Environ 43: 2366. http://doi.org/10.1016/j.atmosenv.2008.12.046.
» https://doi.org/10.1016/j.atmosenv.2008.12.046 -
GONZÁLEZ LT, LONGORIA RODRÍGUEZ FE, SÁNCHEZ-DOMÍNGUEZ M, CAVAZOS A, LEYVA-PORRAS C, SILVA-VIDAURRI LG, ACUNA-ASKAR K, KHARISSOV BI, CHIU JFV & BARBOSA JMA. 2017. Determination of trace metals in TSP and PM2.5 materials collected in the Metropolitan Area of Monterrey, Mexico: A characterization study by XPS, ICP-AES and SEM-EDS. Atmos Res 196: 8-22. https://doi.org/10.1016/j.atmosres.2017.05.009.
» https://doi.org/10.1016/j.atmosres.2017.05.009 -
GONZÁLEZ LT, LONGORIA RODRÍGUEZ FE, SÁNCHEZ-DOMÍNGUEZ M, LEYVA-PORRAS C, SILVA-VIDAURRI LG, ACUNA-ASKAR K, KHARISSOV BI, CHIU JFV & BARBOSA JMA. 2016. Chemical and morphological characterization of TSP and PM2.5 SEM-EDS, XPS and XRD collected in the Metropolitan Area of Monterrey, Mexico. Atmos Res 143: 249-260. https://doi.org/10.1016/j.atmosres.2016.08.053.
» https://doi.org/10.1016/j.atmosres.2016.08.053 -
HEN YM, CAO JJ, LEE SC, HO KF & AN ZS. 2010. Different characteristics of char and soot in the atmosphere and their ratio as an indicator for source identification in Xi’na, China. Atmos Chem Phys 10: 595-607. https://doi.org/10.5194/acp-10-595-2010.
» https://doi.org/10.5194/acp-10-595-2010 -
HOPKE PK, XIE Y, RAUNEMAA T, BIEGALSKI S, LANDSBERGER S, ARTAXO P & COHEN D. 1997. Characterization of the Gent Stacked Filter Unit PM10 Sampler. Aerosol Sci Technol 27: 726-735. DOI: 10.1080/02786829708965507.
» https://doi.org/10.1080/02786829708965507 -
INEA – INSTITUTO ESTADUAL DO AMBIENTE. 2020. Relatório da qualidade do ar do Estado do Rio de Janeiro: ano base 2018. Instituto Estadual do Ambiente (Rio de Janeiro – RJ). Available at: https://www.inea.rj.gov.br/wp-content/uploads/2020/11/relatorio-qualidade-ar-2018.pdf Accessed on: September, 2024.
» https://www.inea.rj.gov.br/wp-content/uploads/2020/11/relatorio-qualidade-ar-2018.pdf -
JACONIS SY, CULLEY TM & MEIER AM. 2017. Does particulate matter along roadsides interfere with plant reproduction? A comparison of effects of different road types on Cichorium intybus pollen deposition and germination. Environ Pollut 222: 261-266. https://doi.org/10.1016/j.envpol.2016.12.047.
» https://doi.org/10.1016/j.envpol.2016.12.047 -
JIRAU-COLÓN H, TORO-HEREDIA J, LAYUNO J, CALDERON ED & GIODA A. 2021. Distribution of toxic metals and relative toxicity of airborne PM2.5 in Puerto Rico. Environ Sci Pollut Res 28: 16504-16516. https://doi.org/10.1007/s11356-020-11673-4.
» https://doi.org/10.1007/s11356-020-11673-4 -
JUSTO EPS, QUIJANO MFC, BERINGUI K, SAINT’PIERRE TD & GIODA A. 2020. Assessment of Atmospheric PM10 Pollution Levels and Chemical Composition in Urban Areas near the 2016 Olympic Game Arenas. J Braz Chem Soc 31(5): 1043-1054. http://doi.org/10.21577/0103-5053.20190270.
» https://doi.org/10.21577/0103-5053.20190270 -
LOYOLA J, ARBILLA G, QUITERIO SL, ESCALEIRA V & BELLIDO AV. 2009. Concentration of airbone trace metals in a bus station with a high heavy-duty diesel fraction. J Braz Chem Soc 20: 1343-1350. DOI: 10.1590/S0103-50532009000700020.
» https://doi.org/10.1590/S0103-50532009000700020 -
LOYOLA J, ARBILLA G, QUITERIO SL, ESCALEIRA V & MINHO AS. 2012. Trace metals in the urban aerosols of Rio de Janeiro city. J Braz Chem Soc 23: 628-638. DOI: 10.1590/S0103-50532012000400007.
» https://doi.org/10.1590/S0103-50532012000400007 -
LOYOLA J, DE ALMEIDA PB, QUITERIO SL, SOUSA CR, ARBILLA G, ESCALEIRA V, DE CARVALHO MI & DA SILVA ASAG. 2006. Concentration and Emission Sources of Airborne Metals in Particulate Matter in the Industrial District of Médio Paraíba, State of Rio de Janeiro, Brazil. Environ Contam Toxicol 51: 485-493. https://doi.org/10.1007/s00244-005-0313-3.
» https://doi.org/10.1007/s00244-005-0313-3 -
MARGIOTTA S, LETTINO A, SPERANZA A & SUMMA V. 2015. PM1 geochemical and mineralogical characterization using SEM-EDX to identify particle origin – Agri Valley pilot area (Basilicata southern Italy). Nat Hazards Earth Syst Sci 15: 1551-1561. https://doi.org/10.5194/nhess-15-1551-2015.
» https://doi.org/10.5194/nhess-15-1551-2015 -
MATEUS VL ET AL. 2020. Assessment of ambient aerosol sources in two important Atlantic Rain Forest hotspots in the surroundings of a megacity. Urban For Urban Green 56: 126858. https://doi.org/10.1016/j.ufug.2020.126858.
» https://doi.org/10.1016/j.ufug.2020.126858 -
MATEUS VL & GIODA A. 2017. A candidate framework for PM2.5 source identification in highly industrialized urban-coastal areas. Atmos Environ 164: 147-164. https://doi.org/10.1016/j.atmosenv.2017.05.025.
» https://doi.org/10.1016/j.atmosenv.2017.05.025 -
MATEUS VL, MONTEIRO ILG, ROCHA RCC, SAINT’PIERRE TD & GIODA A. 2013. Study of the chemical composition of particulate matter from the Rio de Janeiro metropolitan region, Brazil, by inductively coupled plasma-mass spectrometry and optical emission spectrometry. Spectrochim Acta 86: 131-136. https://doi.org/10.1016/j.sab.2013.03.003.
» https://doi.org/10.1016/j.sab.2013.03.003 -
MEIRE RO, LEE SC, YAO Y, TARGINO AC, TORRES JPM & HARNER T. 2012. Seasonal and altitudinal variations of legacy and current-use pesticides in the Brazilian tropical and subtropical mountains. Atmos Environ 59: 108-116. https://doi.org/10.1016/j.atmosenv.2012.05.018.
» https://doi.org/10.1016/j.atmosenv.2012.05.018 -
MOAZAMI TN, SVENDSEN KVH, BUHAGEN M & JØRGENSEN RB. 2023. Comparing PM2.5, respirable dust, and total dust fractions using real-time and gravimetric samples in an exposure chamber study. Heliyon 23 (6): e16127. https://doi.org/10.1016/j.heliyon.2023.e16127.
» https://doi.org/10.1016/j.heliyon.2023.e16127 -
NASCIMENTO FS, LOSNO R, COLIN JL, MELLO WZ & SILVA HE. 2011. Atmospheric total suspended particulate trace element identification by XRF at Ilha Grande, State of Rio de Janeiro, Brazil. Water Air Soil Pollut 214: 525-538. https://doi.org/10.1007/s11270-010-0443-8.
» https://doi.org/10.1007/s11270-010-0443-8 -
OKADA K & KAI K. 2004. Atmospheric Mineral Particles Collected at Quira in the Taklamakan Desert, China. Atmos Environ 38: 6927-6935. http://dx.doi.org/10.1016/j.atmosenv.2004.03.078.
» https://doi.org/10.1016/j.atmosenv.2004.03.078 - OLIVEIRA RL, CUSTODIO DJ, DE RAINHO CR, MORAIS E, FELZENSZWALB I, CORREA SM, AZEVEDO DA & ARBILLA G. 2018. Polycyclic aromatic hydrocarbon patterns in the city of Rio de Janeiro. Air Qual Atmos Health 11: 581-590.
-
ORTIZ C, LINARES C, CARMONA R & DÍAZ J. 2017. Evaluation of short-term mortality attributable to particulate matter pollution in Spain. Environ Pollut 224: 541-551. https://doi.org/10.1016/j.envpol.2017.02.037.
» https://doi.org/10.1016/j.envpol.2017.02.037 -
PAULINO SDA, OLIVEIRA RL, LOYOLA J, MINHO AS, ARBILLA G, QUITERIO SL & ESCALEIRA V. 2014. Trace Metals in PM10 and PM2.5 Samples Collected in a Highly Industrialized Chemical/Petrochemical Area and Its Urbanized Surroundings. Bull Environ Contam Toxicol 92: 590-595. https://doi.org/10.1007/s00128-014-1219-4.
» https://doi.org/10.1007/s00128-014-1219-4 - PAULINO SDA, QUITERIO SL, ESCALEIRA V & ARBILLA G. 2010. Evolution of particulate matter and associated metal levels in the urban area of Rio de Janeiro, Brazil. Bull Environ Contam Toxicol 84: 315.
-
PEREIRA PA ET AL. 2007. Atmospheric concentrations and dry deposition fluxes of particulate trace metals in Salvador, Bahia, Brazil. Atmos Environ 41: 7837-7850. http://dx.doi.org/10.1016/j.atmosenv.2007.06.013.
» https://doi.org/10.1016/j.atmosenv.2007.06.013 -
PÖSCHL U. 2005. Atmospheric Aerosols: Composition, Transformation, Climate and Health Effects. Atmos Chem 44: 7520. https://doi.org/10.1002/anie.200501122.
» https://doi.org/10.1002/anie.200501122 -
PÓSFAI M, SIMONICS R, LI J, HOBBS PV & BUSECK PR. 2003. Individual aerosol particles from biomass burning in southern Africa: Compositions and size distributions of carbonaceous particles. J Geophys Res 108(13): SAF 19-1-SAF 19-13. DOI: 10.1029/2002jd002291.
» https://doi.org/10.1029/2002jd002291 -
QUIJANO MFC, MATEUS VL, SAINT’PIERRE TD, BOTT IS & GIODA A. 2019. Exploratory and comparative analysis of the morphology and chemical composition of PM2.5 from regions with different socioeconomic characteristics. Microchem J 147: 507-515. https://doi.org/10.1016/j.microc.2019.03.071.
» https://doi.org/10.1016/j.microc.2019.03.071 -
QUITERIO SL, LOYOLA J, ALMEIDA PB, VIVIANE V & ARBILLA G. 2006. Particulate Matter and Associated Metal Levels in a Conservation Area in the Remaining Tropical Forest of Mata Atlântica, Brazil. Environ Contam Toxicol 77: 651-657. https://doi.org/10.1007/s00128-006-1112-x.
» https://doi.org/10.1007/s00128-006-1112-x -
QUITERIO SL, SOUSA CR, ARBILLA G & ESCALEIRA V. 2005. Evaluation of levels, sources and distribution of airborne trace metals in seven districts of the Baixada Fluminense, Rio de Janeiro, Brazil. Atmos Environ 39: 3503-3512. https://doi.org/10.1016/j.atmosenv.2005.02.030.
» https://doi.org/10.1016/j.atmosenv.2005.02.030 -
QUITERIO SL, SOUSA DA SILVA CR, ARBILLA G & ESCALEIRA V. 2004. Metals in airborne particulate matter in the industrial district of Santa Cruz, Rio de Janeiro, in an annual period. Atmos Environ 38: 321-331. https://doi.org/10.1016/j.atmosenv.2003.09.017.
» https://doi.org/10.1016/j.atmosenv.2003.09.017 - RAMIREZ-LEAL R, ESPARZA-PONCE H & DUARTE-MOLLER A. 2007. Characterization of Inorganic Atmospheric Particles in Air Quality Program with SEM, TEM and XAS. Rev Mex Fis 53: 102-107.
-
RAMIREZ-LEAL R, VALLE-MARTINEZ M & CRUZ-CAMPAS M. 2014. Chemical and Morphological Study of PM10 Analysed by SEM-EDS. Open J Air Pollut 3: 121-129. http://dx.doi.org/10.4236/ojap.2014.34012.
» https://doi.org/10.4236/ojap.2014.34012 -
SAMARA C & VOUSA D. 2005. Size distribution of airborne particulate matter and associated heavy metals in the roadside environment. Chemosphere 59: 1197-1206. http://dx.doi.org/10.1016/j.chemosphere.2004.11.06.1.
» https://doi.org/10.1016/j.chemosphere.2004.11.06.1 -
SANDERSON P, DELGADO-SABORIT JM & HARRISON RM. 2014. A review of chemical and physical characterisation of atmospheric metallic nanoparticles. Atmos Environ 94: 353-365. https://doi.org/10.1016/j.atmosenv.2014.05.023.
» https://doi.org/10.1016/j.atmosenv.2014.05.023 -
SEINFELD JH & PANDIS SN. 1998. Atmospheric Chemistry and Physics: From Air Pollution to Climate Change. Noone K (Ed), Phys Today 51(10): 88-90. DOI: 10.1063/1.882420.
» https://doi.org/10.1063/1.882420 - SEINFELD JH & PANDIS SN. 2006. Atmospheric Chemistry and Physics: From air pollution to climate change. John Wiley & Sons, 2nd ed., p. 1152.
-
SELLA SM, NEVES AF, MOREIRA JC & SILVA-FILHO EV. 2006. Biogenic vanadium in total suspended particulate matter from Cabo Frio upwelling region, Southeast, Brazil. Atmos Environ 40: 6181-6191. https://doi.org/10.1016/j.atmosenv.2006.04.058.
» https://doi.org/10.1016/j.atmosenv.2006.04.058 -
SHEN Z, CAO J, ARIMOTO R, HAN Z, ZHANG R, HAN Y, LIU S, OKUDA T, NAKAO S & TANAKA S. 2009. Ionic composition of TSP and PM2. 5 during dust storms and air pollution episodes at Xi’an, China. Atmos Environ 43: 2911-2918. https://doi.org/10.1016/j.atmosenv.2009.03.005.
» https://doi.org/10.1016/j.atmosenv.2009.03.005 -
SILVA LFM, FELIZ CSA, NASCIMENTO MM, ANDRADE JB, CANELA MC, ALMEIDA CMS, SILVEIRA CS, CARREIRA RS & GIODA A. 2024. Characterization of mercury in atmospheric particulate matter in the state of Rio de Janeiro, Brazil. Environ Sci Atmos 4: 872-878. https://doi.org/10.1039/D4EA00044G.
» https://doi.org/10.1039/D4EA00044G -
SOLURI DS, GODOY MLDP, GODOY JM & ROLDÃO LA. 2007. Multi-site PM2.5 and PM2.5-10 aerosol source apportionment in Rio de Janeiro, Brazil. J Braz Chem Soc 18(4): 838-845. DOI: 10.1590/S0103-50532007000400025.
» https://doi.org/10.1590/S0103-50532007000400025 -
SPENCER J & VAN HEYST B. 2019. A review of particulate matter emissions and impacts on human health: A focus on Canadian agricultural and rural emission sources. Le Genie des Biosystems Au Canada. Can Biosyst Eng 60: 6.9-6.21. https://doi.org/10.7451/CBE.2018.60.6.9.
» https://doi.org/10.7451/CBE.2018.60.6.9 -
SUÁREZ-PEÑA B, NEGRAL L, CASTRILLÓN L, MEGIDO L, MARAÑÓN E & FERNÁNDEZ-NAVA Y. 2016. Imaging Techniques and Scanning Electron Microscopy as Tools for Characterizing a Si-Based Material Used in Air Monitoring Applications. Materials 9: 109. https://doi.org/10.3390/ma9020109.
» https://doi.org/10.3390/ma9020109 -
TOLEDO VE, ALMEIDA PB, QUITERIO SL, ARBILLA G, MOREIRA A, ESCALEIRA V & MOREIRA JC. 2008. Evaluation of levels, sources and distribution of toxic elements in PM10 in a suburban industrial region, Rio de Janeiro, Brazil. Environ Monit Assess 139: 49-59. https://doi.org/10.1007/s10661-007-9815-y.
» https://doi.org/10.1007/s10661-007-9815-y - US EPA - ENVIRONMENTAL PROTECTION AGENCY OF THE UNITED STATES. 1999. Integrated Sampling of Suspended Particulate Matter (SPM) in Ambient Air- Overview. Compendium of Methods for Determination of Inorganic Compounds. In: Ambient Air - Chapter IO2 - Cincinnat, OH, Center for Environmental Research Information, Office of Research and Development, (EPA/625/R-96/010a).
-
US EPA - ENVIRONMENTAL PROTECTION AGENCY OF THE UNITED STATES. 2020. Policy Assessment for the Review of the National Ambient Air Quality Standards for Particulate Matter. Research Triangle Park, NC. Office of Air Quality Planning and Standards, Heath and Environmental Impacts Division. US EPA–452/R–20–002. Available at: https://www.epa.gov/naaqs/particulate-matter-pm-standards-policy-assessments-current-review-0 Accessed on: February, 2024.
» https://www.epa.gov/naaqs/particulate-matter-pm-standards-policy-assessments-current-review-0 -
VENTURA LMB, ALMEIDA IRPL, RAMOS MB, D’AGOSTO MA & GIODA A. 2022. Impact of the transport system on air quality: the case of Rio de Janeiro, Brazil. Sustainability in Debate - Brasília 13(3): 121-137. http://doi.org/10.18472/SustDeb.v13n3.2022.44993.
» https://doi.org/10.18472/SustDeb.v13n3.2022.44993 -
VENTURA LMB, AMARAL BS, WANDERLEY KB, GODOY JM & GIODA A. 2014. Validation Method to Determine Metals in Atmospheric Particulate Matter by Inductively Coupled Plasma Optical Emission Spectrometry. J Braz Chem Soc 25 (9): 1571-1582. http://doi.org/10.5935/0103-5053.20140142.
» https://doi.org/10.5935/0103-5053.20140142 -
VENTURA LMB, RAMOS MB, D’AGOSTO MA & GIODA A. 2021. Evaluation of the impact of the national strike of the road freight transport sector on the air quality of the metropolitan region of Rio de Janeiro, Brazil. Sustain Cities Soc 65: 102588. https://doi.org/10.1016/j.scs.2020.102588.
» https://doi.org/10.1016/j.scs.2020.102588 -
VENTURA LMB, RAMOS MB, SANTOS J & GIODA A. 2019. Monitoring of air quality before the Olympic Games Rio 2016. An Acad Bras Cienc 91: e20170984. http://doi.org/10.1590/0001-3765201920170984.
» https://doi.org/10.1590/0001-3765201920170984 - VICENT JH. 2007. Pumps and Paraphernalia. In: Aerosol Sampling: Science, Standards, Instrumentation and Applications. Jonh Wiley & Sons Ltd., p. 519-535. https://doi.org/10.1002/9780470060230.ch21.
-
WHO – WORLD HEALTH ORGANIZATION. 2000. Air Quality Guidelines for Europe. World Health Organization, Regional Office for Europe. Copenhagen, Denmark, 2nd ed., p. 273. Available at: https://www.who.int/publications/i/item/9789289013581
» https://www.who.int/publications/i/item/9789289013581 -
WHO – WORLD HEALTH ORGANIZATION. 2021. WHO global air quality guidelines: particulate matter (PM2.5 and PM10), ozone, nitrogen dioxide, sulfur dioxide and carbon monoxide. World Health Organization. Available at: https://iris.who.int/handle/10665/345329 License: CC BY-NC-SA 3.0 IGO.
» https://iris.who.int/handle/10665/345329 - XIE RK, SEIP HM, LEINUM JR, WINJE T & XIAO JS. 2005. Chemical characterization of individual particles (PM10) from ambient air in Guiyang City, China. Sci of the Total Environ 343: 261-272.
-
YATKIN S, GERBOLES M & BOROWIAK A. 2012. Evaluation of standardless EDXRF analysis for the determination of elements on PM10 loaded filters. Atmos Environ 54: 568-582. https://doi.org/10.1016/j.atmosenv.2012.02.062.
» https://doi.org/10.1016/j.atmosenv.2012.02.062 - YUKSEL B, SEN N, OGUNÇ GI & ERDOGAN A. 2022. Elemental profiling of toxic and modern primers using ICP-MS, SEM-EDS, and XPS: an application in firearm discharge residue investigation. Aust J For Sci 55(4): 1-19.
- YUKSEL B, SEN N, SEKER ME, OGUNÇ GI & BULUT S. 2025. Integration Chromophoric and Instrumental Methods (SEM-EDS and FTIR) for Accurate Shooting Distance Estimation: An Inter-laboratory Study in Forensic Chemistry. Curr Anal Chem 21(9): 1333-1344.
- ZARAZÚA G, TEJEDA S, ÁVILA-PÉREZ P, CARAPIA L, CARRENO C & BALCÁZAR M. 2011. Metal content and elemental composition of particles in cohesive sediments of the Lerma River, Mexico. Rev Int Contam Ambient 27: 181-190.
Edited by
-
Handling editor
Gisele da Rocha
The original contributions presented in this study are included in the article.