 Fish diversity in peat swamp waters of East Kalimantan, Indonesia, assessed using environmental DNA metabarcoding
Abstract
Studies on fish diversity in peat swamp waters using direct capture methods are often hindered by limited accessibility, high water turbidity, and complex habitat structures, frequently resulting in underrepresentative data. To address these challenges, environmental DNA (eDNA) metabarcoding targeting the mitochondrial 12S rRNA region using MiFish universal primers has emerged as a robust alternative, capable of detecting species that are difficult to observe directly, including rare, cryptic, or extremophilic species inhabiting harsh physicochemical conditions such as peat swamp waters. In this study, we employed eDNA metabarcoding (Oxford Nanopore Technologies, UK) to characterize the species composition and community diversity of fish in the peat swamp waters of East Kalimantan. A total of 29 fish species, spanning 7 orders and 16 families, were identified across three sampling areas: Sabintulung, Muara Kaman, and Tuana Tuha. The species exhibiting the highest individual relative read abundance values were Helostoma temminckii (32.62%), Thynnichthys polylepis (27.69%), Trichopodus pectoralis (23.60%), and Channa striata (21.94%), each representing their relative contribution within their respective sampling profiles. Alpha (α) diversity indices indicated that the highest levels of diversity and evenness were located at the Muara Kaman station, whereas the Tuana Tuha station, situated along the Belayan River flow, exhibited the lowest diversity. Furthermore, beta (β) diversity analysis revealed a significant similarity in fish community structure between the Muara Kaman and Tuana Tuha stations. These findings demonstrate that eDNA technology is a highly effective tool for detecting fish species composition and diversity in East Kalimantan’s peat swamp waters, offering significant potential for long-term biodiversity monitoring and conservation efforts.
Keywords:
Alpha diversity; beta diversity; invasive species; Mi-Fish
Resumo
Estudos sobre a diversidade de peixes em águas de turfeiras, utilizando métodos de captura direta, são frequentemente prejudicadps pela acessibilidade limitada, alta turbidez da água e estruturas complexas do habitat, resultando com frequência em dados sub-representativos. Para superar esses desafios, o metabarcoding de DNA ambiental (eDNA), direcionado à região mitocondrial 12S rRNA por meio de primers universais MiFish, surgiu como uma alternativa robusta, capaz de detectar espécies difíceis de observar diretamente, incluindo espécies raras, crípticas ou extremófilas que habitam ambientes com condições físico-químicas adversas, como as águas de turfeiras. Neste estudo, empregamos o metabarcoding de eDNA (Oxford Nanopore Technologies, Reino Unido) para caracterizar a composição de espécies e a diversidade da comunidade de peixes nas águas de turfeiras de Kalimantan Oriental. Um total de 29 espécies de peixes, abrangendo 7 ordens e 16 famílias, foram identificadas em três áreas de amostragem: Sabintulung, Muara Kaman e Tuana Tuha. As espécies com maior abundância relativa foram Helostoma temminckii (32,62%), seguida por Thynnichthys polylepis (27,69%), Trichopodus pectoralis (23,60%) e Channa striata (21,94%). Os índices de diversidade alfa (α) indicaram que os maiores níveis de diversidade e equitabilidade foram encontrados na estação Muara Kaman, enquanto a estação Tuana Tuha, situada ao longo do curso do rio Belayan, apresentou a menor diversidade. Além disso, a análise de diversidade beta (β) revelou uma similaridade significativa na estrutura da comunidade de peixes entre as estações Muara Kaman e Tuana Tuha. Esses resultados demonstram que a tecnologia de DNA ambiental (eDNA) é uma ferramenta altamente eficaz para detectar a composição e a diversidade de espécies de peixes nas águas de turfeiras de Kalimantan Oriental, oferecendo potencial significativo para o monitoramento da biodiversidade a longo prazo e para os esforços de conservação.
Palavras-chave:
Diversidade alfa; diversidade beta; espécies invasoras; Mi-Fish
1. Introduction
As a distinctive tropical ecosystem, Indonesia’s peat swamp waters particularly those in Kalimantan play a pivotal ecological role on both national and global scales. Kalimantan’s peat swamp waters encompass approximately 4.53 million hectares, accounting for 33.7% of the national total (Anda et al., 2021). Globally, roughly one-third of the world’s peat swamp waters carbon stocks are sequestered as soil organic carbon, primarily trapped within waterlogged, oxygen-depleted zones (Wilson et al., 2016). These conditions establish peat swamp waters ecosystems as critical natural carbon sinks for climate change mitigation. Beyond their ecological significance (Harrison et al., 2020; Warren et al., 2017), peat swamp forests provide vital social functions (Limin and Ermiasi, 2007) and serve as primary habitats for various native and endemic species. Peat blackwaters, characterized by unique hydrochemical properties, support specialized fish assemblages adapted to highly acidic and hypoxic conditions; it is estimated that approximately 80 endemic fish species in Southeast Asia are confined to these ecosystems (Thornton et al., 2018).
Despite their role in maintaining climatic and biological balance, peat swamp ecosystems face escalating environmental threats. Unsustainable management of tropical peat swamp waters can trigger massive carbon emissions into the atmosphere, exacerbating the global climate crisis (Leng et al., 2019; Purnamayani et al., 2025). In Kalimantan, land-use conversion into oil palm plantations accompanied by drainage network construction and infrastructure expansion has disrupted hydrological balances, degraded habitats, and led to the decline of biodiversity, including endemic fish species (Giam et al., 2012; Koh et al., 2011).
In response to these threats, biodiversity monitoring and assessment, particularly concerning fish populations, have become imperative. Fish serve not only as an economically valuable protein source but also as bioindicators for monitoring aquatic ecosystem health (Bertora et al. 2024). Over the past decade, research on peat swamp waters ichthyofauna in Indonesia has expanded across Sumatra, Kalimantan, and Papua. To date, approximately 302 fish species have been recorded inhabiting Indonesian peat swamp waters across at least 26 research locations (Agamawan et al., 2020; Azis et al., 2022; Batubara et al., 2025; Binur, 2010; Britz et al., 2011; Fadilla et al., 2022; Fahmi et al., 2015; Haryono, 2012; Inocencia et al., 2021; Muchlisin et al., 2015; Nurdawati et al., 2007; Paada et al., 2022; Razi et al., 2023; Santoso and Wahyudewantoro, 2019; Suyatna et al., 2021; Thornton et al., 2018; Wahyudewantoro, 2010).
However, updated information regarding the composition and distribution of fish species essential indicators of ecosystem integrity remains scarce. Biodiversity research in peatlands faces significant logistical hurdles, as conventional survey methods, such as netting or angling, are often ineffective. These limitations are compounded by high water turbidity, complex habitat structures, and difficult field accessibility (Deiner et al., 2017), creating a substantial knowledge gap in data-driven conservation efforts. To overcome these constraints, environmental DNA (eDNA) metabarcoding has emerged as an innovative method in aquatic biodiversity studies (McElroy et al., 2020; Zhang et al., 2023). The application of eDNA for fish diversity monitoring has been successfully implemented in various aquatic environments, including rivers (Cantera et al., 2022; Doi et al., 2017; Ji et al., 2022; Yamanaka and Minamoto, 2016), lakes (Hänfling et al., 2016; Lawson Handley et al., 2019; Meng et al., 2023), estuaries (Nagarajan et al., 2022), and mangrove ecosystems (Habib et al., 2021; Keleman et al., 2025; Wee et al., 2023). By analyzing DNA fragments shed into the water, this highly sensitive method can detect species that are difficult to observe directly, including rare, cryptic, or extremophilic species. Consequently, it is widely applicable for biodiversity detection and ecological change monitoring (Çevik and Çevik, 2025; Ramírez-Amaro et al., 2022; Valentini et al., 2016). However, despite the recognized limitations of conventional fish surveys in peatland ecosystems and the increasing application of eDNA metabarcoding worldwide, studies applying this approach in Indonesian peat swamp waters remain scarce. As a result, information on fish community composition derived from eDNA in tropical peat swamp ecosystems, particularly in Kalimantan, is still limited, and the effectiveness of eDNA metabarcoding for documenting fish diversity in these habitats remains insufficiently evaluated.
Therefore, this study represents one of the first applications of eDNA metabarcoding for assessing fish diversity in Indonesian peat swamp waters. By characterizing fish community composition in the peat swamp waters of East Kalimantan, this study provides baseline biodiversity data for a region where eDNA-based assessments remain scarce. The findings are expected to support long-term biodiversity monitoring and conservation strategies in these vulnerable ecosystems.
2. Materials and Methods
2.1. Study area
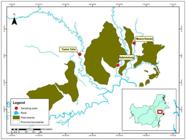
This study was conducted in August 2024 across three distinct locations within the peat swamp waters of East Kalimantan: the Sabintulung (SB), Tuana Tuha (TT), and Muara Kaman (MK) rivers (Table 1). The selection of sampling sites was strategically based on habitat type variations, encompassing main river channels, canals, and tributaries at each location (Figure 1). These habitat variations were incorporated to ensure a representative assessment of the diverse ecological conditions prevalent across the region (Deiner et al., 2017).
Habitat characteristics and physicochemical parameters of sampling location in East Kalimantan, Indonesia.
2.2. Water sampling and filtration
Water samples were collected from the surface layer using sampling bottles pre-sterilized with a 10% bleach solution and rinsed with site water prior to use, following established eDNA decontamination protocols (Yamanaka et al., 2017; Goldberg et al., 2016). At each sampling site, a single 1 L water sample was collected from one sampling point as part of an exploratory biodiversity assessment. A 1 L sampling volume was selected to facilitate efficient filtration while minimizing filter clogging caused by the high concentration of organic matter typically found in peat swamp waters. The entire filtration process was conducted within 12 h after sampling. During transport prior to filtration, samples were stored in a cooler box containing ice gel packs and maintained at approximately 2 – 8°C to minimize eDNA degradation (Renshaw et al., 2015).
Filtration was conducted on the same day at the field accommodation using a Rocker 300 peristaltic vacuum pump fitted with 0.45 µm pore-size Millipore membrane filters, following standard aquatic eDNA capture procedures (Turner et al., 2014). Following filtration, each filter membrane was aseptically halved and folded using sterile tweezers, then transferred into cryotubes pre-filled with DNA/RNA Shield (Zymo Research) to preserve nucleic acid integrity during ambient-temperature storage and transport (Renshaw et al., 2015; Yamanaka et al., 2017). Preserved filters were subsequently transported to the laboratory within approximately two weeks prior to DNA extraction and downstream molecular analysis.
2.3. DNA extraction
Environmental DNA (eDNA) extraction was performed using the Zymo MagBead kit (Zymo Research) following the manufacturer’s recommended protocol (Renshaw et al., 2015; Goldberg et al., 2016). DNA concentration was determined using both a NanoDrop spectrophotometer (for purity assessment) and a Qubit fluorometer (for accurate quantification). Quality control (QC) parameters included the measurement of DNA concentration (expressed in ng/µL) and the determination of absorbance ratios (A260/A280 and A260/A230) to assess potential contamination. High-quality DNA samples were subsequently selected for the PCR amplification stage.
2.4. DNA amplification, PCR, and sequencing
The mitochondrial 12S rRNA gene was targeted using the Mi-Fish-U Adapt Forward (GTCGGTAAAACTCGTGCCAGC) and Mi-Fish-U Adapt Reverse (CATAGTGGGGTATCTAATCCCAGTTTG) primers, enabling the amplification of a 175 bp DNA fragment from the extracted eDNA samples (Miya et al., 2015). A single PCR protocol was performed. The first-round PCR was conducted in a 25 μL reaction volume containing 1 μL of each primer (10 μM), 1 μL of eDNA template, 19.9 μL of ultrapure water, 2.5 μL of 10 × High Fidelity PCR buffer, 0.5 μL of dNTP mix (10 mM), and 0.1 μL of Taq DNA polymerase (Invitrogen). The thermal cycling conditions consisted of an initial denaturation at 95°C for 5 minutes, followed by 35 cycles of denaturation at 95°C for 30 seconds, annealing at 56°C for 20 seconds, and elongation at 72°C for 30 seconds, with a final extension at 72°C for 10 minutes. A no-template control (NTC) containing nuclease-free water instead of DNA template was included in each PCR run to monitor potential laboratory contamination. The resulting PCR products were pooled based on equivalent density ratios, followed by electrophoresis on a 1.5% agarose gel to detect amplicons and facilitate band excision for purification. DNA bands were stained with Fluorescein and visualized under a UV transilluminator.
The library preparation was executed following the Native Barcoding Kit v14 protocol (SQK-NBD114.24, Oxford Nanopore Technologies, UK) (Dommann et al., 2024). Initially, the amplicons were quantified using a fluorometer to ensure a minimum DNA input of 50 ng per sample in a 7.5 μL volume. The DNA then underwent an End-repair and dA-tailing stage using the NEBNext Ultra II End Repair/dA-Tailing Module, with incubation at 20°C for 5 minutes followed by 65°C for 5 minutes. Subsequently, unique barcodes (NB01–NB24) were ligated to each sample using the NEBNext Ultra II Ligation Module at 20°C for 10 minutes. Barcoded products were purified using AMPure XP beads (Beckman Coulter) to remove residual enzymes and buffers.
In the final stage, all barcoded samples were pooled and subjected to Adapter Ligation using Adapter Mix II (AMII) and Quick T4 DNA Ligase. These adapters facilitate the recognition and translocation of DNA fragments through the nanopores during sequencing. Following adapter ligation, the final library was purified and eluted in the recommended buffer. Before loading into the MinION sequencing platform (Nygaard et al., 2020, the flow cell was primed with flushing buffer to ensure optimal nanopore performance. Sequencing was performed using Oxford Nanopore MinION platforms across two independent sequencing runs. Samples processed by different sequencing facilities were analyzed using the same bioinformatic workflow and reference database to ensure consistency in downstream analyses. Sequencing data were subsequently demultiplexed based on the unique barcodes for individual sample identification.
2.5. Bioinformatic analysis
The bioinformatic analysis was conducted using a dual-method approach tailored to specific sampling locations. DNA quantification was performed using both a NanoDrop spectrophotometer and a Qubit fluorometer. Library preparation was executed using kits provided by Oxford Nanopore Technologies (ONT). Nanopore-based sequencing was managed through the MinKNOW software (version 24.02.16), while basecalling was performed using Dorado (version 7.3.11) with a high-accuracy model (Wick et al., 2019). Demultiplexing was performed concurrently with basecalling using Dorado v7.3.11 based on the native barcode assignments. The resulting FASTQ files were analyzed and visualized using NanoPlot, and quality filtering was conducted via NanoFilt to ensure high-fidelity sequence data (De Coster et al., 2018; Nygaard et al., 2020). Reads with a minimum Phred quality score of Q10 and a length range of 300–500 bp were retained for downstream analyses. The filtered reads were subsequently classified using the Centrifuge classifier (Kim et al., 2016). For taxonomic identification, a fish-specific database index was constructed using the MitoFish repository (Iwasaki et al., 2013; Sato et al., 2018). The Centrifuge index was generated using MitoFish (2026) version v2026.05, and no local or additional reference sequences were incorporated into the database. Species identification was confirmed using a sequence similarity threshold of ≥97%, consistent with thresholds commonly applied in fish eDNA metabarcoding studies and the MiFish/MitoFish pipeline for species-level assignment (Richards et al., 2022). Further downstream analysis and data visualization were performed using Pavian (Breitwieser and Salzberg, 2020; Pavian, 2026) and RStudio integrated with R version 4.3.3 (Posit Team, 2025).
3. Results
3.1. Fish species composition and relative read abundance
The eDNA metabarcoding analysis utilizing Mi-Fish primers generated a total of 1,491,774 raw sequences across the three sampling sites. Following bioinformatic filtering restricted to the class Actinopterygii with a minimum similarity threshold of > 97% a subset of 449.733 sequences met the criteria for downstream analysis. Based on these filtered reads, the eDNA survey successfully identified 29 species belonging to 16 families and 7 orders. Among the sampling stations, 8 species were detected at Sabintulung (SB), 5 species at Tuana Tuha (TT), and 16 species at Muara Kaman (MK) (Table 1). Among the seven identified orders, Anabantiformes and Perciformes exhibited the broadest distribution, being detected at all sampling locations. Based on species richness, Cypriniformes was the dominant order, comprising 11 of the 29 detected species (37.93%), followed by Anabantiformes and Siluriformes with six species each (20.69%), and Perciformes with three species (10.34%). Osteoglossiformes, Gobiiformes, and Synbranchiformes were each represented by a single species (3.45%) (Table 2). A more restricted distribution was observed for the orders Gobiiformes and Osteoglossiformes, which were localized to the MK station, while the remaining three orders contributed a cumulative proportion of < 3%. At the family level, Cyprinidae provided the highest species contribution with 11 species (37.93%), followed by Osphronemidae and Channidae with 5 species each (17.24%), and Helostomatidae with 3 species (10.34%).
List of freshwater fish species detected by e-DNA metabarcoding of fish in peat swamp waters of East Kalimantan.
While the Mi-Fish primers demonstrated high accuracy for identification at the species level, four taxa were only resolvable to the genus level, albeit with high identity scores ranging from 98.83% to 100%. Notably, one invasive species, Pterygoplichthys pardalis (Family Loricariidae), was detected at a low relative abundance (0.13%). Furthermore, an assessment based on the IUCN Red List of Threatened Species indicated that all identified taxa (excluding those identified only to the genus level) are categorized as Least Concern (LC). Notably, 57% of the detected fish composition consists of economically important species, primarily within the orders Anabantiformes, Perciformes, Cypriniformes, and Siluriformes (Table 2). Comparison of the relative abundance (%) of fish species across the three sampling sites in the East Kalimantan peat swamp waters revealed varying detection patterns. Based on the analysis of eDNA read counts, the species with the highest relative abundance were Helostoma temminckii (32.62%), followed by Thynnichthys polylepis (27.69%), Trichopodus pectoralis (23.60%), and Channa striata (21.94%) (Figure 2).

3.2. Spatial structure of fish communities
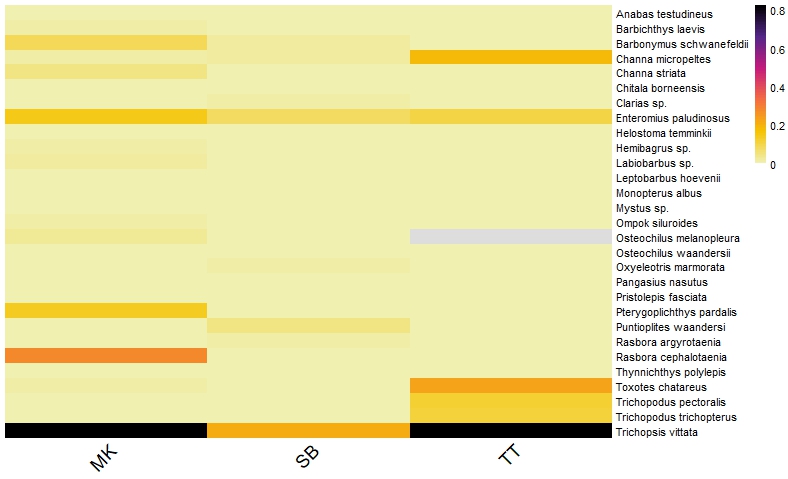
Based on species distribution patterns, only two species were ubiquitously detected across all sampling sites: Helostoma temminckii and Channa striata (Figure 3). The MK station exhibited the highest taxonomic richness with 21 species, followed by the SB station (11 species) and the TT station (6 species). The community structure at the MK station was predominantly characterized by Thynnichthys polylepis, Helostoma temminckii, and Puntioplites waandersii. At the SB station, the assemblage included species such as Rasbora argyrotaenia, Helostoma temminckii, and Pangasius nasutus, though these were present in smaller relative proportions; most other species at this site were either undetected or occurred at negligible frequencies. In contrast, the TT station displayed a narrower species distribution, primarily dominated by taxa from the order Anabantiformes, including Trichopodus pectoralis, Trichopodus trichopterus, and Trichopsis vittata (Figure 4A).

Heatmap analysis of fish communities using their relative read abundance (%) in each sampling location.

Percentage of taxonomic order (A), diversity index (Richness, Shannon, and Simpson) for each station (B).
3.3. α and β-diversity of fish community
The assessment of α-diversity, utilizing Shannon, Simpson, and Richness indices, revealed consistent patterns regarding species diversity across the sampling stations. The MK station exhibited the highest species richness, followed by the SB and TT stations, reflecting varying levels of community complexity. Simpson diversity values remained relatively high (0.79–0.81) across all stations. Notably, at the TT station, despite the limited number of species, the distribution of individuals among species was sufficiently balanced to maintain a specific community dominance profile. Conversely, the high Simpson values at the MK and SB stations reflected a more even distribution of fish species without the dominance of any single taxon (Figure 4B).
Analysis of β-diversity, employing both Bray-Curtis dissimilarity and Jaccard distance metrics, demonstrated significant differences in community composition between stations (Figure 5). Based on the Bray-Curtis dissimilarity index, the highest degree of variation was observed between the TT and MK stations (0.84), followed by TT and SB (0.81). In contrast, the MK and SB stations (0.77) exhibited a higher relative similarity. A comparable trend was observed with the Jaccard dissimilarity index, where the highest value was recorded between the TT and SB stations (0.87). These compositional shifts are primarily attributed to species turnover, indicating that the TT station possesses the most distinct community, whereas the MK and SB stations share more taxonomic similarities despite maintaining unique species assemblages. These findings underscore high β-diversity across the study area and minimal species overlap between locations.

Heatmap clustering analysis using Bray-Curtis (left) and Jaccard (right) dissimilarity distance.
4. Discussion
This study demonstrates that eDNA metabarcoding is an effective approach for assessing fish biodiversity in tropical peatland ecosystems, detecting 29 fish species from 449,733 filtered sequences. This taxonomic richness is comparable to, or higher than, that reported by conventional surveys conducted in similarly complex freshwater environments, including the Sembakung peatlands in North Kalimantan (Azis et al., 2022), the Mempawah–Duri river system in West Kalimantan (Fadilla et al., 2022; Paada et al., 2022), Universitas Palangkaraya waters in Central Kalimantan (Inocencia et al., 2021), the Bukit Batu Biosphere Reserve in Riau (Fahmi et al., 2015), and the Kaliki River in Papua (Binur, 2010). However, direct comparisons between eDNA and conventional surveys should be interpreted cautiously because species richness estimates are strongly influenced by differences in sampling effort, survey design, taxonomic resolution, and detection probability (Takahashi et al., 2023).
The species richness observed in the present study was lower than that reported from other peatland systems in Kalimantan, including the Arut–Kumai region (Santoso and Wahyudewantoro, 2019), the Sebangau peatlands (Thornton et al., 2018), and sections of the Mahakam River basin (Batubara et al., 2025; Suyatna et al., 2021). These differences may reflect variation in habitat extent, hydrological connectivity, environmental heterogeneity, and anthropogenic disturbance among study areas (Sule et al., 2016). Nevertheless, the successful detection of multiple taxa across all stations highlights the utility of eDNA metabarcoding for biodiversity inventories in peatland habitats where conventional capture methods are often constrained by low visibility, difficult access, and low fish encounter rates. It should also be recognized that primer choice can influence taxonomic recovery and detection efficiency across ecosystems (Xu et al., 2024).
Environmental conditions across sampling stations were characteristic of tropical peatlands, with acidic waters (pH 4.02–5.38), low dissolved oxygen concentrations (3.4–5.5 mg/L), and relatively stable temperatures (23.6–24.5°C). Although these physicochemical variables were broadly similar among stations, differences in habitat structure and hydrological connectivity likely contributed to variation in community composition. Ecological niche theory predicts that habitat heterogeneity promotes species coexistence by increasing resource partitioning and reducing interspecific competition (Chan et al., 2020). The occurrence of Anabantiformes, including Trichopodus pectoralis, Trichopodus trichopterus, and Trichopsis vittata, particularly in Tuana Tuha, is consistent with the well-known adaptation of these taxa to hypoxic environments through the possession of labyrinth organs (Mendez-Sanchez and Burggren, 2019). Furthermore, the separation of Tuana Tuha from Sabintulung and Muara Kaman in community composition suggests that hydrological connectivity plays an important role in structuring fish assemblages. Greater connectivity with the main river system may facilitate dispersal and community homogenization, whereas more isolated swamp habitats may function as environmental filters favoring peatland specialists.
Although sequence read abundance can provide useful information regarding community composition, read counts should not be interpreted as direct estimates of biomass or population size. eDNA signals are influenced by numerous biological and methodological processes, including species-specific shedding rates, DNA degradation, hydrological transport, and PCR amplification bias (Gold et al., 2021; Takahashi et al., 2023). The dominance of Cypriniformes observed in this study is consistent with the broad ecological adaptability of many cypriniform fishes, which are widely distributed throughout Southeast Asian freshwater ecosystems and include numerous peatland-adapted taxa (Tao et al., 2019). Likewise, the high read abundance recorded for several species may reflect a combination of local abundance, habitat preference, and species-specific eDNA production rather than actual population size. Previous studies have demonstrated substantial interspecific variation in eDNA shedding associated with body size, physiology, behavior, and environmental conditions (Allan et al., 2021; Kirtane et al., 2021). Consequently, interpretations of relative abundance derived from sequence data should be considered ecological hypotheses that require validation through conventional surveys and controlled experimental studies.
An additional finding of ecological interest was the detection of Pterygoplichthys pardalis, a non-native armored catfish that has become established in many freshwater ecosystems outside its native range through releases associated with the aquarium trade. Although detected at low relative read abundance (0.13%), its occurrence may indicate the presence of an introduced population within the study area. The species has been reported to alter benthic habitats through burrowing activities, compete with native fishes for resources, and influence ecosystem processes such as nutrient cycling (Quintana et al., 2023). Nevertheless, this detection should be interpreted cautiously because eDNA signals may originate from low-density populations, downstream transport of environmental DNA, or potential false-positive detection.
Most detected species are currently categorized as Least Concern (LC) on the IUCN Red List, suggesting relatively stable global population status. However, global conservation assessments do not necessarily reflect local population trends or threats associated with habitat degradation, fragmentation, and land-use change in peatland ecosystems. Notably, Chitala borneensis is classified as Least Concern globally but receives protection under Indonesian national regulations due to regional conservation concerns. In addition, several commonly detected species, including Channa striata, Channa micropeltes, Helostoma temminckii, and Trichopodus spp., are well known components of Kalimantan peatland fish communities and possess physiological adaptations that enable survival under acidic and oxygen-poor conditions (Agamawan et al., 2020; Nash et al., 2025).
Despite the effectiveness of eDNA metabarcoding in detecting fish diversity, species-level assignment remains one of the principal challenges in eDNA metabarcoding. In the present study, several taxa, including Labiobarbus sp., Clarias sp., Hemibagrus sp., and Mystus sp., could not be confidently assigned to species level despite exhibiting high sequence similarity. Closely related taxa often share highly conserved regions within the 12S rRNA marker. Accurate identification therefore depends heavily on the completeness and quality of reference databases (Deagle et al., 2019; Gold et al., 2021). Taxonomic assignments were based on the curated MitoFish reference database and were interpreted conservatively using a ≥97% similarity threshold; therefore, ambiguous assignments were retained at the genus level rather than forcing species-level identification. In addition, sequencing artifacts and database inaccuracies may occasionally produce ambiguous or low-confidence assignments (Dewi et al., 2024). To minimize misidentification, taxonomic assignments were interpreted conservatively following current best-practice recommendations (Keck et al., 2023). These limitations emphasize the importance of expanding curated reference databases for Indonesian freshwater fishes, particularly those inhabiting tropical peatland ecosystems (Marques et al., 2021).
A limitation of this study is that each sampling station was represented by a single 1 L water sample collected from a single point. Consequently, the observed differences in diversity and community composition among stations should be interpreted with caution, as the lack of sampling replication limits the robustness of statistical comparisons. In addition, the relatively small sampling volume may have reduced the probability of detecting rare or low-abundance species, particularly in peat swamp waters characterized by high organic matter content and heterogeneous eDNA distribution. Furthermore, species identification in this study was based on a ≥97% sequence similarity threshold, a criterion widely applied in fish eDNA metabarcoding studies. However, the 12S rRNA region may exhibit limited interspecific variation among closely related taxa, potentially reducing taxonomic resolution and leading to ambiguous species assignments. Therefore, species-level identifications should be interpreted with caution, particularly for closely related congeners and taxa exhibiting low sequence divergence. Future studies should incorporate larger water volumes, filtration replicates, spatial and temporal replication, as well as field blank controls to improve the reliability and comprehensiveness of eDNA-based biodiversity assessments.
5. Conclusion
The application of eDNA metabarcoding using MiFish primers documented 29 fish species in peatland ecosystems of East Kalimantan, demonstrating its utility for biodiversity assessment in complex freshwater habitats. However, species-level resolution remains constrained by environmental factors, primer bias, and incomplete reference databases. The detection of Pterygoplichthys pardalis indicates the sensitivity of eDNA for identifying rare or potentially non-native taxa, although such records should be interpreted cautiously. Overall, eDNA metabarcoding provides a valuable complementary tool for biodiversity assessment in peat swamp ecosystems, particularly where conventional sampling is limited. Further integration with conventional survey methods is recommended to improve validation and ecological interpretation. Future research should focus on implementing multi-marker approaches and increasing spatial and temporal replication, combined with parallel conventional sampling, to improve taxonomic resolution, validate species detections, and better quantify population-level patterns in peatland fish communities.
Acknowledgements
The authors express their gratitude to the National Research and Innovation Agency (BRIN) and the Indonesia Endowment Fund for Education (LPDP) for their support through the “Riset dan Inovasi untuk Indonesia Maju–Ekspedisi (RIIM – Ekspedisi)” scheme. The author would also like to thank the Rector of Universitas Negeri Medan, who has supported and facilitated this research. This research was funded by the National Research and Innovation Agency (BRIN) and the Indonesia Endowment Fund for Education (LPDP) through the “Riset dan Inovasi untuk Indonesia Maju–Ekspedisi (RIIM – Ekspedisi)” scheme under contract numbers 21/IV/KS/03/2024; 0023/UN33.8/LL/2024.
Data Availability Statement
The research data are only available upon request to the corresponding author.
References
-
AGAMAWAN, L.P.I., HERJAYANTO, M. and KURNIADI, B., 2020. Fish species diversity in peatland drainage streams of Kubu Raya Regency, West Kalimantan. Manfish Journal, vol. 1, pp. 96-100. https://doi.org/10.31573/manfish.v1i02.158
» https://doi.org/10.31573/manfish.v1i02.158 -
ALLAN, E.A., ZHANG, W.G., LAVERY, A.C. and GOVINDARAJAN, A.F., 2021. Environmental DNA shedding and decay rates from diverse animal forms and thermal regimes. Environmental DNA, vol. 3, no. 2, pp. 492-514. https://doi.org/10.1002/edn3.141
» https://doi.org/10.1002/edn3.141 -
ANDA, M., RITUNG, S., SURYANI, E., HIKMAT, M., YATNO, E., MULYANI, A. and SUBANDIONO, R.E., 2021. Revisiting tropical peatlands in Indonesia: semi-detailed mapping, extent and depth distribution assessment. Geoderma, vol. 402, pp. 115235. https://doi.org/10.1016/j.geoderma.2021.115235
» https://doi.org/10.1016/j.geoderma.2021.115235 -
AZIS, IBRAHIM, J., IROMO, H., RACHMAWANI, D. and ACHYANI, R., 2022. Identification of Diversity and Potential of Freshwater Fish Species in the Peatlands of Sembakung North Kalimantan. IOP Conference Series: Earth and Environmental Science, vol. 1083, pp. 012092. https://doi.org/10.1088/1755-1315/1083/1/012092
» https://doi.org/10.1088/1755-1315/1083/1/012092 -
BATUBARA, A.S., ZULFAHMI, I., NUR, F.M., MAULIZAR, S., MAGHFIRIADI, F., NAFIS, B., WAHYUDEWANTORO, G., MUCHLISIN, Z.A., PRASETYA, E. and MUTIA, R., 2025. Ichthyofauna in the peat swamp waters of East Kalimantan, Indonesia. The European Zoological Journal, vol. 92, no. 1, pp. 507-517. https://doi.org/10.1080/24750263.2025.2490794
» https://doi.org/10.1080/24750263.2025.2490794 -
BERTORA, A., GROSMAN, F., SANZANO, P. and ROSSO, J.J., 2024. Impoverished fish assemblages of temperate Neotropical streams respond to environmental degradation and support a sensitive Index of Biotic Integrity. Hydrobiologia, vol. 851, no. 2, pp. 383-408. https://doi.org/10.1007/s10750-023-05211-9
» https://doi.org/10.1007/s10750-023-05211-9 - BINUR, R., 2010. Freshwater fishes composition at wetland of Kaliki, Merauke Papua. Jurnal Iktiologi Indonesia, vol. 10, pp. 165-178.
-
BREITWIESER, F.P. and SALZBERG, S.L., 2020. Pavian: interactive analysis of metagenomics data for microbiome studies and pathogen identification. Bioinformatics (Oxford, England), vol. 36, no. 4, pp. 1303-1304. https://doi.org/10.1093/bioinformatics/btz715 PMid:31553437.
» https://doi.org/10.1093/bioinformatics/btz715 - BRITZ, R., KOTTELAT, M. and HUI, T.H., 2011. Fangfangia spinicleithralis, A New Genus and Species of Miniature Cyprinid Fish From The Peat Swamp Forests of Borneo (Teleostei: cyprinidae). Ichthyological Exploration of Freshwaters, vol. 22, pp. 327.
-
CANTERA, I., DECOTTE, J.B., DEJEAN, T., MURIENNE, J., VIGOUROUX, R., VALENTINI, A. and BROSSE, S., 2022. Characterizing the spatial signal of environmental DNA in river systems using a community ecology approach. Molecular Ecology Resources, vol. 22, no. 4, pp. 1274-1283. https://doi.org/10.1111/1755-0998.13544 PMid:34724352.
» https://doi.org/10.1111/1755-0998.13544 -
ÇEVIK, T. and ÇEVIK, N., 2025. Environmental DNA (eDNA): A review of ecosystem biodiversity detection and applications. Biodiversity and Conservation, vol. 34, no. 9, pp. 2999-3035. https://doi.org/10.1007/s10531-025-03112-y
» https://doi.org/10.1007/s10531-025-03112-y -
CHAN, B., BROSSE, S., HOGAN, Z.S., NGOR, P.B. and LEK, S., 2020. Influence of local habitat and climatic factors on the distribution of fish species in the Tonle Sap Lake. Water (Basel), vol. 12, no. 3, pp. 786. https://doi.org/10.3390/w12030786
» https://doi.org/10.3390/w12030786 -
DE COSTER, W., D’HERT, S., SCHULTZ, D.T., CRUTS, M. and VAN BROECKHOVEN, C., 2018. NanoPack: visualizing and processing long-read sequencing data. Bioinformatics (Oxford, England), vol. 34, no. 15, pp. 2666-2669. https://doi.org/10.1093/bioinformatics/bty149 PMid:29547981.
» https://doi.org/10.1093/bioinformatics/bty149 -
DEAGLE, B.E., THOMAS, A.C., MCINNES, J.C., CLARKE, L.J., VESTERINEN, E.J., CLARE, E.L., KARTZINEL, T.R. and EVESON, J.P., 2019. Counting with DNA in metabarcoding studies: how should we convert sequence reads to dietary data? Molecular Ecology, vol. 28, no. 2, pp. 391-406. https://doi.org/10.1111/mec.14734 PMid:29858539.
» https://doi.org/10.1111/mec.14734 -
DEINER, K., BIK, H.M., MÄCHLER, E., SEYMOUR, M., LACOURSIÈRE-ROUSSEL, A., ALTERMATT, F., CREER, S., BISTA, I., LODGE, D.M., DE VERE, N., PFRENDER, M.E. and BERNATCHEZ, L., 2017. Environmental DNA metabarcoding: transforming how we survey animal and plant communities. Molecular Ecology, vol. 26, no. 21, pp. 5872-5895. https://doi.org/10.1111/mec.14350 PMid:28921802.
» https://doi.org/10.1111/mec.14350 -
DEWI, F.R.P., KIM, H.W., KIM, A.R., LEE, S.R., THEN, A.Y.H., ZAMRONI, M., PALIMIRMO, F.S., WAHYUNI, H.T. and AMIN, M.H.F., 2024. Exploring fish communities in the mud volcano polluted river using environmental DNA metabarcoding. Environmental Advances, vol. 16, pp. 100534. https://doi.org/10.1016/j.envadv.2024.100534
» https://doi.org/10.1016/j.envadv.2024.100534 -
DOI, H., INUI, R., AKAMATSU, Y., KANNO, K., YAMANAKA, H., TAKAHARA, T. and MINAMOTO, T., 2017. Environmental DNA analysis for estimating the abundance and biomass of stream fish. Freshwater Biology, vol. 62, no. 1, pp. 30-39. https://doi.org/10.1111/fwb.12846
» https://doi.org/10.1111/fwb.12846 -
DOMMANN, J., KERBL-KNAPP, J., ALBERTOS TORRES, D., EGLI, A., KEISER, J. and SCHNEEBERGER, P.H., 2024. A novel barcoded nanopore sequencing workflow of high-quality, full-length bacterial 16S amplicons. mSystems, vol. 9, no. 10, pp. e0085924. https://doi.org/10.1128/msystems.00859-24 PMid:39254034.
» https://doi.org/10.1128/msystems.00859-24 - FADILLA, T.A., SAPUTRA, F. and SETYAWATI, T.R., 2022. Karakter morfologi ikan famili Cyprinidae di perairan gambut Parit Nanas, Kota Pontianak. Jurnal Protobiont, vol. 11, no. 3, pp. 98-103.
- FAHMI, M., GINANJAR, R. and KUSUMAH, R.V., 2015. Keragaman ikan hias di lahan gambut Cagar Biosfer Bukit Batu, Provinsi Riau. Prosiding Seminar Nasional Masyarakat Biodiversitas Indonesia, vol. 1, no. 1, pp. 51-58.
-
GIAM, X., KOH, L.P., TAN, H.H., MIETTINEN, J., TAN, H.T. and NG, P.K., 2012. Global extinctions of freshwater fishes follow peatland conversion in Sundaland. Frontiers in Ecology and the Environment, vol. 10, no. 9, pp. 465-470. https://doi.org/10.1890/110182
» https://doi.org/10.1890/110182 -
GOLD, Z., CURD, E.E., GOODWIN, K.D., CHOI, E.S., FRABLE, B.W., THOMPSON, A.R., WALKER JUNIOR, H.J., BURTON, R.S., KACEV, D., MARTZ, L.D. and BARBER, P.H., 2021. Improving metabarcoding taxonomic assignment: a case study of fishes in a large marine ecosystem. Molecular Ecology Resources, vol. 21, no. 7, pp. 2546-2564. https://doi.org/10.1111/1755-0998.13450 PMid:34235858.
» https://doi.org/10.1111/1755-0998.13450 -
GOLDBERG, C.S., TURNER, C.R., DEINER, K., KLYMUS, K.E., THOMSEN, P.F., MURPHY, M.A., SPEAR, S.F., MCKEE, A., OJEDA, R.P., PILLIOD, D.S. and STRICKLER, K.M., 2016. Critical considerations for the application of environmental DNA methods to detect aquatic species. Methods in Ecology and Evolution, vol. 7, no. 11, pp. 1299-1307. https://doi.org/10.1111/2041-210X.12595
» https://doi.org/10.1111/2041-210X.12595 -
HABIB, K.A., NEOGI, A.K., RAHMAN, M., OH, J., LEE, Y.H. and KIM, C.G., 2021. DNA barcoding of brackish and marine water fishes and shellfishes of Sundarbans, the world's largest mangrove ecosystem. PLoS One, vol. 16, pp. e0255110. https://doi.org/10.1371/journal.pone.0255110 PMid:34339426.
» https://doi.org/10.1371/journal.pone.0255110 -
HÄNFLING, B., LAWSON HANDLEY, L., READ, D.S., HAHN, C., LI, J., NICHOLS, P., BLACKMAN, R.C., OLIVER, A. and WINFIELD, I.J., 2016. Environmental DNA metabarcoding of lake fish communities reflects long-term data from established survey methods. Molecular Ecology, vol. 25, no. 13, pp. 3101-3119. https://doi.org/10.1111/mec.13660 PMid:27095076.
» https://doi.org/10.1111/mec.13660 -
HARRISON, M.E., OTTAY, J.B., D’ARCY, L.J., CHEYNE, S.M., ANGGODO., BELCHER, C., COLE, L., DOHONG, A., ERMIASI, Y., FELDPAUSCH, T., GALLEGO-SALA, A., GUNAWAN, A., HÖING, A., HUSSON, S.J., KULU, I.P., SOEBAGIO, S.M., MANG, S., MERCADO, L., MORROGH-BERNARD, H.C., PAGE, S.E., PRIYANTO, R., RIPOLL CAPILLA, B., ROWLAND, L., SANTOS, E.M., SCHREER, V., SUDYANA, I.N., TAMAN, S.B.B., THORNTON, S.A., UPTON, C., WICH, S.A. and VAN VEEN, F.J.F., 2020. Tropical forest and peatland conservation in Indonesia: challenges and directions. People and Nature, vol. 2, no. 1, pp. 4-28. https://doi.org/10.1002/pan3.10060
» https://doi.org/10.1002/pan3.10060 - HARYONO, H., 2012. Iktiofauna perairan lahan gambut pada musim penghujan di Kalimantan Tengah. Jurnal Iktiologi Indonesia, vol. 12, pp. 83-91.
-
INOCENCIA, A., GONGGOLI, A.D., RANGIN, A.R., DENDIE, D., PUTRA, E.D., LORENSI, M., NAREYASA, W.A. and KADAFI, A.M., 2021. Inventarisasi jenis ikan air tawar di kawasan kampus Universitas Palangka Raya. Jurnal Ilmu Hayat, vol. 5, no. 1, pp. 35-42. https://doi.org/10.17977/um061v5i12021p35-42
» https://doi.org/10.17977/um061v5i12021p35-42 -
IWASAKI, W., FUKUNAGA, T., ISAGOZAWA, R., YAMADA, K., MAEDA, Y., SATOH, T.P., SADO, T., MABUCHI, K., TAKESHIMA, H., MIYA, M. and NISHIDA, M., 2013. MitoFish and MitoAnnotator: a mitochondrial genome database of fish. Molecular Biology and Evolution, vol. 30, no. 11, pp. 2531-2540. https://doi.org/10.1093/molbev/mst141 PMid:23955518.
» https://doi.org/10.1093/molbev/mst141 -
JI, F., HAN, D., YAN, L., YAN, S., ZHA, J. and SHEN, J., 2022. Assessment of benthic invertebrate diversity and river ecological status along an urbanized gradient using environmental DNA metabarcoding and a traditional survey method. The Science of the Total Environment, vol. 806, no. Pt 2, pp. 150587. https://doi.org/10.1016/j.scitotenv.2021.150587 PMid:34582852.
» https://doi.org/10.1016/j.scitotenv.2021.150587 -
KECK, F., COUTON, M. and ALTERMATT, F., 2023. Navigating the seven challenges of taxonomic reference databases. Molecular Ecology Resources, vol. 23, no. 4, pp. 742-755. https://doi.org/10.1111/1755-0998.13746 PMid:36478393.
» https://doi.org/10.1111/1755-0998.13746 -
KELEMAN, P.J., DURAND, J.D., SIMIER, M., CAMARÁ, A., SÁ, R.M. and PANFILI, J., 2025. eDNA-based seasonal monitoring reveals fish diversity patterns in mangrove habitats of Guinea-Bissau, West Africa. Regional Studies in Marine Science, vol. 82, pp. 104013. https://doi.org/10.1016/j.rsma.2025.104013
» https://doi.org/10.1016/j.rsma.2025.104013 -
KIM, D., SONG, L., BREITWIESER, F.P. and SALZBERG, S.L., 2016. Centrifuge: rapid and sensitive classification of metagenomic sequences. Genome Research, vol. 26, no. 12, pp. 1721-1729. https://doi.org/10.1101/gr.210641.116 PMid:27852649.
» https://doi.org/10.1101/gr.210641.116 -
KIRTANE, A., WIECZOREK, D., NOJI, T., BASKIN, L., OBER, C., PLOSICA, R., CHENOWETH, A., LYNCH, K. and SASSOUBRE, L.M., 2021. Quantification of environmental DNA (eDNA) shedding and decay rates for three commercially harvested fish species and comparison between eDNA detection and trawl catches. Environmental DNA, vol. 3, no. 6, pp. 1142-1155. https://doi.org/10.1002/edn3.236
» https://doi.org/10.1002/edn3.236 -
KOH, L.P., MIETTINEN, J., LIEW, S.C. and GHAZOUL, J., 2011. Remotely sensed evidence of tropical peatland conversion. Proceedings of the National Academy of Sciences of the United States of America, vol. 108, no. 12, pp. 5127-5132. https://doi.org/10.1073/pnas.1018776108 PMid:21383161.
» https://doi.org/10.1073/pnas.1018776108 -
LAWSON HANDLEY, L., READ, D.S., WINFIELD, I.J., KIMBELL, H., JOHNSON, H., LI, J., HAHN, C., BLACKMAN, R., WILCOX, R., DONNELLY, R., SZITENBERG, A. and HÄNFLING, B., 2019. Temporal and spatial variation in distribution of fish environmental DNA in England’s largest lake. Environmental DNA, vol. 1, no. 1, pp. 26-39. https://doi.org/10.1002/edn3.5
» https://doi.org/10.1002/edn3.5 -
LENG, L., AHMED, O. and JALLOH, M., 2019. Brief review on climate change and tropical peatlands. Geoscience Frontiers, vol. 10, no. 2, pp. 373-380. https://doi.org/10.1016/j.gsf.2017.12.018
» https://doi.org/10.1016/j.gsf.2017.12.018 -
LIMIN, S.H. and ERMIASI, Y., 2007. History of the development of tropical peatland in Central Kalimantan, Indonesia. Tropics, vol. 16, no. 3, pp. 291-301. https://doi.org/10.3759/tropics.16.291
» https://doi.org/10.3759/tropics.16.291 -
MARQUES, V., MILHAU, T., ALBOUY, C., DEJEAN, T., MANEL, S., MOUILLOT, D. and JUHEL, J.B., 2021. GAPeDNA: assessing and mapping global species gaps in genetic databases for eDNA metabarcoding. Diversity & Distributions, vol. 27, no. 10, pp. 1880-1892. https://doi.org/10.1111/ddi.13142
» https://doi.org/10.1111/ddi.13142 -
MCELROY, M.E., DRESSLER, T.L., TITCOMB, G.C., WILSON, E.A., DEINER, K., DUDLEY, T.L., ELIASON, E.J., EVANS, N.T., GAINES, S.D., LAFFERTY, K.D., LAMBERTI, G.A., LI, Y., LODGE, D.M., LOVE, M.S., MAHON, A.R., PFRENDER, M.E., RENSHAW, M.A., SELKOE, K.A. and JERDE, C.L., 2020. Calibrating environmental DNA metabarcoding to conventional surveys for measuring fish species richness. Frontiers in Ecology and Evolution, vol. 8, pp. 276. https://doi.org/10.3389/fevo.2020.00276
» https://doi.org/10.3389/fevo.2020.00276 -
MENDEZ-SANCHEZ, J.F. and BURGGREN, W.W., 2019. Hypoxia-induced developmental plasticity of larval growth, gill and labyrinth organ morphometrics in two anabantoid fish: the facultative air-breather Siamese fighting fish (Betta splendens) and the obligate air-breather the blue gourami (Trichopodus trichopterus). Journal of Morphology, vol. 280, no. 2, pp. 193-204. https://doi.org/10.1002/jmor.20931 PMid:30570160.
» https://doi.org/10.1002/jmor.20931 -
MENG, H., LIN, Y., ZHONG, W., ZHAO, Z., SHEN, L., LING, Z., ZHAO, K. and XU, S., 2023. Fish biomonitoring and ecological assessment in the Dianchi Lake Basin based on environmental DNA. Water (Basel), vol. 15, no. 3, pp. 399. https://doi.org/10.3390/w15030399
» https://doi.org/10.3390/w15030399 -
MITOFISH, 2026 [viewed 10 Jan 2026]. MitoFish: Mitochondrial Genome Database of Fish [online]. Available from: http://mitofish.aori.u-tokyo.ac.jp/
» http://mitofish.aori.u-tokyo.ac.jp/ -
MIYA, M., SATO, Y., FUKUNAGA, T., SADO, T., POULSEN, J., SATO, K., MINAMOTO, T., YAMAMOTO, S., YAMANAKA, H., ARAKI, H., KONDOH, M. and IWASAKI, W., 2015. MiFish, a set of universal PCR primers for metabarcoding environmental DNA from fishes. Royal Society Open Science, vol. 2, no. 7, pp. 150088. https://doi.org/10.1098/rsos.150088 PMid:26587265.
» https://doi.org/10.1098/rsos.150088 -
MUCHLISIN, Z.A., AKYUN, Q., HALIM, A., RIZKA, S., SUGIANTO, S., FADLI, N. and SITI-AZIZAH, M., 2015. Ichthyofauna of Tripa peat swamp forest, Aceh Province, Indonesia. Check List, vol. 11, no. 2, pp. 1-9. https://doi.org/10.15560/11.2.1560
» https://doi.org/10.15560/11.2.1560 -
NAGARAJAN, R.P., BEDWELL, M., HOLMES, A.E., SANCHES, T., ACUÑA, S., BAERWALD, M., BARNES, M.A., BLANKENSHIP, S., CONNON, R.E., DEINER, K., GILLE, D., GOLDBERG, C.S., HUNTER, M.E., JERDE, C.L., LUIKART, G., MEYER, R.S., WATTS, A. and SCHREIER, A., 2022. Environmental DNA methods for ecological monitoring and biodiversity assessment in estuaries. Estuaries and Coasts, vol. 45, no. 7, pp. 2254-2273. https://doi.org/10.1007/s12237-022-01080-y
» https://doi.org/10.1007/s12237-022-01080-y - NASH, K.L., ATMINARSO, D., BLYTHE, J., CHADIJAH, A., ASTUTI, S.S., UTOMO, A.D., PRATAMA, B.B., SUMARTO, K.A.S., MUHAMAD, G., SURBANI, I.L. and WIBOWO, A., 2025. The sleeping giant of kalimantan: a review of fish and fisheries of the Peatlands. Reviews in Fisheries Science & Aquaculture, vol. 34, no. 2, pp. 258-293. https://doi.org/10.1080/23308249.2025.2543806.
- NURDAWATI, S., ASYARI, H. and PRIANTO, E., 2007. Fauna ikan di perairan danau rawa gambut di Barito Selatan, Kalimantan Tengah. Jurnal Iktiologi Indonesia, vol. 7, pp. 89-97.
-
NYGAARD, A.B., TUNSJØ, H.S., MEISAL, R. and CHARNOCK, C., 2020. A preliminary study on the potential of Nanopore MinION and Illumina MiSeq 16S rRNA gene sequencing to characterize building-dust microbiomes. Scientific Reports, vol. 10, pp. 3209. https://doi.org/10.1038/s41598-020-59771-0 PMid:32081924.
» https://doi.org/10.1038/s41598-020-59771-0 -
PAADA, M.Y., KADARINI, T., GINANJAR, R., JOHAN, O., ZAMRONI, M., ZUHRIYAH, S. and ARDI, I., 2022. Keragaman jenis ikan hias dan kondisi perairan di KHG Sungai Mempawah–Sungai Duri. Jurnal Riset Akuakultur, vol. 16, pp. 245-253. https://doi.org/10.15578/jra.16.4.2021.245-253
» https://doi.org/10.15578/jra.16.4.2021.245-253 -
PAVIAN, 2026 [viewed 13 Jan 2026]. Pavian: Interactive Analysis of Metagenomics Data Available from: https://github.com/fbreitwieser/pavian
» https://github.com/fbreitwieser/pavian -
POSIT TEAM, 2025 [viewed 13 Jan 2026]. RStudio: Integrated Development Environment for R [software]. Boston: Posit Software, PBC. Available from: http://www.posit.co/
» http://www.posit.co/ -
PURNAMAYANI, R., TARIGAN, S.D., SUDRADJAT, S., SYAHBUDDIN, H., DARIAH, A. and KARTIWA, B., 2025. How do groundwater levels and soil moisture influence the peat fire vulnerability index in oil palm plantations? Journal of Tropical Crop Science, vol. 12, no. 1, pp. 235-245. https://doi.org/10.29244/jtcs.12.01.235-245
» https://doi.org/10.29244/jtcs.12.01.235-245 -
QUINTANA, Y., KEPPELER, F.W. and WINEMILLER, K.O., 2023. Does invasion by armored catfish shift trophic ecology of native fishes? Evidence from stable isotope analysis. Ecology, vol. 104, no. 5, pp. e4024. https://doi.org/10.1002/ecy.4024 PMid:36883720.
» https://doi.org/10.1002/ecy.4024 -
RAMÍREZ-AMARO, S., BASSITTA, M., PICORNELL, A., RAMON, C. and TERRASA, B., 2022. Environmental DNA applications for fisheries assessment in marine environments. Frontiers in Marine Science, vol. 9, pp. 1004674. https://doi.org/10.3389/fmars.2022.1004674
» https://doi.org/10.3389/fmars.2022.1004674 - RAZI, N.M., NASIR, M., KHALIDIN, K., SAVIRA, D., NAJMI, I., MAHFUD, M., DERMAWAN, F., FADLI, N. and MUCHLISIN, Z.A., 2023. Diversity, distribution, biomass, and conservation status of ichthyofauna of the Singkil peat swamp. Biodiversitas (Surakarta), vol. 24, no. 12, pp. 6661-6674.
-
RENSHAW, M.A., OLDS, B.P., JERDE, C.L., MCVEIGH, M.M. and LODGE, D.M., 2015. The room temperature preservation of filtered environmental DNA samples and assimilation into a phenol–chloroform–isoamyl alcohol DNA extraction. Molecular Ecology Resources, vol. 15, no. 1, pp. 168-176. https://doi.org/10.1111/1755-0998.12281 PMid:24834966.
» https://doi.org/10.1111/1755-0998.12281 -
RICHARDS, J.L., SHENG, V., CHUNG, H.W.Y., LIU, M., TSANG, R.H.H., MCILROY, S.E. and BAKER, D., 2022. Development of an eDNA-based survey method for urban fish markets. Methods in Ecology and Evolution, vol. 13, no. 7, pp. 1568-1580. https://doi.org/10.1111/2041-210X.13842
» https://doi.org/10.1111/2041-210X.13842 -
SANTOSO, E. and WAHYUDEWANTORO, G., 2019. Biodiversity of fish species of Arut–Kumai peat waters, Central Kalimantan. Jurnal Iktiologi Indonesia, vol. 19, pp. 315-335. https://doi.org/10.32491/jii.v19i2.497
» https://doi.org/10.32491/jii.v19i2.497 -
SATO, Y., MIYA, M., FUKUNAGA, T., SADO, T. and IWASAKI, W., 2018. MitoFish and MiFish Pipeline: a mitochondrial genome database of fish with an analysis pipeline for environmental DNA metabarcoding. Molecular Biology and Evolution, vol. 35, pp. 1553-1555. https://doi.org/10.1093/molbev/msy074 PMid:29668970.
» https://doi.org/10.1093/molbev/msy074 - SULE, H., ISMAIL, A. and AMAL, M., 2016. A review of the ichthyofauna of Malaysian peat swamp forest. Pertanika. Journal of Tropical Agricultural Science, vol. 39, no. 4, pp. 421-458.
-
SUYATNA, I., SUKARTI, K., PAGORAY, H., KESUMA, A.D., BUTARBUTAR, T., RAAFI, M. and SUYATNA, M.B.B., 2021. Fish fauna of peatland waters in the middle Mahakam. E3S Web of Conferences, vol. 322, pp. 01018. https://doi.org/10.1051/e3sconf/202132201018
» https://doi.org/10.1051/e3sconf/202132201018 -
TAKAHASHI, M., SACCÒ, M., KESTEL, J.H., NESTER, G., CAMPBELL, M.A., VAN DER HEYDE, M., HEYDENRYCH, M.J., JUSZKIEWICZ, D.J., NEVILL, P., DAWKINS, K.L., BESSEY, C., FERNANDES, K., MILLER, H., POWER, M., MOUSAVI-DERAZMAHALLEH, M., NEWTON, J.P., WHITE, N.E., RICHARDS, Z.T. and ALLENTOFT, M.E., 2023. Aquatic environmental DNA: a review of the macro-organismal biomonitoring revolution. The Science of the Total Environment, vol. 873, pp. 162322. https://doi.org/10.1016/j.scitotenv.2023.162322 PMid:36801404.
» https://doi.org/10.1016/j.scitotenv.2023.162322 -
TAO, W., YANG, L., MAYDEN, R.L. and HE, S., 2019. Phylogenetic relationships of Cypriniformes and plasticity of pharyngeal teeth in the adaptive radiation of cyprinids. Science China. Life Sciences, vol. 62, no. 4, pp. 553-565. https://doi.org/10.1007/s11427-019-9480-3 PMid:30929194.
» https://doi.org/10.1007/s11427-019-9480-3 -
THORNTON, S., PAGE, S., UPTON, C. and HARRISON, M., 2018. Peatland fish of Sebangau, Borneo: diversity, monitoring and conservation. Mires and Peat, vol. 22, pp. 1-25. https://doi.org/10.19189/MAP.2017.OMB.313
» https://doi.org/10.19189/MAP.2017.OMB.313 -
TURNER, C.R., BARNES, M.A., XU, C.C.Y., JONES, S.E., JERDE, C.L. and LODGE, D.M., 2014. Particle size distribution and optimal capture of aqueous macrobial environmental DNA. Methods in Ecology and Evolution, vol. 5, no. 7, pp. 676-684. https://doi.org/10.1111/2041-210X.12206
» https://doi.org/10.1111/2041-210X.12206 -
VALENTINI, A., TABERLET, P., MIAUD, C., CIVADE, R., HERDER, J., THOMSEN, P.F., BELLEMAIN, E., BESNARD, A., COISSAC, E., BOYER, F., GABORIAUD, C., JEAN, P., POULET, N., ROSET, N., COPP, G.H., GENIEZ, P., PONT, D., ARGILLIER, C., BAUDOIN, J.M., PEROUX, T., CRIVELLI, A.J., OLIVIER, A., ACQUEBERGE, M., LE BRUN, M., MØLLER, P.R., WILLERSLEV, E. and DEJEAN, T., 2016. Next-generation monitoring of aquatic biodiversity using eDNA metabarcoding. Molecular Ecology, vol. 25, no. 4, pp. 929-942. https://doi.org/10.1111/mec.13428 PMid:26479867.
» https://doi.org/10.1111/mec.13428 - WAHYUDEWANTORO, G., 2010. Kajian potensi ikan di lahan gambut Tasik Betung, Riau. Bionatura, vol. 12, no. 2, pp. 57-62.
-
WARREN, M., HERGOUALC’H, K., KAUFFMAN, J.B., MURDIYARSO, D. and KOLKA, R., 2017. Appraisal of Indonesia’s peat carbon stock using national peatland maps. Carbon Balance and Management, vol. 12, pp. 12. https://doi.org/10.1186/s13021-017-0080-2 PMid:28527145.
» https://doi.org/10.1186/s13021-017-0080-2 -
WEE, A.K., SALMO 3RD, S.G., SIVAKUMAR, K., THEN, A.Y.H., BASYUNI, M., FALL, J., HABIB, K.A., ISOWA, Y., LEOPARDAS, V. and PEER, N., 2023. Prospects and challenges of environmental DNA metabarcoding in mangrove restoration. Frontiers in Marine Science, vol. 10, pp. 1033258. https://doi.org/10.3389/fmars.2023.1033258
» https://doi.org/10.3389/fmars.2023.1033258 -
WICK, R.R., JUDD, L.M. and HOLT, K.E., 2019. Performance of neural network basecalling tools for Oxford Nanopore sequencing. Genome Biology, vol. 20, no. 1, pp. 129. https://doi.org/10.1186/s13059-019-1727-y PMid:31234903.
» https://doi.org/10.1186/s13059-019-1727-y -
WILSON, R.M., HOPPLE, A.M., TFAILY, M.M, SEBESTYEN, S.D., SCHADT, C.W., PFEIFER-MEISTER, L., MEDVEDEFF, C., MCFARLANE, K.J., KOSTKA, J.E., KOLTON, M., KOLKA, R.K., KLUBER, L.A., KELLER, J.K., GUILDERSON, T.P., GRIFFITHS, N.A., CHANTON, J.P., BRIDGHAM, S.D. and HANSON, P.J., 2016. Stability of peatland carbon to rising temperatures. Nature Communications, vol. 7, no. 1, pp. 13723. https://doi.org/10.1038/ncomms13723 PMid:27958276.
» https://doi.org/10.1038/ncomms13723 -
XU, C., CAI, J., ZHUANG, Z., MA, C., LIU, Y., XIE, S. and SHEN, C., 2024. Investigation of fish diversity in the Xiamen Sea using environmental DNA technology. Marine Biodiversity, vol. 54, no. 4, pp. 54. https://doi.org/10.1007/s12526-024-01447-3
» https://doi.org/10.1007/s12526-024-01447-3 -
YAMANAKA, H. and MINAMOTO, T., 2016. Environmental DNA as an efficient method of determining habitat connectivity. Ecological Indicators, vol. 62, pp. 147-153. https://doi.org/10.1016/j.ecolind.2015.11.022
» https://doi.org/10.1016/j.ecolind.2015.11.022 -
YAMANAKA, H., MINAMOTO, T., MATSUDA, J., DEGUCHI, S., KISHI, D., TAMAKI, H., SUGIURA, S. and BABA, M., 2017. A simple method for preserving environmental DNA in water samples at ambient temperature by addition of cationic surfactant. Limnology, vol. 18, no. 2, pp. 233-241. https://doi.org/10.1007/s10201-016-0508-5
» https://doi.org/10.1007/s10201-016-0508-5 -
ZHANG, M., ZOU, Y., XIAO, S. and HOU, J., 2023. Environmental DNA metabarcoding serves as a promising method for aquatic species monitoring and management: a review focused on its workflow, applications, challenges and prospects. Marine Pollution Bulletin, vol. 194, pp. 115430. https://doi.org/10.1016/j.marpolbul.2023.115430 PMid:37647798.
» https://doi.org/10.1016/j.marpolbul.2023.115430
Edited by
-
Editor:
Takako Matsumura Tundisi