Abstract
The aim of the present study was to compare heart rate variability (HRV) at rest and during exercise using a temporal series obtained with the Polar S810i monitor and a signal from a LYNX® signal conditioner (BIO EMG 1000 model) with a channel configured for the acquisition of ECG signals. Fifteen healthy subjects aged 20.9 ± 1.4 years were analyzed. The subjects remained at rest for 20 min and performed exercise for another 20 min with the workload selected to achieve 60% of submaximal heart rate. RR series were obtained for each individual with a Polar S810i instrument and with an ECG analyzed with a biological signal conditioner. The HRV indices (rMSSD, pNN50, LFnu, HFnu, and LF/HF) were calculated after signal processing and analysis. The unpaired Student t-test and intraclass correlation coefficient were used for data analysis. No statistically significant differences were observed when comparing the values analyzed by means of the two devices for HRV at rest and during exercise. The intraclass correlation coefficient demonstrated satisfactory correlation between the values obtained by the devices at rest (pNN50 = 0.994; rMSSD = 0.995; LFnu = 0.978; HFnu = 0.978; LF/HF = 0.982) and during exercise (pNN50 = 0.869; rMSSD = 0.929; LFnu = 0.973; HFnu = 0.973; LF/HF = 0.942). The calculation of HRV values by means of temporal series obtained from the Polar S810i instrument appears to be as reliable as those obtained by processing the ECG signal captured with a signal conditioner.
Heart rate variability; Autonomic nervous system; Exercise; Spectral analysis; ECG; Polar S810i monitor
Braz J Med Biol Res, October 2008, Volume 41(10) 854-859
Comparison of the Polar S810i monitor and the ECG for the analysis of heart rate variability in the time and frequency domains

 L.C.M. Vanderlei1, R.A. Silva2, C.M. Pastre1, F.M. Azevedo3 and M.F. Godoy4
1Departamento de Fisioterapia, 2Curso de Especialização em Fisioterapia, 3Laboratório de Fisioterapia Aplicada ao Movimento Humano, Faculdade de Ciências e Tecnologia, Universidade Estadual Paulista, Presidente Prudente, SP, Brasil
4Departamento de Cardiologia e Cirurgia Cardiovascular, Faculdade de Medicina de São José do Rio Preto, São José do Rio Preto, SP, Brasil
 References
Correspondence and Footnotes
References
Correspondence and Footnotes
Abstract
The aim of the present study was to compare heart rate variability (HRV) at rest and during exercise using a temporal series obtained with the Polar S810i monitor and a signal from a LYNX® signal conditioner (BIO EMG 1000 model) with a channel configured for the acquisition of ECG signals. Fifteen healthy subjects aged 20.9 ± 1.4 years were analyzed. The subjects remained at rest for 20 min and performed exercise for another 20 min with the workload selected to achieve 60% of submaximal heart rate. RR series were obtained for each individual with a Polar S810i instrument and with an ECG analyzed with a biological signal conditioner. The HRV indices (rMSSD, pNN50, LFnu, HFnu, and LF/HF) were calculated after signal processing and analysis. The unpaired Student t-test and intraclass correlation coefficient were used for data analysis. No statistically significant differences were observed when comparing the values analyzed by means of the two devices for HRV at rest and during exercise. The intraclass correlation coefficient demonstrated satisfactory correlation between the values obtained by the devices at rest (pNN50 = 0.994; rMSSD = 0.995; LFnu = 0.978; HFnu = 0.978; LF/HF = 0.982) and during exercise (pNN50 = 0.869; rMSSD = 0.929; LFnu = 0.973; HFnu = 0.973; LF/HF = 0.942). The calculation of HRV values by means of temporal series obtained from the Polar S810i instrument appears to be as reliable as those obtained by processing the ECG signal captured with a signal conditioner.
Key words: Heart rate variability; Autonomic nervous system; Exercise; Spectral analysis; ECG; Polar S810i monitor
Introduction
Heart rate variability (HRV) analysis has proven to be a simple, noninvasive technique capable of assessing autonomic heart rate (HR) modulation by means of the instantaneous measurement of variations in the beat-to-beat RR intervals. It is a simple, easy manner to explore sympathovagal interactions in different individuals and under different conditions (1). A number of disorders can be identified by HRV analysis. A low HRV reflects an unfavorable prognosis for cardiovascular diseases, diabetic neuropathies, arterial hypertension, acute myocardial infarction, and other heart problems (2-4). HRV can also be used to analyze modulations in the autonomic nervous system under diverse physiological conditions, such as physical exercise (5,6).
HRV can be evaluated by means of either linear or non-linear methods. Non-linear methods are based on the chaos theory (phenomena that are highly irregular, but not by chance) (7), whereas there are two basic types of linear methods: time domain analysis and frequency domain analysis (8). HRV analysis has been performed by measuring intervals between heartbeats, which are easily observed as RR intervals. Thus, HRV can be determined directly from an ECG signal, which is obtained by means of external sensors placed on specific points of the body (9).
In order to facilitate HRV analysis, a wide variety of equipment and software programs have been developed, such as PowerLab (ADInstruments, Australia) (3) and the Reynolds Pathfinder program (Reynolds Medical Limited, United Kingdom) (10), which measure HRV by means of an ECG signal. However, they present disadvantages such as difficulty of access and high cost. The Polar S810i rate meter (Polar Electro, Finland) is a practical device that is less expensive than others and has been used to monitor the beat-to-beat HR for HRV analysis. This device captures RR intervals by means of electrodes attached to an elastic band placed around the thorax. Electronic signals are continuously transmitted and stored in a receiver via an electromagnetic field for later analysis and calculation of HRV values.
There are few data in the literature addressing the question of the efficiency of the Polar S810 monitor for capturing beat-to-beat HR and for the determination of HRV values. Thus, because of the significantly lower cost, the objective of the present study was to compare HRV using temporal series obtained with the Polar S810i device from subjects at rest and during exercise with those obtained from a LYNX® signal conditioner (BIO EMG 1000, Lynx Tecnologia Electrônica Ltda., Brazil) with a channel configured for the acquisition of ECG signals.
Subjects and Methods
Subjects
The data for 15 young adult males with an average age of 20.9 ± 1.4 years were analyzed. Average weight, height, and body mass index were 77.2 ± 10.9 kg, 178.3 ± 6.1 cm, and 24.3 ± 3.1 kg/m2, respectively. The exclusion criteria included smoking, alcoholism and the use of narcotics or medications that influence the autonomic activity of the heart, as well as cardiovascular, endocrine or metabolic diseases. Volunteers were duly informed as to the procedures and objectives of the study and signed an informed consent form to participate. The study was approved by the Research Ethics Committee of the School of Science and Technology FCT/UNESP, Presidente Prudente Campus, Universidade Estadual Paulista, process #100/2006.
Experimental procedures
In order to establish the workload that would be used during the exercise procedures of the experimental protocol, subjects were submitted to a submaximal effort test on an ergometric bicycle using a step protocol, with an increment of 25 W every 3 min. The protocol of submaximal effort was interrupted as soon as the pre-established HR value was reached, according to the equation: submaximal HR = 195 - age. During the submaximal effort protocol, HR was continuously monitored and the bicycle workload able to promote individual heartbeat elevation up to 60% of submaximal HR (195 _ age x 0.6) was used for the exercise procedure.
The experimental protocol was conducted at a room temperature of 22 to 24°C and relative humidity of 50 to 60%. Subjects were initially told to be seated for the installation of the Polar S810i rate meter (Polar Electro, Finland) and simultaneous attachment of the LYNX® signal conditioner (BIO EMG 1000) with a channel configured for the acquisition of ECG signals. The electrodes were placed on the manubrium and in the region of the fifth left intercostal space (CM5 lead). The neutral electrode was placed on the right arm.
Subjects were told to recline in the face-up position on a cot and to rest with spontaneous breathing for 20 min. They were then asked to mount an ergometric bicycle on which they performed the exercise with the pre-established intensity for 20 min. During all experimental procedure, RR intervals were simultaneously recorded from both devices. We used manual start and to eliminate possible synchronization errors of the equipment, the Polar S810i was turned on first and the ECG was turned on 1 min later. This initial time in the polar recording was not considered for data analysis.
Subjects were instructed not to ingest alcoholic beverages and/or stimulants such as coffee or tea for at least 12 h before participating in the experimental protocol. They were also instructed to eat a light meal at least 2 h before the test. To minimize the anxiety of the volunteers, three people at most were present in the room during the procedures. A minimum interval of 48 h was observed between the determination of submaximal effort and the experimental protocol.
Instrumentation and data treatment
For the acquisition of the ECG signal, 3M® brand Meditrace® (Tyco Healthcare, United Kingdom) surface electrodes were used, with 10-mm diameter AgCl capturing surfaces. Signals were captured by means of a BIO EMG 1000 signal conditioner (LYNX®), on which a biopotential channel was configured to capture ECG signals, with a 100-Hz low-pass Butterworth digital filter, a 2000-Hz sampling frequency and a 1000-fold gain. The ECG signals were acquired and stored in data files by means of the Bioinspector 1.8 software (also from LYNX®), whereas the data obtained by the Polar S810i, with a sampling rate of 1000 Hz, were transferred to the computer by means of an interface with an infrared device for signal emission. The HR and ECG signals were processed for the calculation of the HRV values using a specific software program designed in the MATLAB® (The Math Works, USA)environment, which calculates HRV values based on the RR intervals obtained from the two devices.
For these calculations, in each temporal series obtained from the two devices we used a 5-min interval during the period when subjects presented greater signal stability. Only series with more than 256 RR intervals were used for analysis (1). Visual inspection of temporal series in the computer monitor showed absence of artifacts or cardiac arrhythmias that could interfere with the HRV analysis. In addition, we corrected the temporal series before periods of longer stability selection: the signal containing RR intervals was submitted to an algorithm in order to clean characteristic noise. In the algorithm, the signal was processed according to the following steps: i) the genuine signal was deducted from the average; ii) the average value from windows containing 50 signal samples was calculated; iii) these windows were analyzed independently in order to locate samples whose values achieved more than twice the mean value calculated for 50 selected signals; iv) localized signals were substituted by a value obtained from the calculus of the arithmetic mean of two previous and two later signal samples characterized as noise.
HRV analysis was performed in the time and frequency domains using the following indices: 1) Time domain: in this domain, the rMSSD (root mean square successive difference between the RR intervals) and pNN50 (percentage of successive differences in the RR interval of which the absolute value exceeds 50 ms) were used. 2) Frequency domain: in this domain, low frequency power in normalized units (LFnu, 0.04-0.15 Hz), high frequency power in normalized units (HFnu, 0.15-0.4 Hz), and LF/HF (ratio of absolute LF power to HF power) were used. The spectral analysis was calculated using the fast Fourier transform algorithm.
The Student t-test for unpaired data was employed at the 5% level of significance for the comparison of the values obtained with the two devices. Correlations between values were analyzed by the intraclass correlation coefficient and values of P < 0.05 were considered to be significant.
Results
Tables 1 and 2 present the average values obtained with the two devices for subjects at rest and during exercise, respectively. Data were measured simultaneously on the same subject by the ECG and Polar device. Fifteen subjects both at rest and during exercise were studied.
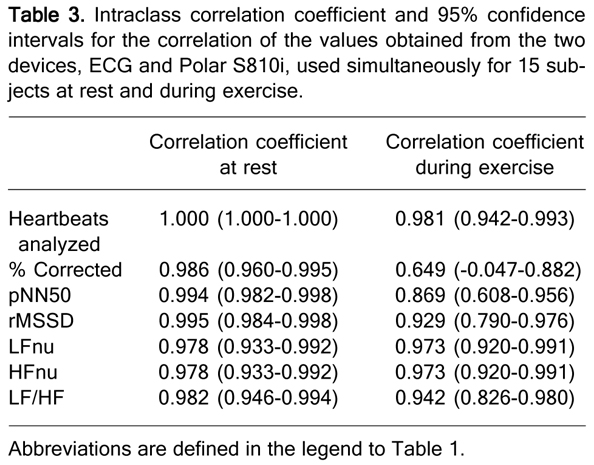
There were no statistically significant differences (P > 0.05) in the number of heartbeats analyzed, the percentage of corrected heartbeats and the indices analyzed with regard to either the time or frequency domain between the two devices used at rest or during exercise. Significant differences were observed, however, in the comparison of the variables at rest and the corresponding variables during exercise (P < 0.05, Student t-test for unpaired data) for two devices. The intraclass correlation coefficient revealed a strong association between the number of heartbeats analyzed, percentage of corrected heartbeats, pNN50, rMSSD, LFnu, HFnu, and LF/HF ratio obtained by means of the ECG and Polar devices both at rest and during exercise (Table 3).
Dispersion diagram of rMSSD and HFnu values at rest and exercise, respectively, in both devices are shown in Figures 1 and 2.
Dispersion diagram of rMSSD and HFnu values for 15 subjects at rest using both devices, ECG and Polar S810i, simultaneously. rMSSD = root mean square successive difference between the RR intervals; HFnu = high frequency power in normalized units.
Dispersion diagram of rMSSD and HFnu values for 15 subjects during exercise using both devices, ECG and Polar S810i, simultaneously. rMSSD = root mean square successive difference between the RR intervals; HFnu = high frequency power in normalized units.
Comparison of data obtained from the ECG and Polar S810i used simultaneously for 15 subjects at rest.
Comparison of data obtained from the ECG and Polar S810i used simultaneously for 15 subjects during exercise.
Intraclass correlation coefficient and 95% confidence intervals for the correlation of the values obtained from the two devices, ECG and Polar S810i, used simultaneously for 15 subjects at rest and during exercise.
Discussion
Heart monitors, such as the Polar S810i, have been used for the measurement of HR and subsequent HRV analysis. The findings of the present study indicate that the Polar S810i rate meter is able to provide consistent RR series that could be used for HRV analysis during rest and exercise. In the time domain, no statistically significant differences were found for pNN50 or rMSSD when comparing the values obtained simultaneously on the same subject with the ECG and Polar S810i devices during the periods of rest. Similar results were observed by Gamelin et al. (11) when comparing HRV indices obtained with the Polar S810 device and the ECG (Physiotrace Estaris, France) in the reclining position during an orthostatic test. With the exception of rMSSD in the standing position, these investigators (11) found no statistically significant differences in the time domain indices obtained with the two devices. They also reported a strong correlation for pNN50 and rMSSD in the reclining position when the values obtained with the ECG and the Polar S810 device were compared. These correlations were also observed in the present study (pNN50: P < 0.0001; R = 0.994; rMSSD: P < 0.0001; R = 0.995) during rest.
During exercise, there were no significant differences between pNN50 and rMSSD when the values obtained by ECG and Polar S810i were compared; moreover, a good correlation between these variables was observed (pNN50: P < 0.0001; R = 0.869; rMSSD: P < 0.0001; R = 0.929). We are not aware of research that quantified HRV indexes in the time domain during exercise using the RR series obtained from different devices. These indexes reflect the short-term variability of the signal (1), and are therefore more sensitive for the detection of variations in the duration of RR intervals between the devices.
In the present study, the LFnu, HFnu and LF/HF ratio also exhibited no significant differences and strong correlation during rest (LFnu: P < 0.0001; R = 0.978; HFnu: P < 0.0001; R = 0.978; LF/HF: P < 0.0001; R = 0.982) and exercise (LFnu: P < 0.0001; R = 0.973; HFnu: P < 0.0001; R = 0.973; LF/HF: P < 0.0001; R = 0.942) between the values obtained from the ECG machine and those from the Polar S810i device. Gamelin et al. (11) also found no differences in these values and strong correlation in the reclining position during an orthostatic test.
In contrast with this study, which obtained RR series at rest and during exercise with individuals in a period of signal stability, Kingsley et al. (10) compared intervals obtained during an incremental test on a cycle ergometer with an initial load of 60 W and an increase of 30 W every 2 min until voluntary fatigue with individuals in an unstable condition, using a recorder system and clinical analysis of ECG (Reynolds Pathfinder, UK) and a heart rate monitor (Polar S810). A good correlation between RR intervals obtained with both devices was observed. LF and HF values were similar between the devices during low intensity exercise (40% VO2max), but not at intensities above 60% VO2max for the HF index, and above 80% VO2max for the LF index.
Validity of the Polar S810 to measure RR intervals and perform the subsequent HRV analysis for children in the supine position was also described by Gamelin et al. (12). HRV parameters derived from the Polar S810 device and an ECG did not differ and were well correlated, as also observed in the present study.
Moreover, no statistically significant differences were found between the two devices when considering the number of RR intervals with the subjects at rest or during exercise. The percentage of errors was also analyzed and no statistically significant difference was found between the Polar S810i device and the ECG at rest or during exercise. This finding is also similar to that obtained by Gamelin et al. (11) at rest, who found only a 0.4% rate error for the Polar S810 compared with the ECG.
In the present study, statistically significant differences were found for both devices when comparing the HRV values obtained with subjects at rest and those obtained during exercise, with lower values for the latter. Other investigators have also reported changes in HRV values during exercise (13,14). The adjustments related to HR that occur during exercise are predominantly regulated by the autonomic nervous system. During physical activity, increased HR is induced by the increase in sympathetic activity and the reduction in vagal activity (14,15). This autonomic behavior was found in the HRV analysis of the present study, with a reduction in the values that reflect vagal activity (pNN50, rMSSD and HFnu) being observed during exercise in comparison to the values obtained with subjects at rest. During exercise there was also an increase in the LFnu index and LF/HF ratio, which represent the sympathetic activity and sympathovagal balance, respectively.
One of the limitations of the present study is related to the synchronization between the ECG and Polar S810i devices. As previously mentioned, to eliminate possible synchronization errors of the equipment, the Polar S810i device was turned on first and the ECG was turned on 1 min later. Even with this procedure, however, an average delay of 3 s was observed for the Polar S810i device in relation to the ECG machine at the end of each step of the experimental protocol. This difference could be related to the fact that the detection of RR intervals in the ECG is processed off-line. The basis for automatic detection of these intervals requires a comparison between groups of samples. When this procedure is established, the initial and final values become lost. Thus, there are no data to compare before and at the end of the signal.
This process of analysis may have been responsible for the minimal differences observed between the values obtained with the two devices. However, in no case were these differences statistically significant, suggesting that there was no influence on the results. As data collection from the two machines was performed simultaneously, the location of the elastic band of the Polar S810i device near the ECG electrodes may also have generated interference at some point, causing errors in signal capture, which could explain the slight differences in the values.
The absence of significant differences between the values calculated by the two instruments and the high correlation between the instruments suggest that the Polar S810i device, which offers the advantages of lower cost and greater practicality with regard to application and access, is able to generate RR series at rest and during exercise that could be used for HRV analysis in both the time and frequency domains as reliably as measurements performed by means of an ECG signal. This demonstrates the good prospects of its use by health care professional for the assessment of HR and HRV analysis.
On the basis of the results of the present study, we suggest that the calculation of HRV values in the time and frequency domains by RR series obtained from the Polar S810i rate meter is probably as reliable as those obtained by ECG signal processing captured with a signal conditioner.
Address for correspondence: L.C.M. Vanderlei, Departamento de Fisioterapia, FCT/UNESP, Rua Roberto Simonsen, 305, Cidade Universitária, 19060-900 Presidente Prudente, SP, Brasil. Fax: +55-18-3229-5365. E-mail: vanderle@fct.unesp.br
Publication supported by Fundunesp (#00931/08-DFP). Received September 10, 2007. Accepted September 3, 2008.
References
- 1. Heart rate variability: standards of measurement, physiological interpretation and clinical use. Task Force of the European Society of Cardiology and the North American Society of Pacing and Electrophysiology. Circulation 1996; 93: 1043-1065.
- 2. Gutin B, Howe C, Johnson MH, Humphries MC, Snieder H, Barbeau P. Heart rate variability in adolescents: relations to physical activity, fitness, and adiposity. Med Sci Sports Exerc 2005; 37: 1856-1863.
- 3. Radespiel-Troger M, Rauh R, Mahlke C, Gottschalk T, Muck-Weymann M. Agreement of two different methods for measurement of heart rate variability. Clin Auton Res 2003; 13: 99-102.
- 4. Stauss HM. Heart rate variability. Am J Physiol Regul Integr Comp Physiol 2003; 285: R927-R931.
- 5. Casties JF, Mottet D, Le Gallais D. Non-linear analyses of heart rate variability during heavy exercise and recovery in cyclists. Int J Sports Med 2006; 27: 780-785.
- 6. Rezk CC, Marrache RC, Tinucci T, Mion D Jr, Forjaz CL. Post-resistance exercise hypotension, hemodynamics, and heart rate variability: influence of exercise intensity. Eur J Appl Physiol 2006; 98: 105-112.
- 7. Makikallio TH, Tapanainen JM, Tulppo MP, Huikuri HV. Clinical applicability of heart rate variability analysis by methods based on nonlinear dynamics. Card Electrophysiol Rev 2002; 6: 250-255.
- 8. Thuraisingham RA. Preprocessing RR interval time series for heart rate variability analysis and estimates of standard deviation of RR intervals. Comput Methods Programs Biomed 2006; 83: 78-82.
- 9. Sacha J, Pluta W. Different methods of heart rate variability analysis reveal different correlations of heart rate variability spectrum with average heart rate. J Electrocardiol 2005; 38: 47-53.
- 10. Kingsley M, Lewis MJ, Marson RE. Comparison of Polar 810s and an ambulatory ECG system for RR interval measurement during progressive exercise. Int J Sports Med 2005; 26: 39-44.
- 11. Gamelin FX, Berthoin S, Bosquet L. Validity of the polar S810 heart rate monitor to measure R-R intervals at rest. Med Sci Sports Exerc 2006; 38: 887-893.
- 12. Gamelin FX, Baquet G, Berthoin S, Bosquet L. Validity of the polar S810 to measure R-R intervals in children. Int J Sports Med 2008; 29: 134-138.
- 13. Achten J, Jeukendrup AE. Heart rate monitoring: applications and limitations. Sports Med 2003; 33: 517-538.
- 14. Aubert AE, Seps B, Beckers F. Heart rate variability in athletes. Sports Med 2003; 33: 889-919.
- 15. Bernardi L, Piepoli MF. Autonomic nervous system adaptation during physical exercise. Ital Heart J Suppl 2001; 2: 831-839.